Unit R003. Handling data using spreadsheets
|
|
|
- Erika Willis
- 10 years ago
- Views:
Transcription
1 Unit R003 Handling data using spreadsheets Unit R003 Handling data using spreadsheets 1 OCR 2012

2 2 2.4 Unit R003: Handling data using spreadsheets Aims This unit builds on Units R001 and R002 and learners will be able to apply the skills, knowledge and understanding developed in those units and vice versa. This unit will help the learner to process and present data into meaningful information that can be used to support the decision-making process in real life scenarios. The learning is important because spreadsheets are used extensively in businesses for a variety of purposes such as budgeting, cost modelling, reporting, trend analysis and forecasting. Spreadsheets are very effective at performing automatic calculations e.g. for displaying information to highlight relationships, for predicting outcomes by changing data, for numerical analyses and to create informative graphs and charts. In a school environment teachers use spreadsheets to monitor and analyse learners performance. Learners will create a spreadsheet to provide a solution to a given scenario which will provide the facility for the user to create and manipulate data and to produce graphs and/or charts to support decision making. On completion of this unit learners will be able to interpret requirements for a spreadsheet, take unstructured data, plan how to use it in a spreadsheet, create and populate a spreadsheet, use relevant functions and tools to manipulate the data and produce outputs to present the data graphically to support decision making. Learning Outcome 1: Be able to create and populate spreadsheets to meet user requirements Learners must be taught how to: provide structure 1, i.e. worksheet name(s), column/row headings/sub-headings set size of rows, columns, print area use presentation features, i.e. borders, shading, fonts, colours, wrap text, merge cells, hide/show columns use validation rules 1, i.e. list, time, text length use input messages and error messages to advise and/or redirect the user in the event of invalid data entry enter given data set data types 1, i.e. alphanumeric, text, numeric (integer, currency, percentages, number of decimal places and fractions), date/time, limited choice (drop-down list, radio buttons, tick lists), object, logical/boolean (Yes/No, Male/Female) types use conditional formatting use page layout features, i.e. headers, footers, gridlines, scaling, paper size, orientation provide help for user of spreadsheet (e.g. notes, comments) interpret user requirements from the user brief. Learning Outcome 2: Be able to select and use spreadsheet functions to meet user requirements Learners must be taught how to: select and enter formulae using correct and appropriate arithmetic operators 2, i.e. +,, /, * select and enter functions 2, i.e. SUM, AVERAGE, LOOK UPS, IF, AND, OR, TODAY, DATE, MIN, MAX, COUNT use absolute and relative cell references use brackets to force order of operation reference data on other worksheets with formulae, i.e. cell linking create, assign, print and annotate macros test spreadsheet functionality. OCR 2012 OCR Cambridge Nationals in ICT 15

3 2 Learning Outcome 3: Be able to use spreadsheet models to present information to support decision making Learners must be taught how to: arrange data by sorting reduce data by fi ltering use what if analysis (e.g. trial and error, change variable data, goal seek) to predict results and create different scenarios and outcomes recognise that data type infl uences the graphical method used 3 use graphical methods to present information, i.e. bar chart, pie chart, line graph, scattergram and the use of scales, a title, axis title and key legend. 3 Links between units and synoptic assessment 1 Unit R001 LO2 supports the development of these skills by developing an understanding of them in business contexts. 2 Unit R002 LO2 supports the development of this Learning Outcome. 3 Unit R002 LO2 supports this by developing an understanding of appropriate chart types. If learners have already completed core units R001 and R002 they will already understand why and how spreadsheets are used to store and retrieve data in a business context and they will have covered the Data Protection Act (DPA). It is therefore recommended that they do these units fi rst. However, if this is not possible teachers should cover the content from the mandatory units which specifi cally relates to spreadsheets and the DPA as well as the taught content for unit R003 listed above. 16 OCR 2012 OCR Cambridge Nationals in ICT

4 Model Assignment Assessment Material OCR Level 1/2 Cambridge National Certificate in ICT OCR Level 1/2 Cambridge National Diploma in ICT Unit R003: Handling data using spreadsheets Please note: This OCR model assignment is to be used to provide evidence for the unit identified above. Alternatively, centres may tailor or modify the assignment within permitted parameters (see Information for Teachers). It is the centre s responsibility to ensure that any modifications made to this assignment allow learners to show that they can meet all of the learning outcomes and provide sufficient opportunity for learners to demonstrate achievement across the full range of marks. INSTRUCTIONS TO TEACHERS The OCR administrative codes associated with this unit are: unit entry code R003 certification codes Certificate J810 / Diploma J820 The accreditation numbers associated with this unit are: A. unit reference number T/503/6027 B. qualification reference(s) Certificate 600/4776/8 Diploma 600/4778/1 Duration: Approximately 10 hours ALL OF THIS MATERIAL MAY BE PHOTOCOPIED. Any photocopying will be done under the terms of the Copyright Designs and Patents Act 1988 solely for the purposes of assessment. Unit R003 Handling data using spreadsheets DRAFT 2 OCR 2012

5 1 Contents INFORMATION FOR LEARNERS Scenario for the assignment This section contains the assignment background which learners will need to be familiar with in order to complete the tasks. Your Tasks This section contains all the tasks learners must complete before work can be submitted for assessment. Page Number(s) INFORMATION FOR TEACHERS Guidance on using this assignment This section provides guidance to centre staff on the preparation and completion of the assignment Unit R003 Handling data using spreadsheets DRAFT 3 OCR 2012
 4 5 6 INFORMATION FOR TEACHERS Guidance on using this assignment This section provides guidance to centre staff on the")
6 Model Assignment: Information for Learners OCR Level 1/2 Cambridge National Certificate in ICT OCR Level 1/2 Cambridge National Diploma in ICT Unit R003 Handling data using spreadsheets Unit R003 Handling data using spreadsheets 4 OCR 2012

7 2 Scenario for the Assignment OCR Level 1/2 Cambridge Nationals in ICT] Make The Grade is a company formed by two teachers Sam and Sonia. They produce revision guides for GCSE courses, which they sell to schools. These include both paper-based student workbooks and interactive revision guides sold on DVDs. When schools purchase a DVD they can either buy it with a single-user licence, which allows them to use it on only one computer at a time, or with a site licence, which allows them to use the product on any computer within the school. DVDs with a single-user licence are priced at 10 more than the student workbook and DVDs with a site licence are priced at 20 times the cost of a singleuser licence, rounded up to the nearest pound. Currently, Sam and Sonia use a word-processed template for their invoices, a calculator to work out costs and word-processed lists containing school address details and product prices. These manual methods enable them to produce quotes and invoices but occasionally calculation errors have been made and as their product range and their sales increase they are looking for a more efficient system. They have been told that they need to use a spreadsheet, but they do not have very much experience in using this type of software. Sam and Sonia would like you to create a spreadsheet model that would enable them to: store details of all their products and prices and allow them to easily add new products when they become available store details of all their customers create and print invoices for orders placed. Sam and Sonia have provided you with the following electronic files which you will need to complete your tasks: their price list, which also shows current delivery charges and discount rates an example invoice some sample customer information to show you the details they keep about the schools who buy their revision guides. Read through all of the tasks carefully, so that you know what you will need to do to complete this assignment. Important: You will need to have access to the marking criteria. Your teacher can explain the marking criteria if you need further clarification. You will need to draw upon relevant skills/knowledge/understanding from other units you have studied in this qualification. Unit R003 Handling data using spreadsheets DRAFT 5 OCR 2012

8 OCR Level 1/2 Cambridge Nationals in ICT] 3 Your Tasks 4 Task 1: Create a spreadsheet to meet user requirements Learning Outcome 1 and part of Learning Outcome 2 are assessed in this task. You need to create a spreadsheet model for Make The Grade to meet Sam and Sonia s requirements. Remember the importance of testing your spreadsheet model as you develop it, to make sure that the final system works as it should and that it is as efficient as possible. A B C D Create a spreadsheet model that will allow you to store details of the products and customers and to create invoices. Add any formulae that are needed to make the system as efficient as possible, making sure you use appropriate functions where necessary. Enter the relevant data provided by Sam and Sonia. Add validation to your spreadsheet wherever it is appropriate. Apply appropriate formatting to your sheet(s) and make sure that you have suitable headings etc, to make it as clear as possible for Sam and Sonia to understand what the different parts of the system do and where they need to enter data. You may want to add other features, eg comments, macros, input messages, conditional formatting, to help Sam and Sonia use the system as easily as possible. 5 Task 2: Explain the formulae used in the spreadsheet model Part of Learning Outcome LO2 is assessed in this task. Consider each part of your spreadsheet model in turn, and the requirements of Make the Grade as outlined in the scenario. Identify where you have used formulae and explain why you have used them, including any functions you have used and why you chose them. Unit R003 Handling data using spreadsheets DRAFT 6 OCR 2012

9 OCR Level 1/2 Cambridge Nationals in ICT] 6 Task 3: Use the spreadsheet model to present information to support decision making. Learning Outcome 3 is assessed in this task. A B Sam and Sonia have given you some additional user requirements. You need to show how your spreadsheet can be used to help them meet these requirements. 1. They promote their products at local teachers events. They want to be able to send out promotional material to customers in the local area. For example, their next event will be in Birmingham, so they need to identify their customers in the Midlands area. 2. They sometimes receive answerphone messages from customers, who do not always leave their telephone numbers. They need to be able to easily find a customer s telephone number. For example, last week they had a call from Hazelcroft Academy. 3. They would like to include some quotes from satisfied customers in some of their advertisements. They would like to see their customer list sorted so that those who have made the most orders are at the top of the list. They can then start to contact those who have made the most orders to see if they would like to help. 4. They sometimes have enquiries from schools who are not currently customers. It would be helpful if they could find out about any existing customers in their area, especially if they have made more than one order. They have just had an enquiry from a school in the North of England. 5. They are thinking of having a special promotion for customers who have only made one order and who have not ordered for more than a year. They would like a list of these customers. Sam and Sonia would like to be able to see a breakdown of where their customers come from, so they can see clearly how many customers come from each of the different areas, eg the North, the Midlands, Wales. This should help them decide where to look for promotional opportunities. Create a chart to show Sam and Sonia the information they want to see. Make sure you format and label the chart as clearly and helpfully as possible. Unit R003 Handling data using spreadsheets DRAFT 7 OCR 2012

10 OCR Level 1/2 Cambridge Nationals in ICT] C Show how you can use your spreadsheet model to solve the following problems for Sam and Sonia. For each problem you should explain the results you find and the reasons for the methods you use. 1. A customer contacts the company. The customer wants to buy revision guides on DVD for Biology, Chemistry and Physics. They would like two prices - one for buying all of these with a site licence and one for buying 10 single-user licences for each. They will want next day delivery. 2. A second customer contacts the company for a quote: - This customer would like English, Maths and ICT revision guides. For each subject the customer wants a DVD with site licence, also 30 student workbooks. If they do not choose next day delivery, find the cost for this customer. - You notice that this customer s order will almost be sufficient to earn 10% discount. Try out some different scenarios to help this customer get what they want for the least amount of money, by purchasing additional student workbooks to give them 10% discount. 3. A third customer contacts the company for a quote. This customer is interested in Maths and English. The customer would ideally like, for each subject, 12 single-user DVDs and 50 student workbooks but only has Find a range of different options to offer this customer, within the budget of 1500 and present them in a way that will help the customer choose easily between the different options. They will not need next day delivery. 4. Another customer contacts the company for a quote. They want to buy revision guides on DVD for all available subjects, each with a site licence. They also want 200 student workbooks for Maths. The customer has a grant of 5000 to spend and cannot go over this total. They will not need next day delivery. - Find the total cost of the goods wanted by this customer. - Find the maximum number of workbooks that could be ordered within the customer s 5000 limit. - As this is such a large order, Sam and Sonia would like to be able to meet the customer s request in full. Find out how much discount they would need to apply to bring the original order under Unit R003 Handling data using spreadsheets DRAFT 8 OCR 2012

11 Information for Teachers OCR Level 1/2 Cambridge National Certificate in ICT OCR Level 1/2 Cambridge National Diploma in ICT Unit R003 Handling data using spreadsheets Unit R003 Handling data using spreadsheets 9 OCR 2012

12 7 Guidance on using this assignment 1 General guidance 1.1 OCR assignments are available to download free of charge from our website: OCR assignments are intended to be used for formal summative assessment of learners and assessment must be conducted for supervision. The OCR specification gives more information on the arrangements for assessing internally assessed units. 1.3 This assignment has been designed to meet the full assessment requirements of the unit. Learners will need to take part in a planned learning programme that covers the underpinning knowledge, understanding and skills of the unit. 2 Before carrying out the assignment 2.1 Learners should be provided with a copy of the Information for Learners section of this assignment. 2.2 Learners will not need to carry out any preparations prior to undertaking the assessment tasks, such as collating resources to use in the assessment 2.3 We have estimated that it will take approximately 10 hours to complete this assignment. This is the recommended time but centres can decide how the time can be allocated between each part or individual task in the assessment. Centres are also permitted to spread the overall assessment time across several sessions and therefore it is permissible for evidence to be produced over several sessions. 2.4 Learners will need to have access to three files which contain data to be used to complete the task. Centres should load these into an area on the network that learners are able to access during the assessment. You must make sure every learner is given clear instructions about where the files are. 3 When completing the assignment and producing evidence 3.1 Each learner must produce individual and authentic evidence for each task within the assignment. 3.2 Centre staff may give support and guidance to learners. This support and guidance should focus on checking that learners understand what is expected of them and giving general feedback that enables the learner to take the initiative in making improvements, rather than detailing what amendments should be made. It is not acceptable for teachers/deliverers to provide answers, to work through answers in detail or to detail specifically what amendments should be made. 3.3 Learners may use information from any relevant source to help them with producing evidence for the tasks. 3.4 Learners must be guided on the use of information from other sources to ensure that confidentiality is maintained at all times. 3.5 We have specified what evidence the learner is expected to produce. Usually, the type of evidence provided may be modified, with the exception of certain types of evidence listed below under Permitted changes. It is important to note that it is possible to generate the evidence in a variety of formats. Centres must advise learners as to the most appropriate format of evidence. The nature of this assessment means that learners are free to use the format that they feel is most appropriate for the purpose and target audience for each individual task. Unit R003 Handling data using spreadsheets DRAFT 10 OCR 2012

13 4 Presentation of work for marking and moderation 4.1 Centres wishing to produce digital evidence in the form of an e-portfolio should refer to the appendix in the specification on guidance for the production of electronic assessment. 4.2 Centres may wish to discourage learners from excessive use of plastic wallets for presentation of their evidence as this may hinder the assessment process. Instead centres may wish to encourage learners to present their work so that it is easily accessible, e.g. spiral bound, stapled booklet, treasury tag. 5 Scope of permitted model assignment modification The model assignment is self-contained in its present form. The set of tasks form a coherent whole addressing all the learning outcomes and allowing access to the full range of marks. You must not change the following: the learning outcomes the marking criteria the requirements for supervision and authentication as described in the specification (Section 4 The centre assessed units). Permitted changes: The model assignment can be modified in terms of the areas described below but centres must be sure that learners still have the opportunity to cover all of the learning outcomes and to access the full range of marks: A logical approach is suggested, however, centres may wish to change the order of the tasks depending on learners individual requirements, for example it may suit learners better to attempt Task 2: Explain the formulae used in the spreadsheet model as they complete their model in Task 1. the learner s assignment, which can be contextualised or amended to suit local needs. Some changes will have a direct effect on the data files we provide for the assessment and you must make sure any permitted changes to the scenario are carried through to the data files: - the name of Make The Grade stated in the scenario and in the data file PriceList, and Invoice - The address of Make The Grade shown in the invoice - The details of customers within the CustomerList data file - The products and prices listed in the PriceList file. However, should prices be altered it must be checked that the modelling problems in Task 3 are not affected. - the following names in the scenario and all tasks: Make the Grade, Sam, Sonia the format the evidence takes, guidance is given in the section Evidence summary. Unit R003 Handling data using spreadsheets DRAFT 11 OCR 2012

14 OCR has ensured that in the language used and the tasks and scenario provided we have avoided discrimination, bias and stereotyping and support equality and diversity. In the development of qualifications and assessments we use the guidance given in the Ofqual publication Fair access by design, notably this includes: using language and layout in assessment materials that does not present barriers to learners using stimulus and source materials in assessment materials (where appropriate) that do not present barriers to learners. If centres wish to modify the model assignment we strongly advise that staff responsible for modifying the model assignment and the quality assurance of it refer to the publication Fair access by design. If modifications are made to the model assignment, whether to just the scenario or to both the scenario and individual tasks, it is up to the centre to ensure that all learning outcomes can still be met and that learners can access the full range of marks. 6 Specific guidance on the task Learners should be provided with a copy of the marking criteria for this unit when completing the assignment. Teachers should ensure that candidates understand the marking criteria and may explain it to them. When completing this assignment it may be possible to generate evidence for completing a task in a variety of formats. Clear evidence is required for all assessment criteria credited. In Task 1, candidates will be creating a spreadsheet populated with the data provided. Formulae need to be clearly evidenced, showing any functions used. Formatting and other features, eg comments, macros, validation (including any input and/or error messages set) and conditional formatting also need to be clear. This might be best evidenced through provision of the final electronic file, with some annotation and/or explanation to show where features that are not clearly visible can be found. Alternatively, formulas might be evidenced through printouts of the spreadsheet in formula view, with formatting and other features evidenced through printouts and screenshots as necessary. Task 2 requires candidates to explain the formulae/functions used. Most candidates are likely to word-process these explanations, providing evidence through printouts or electronic word-processed/pdf files. Task 3 provides additional user requirements which require candidates to sort and filter the data, produce a chart and carry out modelling activities. For the lower mark bands it is not expected that candidates will attempt to meet all of the user requirements in sections A and C. Evidence of sorting, filtering and modelling (sections A and C) should be provided by printouts (PDF printouts are acceptable for electronic portfolios) rather than saving different versions/worksheets, which does not demonstrate a good understanding of the use of a spreadsheet model. The chart might be printed or evidenced electronically as part of the spreadsheet file. Explanations might be annotated onto printouts and/or provided through separate word-processed work evidenced by printouts and/or electronic word-processor/pdf files. Unit R003 Handling data using spreadsheets DRAFT 12 OCR 2012

15 Unit R003 Handling data using spreadsheets DRAFT 13 OCR 2012

16 OCR Level 1/2 Cambridge Nationals in [ICT] Unit R003 Handling data using spreadsheets DRAFT 14 OCR 2012

17 OCR Level 1/2 Cambridge Nationals in [ICT] Exemplar Assessment Evidence OCR Level 1/2 Cambridge National Award in [ICT] OCR Level 1/2 Cambridge National Certificate in [ICT] OCR Level 1/2 Cambridge National Diploma in [ICT] Unit [R003]: [Handing data using spreadsheets] This is not a complete exemplar portfolio. What is included in this pack is a selection of evidence to show possible approaches for specific content areas and to exemplify the process of awarding mark bands at different levels. This should not be shared with candidates; this is for teacher guidance only.


18 Task 1 MB1 candidate I have got three sheets for prices customers and invoice. I have made all the columns wide enough and shaded them so the titles stand out and you can read everything easily. I have put formulas in the spreadsheet. I have put validation in for the postage because it has to be 0 or 25. This gives a menu button which makes it easy.

19

20 Task 2 MB1 candidate These are my formulas in the invoice Product Code R0001DSL 1 R0001SWB 35 R0006DSL 1 R0006SWB 24 Qty Product Description Price Each Price English Revision DVD (Site Licence) English Revision Student Workbook ICT Revision DVD (Site Licence) ICT Revision Student Workbook 400 =B24*D =B25*D =B26*D =B27*D27 Subtotal: Discount: VAT: =B28*D28 =B29*D29 =B30*D30 =B31*D31 =B32*D32 =B33*D33 =B34*D34 =SUM(E24:E34) =5/100*E35 =20/100*E35 Postage: 25 Grand Total: =E35-E36+E37+E38 These are to times the amount by the price to see how much they cost altogether This adds all the amounts together. SUM is a function it makes it easier to do To get the final amount I had to take the discount away and then add the VAT and the postage. This works out the discount. It is 5% because the amount is more than The next one is the same except it is 20% for VAT.

21 Criteria LO1: Be able to create and populate spreadsheets to meet user requirements 1 MB1: 1-4 marks MB2: 5-8 marks MB3: 9-11 marks Creates a basic structure which meets few of the user requirements from a brief and provides some indication to the user of the purpose of the spreadsheet model. Creates a structure which meets many of the user requirements of a brief, makes the purpose of the spreadsheet model clear to the user and incorporates some features to make it userfriendly. Creates an organised structure which meets most of the user requirements of a brief and uses appropriate presentation to make the purpose of the spreadsheet model clear and very user-friendly, enabling the user to readily identify where the inputs and outputs are located. [ ] [ ] [ ] The data from the two data files have been imported into separate Excel sheets, and the structure of the invoice has been imported to create a third sheet. Very little has been done to automate any tasks the details have to be entered manually onto the invoice, but some basic formulae have been used to calculate totals. No thought has been given to the possibility of separating out data such as the date, discount %, VAT rate and delivery choice, which would be better in separate cells where they could be used directly. This represents a lower-band response, meeting few of the user requirements. Since the headings etc have all been exported, there is sufficient to provide some indication of the purpose of the spreadsheet model, although the lack of sheet tab names, comments, descriptions etc mean that the requirements of higher bands are not met. There is no reason not to award the highest mark from MB1 = 4 marks.
22 Criteria MB1: 1-3 marks MB2: 4-6 marks MB3: 7-9 marks Uses some data types, some of which are relevant, and limited data validation. Uses relevant data types and some relevant data validation types to minimise data entry errors including input messages to redirect the user. Uses relevant data validation and data types effectively to minimise data entry errors including appropriate input messages to redirect the user. Selects some data that is relevant to user requirements and enters some of it accurately. Errors may be intrusive and likely to impact significantly on the functionality of the spreadsheet. Selects data that is mostly relevant to user requirements and enters most of it accurately. Occasional errors will not impact on the functionality of the spreadsheet. Selects the data which is relevant to user requirements and enters it accurately. Few if any errors intrude, so the functionality of the spreadsheet is not affected. Draws upon limited skills/knowledge/understanding from other units in the specification. Draws upon some relevant skills/knowledge/understanding from other units in the specification. [4 5 6] Clearly draws upon relevant skills/knowledge/understanding from other units in the specification. [7 8 9] [1 2 3] Most data types will have been automatically imported but appropriate currency has been set not only where data was imported but also in other columns in the invoice. Candidate documentation allows us to see where validation has been set (postage) and this would work, although validation from a list somewhere on the spreadsheet would have been more flexible/future proof than entering the values directly into the validation rule. All of the relevant data has been entered and because it has been imported this has been done accurately. When data is entered in later tasks there is one obvious error; additionally, had the candidate been more selective in importing the data, more functionality could have been added by the use of more formulae. The final total on the invoice is incorrect, as the candidate has calculated the VAT on the total, regardless of any discount. As this is not a business studies paper and the rules for calculating VAT were not supplied within the assignment the candidate should not be penalised for this at this level. At higher levels the candidate could have been expected to compare the result with the sample invoice and therefore tracked the error. There is no specific evidence of knowledge/understanding that has been drawn upon from other units but the basic competency shown in organising the data, saving it etc is sufficient to meet the lower band requirements. Again, there is no reason not to award the highest mark in MB1.
23 Selects formulae and functions to produce a solution which has limited capacity to meet user requirements. Criteria LO2: Be able to select and use spreadsheet functions to meet user requirements 2 MB1: 1-4 marks MB2: 5-7 marks MB3: 8-10 marks Selects formulae and functions to produce a solution that includes elements of efficiency and satisfies some of the user requirements. Selects formulae and functions to produce a solution that is effective and efficient and in the main accurately meets user requirements. Some functionality has been added through the use of formulae but this is very limited. Not only are there no formulae to take data from the data tables into the invoice but the postage and discount have to be entered manually too. However, one function (SUM) has been used correctly and all aspects of the invoice (eg discount, VAT and delivery) are dealt with. This again represents a solid MB1 response and 4 marks would be given. MB1: 1-5 marks MB2: 6-8 marks MB3: 9-12 marks Gives a limited explanation of why the formulae and functions were selected. Gives a sound explanation of why the formulae and functions were selected giving mostly valid reasons. Gives a thorough justification of why the formulae and functions were selected giving full and valid reasons. Demonstrates a limited understanding of which formulae and functions will meet user requirements. Demonstrating a sound understanding of which formulae and functions will meet user requirements. Demonstrating a detailed understanding of which formulae and functions will best meet user requirements. The candidate has attempted to explain the formulae used, in a form which is generally limited to a description of what each formula does, demonstrating a limited understanding of which formulae and functions will meet user requirements. Again, this represents a lower band response. All formulas are explained, including some recognition of why SUM was used, representing the standard we would expect from the top of this mark band (5 marls)
24 Task 2 MB3 candidate (extract) Invoice This is where most of my formulas are. Customer Information: Account No: C0001 Contact Name: =IF($B$10="","", VLOOKUP($B$10,Customers!$A$3:$K$19,8,FALSE)) Company: =IF($B$10="","", VLOOKUP($B$10,Customers!$A$3:$K$19,2,FALSE)) Address : =IF($B$10="","", VLOOKUP($B$10,Customers!$A$3:$K$19,3,FALSE)) =IF($B$10="","", VLOOKUP($B$10,Customers!$A$3:$K$19,4,FALSE)) Town: =IF($B$10="","", VLOOKUP($B$10,Customers!$A$3:$K$19,5,FALSE)) Post Code: =IF($B$10="","", VLOOKUP($B$10,Customers!$A$3:$K$19,6,FALSE)) I started with =VLOOKUP($B$10,Customers!$A$3:$K$19,8,FALSE). The lookup looks up the number in the account number and then finds the right bit of information from the customer table. The only difference in each line is the last number. For example the name is in column 8 and the company is in column 2 etc. I put a false on the end because I want an exact match. I went to row 19 so that I included a blank line at the end. When I use my macro to insert new customers this will change so the new line is included. Lookup is the best way of getting information from a table without typing it in all yourself again. I used $ signs for B10 and the customer list this makes them absolute references because they will always be the same it is always the customer number that is looked up and always in the same table. This meant that after I d done the first one I could copy it into all the other rows and just change the column number. This was quick and stopped me making lots of mistakes. When I made sure the formulas worked I realised that I got an error message if I left the account number blank. That s why I put the IF in. This means that if the account number is blank then nothing goes in and the computer doesn t try to look up something that isn t there. This is better than it was before. This is part of a much more sophisticated solution which links data between the different sheets. The candidate has clearly thought about how to make an efficient solution that minimises data entry on the part of the user. There are macros (not documented here) to make the system easier for the user. The candidate has explained quite fully the reasons for choosing the functions and there is some justification, with comparison with a less efficient solution. If this level of efficiency, consideration of ease of use and explanation were replicated in all areas then this candidate would be working towards full marks in LOs 1 and 2.
25 Task 3 MB1 candidate. 1. There is one customer in Birmingham 2. The telephone number for Hazlecroft academy is These are in order of orders 4. These are in the North B North South West South East North Midlands North North Northern Ireland Midlands North South East Midlands Midlands 1 North South West South East North Midlands North North Northern Ireland Midlands North South East Midlands Midlands
26 Criteria MB1: 1-5 marks MB2: 6-8 marks MB3: 9-10 marks Arranges and/or reduces data through selection of criteria to meet some of the user requirements. Creates a graph with data, some of which relevant. There may be some labelling. It gives limited information to support to decision-making. Clearly arranges and/or reduces data through the selection of criteria giving some support to decision-making. Most of the user requirements are met. Creates a graph taking into account most of the relevant data. Graph is labelled but needs some other supporting information for the data to be interpreted. It gives some support to decisionmaking. Efficiently arranges and/or reduces data through the selection of criteria using multiple data choices, to enable the user to assess information effectively to inform decisions. User requirements are met. Creates a graph taking into account the relevant data and the graph is suitable for the data type. The graph is labelled appropriately meaning that it fully supports decision-making. [ ] [6 7 8] [9 10] The candidate has attempted solutions to four of the five problems in part A, with varying success. The candidate has correctly chosen to apply a filter for problem 1, but Birmingham has been selected rather than the Midlands area, so this is only a partial solution. The correct telephone number has been found for problem 2, but there is no indication of how this has been done the candidate might just have looked it up by eye. A sort has been correctly applied for problem 3. A partial solutions has been provided for problem 4 the candidate has filtered for the North but not considered the number of orders made a more able candidate might have chosen to filter for those who have made one order or might have chosen to sort in descending order of the number of orders made either would be an effective solution, given the preferably in the task. This candidate s solutions would provide some limited support to decision making but do not meet most of the user requirements. A graph has been attempted but without success, as the candidate has not created a data table which would provide the data in the format required to create a graph. This cannot be considered to have any relevance and does not provide any support to decision-making, so this section of the lower band is not met. With the first part of the MB met, in a limited way, in a range of contexts and the second part not met, a mark of 2 would be awarded.
27 Number of customers Task B MB3 candidate B I made a bar chart to compare the number of customers in different areas. I had to make a table first using countif. Area Number Midlands 4 North 5 South East 3 South West 1 Northern Ireland Number of customers from each area Midlands North South East South West Northern Ireland Area The graph produced by this candidate is simple, but well labelled and meets the requirements. If this candidate were to come up with good solutions to each of the sorting and filtering problems then full marks would be deserved in this section of LO3.
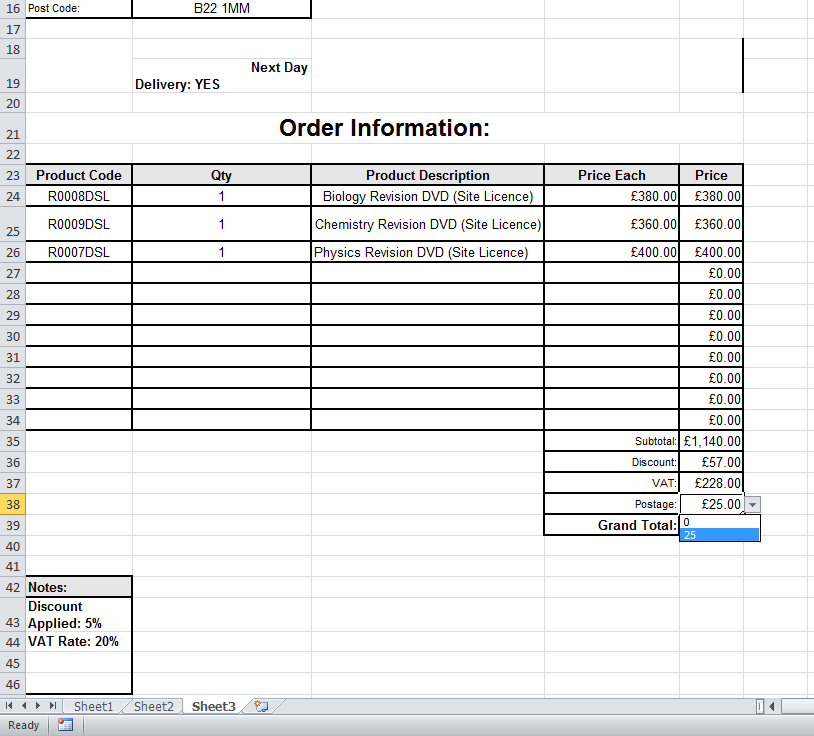
28 Task 3 C MB1 candidate This candidate supplied an electronic file and the following documentation. C. single users = and site licence is The invoice sheet in the candidate s file is shown below: Make The Grade 24 Cambridge Court Wimbledon London LV7 5RT INVOICE Invoice Number: 0001 Invoice Date:23/04/2011 Customer Information: Account No: Contact Name: Company: Address : Town: Post Code: C0001 Mr J Brown Highway School Station Road Sheldon Birmingham B22 1MM Next Day Delivery: YES
29 Order Information: Product Code Qty Product Description Price Each Price R0008DSL 1 Biology Revision DVD (Site Licence) R0009DSL 1 Chemistry Revision DVD (Site Licence) R0007DSL 1 Physics Revision DVD (Site Licence) Subtotal: 1, Discount: VAT: Postage: Notes: Grand Total: 1, Discount Applied: 5% VAT Rate: 20%
30 Criteria MB1: 1-4 marks MB2: 5-7 marks MB3: 8-10 marks Uses a spreadsheet to change a simple variable to show an alternative outcome. Uses spreadsheet modelling to provide a variety of alternative outcomes for a scenario. Uses complex spreadsheet modelling to provide alternative outcomes for a range of different scenarios utilising complex data tools. The results give limited information to support to decisionmaking. Describes the results and gives some justification for the choice of tools used providing some support to decision-making. Detailed explanation of the results and thorough justification of the choice of tools used and fully supporting decision-making. [5 6 7] [8 9 10] [ ] The candidate has attempted the first modelling problem in part B. The fact that the sheet shows the figures for the second scenario (site licence) suggests that the candidate has used the spreadsheet to come up with both figures but a teacher might ask the candidate to demonstrate where the first number came from before crediting it this could then be documented on the Unit Recording Sheet. Data has been accurately entered apart from the discount for the single user option, which has not been changed from the original 5%. An alternative outcome, as required in MB1, has therefore been produced but this is of very limited value as one of the final totals is incorrect it would not provide accurate information to support decision making. Overall this represents a lower-band response which does not fully meet the criteria, with the error reducing the value of the output, so full lower-band marks would not be appropriate here. However, a simple variable has certainly been changed to show an alternative outcome, so 3 marks can be awarded.
31 Task 3 C MB3 response (extract) 2. A second customer contacts the company for a quote: This customer would like English, Maths and ICT revision guides. For each subject the customer wants a DVD with site licence, also 30 student workbooks. If they do not choose next day delivery, find the cost for this customer. You notice that this customer s order will almost be sufficient to earn 10% discount. Try out some different scenarios to help this customer get what they want for the least amount of money, by purchasing additional student workbooks to give them 10% discount. I used the invoice again and entered the details for the customer. This came to The product descriptions and prices changed as soon as I changed the product code because it looked them up on the price list. When I changed the quantity it changed the prices because of the formula it multiplies the price each by the quantity. The discount was calculated at 5% because the total was less than The VAT changed because it is calculated from the subtotal discount. I changed the delivery and this changed the postage charge to 0 because of the IF formula. Product Code Qty Product Description Price Each Price R0001DSL 1 English Revision DVD (Site Licence) R0001SWB 30 English Revision Student Workbook R0002DSL 1 Maths Revision DVD (Site Licence) R0002SWB 30 Maths Revision Student Workbook R0006DSL 1 ICT Revision DVD (Site Licence) R0006SWB 30 ICT Revision Student Workbook Subtotal: 1, Discount: VAT: Postage: 0.00 Grand Total: 2,221.97
32 I tried out some different scenarios to take the total to just over 2000 to get the discount. This brought the total down. I just tried out different amounts of workbooks until I got over I used the scenario manager to help me remember all the different things I found. This makes it easy to compare the results. The best one was to buy 33 Maths and 33 ICT and keep the English at 30. This gives a total of 4p more than 2000 so I can t get it any lower than that and still get the discount. Scenario Summary Changing Cells: Current Values: English Maths ICT Best $B$ $B$ $B$ Result Cells: $E$34 2, , , , , $E$ $E$ $E$ $E$38 2, , , , , A range of different outcomes have been produced for this particular modelling problem, using a complex data tool in the form of scenarios, which has enabled the best result to be found, fully supporting decision-making. Results are explained in terms of the formulas in the model and the tools used have been explained with justification. Although this explanation is rather brief it does show understanding of the tools and a good understanding of modelling. If an equivalent standard were shown for all the modelling problems in the Model Assignment then this candidate could gain full marks in this section of LO3. Use of the scenario manager is just one possible way that a candidate might demonstrate the use of complex data tools. Some candidates might use Goal Seek whilst others might create solutions using other methods that might be considered equally effective.
Live Assessment Material Model Assignment 1
 Live Assessment Material Model Assignment 1 OCR Level 1/2 Cambridge National Award in Creative imedia OCR Level 1/2 Cambridge National Certificate in Creative imedia OCR Level 1/2 Cambridge National Diploma
Specimen Internal Assessment Material
 Model Assignment Specimen Internal Assessment Material OCR Level 1/2 Cambridge National Certificate in Science in the Workplace R076: Environmental science SPECIMEN INTERNAL ASESSMENT MATERIAL THIS VERSION
Excel 2007 Tutorials - Video File Attributes
 Get Familiar with Excel 2007 42.40 3.02 The Excel 2007 Environment 4.10 0.19 Office Button 3.10 0.31 Quick Access Toolbar 3.10 0.33 Excel 2007 Ribbon 3.10 0.26 Home Tab 5.10 0.19 Insert Tab 3.10 0.19 Page
Spreadsheet Modelling
 Unit 42: Spreadsheet Modelling Unit code: QCF Level 3: Credit value: 10 Guided learning hours: 60 Aim and purpose Y/601/6637 BTEC Nationals This unit aims to enable learners to use complex spreadsheet
BSBITU402A Develop and use complex spreadsheets
 BSBITU402A Develop and use complex spreadsheets Revision Number: 1 BSBITU402A Develop and use complex spreadsheets Modification History Not applicable. Unit Descriptor Unit descriptor This unit describes
Improving Productivity using IT - Level 3 Scenario Assignment Sample Test 4 Version SampleMQTB/1.0/IP3/v1.0. Part 1 Performance
 Improving Productivity using IT - Level 3 Scenario Assignment Sample Test 4 Version SampleMQTB/1.0/IP3/v1.0 This test is divided into two parts. You must read through the whole scenario assignment before
MICROSOFT EXCEL STEP BY STEP GUIDE
 IGCSE ICT SECTION 14 DATA ANALYSIS MICROSOFT EXCEL STEP BY STEP GUIDE Mark Nicholls ICT Lounge Data Analysis Self Study Guide Contents Learning Outcomes Page 3 What is a Data Model?... Page 4 Spreadsheet
Section 1 Spreadsheet Design
 Section 1 Spreadsheet Design Level 6 Spreadsheet 6N4089 Contents 1. Assess the suitability of using a spreadsheet to achieve a given requirement from a given specification... 1 Advantages of using Spreadsheet
Level 2 Certificate in Practical ICT Skills
 LCCI International Qualifications Level 2 Certificate in Practical ICT Skills Syllabus Effective from 1 May 2007 For further information contact us: Tel. +44 (0) 8707 202909 Email. [email protected]
Excel 2003: Ringtones Task
 Excel 2003: Ringtones Task 1. Open up a blank spreadsheet 2. Save the spreadsheet to your area and call it Ringtones.xls 3. Add the data as shown here, making sure you keep to the cells as shown Make sure
MICROSOFT ACCESS STEP BY STEP GUIDE
 IGCSE ICT SECTION 11 DATA MANIPULATION MICROSOFT ACCESS STEP BY STEP GUIDE Mark Nicholls ICT Lounge P a g e 1 Contents Task 35 details Page 3 Opening a new Database. Page 4 Importing.csv file into the
Level 1 Producing simple spreadsheets (7266/7267-003)
") Level 1 Producing simple spreadsheets (7266/7267-003) e-quals Assignment guide for Candidates Assignment B (This assignment can be used as evidence of achievement of 7574-127 Spreadsheet software) www.cityandguilds.com/e-quals07
Level 1 Producing simple spreadsheets (7266/7267-003) e-quals Assignment guide for Candidates Assignment B (This assignment can be used as evidence of achievement of 7574-127 Spreadsheet software) www.cityandguilds.com/e-quals07
Unit R005. Creating an Interactive product using multimedia components
 Unit R005 Creating an Interactive product using multimedia components Unit R005 Creating an interactive product using multimedia components 1 2 2.6 Unit R005: Creating an interactive product using multimedia
Excel 2003 Tutorials - Video File Attributes
 Using Excel Files 18.00 2.73 The Excel Environment 3.20 0.14 Opening Microsoft Excel 2.00 0.12 Opening a new workbook 1.40 0.26 Opening an existing workbook 1.50 0.37 Save a workbook 1.40 0.28 Copy a workbook
How to Excel with CUFS Part 2 Excel 2010
 How to Excel with CUFS Part 2 Excel 2010 Course Manual Finance Training Contents 1. Working with multiple worksheets 1.1 Inserting new worksheets 3 1.2 Deleting sheets 3 1.3 Moving and copying Excel worksheets
Excel 2010: Create your first spreadsheet
 Excel 2010: Create your first spreadsheet Goals: After completing this course you will be able to: Create a new spreadsheet. Add, subtract, multiply, and divide in a spreadsheet. Enter and format column
Level 1 Certificate in Practical ICT Skills
 LCCI International Qualifications Level 1 Certificate in Practical ICT Skills Syllabus Effective from 2001 For further information contact us: Tel. +44 (0) 8707 202909 Email. [email protected] www.lcci.org.uk
Teacher Notes Introduction
 Teacher Notes Introduction Why ICT 4 Life? Wouldn t it be great to have classes of enthusiastic, ICT-capable learners, performing and progressing well? Of course, we see fantastic examples of good practice
Professional Diploma in Marketing
 Professional Diploma in Marketing 543 Project Management in Marketing Work-Based Project Brief and Mark Scheme March 2015 Candidates are required to choose ONE out of the following TWO project briefs:
OCR LEVEL 2 CAMBRIDGE TECHNICAL
 Cambridge TECHNICALS OCR LEVEL 2 CAMBRIDGE TECHNICAL CERTIFICATE/DIPLOMA IN IT DATABASE SYSTEMS R/601/3400 LEVEL 2 UNIT 20 GUIDED LEARNING HOURS: 60 UNIT CREDIT VALUE: 10 DATABASE SYSTEMS R/601/3400 LEVEL
Level 3 Spreadsheet software (SS 7574-327)
") Level 3 Spreadsheet software (SS 7574-327) ITQ (QCF) Assignment guide for Candidates Assignment B www.cityandguilds.com January 2012 Version 1.0 About City & Guilds City & Guilds is the UK s leading provider
Level 3 Spreadsheet software (SS 7574-327) ITQ (QCF) Assignment guide for Candidates Assignment B www.cityandguilds.com January 2012 Version 1.0 About City & Guilds City & Guilds is the UK s leading provider
GCE APPLIED ICT A2 COURSEWORK TIPS
 GCE APPLIED ICT A2 COURSEWORK TIPS COURSEWORK TIPS A2 GCE APPLIED ICT If you are studying for the six-unit GCE Single Award or the twelve-unit Double Award, then you may study some of the following coursework
As in the example above, a Budget created on the computer typically has:
 Activity Card Create a How will you ensure that your expenses do not exceed what you planned to invest or spend? You can create a budget to plan your expenditures and earnings. As a family, you can plan
Using Excel as a Management Reporting Tool with your Minotaur Data. Exercise 1 Customer Item Profitability Reporting Tool for Management
 Using Excel as a Management Reporting Tool with your Minotaur Data with Judith Kirkness These instruction sheets will help you learn: 1. How to export reports from Minotaur to Excel (these instructions
Search help. More on Office.com: images templates. Here are some basic tasks that you can do in Microsoft Excel 2010.
 Page 1 of 8 Excel 2010 Home > Excel 2010 Help and How-to > Getting started with Excel Search help More on Office.com: images templates Basic tasks in Excel 2010 Here are some basic tasks that you can do
To reuse a template that you ve recently used, click Recent Templates, click the template that you want, and then click Create.
 What is Excel? Applies to: Excel 2010 Excel is a spreadsheet program in the Microsoft Office system. You can use Excel to create and format workbooks (a collection of spreadsheets) in order to analyze
Excel 2007 A Beginners Guide
 Excel 2007 A Beginners Guide Beginner Introduction The aim of this document is to introduce some basic techniques for using Excel to enter data, perform calculations and produce simple charts based on
Excel Project Creating a Stock Portfolio Simulation
 Background Vocabulary Excel Project Creating a Stock Portfolio Simulation 1. What is a stock? A stock is a share in the ownership of a corporation, a large business organization. A stock, also, represents
ECDL / ICDL Spreadsheets Syllabus Version 5.0
 ECDL / ICDL Spreadsheets Syllabus Version 5.0 Purpose This document details the syllabus for ECDL / ICDL Spreadsheets. The syllabus describes, through learning outcomes, the knowledge and skills that a
Intro to Excel spreadsheets
 Intro to Excel spreadsheets What are the objectives of this document? The objectives of document are: 1. Familiarize you with what a spreadsheet is, how it works, and what its capabilities are; 2. Using
OCR Nationals in ICT
 Learning Outcomes By completing this unit you will develop the ability to create files in different software packages, including word-processing, DTP, spreadsheet, database and presentation software. You
Excel 2003 A Beginners Guide
 Excel 2003 A Beginners Guide Beginner Introduction The aim of this document is to introduce some basic techniques for using Excel to enter data, perform calculations and produce simple charts based on
Microsoft Office Word 2010: Level 1
 Microsoft Office Word 2010: Level 1 Workshop Objectives: In this workshop, you will learn fundamental Word 2010 skills. You will start by getting acquainted with the Word user interface, creating a new
Unit 1: ICT skills for business (LEVEL 2)
") (LEVEL 2) Learning outcomes By completing this unit candidates will develop the ability to create files in different software packages, including word processing or DTP, spreadsheet, database and presentation
(LEVEL 2) Learning outcomes By completing this unit candidates will develop the ability to create files in different software packages, including word processing or DTP, spreadsheet, database and presentation
Microsoft Office 2010: Access 2010, Excel 2010, Lync 2010 learning assets
 Microsoft Office 2010: Access 2010, Excel 2010, Lync 2010 learning assets Simply type the id# in the search mechanism of ACS Skills Online to access the learning assets outlined below. Titles Microsoft
Lab 11: Budgeting with Excel
 Lab 11: Budgeting with Excel This lab exercise will have you track credit card bills over a period of three months. You will determine those months in which a budget was met for various categories. You
Computer Training Centre University College Cork. Excel 2013 Pivot Tables
 Computer Training Centre University College Cork Excel 2013 Pivot Tables Table of Contents Pivot Tables... 1 Changing the Value Field Settings... 2 Refreshing the Data... 3 Refresh Data when opening a
Microsoft Excel 2010 Part 3: Advanced Excel
 CALIFORNIA STATE UNIVERSITY, LOS ANGELES INFORMATION TECHNOLOGY SERVICES Microsoft Excel 2010 Part 3: Advanced Excel Winter 2015, Version 1.0 Table of Contents Introduction...2 Sorting Data...2 Sorting
27 Spreadsheet. modelling. Learning outcomes. Credit value: 10
 Credit value: 10 27 Spreadsheet modelling The spreadsheet and the word processor were the business applications that started the personal computer revolution, and they remain the most popular and useful
Introduction to Pivot Tables in Excel 2007
 The Company Rocks Introduction to Pivot Tables in Excel 2007 Step-by-step instructions to accompany video lessons Danny Rocks 4/11/2011 Introduction to Pivot Tables in Excel 2007 Pivot Tables are the most
SOAL-SOAL MICROSOFT EXCEL 1. The box on the chart that contains the name of each individual record is called the. A. cell B. title C. axis D.
 SOAL-SOAL MICROSOFT EXCEL 1. The box on the chart that contains the name of each individual record is called the. A. cell B. title C. axis D. legend 2. If you want all of the white cats grouped together
Excel 2003 Tutorial I
 This tutorial was adapted from a tutorial by see its complete version at http://www.fgcu.edu/support/office2000/excel/index.html Excel 2003 Tutorial I Spreadsheet Basics Screen Layout Title bar Menu bar
CREATING FORMAL REPORT. using MICROSOFT WORD. and EXCEL
 CREATING a FORMAL REPORT using MICROSOFT WORD and EXCEL TABLE OF CONTENTS TABLE OF CONTENTS... 2 1 INTRODUCTION... 4 1.1 Aim... 4 1.2 Authorisation... 4 1.3 Sources of Information... 4 2 FINDINGS... 4
Spreadsheets Hop-around Cards
 Spreadsheets Hop-around Cards Visit us online at HOP-AROUND CARDS Preparation Print the cards out using a high quality colour printer Laminate each sheet and then cut out the individual cards to make a
CHAPTER 6: ANALYZE MICROSOFT DYNAMICS NAV 5.0 DATA IN MICROSOFT EXCEL
 Chapter 6: Analyze Microsoft Dynamics NAV 5.0 Data in Microsoft Excel CHAPTER 6: ANALYZE MICROSOFT DYNAMICS NAV 5.0 DATA IN MICROSOFT EXCEL Objectives The objectives are: Explain the process of exporting
Advanced Microsoft Excel 2010
 Advanced Microsoft Excel 2010 Table of Contents THE PASTE SPECIAL FUNCTION... 2 Paste Special Options... 2 Using the Paste Special Function... 3 ORGANIZING DATA... 4 Multiple-Level Sorting... 4 Subtotaling
Microsoft Excel 2007 Consolidate Data & Analyze with Pivot Table Windows XP
 Microsoft Excel 2007 Consolidate Data & Analyze with Pivot Table Windows XP Consolidate Data in Multiple Worksheets Example data is saved under Consolidation.xlsx workbook under ProductA through ProductD
INTRODUCTION TO EXCEL
 INTRODUCTION TO EXCEL 1 INTRODUCTION Anyone who has used a computer for more than just playing games will be aware of spreadsheets A spreadsheet is a versatile computer program (package) that enables you
Working with Spreadsheets
 osborne books Working with Spreadsheets UPDATE SUPPLEMENT 2015 The AAT has recently updated its Study and Assessment Guide for the Spreadsheet Software Unit with some minor additions and clarifications.
OCR Level 2 CAMBRIDGE TECHNICAL
 Cambridge TECHNICALS OCR Level 2 CAMBRIDGE TECHNICAL CERTIFICATE/DIPLOMA IN IT IT security J/601/4057 LEVEL 2 UNIT 18 GUIDED LEARNING HOURS: 60 UNIT CREDIT VALUE: 10 IT SECURITY J/601/4057 LEVEL 2 Aim
Data exploration with Microsoft Excel: univariate analysis
 Data exploration with Microsoft Excel: univariate analysis Contents 1 Introduction... 1 2 Exploring a variable s frequency distribution... 2 3 Calculating measures of central tendency... 16 4 Calculating
Excel 2003 PivotTables Summarizing, Analyzing, and Presenting Your Data
 The Company Rocks Excel 2003 PivotTables Summarizing, Analyzing, and Presenting Step-by-step instructions to accompany video lessons Danny Rocks 5/19/2011 Creating PivotTables in Excel 2003 PivotTables
Unit 21 Web design and prototyping
 2016 Suite Cambridge TECHNICALS LEVEL 3 IT Unit 21 Web design and prototyping A/507/5024 Guided learning hours: 60 Version 1 September 2015 ocr.org.uk/it LEVEL 3 UNIT 21: Web design and prototyping A/507/5024
Microsoft Excel Training - Course Topic Selections
 Microsoft Excel Training - Course Topic Selections The Basics Creating a New Workbook Navigating in Excel Moving the Cell Pointer Using Excel Menus Using Excel Toolbars: Hiding, Displaying, and Moving
Business & Marketing. Customised Training program (CTP)
") Business & Marketing Customised Training Programs (CTPs) In 2011/12 TafeSA trained over 80,000 students across 48 campuses in over 400 qualifications ranging from Certificate levels through to Advanced
Business & Marketing Customised Training Programs (CTPs) In 2011/12 TafeSA trained over 80,000 students across 48 campuses in over 400 qualifications ranging from Certificate levels through to Advanced
F9D7 04 (ESKWP2): Word Processing Software 2
: Word Processing Software 2") F9D7 04 (ESKWP2): Word Processing Software 2 4 SCQF credit points at SCQF level 5 Description: This is the ability to use a software application designed for the creation, editing and production of largely
F9D7 04 (ESKWP2): Word Processing Software 2 4 SCQF credit points at SCQF level 5 Description: This is the ability to use a software application designed for the creation, editing and production of largely
Preface of Excel Guide
 Preface of Excel Guide The use of spreadsheets in a course designed primarily for business and social science majors can enhance the understanding of the underlying mathematical concepts. In addition,
OCR LEVEL 3 CAMBRIDGE TECHNICAL
 Cambridge TECHNICALS OCR LEVEL 3 CAMBRIDGE TECHNICAL CERTIFICATE/DIPLOMA IN IT DATABASE DESIGN J/601/6617 LEVEL 3 UNIT 23 GUIDED LEARNING HOURS: 60 UNIT CREDIT VALUE: 10 DATABASE DESIGN J/601/6617 LEVEL
Monthly Payroll to Finance Reconciliation Report: Access and Instructions
 Monthly Payroll to Finance Reconciliation Report: Access and Instructions VCU Reporting Center... 2 Log in... 2 Open Folder... 3 Other Useful Information: Copying Sheets... 5 Creating Subtotals... 5 Outlining
Introduction to Pivot Tables in Excel 2003
 The Company Rocks Introduction to Pivot Tables in Excel 2003 Step-by-step instructions to accompany video lessons Danny Rocks 4/11/2011 Introduction to Pivot Tables in Excel 2003 Pivot Tables are the most
Calc Guide Chapter 9 Data Analysis
 Calc Guide Chapter 9 Data Analysis Using Scenarios, Goal Seek, Solver, others Copyright This document is Copyright 2007 2011 by its contributors as listed below. You may distribute it and/or modify it
Unit 2: Webpage creation (LEVEL 2)
") (LEVEL 2) Learning outcomes By completing this unit candidates will develop knowledge relating to the planning and creation of a multimedia website that is fit for purpose. Candidates will develop the
(LEVEL 2) Learning outcomes By completing this unit candidates will develop knowledge relating to the planning and creation of a multimedia website that is fit for purpose. Candidates will develop the
Getting Started with Excel 2008. Table of Contents
 Table of Contents Elements of An Excel Document... 2 Resizing and Hiding Columns and Rows... 3 Using Panes to Create Spreadsheet Headers... 3 Using the AutoFill Command... 4 Using AutoFill for Sequences...
3 What s New in Excel 2007
 3 What s New in Excel 2007 3.1 Overview of Excel 2007 Microsoft Office Excel 2007 is a spreadsheet program that enables you to enter, manipulate, calculate, and chart data. An Excel file is referred to
QCF. Residential childcare. Centre Handbook
 QCF Residential childcare Centre Handbook OCR Level 3 Diploma for Residential Childcare (England) Entry code 10405 OCR Level 5 Diploma in Leadership and Management for Residential Childcare (England) Entry
Excel Guide for Finite Mathematics and Applied Calculus
 Excel Guide for Finite Mathematics and Applied Calculus Revathi Narasimhan Kean University A technology guide to accompany Mathematical Applications, 6 th Edition Applied Calculus, 2 nd Edition Calculus:
Excel Database Management Microsoft Excel 2003
 Excel Database Management Microsoft Reference Guide University Technology Services Computer Training Copyright Notice Copyright 2003 EBook Publishing. All rights reserved. No part of this publication may
Unit 22 Big Data analytics
 2016 Suite Cambridge TECHNICALS LEVEL 3 IT Unit 22 Big Data analytics F/507/5025 Guided learning hours: 60 Version 1 September 2015 ocr.org.uk/it LEVEL 3 UNIT 22: Big Data analytics F/507/5025 Guided learning
Drawing a histogram using Excel
 Drawing a histogram using Excel STEP 1: Examine the data to decide how many class intervals you need and what the class boundaries should be. (In an assignment you may be told what class boundaries to
EXCEL FINANCIAL USES
 EXCEL FINANCIAL USES Table of Contents Page LESSON 1: FINANCIAL DOCUMENTS...1 Worksheet Design...1 Selecting a Template...2 Adding Data to a Template...3 Modifying Templates...3 Saving a New Workbook as
Mamut Enterprise Business Intelligence
 Mamut Business Software Additional Products & Enterprise Extensions Mamut Enterprise Business Intelligence Version 14 MBS.EXT.BIT.IE.2011.1 Mamut Enterprise Business Intelligence Contents Additional Products
FileMaker Pro and Microsoft Office Integration
 FileMaker Pro and Microsoft Office Integration page Table of Contents Executive Summary...3 Introduction...3 Top Reasons to Read This Guide...3 Before You Get Started...4 Downloading the FileMaker Trial
Microsoft. Access HOW TO GET STARTED WITH
 Microsoft Access HOW TO GET STARTED WITH 2015 The Continuing Education Center, Inc., d/b/a National Seminars Training. All rights reserved, including the right to reproduce this material or any part thereof
Excel Intermediate Session 2: Charts and Tables
 Excel Intermediate Session 2: Charts and Tables Agenda 1. Introduction (10 minutes) 2. Tables and Ranges (5 minutes) 3. The Report Part 1: Creating and Manipulating Tables (45 min) 4. Charts and other
Excel Integrated Reporting
 Excel Integrated Reporting Copyright statement Sage (UK) Limited, 2012. All rights reserved We have written this guide to help you to use the software it relates to. We hope it will be read by and helpful
Excel 2007 - Using Pivot Tables
 Overview A PivotTable report is an interactive table that allows you to quickly group and summarise information from a data source. You can rearrange (or pivot) the table to display different perspectives
How To Create A Powerpoint Intelligence Report In A Pivot Table In A Powerpoints.Com
 Sage 500 ERP Intelligence Reporting Getting Started Guide 27.11.2012 Table of Contents 1.0 Getting started 3 2.0 Managing your reports 10 3.0 Defining report properties 18 4.0 Creating a simple PivotTable
Microsoft Access 2010
 IT Training Microsoft Access 2010 Jane Barrett, IT Training & Engagement Team Information System Services Version 3.0 Scope Learning outcomes Learn how to navigate around Access. Learn how to design and
Excel 2013 - Using Pivot Tables
 Overview A PivotTable report is an interactive table that allows you to quickly group and summarise information from a data source. You can rearrange (or pivot) the table to display different perspectives
Using Excel for Analyzing Survey Questionnaires Jennifer Leahy
 University of Wisconsin-Extension Cooperative Extension Madison, Wisconsin PD &E Program Development & Evaluation Using Excel for Analyzing Survey Questionnaires Jennifer Leahy G3658-14 Introduction You
Understanding Start-Up Costs
 Understanding Start-Up Costs One of the many tasks you have to do when you plan to start any business is to calculate the initial costs involved in starting and operating your business. Almost every business
Microsoft Access 2010 Overview of Basics
 Opening Screen Access 2010 launches with a window allowing you to: create a new database from a template; create a new template from scratch; or open an existing database. Open existing Templates Create
GCSE Information and Communication Technology Assignments Short and Full Course
 GCSE Information and Communication Technology Assignments Short and Full Course First Teaching from Autumn 2004 First Examination from Summer 2006 FOREWORD The coursework in this booklet is set out in
How To Create A Report In Excel
 Table of Contents Overview... 1 Smartlists with Export Solutions... 2 Smartlist Builder/Excel Reporter... 3 Analysis Cubes... 4 MS Query... 7 SQL Reporting Services... 10 MS Dynamics GP Report Templates...
Word processing software
 Unit 244 Word processing software UAN: Level: 2 Credit value: 4 GLH: 30 Assessment type: Relationship to NOS: Assessment requirements specified by a sector or regulatory body: Aim: R/502/4628 Portfolio
Participant Guide RP301: Ad Hoc Business Intelligence Reporting
 RP301: Ad Hoc Business Intelligence Reporting State of Kansas As of April 28, 2010 Final TABLE OF CONTENTS Course Overview... 4 Course Objectives... 4 Agenda... 4 Lesson 1: Reviewing the Data Warehouse...
ECDL. European Computer Driving Licence. Spreadsheet Software BCS ITQ Level 2. Syllabus Version 5.0
 European Computer Driving Licence Spreadsheet Software BCS ITQ Level 2 Using Microsoft Excel 2010 Syllabus Version 5.0 This training, which has been approved by BCS, The Chartered Institute for IT, includes
Learners will develop skills in planning and managing information to produce an interactive website.
 Unit IT9: Website Design Level: 1 Unit type: IT Guided learning: 40 hours Unit in brief Learners will develop skills in planning and managing information to produce an interactive website. Unit introduction
Higher National Unit specification. General information for centres. IT in Business: Advanced Spreadsheets. Unit code: F849 35
 Higher National Unit specification General information for centres Unit title: IT in Business: Advanced Spreadsheets Unit code: F849 35 Unit purpose: This Unit is designed to develop in-depth technical
Accounting & Finance. Guidebook
 Accounting & Finance Guidebook January 2012 TABLE OF CONTENTS Table of Contents... 2 Preface... 6 Getting Started... 8 Accounting... 10 Accounting Welcome... 10 Sales Quotes... 11 New Sales Quote... 11
Cambridge International Certificate in Teaching and Learning 6208 Cambridge International Diploma in Teaching and Learning 6209
 Cambridge International Certificate in Teaching and Learning 6208 Cambridge International Diploma in Teaching and Learning 6209 Preface This syllabus sets out the details of the Certificate and Diploma
Reporting Manual. Prepared by. NUIT Support Center Northwestern University
 Reporting Manual Prepared by NUIT Support Center Northwestern University Updated: February 2013 CONTENTS 1. Introduction... 1 2. Reporting... 1 2.1 Reporting Functionality... 1 2.2 Creating Reports...
An introduction to using Microsoft Excel for quantitative data analysis
 Contents An introduction to using Microsoft Excel for quantitative data analysis 1 Introduction... 1 2 Why use Excel?... 2 3 Quantitative data analysis tools in Excel... 3 4 Entering your data... 6 5 Preparing
Key Stage 4 Programme of Study mapping against GCSE ICT Short Course
 mapping against GCSE ICT Short Course Our GCSE ICT Short Course specification covers the majority of the Programme of Study (with the intentional exception of section 4 Curriculum opportunities which is