urban Housing Market - Trends and Effects
|
|
|
- Jody Singleton
- 3 years ago
- Views:
Transcription
1 White Paper Driven to the Brink How the Gas Price Spike Popped the Housing Bubble and Devalued the Suburbs Joe Cortright, May 2008

2 Executive Summary The collapse of America s housing bubble and its reverberations in financial markets has obscured a tectonic shift in housing demand. Although housing prices are in decline almost everywhere, price declines are generally far more severe in far-flung suburbs and in metropolitan areas with weak close-in neighborhoods. The reason for this shift is rooted in the dramatic increase in gas prices over the past five years. Housing in cities and neighborhoods that require lengthy commutes and provide few transportation alternatives to the private vehicle are falling in value more precipitously than in more central, compact and accessible places. The gas price spike popped the housing bubble. Growth in housing prices was fueled by low and stable gas prices from 1990 through In early 2004, in inflation-adjusted terms, gas prices were lower than they had been in The higher price of gas has most affected suburban housing values. As measured by the change in housing prices over the last year, distant suburbs have seen the largest declines, while values in close-in neighborhoods have held up better, and in some cases continued to increase. Those metropolitan areas with the strongest core neighborhoods, measured by our index of relative core vitality, have seen the smallest declines in housing values at the metropolitan level. Vehicle miles traveled a key driver of energy demand and greenhouse gas emissions are down, reversing a 20-year upward trend. The new calculus of higher gas prices may have permanently reshaped urban housing markets. Now that the era of cheap gas is over, demand for development on the fringe is down, and consumer interest and market potential lie in developing and redeveloping neighborhoods closer to the urban core. This trend could lower vehicle miles traveled, reducing spending on energy, stimulating local economies, reducing the trade deficit, and ultimately enabling the nation to meet greenhouse gas goals. This is a huge opportunity for urban economic development if public policy responds. Land use planning that accommodates more mixed-uses in existing neighborhoods and transportation investments that provide people with more alternatives to auto travel can help accommodate these new market realities. Indeed, the regions with these characteristics, in the form of strong urban cores, have been the ones that have weathered the downturn in housing markets best. For decades, the growth of suburban housing was predicated on cheap gas. In effect, the low price of gas made sprawl economical. While predatory and sub-prime lending have been blamed for the housing crisis and have certainly contributed to the problem, another economic factor has been almost entirely overlooked in the timing and the geography of the nation s housing market implosion. The rise in gas prices from less than $1.10 in early 2002 to more than $3 today has dealt a major blow to consumer purchasing power and weighs most heavily on those metropolitan areas and those suburbs where people have to drive the farthest. Indeed, the decline in housing markets is strongly correlated with auto dependence. The run-up in gas prices has re-written the calculus of suburban housing economics in two key ways. First, there has been an income effect. Suburban households spend more of their income on 1

3 transportation, and gas in particular, and have, therefore, taken the biggest hit to household budgets from gas price increases. As a result, they have less income to spend on housing. Second, there has been a price effect. Because distant suburban housing requires more driving, potential buyers are now willing to bid less for houses at the suburban fringe. Many of the hallmarks of the current housing crisis will gradually fade in the months ahead. States and the federal government are already enacting curbs on the worst predatory practices and providing some relief to the hardest hit homeowners. The process of foreclosures, though painful now, will run its course. In contrast, the rise in gas prices has fundamentally altered the landscape of urban housing markets in a way that will not quickly be undone, barring an unforeseen collapse in oil prices. The new landscape of housing prices and high fuel costs has important implications for public policy. Cities that offer attractive urban living opportunities in close-in neighborhoods, enabling people to drive shorter distances and make convenient use of alternatives to car travel, are likely to be more affordable and economically successful than places that continue to follow sprawling development patterns. Working to promote land use patterns that enable mixed-use development and provide more bikeable, walkable neighborhoods served by transit will provide multiple benefits, including cutting gas bills, reducing the trade deficit and reducing global warming. 2

4 The Housing Bubble Has Popped It is now clear in retrospect that the United States has experienced a housing price bubble of significant proportions. Over the decade 1997 to 2006, average housing prices in the United States more than doubled, with the rate of housing price inflation (greater than 10 percent per year) running more than two and one-half times faster than the increase in per capita income (about 4 percent per year). 1 The acceleration of housing prices peaked in the third quarter of 2004, when housing prices rose at a rate of more than 20 percent over the prior year, as measured by the Case Shiller housing index. Although housing prices continued to rise for the next two years, the rate of house price inflation declined steadily. Housing prices peaked in the summer of 2006, at more than double their level of In the 18 months since the peak, housing prices nationally have declined 12.5 percent. The U.S. Housing Bubble Annual Housing Price Change 25% 20% 15% 10% 5% 0% -5% -10% -15% Source: Case-Shiller housing data Of course, many factors contributed to the formation of the bubble. The bubble was fueled by a perfect storm of loose monetary policy, speculation, lowered lending standards, questionable securitization of mortgages and predatory lending. In the wake of the 2001 recession, the Federal Reserve Board s expansionary monetary policy helped keep interest rates, especially for mortgages, relatively low. Lenders devised a whole new range of innovative and much riskier home loans for sub-prime borrowers, including adjustable rate loans, stated income loans and negative amortization schedules. The upward movement of housing prices created its own momentum, as speculators and even many first-time buyers built assumptions of future price increases into their financial planning. Parallel innovation in financial markets the securitization of home mortgages and the creation of new, unregulated products like structured investment vehicles masked risk rather than managing it (Yellen 2008). In many communities, predatory lenders used high prices and complex financing schemes to get homeowners to take huge risks. And many homeowners tapped the growing value of 3

5 their houses through home equity loans or refinancing to fund current consumption. For years, it seemed like housing prices could only go up. But starting in 2004, the rate of housing price inflation began to subside, and in 2007, housing prices declined nationally for the first time in the 40 years for which such records had been kept (Grynbaum 2008). The turnaround in housing price appreciation has led to a dramatic rise in mortgage delinquencies and foreclosures. In calendar year 2007, the rate of foreclosure increased by about 75 percent, and the Mortgage Bankers Association estimates that about 35 of every 1,000 mortgages are either 90 or more days delinquent or in the process of foreclosure (Mortgage Bankers Association 2008). Serious Delinquencies Have Doubled Serious Delinquencies Have Doubled Mortgages 90 or more days delinquent or in foreclosure, per 100 Mortgages Source: Mortgage Bankers Association The other signal economic event of the past few years has been the run up in oil prices. Throughout the years in which the housing boom accelerated, American households enjoyed low and stable gas prices. Oil prices declined in nominal terms in the 1980s and most of the 1990s, and the price of oil was generally less than $20 per barrel. In early 2002 gas prices were under $1.10 per gallon (in then current dollars). Although there were some fluctuations, and the price variability increased after 2000, in inflationadjusted terms, the price of gas was essentially unchanged from 1990 through Indeed, the average price of a gallon of regular gas, expressed in 2008 dollars, was $1.17 in January 2004, lower than it had been 13 years earlier, in February 1991, when prices were $1.20 per gallon (again, in 2008 dollars). 2 Since then, oil and gas prices have increased sharply. Adjusted for inflation, gas prices have doubled, from about $1.50 in 2008 dollars in 2004 to more than $3 per gallon today. 4

6 Real Gas Gas Prices, Prices, Long Long Stable, Stable, Have Doubled Have Doubled Since 2004 Since 2004 Real Price of Gasoline (Inflation Adjusted 2008 Dollars) $3.50 $3.00 $2.50 $2.00 $1.50 $1.00 $0.50 $ Source: Energy Information Administration The popping of the housing price bubble coincided with the run-up in gas prices. It can be argued that the magnitude of the increase in gas prices wasn t sufficient to offset the gains households were seeing in the housing market. In a more steady market, gas price increases might not have been enough to derail the housing boom, but in the heated atmosphere of the bubble, gas price increases may have been the trigger that broke the expectation of continued growth. The households most affected by the rise in gas prices were those who had stretched the family budget to buy a house on the suburban fringe, often commuting long distances in the process. These families spent a higher fraction of their income on gas than the typical household and had less flexibility to accommodate the higher price of gas than others. And for the same reasons, as gas prices rose, houses in these farflung neighborhoods tended to lose their market appeal first and fastest. 5

7 Housing Bubble Meets Meets the Gas the Price Gas Spike Price Spike Annual Housing Price Change 25% Real Price of Gas (2008$) $ % 15% 10% 5% 0% -5% -10% Hous ing G as oline $3.00 $2.50 $2.00 $1.50 $1.00 $ % Source: Case-Shiller housing data, Energy Information Administration gas price data $- Superimposing the data on gas prices with data for home price inflation illustrates the connection between the gas price spike and the deflation of the housing bubble. Home price inflation increased steadily from 1990 through 2006, with a brief slowdown during the recession of 2001 (shaded area on the chart). Gas prices, in real terms, were almost unchanged throughout the 1990s, fluctuated more following 2000, and like housing prices, eased during the 2001 recession. But when gas prices, in 2008 dollars, broke through the $2 per gallon mark in 2004, the rate of housing price inflation began to decline. As gas prices sustained this higher level and then increased in 2006 and 2007, first to $2.50 and then to $3, housing price inflation collapsed and, indeed, turned negative. Part of the nature of investment bubbles is irrational exuberance. For a time, rising prices help generate a self-reinforcing process. Higher prices prompt more investment and further drive up prices, convincing current (and prospective) investors of the validity of their investment. But at some point, some event triggers a change in this investment psychology. The timing of the rise in gas prices, though not the only possible explanation, closely squares with the peaking and deflation of the housing bubble. And unlike previous housing market declines, usually prompted by an increase in mortgage interest rates, housing finance actually tightened only after housing prices declined, not before. Even today, there seems to be very little correlation between the re-setting of adjustable rate mortgages and housing foreclosures (Yellen 2008). 6

8 The Geography of the Housing Downturn The pattern of housing price changes in the United States has been very different from place to place. Cities in Florida, the Southwest and a few cities in the industrial Midwest have seen some of the most severe declines. Other cities have seen much smaller declines, and a few markets, such as Charlotte, have continued to record housing price increases. Metro Housing Markets Markets Vary Substantially Vary Substantially Housing price changes, Year over Year, to January 2008 Miami Las Vegas Phoenix San Diego Los Angeles Detroit Tampa San Francisco Washington Minneapolis Cleveland Chicago New York Denver Atlanta Boston Dallas Seattle Portland Charlotte -25% -20% -15% -10% -5% 0% 5% Source: Case-Shiller Index Similarly, the pattern of delinquencies and foreclosures varies substantially among states and even within states. Foreclosure rates are relatively low in much of the nation s heartland. The highest incidences of foreclosure are found in Florida, Southern California, Nevada, Arizona and Colorado. But in each of these states, there are counties with foreclosure rates well below the national average. Foreclosures have struck many poor households and poor neighborhoods where households were particularly vulnerable to price declines and in many instances were victims of predatory lenders (Institute for a Competitive Inner City 2008). 3 7

9 Foreclosures by County, March 2008 Source: RealtyTrac.com While there are some idiosyncratic factors behind the decline in some markets, such as the continued weakness in the U.S. automobile industry that affects Detroit, the pattern of home price fluctuations is far from random. Housing markets have been much more resilient in the face of this national downturn in some places than in others. In particular, metropolitan areas with more vital urban cores have fared much better in the face of the housing downturn than metro areas with weak core neighborhoods. And in most markets for which there is a relationship between geography and price declines, more sprawling areas have seen significantly greater declines. Metropolitan Areas with Strong Cores Have Been Less Affected by Declines At the metropolitan level, those regions with vital urban cores have been far less affected by the decline in the housing market than those with weak cores. We measured core vitality using an index of the relative concentration of education levels of residents of close-in neighborhoods of large metropolitan areas. A rating of 100 percent on the core vitality index means that the educational level of adults residing in neighborhoods within 5 miles of the center of the central business district was the same as the educational level of the entire metropolitan area. Areas with core vitality ratings of less than 100 percent have relatively less well-educated residents in their close-in neighborhoods; areas with ratings over 100 percent have relatively better educated residents living in close-in neighborhoods. For each metropolitan area, we computed the change in housing prices between the fourth quarter of 2006 and the fourth quarter of Those metropolitan areas with the strongest urban cores 8

10 had the smallest decline in housing prices region-wide. Metropolitan areas with the weakest core neighborhoods had the largest declines in region-wide housing prices. For example, while Detroit, Phoenix and Las Vegas have relatively weak cores and weak price appreciation, Chicago, New York, Seattle and Portland all have strong cores and relatively much better housing price performance over the past year. Core Vitality Strongly Related Related to Housing to Housing Price Change Price Change Housing Price Change, Annual, through Fourth Quarter % -5% R 2 = CHA DAL ATL DEN PDX SEA NYCCHI -10% CLE BOS MSP -15% DCA SFO LAX TPA -20% DET PHX LVS SAN MIA -25% 0% 50% 100% 150% 200% Core Vitality Index Sources: Zillow.com, City Vitals A similar pattern holds for foreclosure activity. For each metropolitan area, we examined the level of housing foreclosures reported by RealtyTrac Inc. for calendar year 2007 (RealtyTrac Incorporated 2008). Those metropolitan areas with the strongest urban cores had the lowest levels of foreclosure activity region-wide. Metropolitan areas with the weakest core neighborhoods had the highest levels of foreclosures. Core Vitality Strongly Related Related to Foreclosures to Foreclosures Foreclosure Rate (Per 1,000 Households) 6% 5% DET LVS R 2 = % 3% CLE MIADEN ATL 2% 1% PHX LAX SAN TPA DAL CHA DCA MSP BOS SFO CHI NYCPDX SEA 0% 0% 50% 100% 150% 200% Core Vitality index Sources: RealtyTrac.com foreclosure data, City Vitals Relative Core Vitality 9

11 It is important to note that in both the case of price changes and foreclosure activity over the past year, the health of the overall housing market in the entire metropolitan area is strongly affected by the relative vitality of the urban core. Simply put, metropolitan areas with vibrant cores and closein neighborhoods have been far less affected by the collapse of housing markets. In contrast, those places with struggling urban cores ones that are no longer desirable locations for middle and upper income households are the ones that have born the brunt of the housing collapse. This pattern is consistent with the idea that metropolitan areas that have failed to protect or revitalize their urban core and close-in neighborhoods have made themselves more vulnerable to this particular housing cycle. Housing Prices Are Declining Fastest in the Suburbs Observers of local real estate markets have noticed that not all neighborhoods in a given metropolitan area are affected by the same degree by the housing downturn. Within metropolitan areas, it appears that markets on the suburban fringe are generally experiencing the greatest declines, and consumer demand remains relatively stronger for close-in properties. For example, while exurbs in places like Denver and Salt Lake City offer big houses on large lots at low prices, many buyers today are forsaking size for the conveniences of being close to the city, often in areas that are redeveloping (Opdyke 2008). Our analysis of intra-metropolitan patterns of housing price changes over the past year finds that prices have declined most in the most distant suburbs. On average, over the past 12 months, the decline in a neighborhood 12 miles from the center of the central business district is 2 to 4 percentage points greater than the decline in housing prices in neighborhoods 2 miles from the CBD. We explore neighborhood level data for five metropolitan areas in detail. These areas represent a cross-section of the nation s large metropolitan areas in terms of size, region of the country, and housing price trends. Chicago and Los Angeles are two of the nation s three largest markets. Los Angeles and Tampa are located in the two states that have been the epicenters of the housing bubble. Pittsburgh and Portland are somewhat smaller metropolitan areas in different regions of the country. Table: Characteristics of Selected Metropolitan Areas Metro Area Metro Area Population (Millions) 2006 Median Home Price (Thousands) 2007 Change in House Prices, Chicago % Los Angeles % Pittsburgh % Portland % Tampa % Sources: Population Census Bureau; Median home price and change in house prices Zillow.com. 10

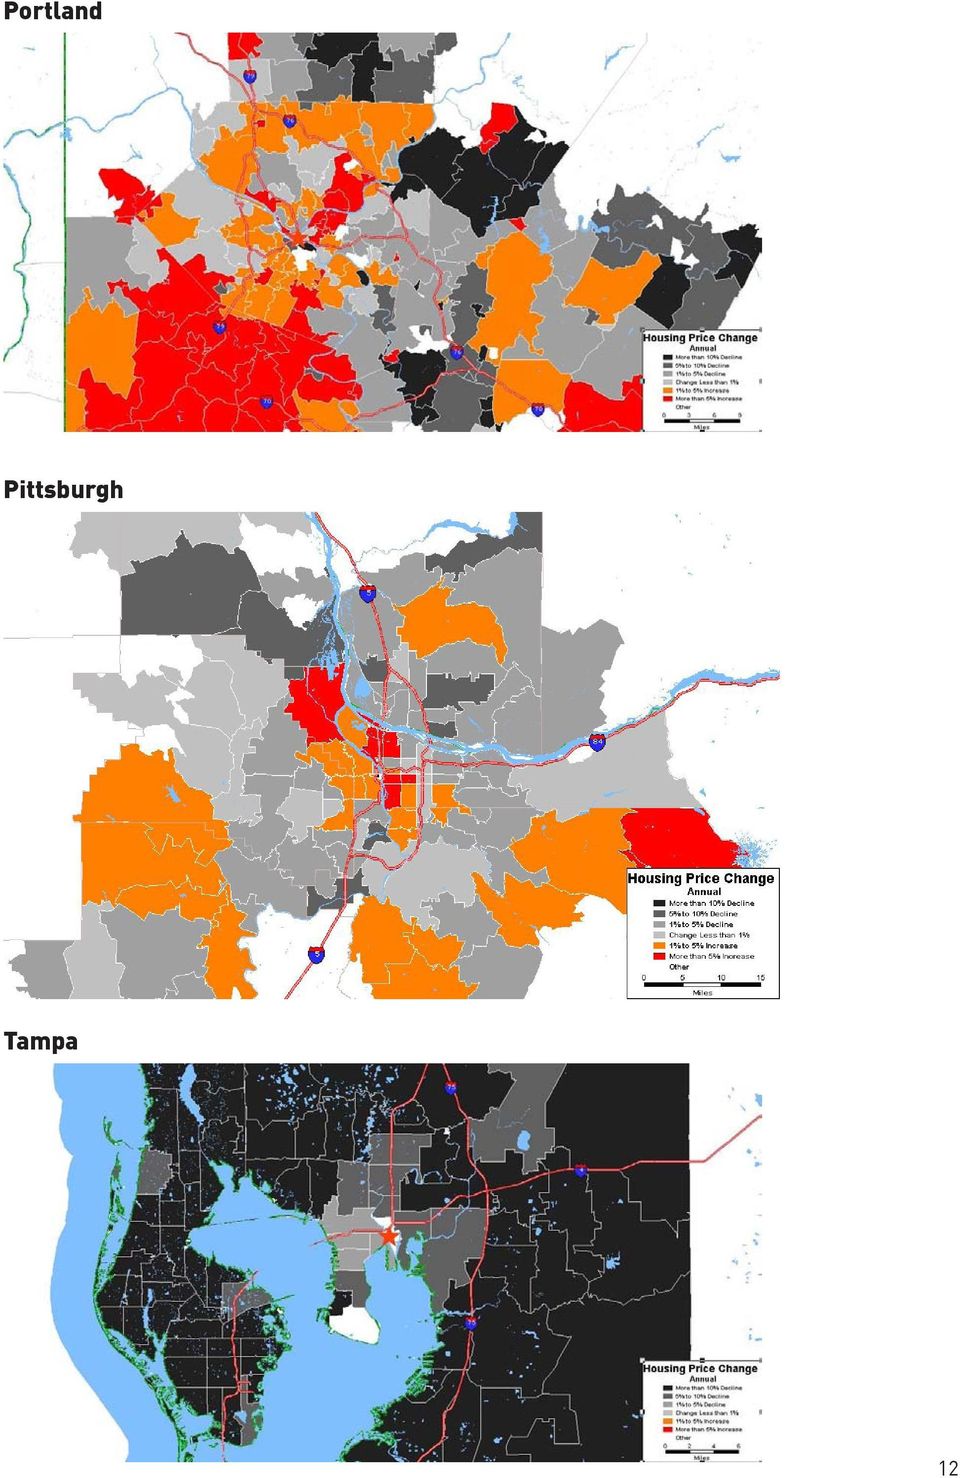
12 Our analysis begins by mapping the geographic pattern of housing price changes over the 12-month period from the fourth quarter of 2006 through the fourth quarter of Each of the following maps shows the average change in housing prices for each zip code area in each metropolitan area for this time period. Positive changes are shown in brighter, warmer colors (red and orange); declines are shown in shades of grey, with the greatest declines shown in black. At first glance, the far more widespread housing price declines in Los Angeles and Tampa are obvious. Almost the entire map for both of these metropolitan areas is shaded dark grey or black. Pittsburgh and Portland show areas of increases and decreases, and Chicago, while mostly grey, has some areas with noticeable gains. Chicago Los Angeles 11

13 Portland Pittsburgh Tampa 12
14 These bubble charts show the relationship between housing price changes, relative to the metropolitan average, and distance from the center of the region for five selected metropolitan areas. Housing price data are from Zillow.com for the 12-month period from the fourth quarter of 2006 to the fourth quarter of For each metropolitan area, price changes are shown as the difference between the price change in each zip code and the overall price change for the metropolitan area. (A zip code that had a price decrease or increase exactly equal to the metropolitan average would show a zero percent relative price change). Distances are computed from the center of each region s central business district to the geographic center of each zip code area. Bubble size corresponds to the number of housing units in each zip code. Housing Price Trends by Location Hous ing Prices Declines Greates t at the Suburban F ringe C h ic a g o M S A 15% Hous ing Prices Declines Greates t at the Suburban F ringe L o s A n g e le s C M S A 20% 10% 15% 10% 5% 0% Change in Housing Price 4Q06 to 4Q07-5% -10% Change in Median Single Family Home Price, Relative to MSA Median (Source: Zillow) Dis tance to Chicago CBD 5% 0% % Change in Housing Price 4Q06 to 4Q07-10% -15% Dis tance to Los Angeles CBD Change in Median Single Family Home Price, Relative to MSA Median (Source: Zillow) Hous ing Prices Declines Greates t at the Suburban Fringe P itts b u rg h M S A 20% 15% 10% 5% 0% -5% -10% Change in Housing Price 4Q06 to 4Q07-15% -20% Change in Median Single Family Home Price, Relative to MSA Median (Source: Zillow) Dis tance to P itts burgh CBD Hous ing Prices Declines Greates t at the Suburban F ringe Portland-Vancouver MS A 12% 10% 8% 6% 4% 2% 0% -2% -4% Change in Housing Price 4Q06 to 4Q07-6% -8% -10% Change in Median Single Family Home Price, Relative to MSA Median (Source: Zillow) Dis tance to P ortland CB D Hous ing Prices Declines Greates t at the Suburban Fringe T a m p a M S A 15% 10% 5% 0% -5% Change in Housing Price 4Q06 to 4Q07-10% -15% Dis tance to Tampa CBD Change in Median Single Family Home Price, Relative to MSA Median (Source: Zillow) 13
.")
15 While there is considerable variation in housing price changes at the zip code level, a clear pattern emerges in each of the five metropolitan areas: relative price changes are more likely to be positive the closer a zip code is to the center of the region. In general, the largest relative increases in housing prices are in zip codes in close-in areas, while the largest relative decreases are in zip codes in areas furthest from the center. It is possible to statistically summarize the data illustrated in the bubble charts. For each of these metropolitan areas, we have performed a simple linear regression to estimate the relationship between proximity to the center of a region and the relative change in housing prices. 4 A summary of these regression results is presented in the following table. Table: The Effect of Centrality on Housing Price Changes Change in Housing Prices Last 12 Months Region-wide Close-In Distant Metro Area Average Neighborhoods Neighborhoods Chicago -4% 0% -4% Los Angeles -11% -6% -10% Pittsburgh 0% 2% -5% Portland -1% 3% -5% Tampa -13% -9% -14% Source: Regression estimates based on zip code data; Close-in neighborhoods is the estimated change in value for a neighborhood 3 miles from the central business district; Distant neighborhoods are 13 miles from the central business district. Overall these regions experienced dramatically different changes in their housing markets over the past 12 months. Prices have fallen by more than 10 percent in Los Angeles and Tampa, are down about 4 percent in Chicago, and are almost unchanged in Portland and Pittsburgh. We ve used the regression data to estimate the average change in housing values for a close-in neighborhood (a neighborhood 3 miles from the center of the central business district) compared to a more distant neighborhood (a neighborhood 13 miles from the same point). In each case, housing prices fared worse in the more distant neighborhood. In Pittsburgh and Portland, prices in closein neighborhoods continued to increase, while prices in distant neighborhoods declined. In Los Angeles and Tampa, declines were significantly less in close-in neighborhoods than more distant neighborhoods. In Chicago, prices in close-in neighborhoods were steady, even though prices in more distant neighborhoods declined. 14

16 The disparity in price changes between the strongest neighborhoods (generally close to the center) and the weakest neighborhoods (usually close to the periphery of the region) is striking. For each of our five metropolitan areas, we identified a strong performing close-in neighborhood (identified by zip code) and a weak performing suburban neighborhood. We selected neighborhoods that were relatively close to the overall regional median housing price. These examples illustrate the range of different housing price trends experienced within a single metropolitan area over the last year. For example, the average house in the zip code in Chicago (5.6 miles from the downtown loop) appreciated from $374,000 to $410,000 (an increase of $36,000) between the fourth quarter of 2006 and the fourth quarter of A house in suburban Buffalo Grove (60089) that sold for the same price in 2006, declined by $30,000 over the course of the year. As a result of the relative price shifts, the suburban house, which was worth the same as the close-in house in late 2006, had declined in price relative to the close-in house by $66,000 in just 12 months. Housing Price Change for Selected High and Low Performing Zip Code Areas, Fourth Quarter 2006 to Fourth Quarter 2007 Distance from Central Business District Median Housing Price (Thousands) Metropolitan Area Zip Code - City Distance from Central Business District Change Chicago Chicago % Buffalo Grove % Los Angeles Los Angeles % Santa Clarita % Pittsburgh Pittsburgh New % Kensington % Portland Portland % Vancouver % Tampa Tampa % Ruskin % Source: Impresa analysis of Zillow.com data. In each of our other selected zip codes, the change in prices over just the last 12 months was sufficient to reverse the price ranking of the two neighborhoods. In each case, the suburban neighborhood was worth more than its close-in counterpart in late 2006 and worth significantly less than the close-in neighborhood in late In Los Angeles, a $500,000 home in close-in Los Angeles (90042) lost about $15,000 in value, while a slightly pricier home in distant Santa Clarita lost more than $85,000 in value. Close-in houses in Pittsburgh (15201) gained $12,000, while distant housing in New Kensington lost $16,000. Portland s close-in neighborhood gained $25,000 per home, while houses in suburban Vancouver s neighborhood lost $26,000 in value. A typical house in Tampa s neighborhood lost about $5,000 in value in 2007, while a similarly priced house in suburban Ruskin s neighborhood lost $45,000 in value. 15

17 The High Price of Gas Is Implicated in the Housing Decline The high cost of driving is implicated in the decline in suburban housing prices. The typical middleincome family in the United States spent $2,000 per year on gas in 2003 at a time when the price of gas averaged about $1.50 per gallon in current dollars. 5 Households that live in close-in urban neighborhoods generally live closer to their jobs and have more stores and services close at hand. Transit works better in cities, and the combination of higher density and better street connectivity means that it is easy and possible to make many trips by walking or biking. Even travel by car requires shorter trips. As a result, vehicle miles traveled per person decline dramatically with increased density. Vehicle travel and automobile expenditures are strongly associated with urban form. More compact, mixed-use communities have lower rates of vehicle ownership and car travel. Sprawling, lowdensity communities require more car travel and force households to spend a higher fraction of their incomes on transportation. In general, we know that density has a strong negative correlation with vehicle miles traveled. People in low-density suburbs drive much farther than people in cities (Bureau of Transportation Statistics 2003). The general standard for defining an urban core is about 1,000 persons per square mile, and an urbanized area can include surrounding areas with densities of about 500 persons per square mile. Within a given metropolitan area, those persons who live in the densest neighborhoods travel much less than those who live in the least dense neighborhoods. In one metropolitan area studied, those living in the densest 10 percent of all neighborhoods traveled only one-third as far as those who lived in the least dense 10 percent of all neighborhoods (Lawton 1999). Because they travel shorter distances than their suburban counterparts, urban residents end up spending less on gas. In the nation s 10 largest metropolitan areas, the typical city household buys about 200 fewer gallons of gas per year than the average of its suburban counterparts (Glaeser and Kahn 2008). For some families living on the urban fringe, the burden is even higher. A household with two or more cars living in an exurb could easily have a gas bill exceeding $500 per month. 6 Density reduces Reduces vehicle Vehicle miles Miles traveled Traveled Vehicle Miles Traveled R 2 = ,000 10, ,000 Persons per square mile, Block Group, (Log Scale) Sources: Computed from National Household Travel Survey,

18 The better accessibility provided by dense, close-in urban neighborhoods is reflected in housing markets. Houses with these attributes command higher prices. Controlling for house size, lot size, school quality and other neighborhood characteristics, a house 1 mile closer to the center of Austin, Texas, was worth $8,000 more than a house 1 mile farther away. Plus, each minute shaved off average commute times increased a house s value by $4,700 (Bina, Kockelman et al. 2006). In addition to travel time, most households also value the greater variety and easier access to a wide range of shopping, entertainment and services available in denser neighborhoods (Cortright 2007). The interplay between housing and transportation costs plays a critical role in explaining the pattern of decline in this housing market collapse. For many families, household location decisions can be thought of as a trade off between spending time and money on transportation and spending time and money on housing. Some locations in a metropolitan area, typically those closer to the center of the region, provide residents with better access to jobs, as well as to shopping, services and entertainment. As a result, most metropolitan areas exhibit what economists call a rent gradient. Rents are higher closer to the center and decline with distance. Households living on the periphery of the metropolitan area pay less in rent. These differences add up at the metropolitan level. Some metro areas have a compact and centralized development form, good transit and a favorable balance of jobs and housing across the region. Moving a typical household from a metropolitan area with the characteristics of Atlanta to an area like Boston would, on average, reduce its vehicle miles traveled by 25 percent (Bento, Cropper et al. 2003). There are wide variations across U.S. metropolitan areas in vehicle miles traveled. The average resident of Houston drives 36 miles per day, about 70 percent farther than the average resident of Pittsburgh, who drives about 21 miles per day (Federal Highway Administration 2008). Overall, the price of gas is a small share of the average household budget. But for families living on the suburban fringe, expenditures for transportation generally, and gas in particular, are much higher than for the average household. A case study of the Twin Cities estimates that households living in distant suburbs spend 30 percent of their household income on transportation, compared to about 20 percent for the typical household in the region. Households in close-in neighborhoods served by transit spend the least on transportation (Center for Transit Oriented Development and Center for Neighborhood Technology 2006). The trend for most of the last two decades has been toward increased travel. Relatively low and stable gas prices helped spur the growth of driving from 1982 through Rising incomes and declining costs of auto travel also fueled this growth in travel. Between 1984 and 2001, real per capita incomes increased by 28 percent, and the per mile cost of car travel fell by 42 percent (Polzin 2006). In the early 1980s, the average American drove fewer than 20 miles per day, but by 2004, this figure had increased to 27 miles per day, a trend that was tightly linked to continued low density sprawl and population decentralization. But in the past three years, vehicle travel per capita in the United States has begun to decline. According to the U.S. Department of Transportation, total vehicle miles traveled per person per day reached a peak of 27.6 in 2005 and declined to 27.2 in This represents a substantial departure from the trend established between 1990 and Vehicle travel is now about 1.5 miles per person, per day, below the 13-year trend. Despite an increasing population, the decline in driving per person has had the effect of reducing gas sales, which in early 2008 were down 1.1 percent from a year earlier (Campoy 2008). 17
.")
19 30 28 Car Travel Now Now Declining Declining Per Capita Per Capita Vehicle Miles Travelled Per Capita Per Day, United States 1990 to 2003 Trend Growth Source: Impresa calculations, US DOT data Economists who have studied travel behavior and energy consumption agree that consumer responses to gas price changes are greater in the long run than in the short run. There are very few things, other than combining trips or forsaking travel, that consumers and workers can do in the short run to reduce their travel. But over a longer period of time, consumers can do much to lower their travel and gas consumption. Decisions about where to live or work, which neighborhood to move to and which job to take all profoundly influence travel behavior in the long run. Studies estimate that while gas consumption might decline only about 2 to 3 percent in response to a 10 percent increase in fuel prices in the short run, in the long run, gas consumption would be likely to decline 8 to 10 percent in response to that level of increase (Congressional Budget Office 2002). Some of the reduction in consumption comes from shifting to more efficient vehicles, but a 10 percent increase in gas prices is estimated to produce a long term reduction of 1 to 3 percent in vehicle miles traveled (Litman 2008). Consequently, as the new era of high gas prices persists, it seems likely that we will see further declines in gas consumption and vehicle miles traveled by the average American. In some markets, it appears that this process has been playing itself out even before the big run up in gas prices. In Portland, Ore., for example, housing in older, close-in neighborhoods has appreciated faster than newer, larger houses in more distant, sprawling neighborhoods. Older, smaller houses sold at a 10 percent discount relative to newer houses in 2000; by 2006, these older, smaller houses sold at a 1 percent premium to the larger, newer houses in the region (Hohndel, Conder et al. 2008) Even today, every metropolitan area has neighborhoods that have the combination of density, a mix of land uses and transportation alternatives that enable households to travel less. Almost all of these places are located in the more central and close-in neighborhoods of these metropolitan areas. Maps of our five regions, developed by the Center for Neighborhood Technology, based on census data and models of travel behavior show much lower levels of travel (lighter colors) in metro core areas, and much higher levels of travel (darker colors) on the suburban fringe. 18

20 Vehicle Miles Traveled by Neighborhood Chicago Los Angeles Pittsburgh Portland Tampa Housing + Transport Index by Block Group Model Data Vehicle Miles Traveled per Household Data not available 0 to 12,000 miles 12,000 to 14,000 miles 14,000 to 16,000 miles 16,000 to 18,000 miles Greater than or equal to 18,000 miles Maps Copyright (C) Center for Neighborhood Technology, Used with permission. Because they travel farther, households in the suburbs also end up spending a larger fraction of their household income on transportation than those living in close-in neighborhoods. Again, in close-in neighborhoods the share of total income spent on transportation tends to be low (lighter colors), while it is common for the share of income household income spent on transportation to be much higher (darker colors) on the periphery of the region. 19

21 Transportation Spending by Neighborhood Chicago Los Angeles Pittsburgh Portland Tampa Housing + Transport Index by Block Group Model Data Transportation Costs as Percent of Income Data not available 0 to 15% 15 to 18% 18 to 20% 20 to 28% Greater than or equal to 28% Maps Copyright (C) Center for Neighborhood Technology, Used with permission. 20
22 In light of the recent turbulence in both energy and housing markets, it is difficult to reliably forecast the future. The best current thinking is that housing markets may have further to fall and that energy prices are likely to remain high. The federally supported mortgage lender Freddie Mac predicts that U.S. housing prices will continue to decline through 2009, with a cumulative peak to trough decline of between 18 to 23 percent, measured by the Case-Shiller price index (Freddie Mac 2008). The U.S. Department of Energy s latest forecast for annual oil prices in 2009 is $92 per barrel compared to a 2007 average of $72 per barrel (Energy Information Administration 2008). Given that both these forecasts represent marked changes from the housing and energy outlooks of just a few years ago, it seems likely that the pattern of changes we are seeing in consumer behavior, with proportionately larger housing price declines in outlying suburbs and decreased driving, are likely to continue into the future. Policy Implications - The relative decline in prices in sprawling suburbs is likely to persist because of the continued high price of gas, and governments should plan accordingly. - The market for higher density and redevelopment in close-in neighborhoods is likely to grow stronger, and local land use plans should accommodate this shift. - Government can help families save money by making it easy and convenient to live in mixed-use, close-in neighborhoods served by transit. - Reducing vehicle miles traveled not only saves families money, households that drive less have more to spend on other things, stimulating the local economy. Additionally, reducing oil consumption not only cuts greenhouse gas emissions but lowers the trade deficit. - Many distant exurban developments may no longer be economical, and propping up building and homeownership in these areas encourages unsustainable settlement that makes families even more vulnerable to future gas price increases. The collapse of the housing bubble, punctured by the gas price spike, marks a watershed point for the nation s suburbs. When gas was cheap, buying a house in a distant suburb where housing prices were cheaper seemed like an affordable housing choice for many families. But as the more severe decline in housing prices on the urban fringe over the past year illustrates, $3 a gallon gas has made low density development a false economy across the nation. But the gas price shock signals more than just a temporary disruption in housing markets. The resilience, and in many markets appreciation of housing prices in close-in neighborhoods, point the way to a new, more economically and environmentally sustainable pattern of development for the nation. By developing and redeveloping our urban centers and close-in neighborhoods, we can help families reduce their vehicle travel, in turn reducing spending on gas and thereby reducing national energy consumption (and our trade deficit). While it may be premature to predict that the nation s suburbs will become ghost towns or slums (Leinberger 2008), it seems clear that the trend toward ever increasing sprawl is ebbing. It seems apparent, though, that the shift in the relative attractiveness of suburbs could greatly reshape the 21
23 distribution of population within and among metropolitan areas. In just the past year, migration to several previously fast growing exurban counties has reversed, and many city and inner suburban counties have seen reductions in out-migration, or have realized actual population gains (Frey 2008). In cities across the United States, living in denser, revitalized neighborhoods is becoming increasingly popular. In the future the most desirable places to live may be in the urban core (Brueckner 2005). In crafting responses to the current foreclosure crisis, the federal government should pay attention to the new market realities, rather than simply bailing out the homebuilders and homebuyers who built and bought the economically unsustainable housing on the urban fringe. Lower housing prices at the suburban fringe represent a real market shift in the private and social value of very low density development. Over time, reducing gas use by promoting higher density and shorter trips can pay important economic and environmental dividends. At today s prices, the nation s net imports of oil run about $1 billion per day. The nation s oil import bill has increased nearly six-fold since 1999 and is equal to about half the total trade deficit (Bureau of Economic Analysis 2008). Energy use related to transportation is also responsible for more than one-third of the nation s production of greenhouse gases. Shifting more development from sprawling suburbs to denser urban areas will reduce greenhouse gas emissions (Glaeser and Kahn 2008). Over a period of years, individual households have substantial alternatives to reduce their energy consumption. Households can, for example, purchase vehicles with higher fuel efficiency. But the high mobility of American households also gives them huge opportunities to reduce their fuel consumption. The average American moves once every seven years. Even before the big run up in gas prices, many Americans were already moving to take a new job or to shorten their commute to an existing job. In 2005, about 4 million people moved in connection with a new job and 1.3 million people moved to shorten their commute (Bureau of the Census 2006). A 2005 Harris Poll showed that 28 percent of the population responded to high gas prices by looking for a place to live closer to work (Harris Interactive Incorporated 2005). A Gallup poll taken in 2007 showed that 10 percent of the population reported changing jobs to shorten their commute in response to higher gas prices (Overberg and Copeland 2007). The opportunity for moving households closer to their jobs is prodigious. One estimate is that typical households drive three to seven times farther than the nearest similar neighborhood to their place of work (Anas, Arnott et al. 1998). In many ways, this is simply the mirror image of the extreme commuting phenomenon that developed in the 1990s. A small (but widely reported) group of households reported living 50 or more miles from their place of work and commuting 90 or more minutes each way to work daily (Howlett and Overberg 2004). While this may have made sense to some households when gas was priced at less than $1.50 a gallon (in today s prices) it is plainly uneconomical today. Until now, inexpensive gas coupled with relatively low levels of congestion has encouraged households to look far and wide for housing. In the years ahead the typical household will seek housing that is more convenient to their place of work. While this is a far from instantaneous answer to high gas prices, over a period of years it can markedly reduce the total amount of vehicle miles traveled and the gas consumption of the average household. Our own history suggests that we can enjoy comfortable lifestyles with far less driving. The typical American had a relatively high standard of living in the late 1980s, when per capita daily driving was a 22
24 third less than it is today. There is strong evidence to suggest that the increased amount of time spent driving since then has actually made people worse off, rather than happier (Stutzer and Frey 2004). Indeed, driving less can actually be a key ingredient in encouraging additional urban development. In Portland, a city where per capita travel is 15 percent lower than in the typical large U.S. metropolitan area, it is estimated that the region s residents save more than $1 billion annually in out-of-pocket costs for vehicles and fuel, money that is available to be re-spent elsewhere in the local economy (Cortright 2007). Over the next two decades, moving toward a pattern of more compact development could make a profound contribution to the nation s efforts to reduce global warming. The baseline projections for future emissions assume that the historical growth of vehicle miles traveled continues unabated for the next two decades, that after the current pause, vehicle miles traveled per person per day will grow from 25.2 in 2008 to 30.5 in Simply avoiding this projected increase in travel would make a significant contribution to the nation s efforts to conserve energy and reduce greenhouse gas emissions. One way of achieving this objective will be to change land use patterns so that people don t have to travel as far. While much attention has been devoted to green buildings, transportation generated by a typical office building uses about 30 percent more energy than does the building itself (Wilson 2007). Infill projects and redevelopment of central city neighborhoods can reduce daily travel by as much as two-thirds from current sprawling patterns (Ewing, Bartholomew et al. 2008). Americans are ready. In public opinion polls taken in late 2007, wide majorities of the nation s population agreed with statements favoring greater density and redevelopment of the nation s urban centers and close-in neighborhoods. By a margin of 81 percent to 14 percent, respondents favored additional development in existing neighborhoods rather than continued suburban sprawl as a way of accommodating future population growth. A majority of respondents favored additional mixed-use redevelopment (Ulm 2007). The data presented here provide an initial glimpse into an emerging trend in real estate markets. Much more could be done to extend and refine our understanding of these changes in housing demand and the opportunities and challenges they present for public policy and the private housing market. Consumers and policy makers are taking a growing interest in better understanding measures of accessibility. In this report, we ve used a simple measure of centrality (distance to the center of the urban area), but it is just one measure of the kind of urban qualities that foster shorter trips. We also know that greater density, mixed-use development and better jobs/housing balance can reduce vehicle miles of travel. New measures, like the website WalkScore.com let consumers measure the accessibility of different housing choices to common destinations like stores, schools, cafes and libraries. More comprehensive and precise measures of metropolitan and neighborhood accessibility could be used by policy makers to guide public investment and urban redevelopment efforts. 23
25 Data and Methodology Data from this report have been compiled from a number of sources that track current developments in housing and financing markets. Standard and Poor s Case-Shiller Housing Index is a repeat sales index of housing prices covering the 20 large metropolitan markets in the United States (Standard and Poors Incorporated 2008). Zillow.com analyzes home sales data and constructs a Zindex of housing prices for states, metropolitan areas and zip code areas throughout the United States (Zillow.com 2008). We examined Zillow s zip code data on housing price changes between the fourth quarter of 2006 and the fourth quarter of 2007, the latest 12-month period for which data was available. Zillow s census tract level estimates are not available in a number of states including Missouri and Texas; as a result, metropolitan areas in these states are not considered in our analysis. We use Zillow s data for single family residential dwellings to ensure that our results are not affected by localized concentrations of multi-family (condominium) units. We gratefully acknowledge the permission granted by the Center for Neighborhood Technology to reproduce maps of vehicle miles traveled and household spending on transportation in this report. More information about their Housing and Transportation Affordability measures can be found at their website: In our analysis of spatial patterns of price changes within metropolitan areas, we regressed the change in housing prices over the last 12 months on the distance between each zip code center-point and the center of each metropolitan area s central business district. Distances were computed using the Maptitude Geographic Information System (GIS) software package. Our regressions excluded zip code areas with fewer than 4,000 housing units. Regressions were weighted by the number of housing units in each zip code. Our earlier report, City Vitals, computed an index of core vitality for each of the nation s 50 most populous metropolitan areas (Cortright 2006). The core vitality measure used in this report is the relative educational attainment of adults residing in close-in neighborhoods compared to the attainment level for the entire metropolitan area. Again, using GIS software, we computed the fraction of adults residing within 5 miles of the center of the Central Business District who had completed a four-year college degree in each metropolitan area, and divided that by the overall fraction of adults in that metropolitan area who had completed a four-year degree. For more details on this measure, see City Vitals (page 59). 24
Two miles per day may not seem like much, but do the math.
 February 2008 Chicago sgreen Dividend Joe Cortright jcortright@impresaconsulting.com Senior Policy Advisor, CEOs for Cities Chicago has placed an increasing emphasis on pursuing green policies in recent
More than Just Curb Appeal Factors that affect the Housing Market
 Insight. Education. Analysis. M a r c h 2 0 1 5 More than Just Curb Appeal Factors that affect the Housing Market By Kevin Chambers Not only is buying a house usually the largest purchase anyone will make,
Zillow Negative Equity Report
 Overview The housing market is finally showing signs of life, with many metropolitan areas having hit the elusive bottom and seeing home value appreciation, however negative equity remains a drag on the
Beginning in the late 1990s, U.S. housing prices rose substantially and subsequently fell
 The Boom and Bust of U.S. Housing Prices from Various Geographic Perspectives Jeffrey P. Cohen, Cletus C. Coughlin, and David A. Lopez This paper summarizes changes in housing prices during the recent
major contributors to their economic well-being. Because New Yorkers drive substantially
 April 2010 York City sgreen Dividend Joe Cortright jcortright@impresaconsulting.com Senior Policy Advisor, CEOs for Cities It s no secret that York City s high density, extensive transit and excellent
First Time Underwater
 First Time Underwater The Impact of the First-time Homebuyer Tax Credit Dean Baker April 2012 Center for Economic and Policy Research 1611 Connecticut Avenue, NW, Suite 0 Washington, D.C. 20009 202-293-53
Salt Lake Housing Forecast
 2015 Salt Lake Housing Forecast A Sustainable Housing Market By James Wood Director of the Bureau of Economic and Business Research Commissioned by the Salt Lake Board of REALTORS By year-end 2013 home
The Obama Administration s Efforts To Stabilize the Housing Market and Help American Homeowners
 The Obama Administration s Efforts To Stabilize the Housing Market and Help American Homeowners February 2015 U.S. Department of Housing and Urban Development Office of Policy Development and Research
The State of Mortgage Lending in New York City
 The State of Mortgage Lending in New York City Mortgage lending trends provide an important window into the housing market and the changing availability of credit, both of which have been profoundly affected
HOUSING MARKETS HOUSING CONSTRUCTION TRENDS JOINT CENTER FOR HOUSING STUDIES OF HARVARD UNIVERSITY
 2 HOUSING MARKETS Although the news was mixed in 214, housing markets made some advances that set the stage for moderate growth. Singlefamily construction continued to languish, but multifamily construction
Licensed by the California Department of Corporations as an Investment Advisor
 Licensed by the California Department of Corporations as an Investment Advisor The Impact of the Alternative Minimum Tax (AMT) on Leverage Benefits My associate Matthias Schoener has pointed out to me
Milwaukee s Housing Crisis: Housing Affordability and Mortgage Lending Practices
 Milwaukee s Housing Crisis: Housing Affordability and Mortgage Lending Practices by John Pawasarat and Lois M. Quinn, Employment and Training Institute, University of Wisconsin-Milwaukee, 2007 This report
Spotlight on the Housing Market in the Orlando-Kissimmee-Sanford, FL MSA
 Spotlight on in Orlando-Kissimmee-Sanford, FL MSA The Orlando-Kissimmee-Sanford, FL Metropolitan Statistical Area (Orlando MSA) is located in central Florida and includes four counties: Lake, Orange, Osceola,
Multifamily Market Commentary July 2014 The Nation s Aging Multifamily Housing Stock
 Multifamily Market Commentary July 2014 The Nation s Aging Multifamily Housing Stock Although America s population is rising at its slowest pace in more than 70 years, and it has taken 76 months for employment
Federal Reserve Bank of Kansas City: Consumer Credit Report
 Federal Reserve Bank of Kansas City: Consumer Credit Report Tenth District Consumer Credit Report May 29, 2015 By Kelly Edmiston, Senior Economist and Mwai Malindi, Research Associate FIRST QUARTER 2015
PRESS RELEASE. Home Price Gains Lead Housing According to the S&P/Case-Shiller Home Price Indices
 Home Price Gains Lead Housing According to the S&P/Case-Shiller Home Price Indices New York, July 28, 2015 today released the latest results for the S&P/Case-Shiller Home Price Indices, the leading measure
The Obama Administration s Efforts To Stabilize the Housing Market and Help American Homeowners
 The Obama Administration s Efforts To Stabilize the Housing Market and Help American Homeowners March 2015 U.S. Department of Housing and Urban Development Office of Policy Development and Research U.S
Federal Reserve Monetary Policy
 Federal Reserve Monetary Policy To prevent recession, earlier this decade the Federal Reserve s monetary policy pushed down the short-term interest rate to just 1%, the lowest level for many decades. Long-term
The Strategic Assessment of the St. Louis Region
 The Strategic Assessment of the St. Louis Region 7th Edition, 2015 WHERE The 7th Edition of Where We Stand (WWS) presents 222 rankings comparing St. Louis to the 50 most populated metropolitan areas in
The Obama Administration s Efforts To Stabilize The Housing Market and Help American Homeowners
 The Obama Administration s Efforts To Stabilize The Housing Market and Help American Homeowners July 2014 U.S. Department of Housing and Urban Development Office of Policy Development and Research U.S
Summary. Abbas P. Grammy 1 Professor of Economics California State University, Bakersfield
 The State of the Economy: Kern County, California Summary Abbas P. Grammy 1 Professor of Economics California State University, Bakersfield Kern County households follow national trends. They turned less
The Obama Administration s Efforts To Stabilize The Housing Market and Help American Homeowners
 The Obama Administration s Efforts To Stabilize The Housing Market and Help American Homeowners April 2014 U.S. Department U.S Department of Housing of Housing and Urban and Urban Development Development
Owner spending on improvements to existing homes also rose over the past year. Benefiting from strengthening house sales, CONSTRUCTION RECOVERY
 2 Housing Markets After another year of healthy growth in 213, the housing market paused in the first quarter of 214. The renewed weakness in residential construction, sales, and prices raised fears that
IN THEOR Y, PUBLIC INVESTMENTS IN MASS TRANSIT CAN MAKE URBAN
 Can Public Transportation Increase Economic Efficiency? M AT T H E W D R E N N A N A N D C H A R L E S B R E C H E R IN THEOR Y, PUBLIC INVESTMENTS IN MASS TRANSIT CAN MAKE URBAN economies more efficient
S&P/Case-Shiller Home Price Indices
 Home Prices in the New Year Continue the Trend Set in Late 2009 According to the S&P/Case-Shiller Home Price Indices New York, March 30, 2010 Data through January 2010, released today by Standard & Poor
PRESS RELEASE. Home Prices Grew at Twice the Rate of Inflation in 2014 According to the S&P/Case-Shiller Home Price Indices
 Home Prices Grew at Twice the Rate of Inflation in 2014 According to the S&P/Case-Shiller Home Price Indices New York, February 24, 2015 today released the latest results for the S&P/Case-Shiller Home
Housing Markets in Six Metropolitan Areas and their Main Central Cities
 Housing Markets in Six Metropolitan Areas and their Main Central Cities Rolf Pendall Director, Metropolitan Housing and Communities Policy Center, The Urban Institute Housing issues and opportunities at
The goal is to transform data into information, and information into insight. Carly Fiorina
 DEMOGRAPHICS & DATA The goal is to transform data into information, and information into insight. Carly Fiorina 11 MILWAUKEE CITYWIDE POLICY PLAN This chapter presents data and trends in the city s population
ARLA Members Survey of the Private Rented Sector
 Prepared for The Association of Residential Letting Agents ARLA Members Survey of the Private Rented Sector Fourth Quarter 2013 Prepared by: O M Carey Jones 5 Henshaw Lane Yeadon Leeds LS19 7RW December,
District of Columbia State Data Center Quarterly Report Summer 2007
 District of Columbia State Data Center Quarterly Report Summer 2007 Commuting to Work: Bike? Walk? Drive? Introduction by Joy Phillips Robert Beasley In 2005, 45 percent of District residents drove to
The Impact of Lock-In Effects on Housing Turnover and Implications for a Housing Recovery
 W RESEARCH BRIEF The Impact of Lock-In Effects on Housing Turnover and Implications for a Housing Recovery FEBRUARY 2014 TABLE OF CONTENTS SECTION I Introduction 3 SECTION II Background Lock-In Effects
HOMEOWNERSHIP HOMEOWNERSHIP TRENDS NEIGHBORHOOD LOSSES JOINT CENTER FOR HOUSING STUDIES OF HARVARD UNIVERSITY
 4 HOMEOWNERSHIP The downtrend in homeownership stretched to a decade in 214. Rates fell across nearly all age groups, incomes, household types, and markets despite the affordability of first-time homebuying.
Sustained Recovery in Home Prices According to the S&P/Case-Shiller Home Price Indices
 PRESS RELEASE Sustained Recovery in Home Prices According to the S&P/Case-Shiller Home Price Indices New York, December 26, 2012 Data through October 2012, released today by S&P Dow Jones Indices for its
The Young and Restless in Detroit
 The Young and Restless in Detroit Summary The Young and Restless 25 to 34 year olds with a bachelor s degree or higher level of education, are economically important and are fueling the growth of many
Facts and Figures on the Middle-Class Squeeze in Idaho
 Facts and Figures on the Middle-Class Squeeze in Idaho For hard-working, middle-class families all over the country, life during the Bush presidency has grown less affordable and less secure. President
Has an Unavoidable Decline in Home Prices Begun?
 Has an Unavoidable Decline in Home Prices Begun? October 6, 2014 by Keith Jurow In late September, the former head of Goldman Sachs housing research team sent a lengthy report to President Obama. In it,
Why home values may take decades to recover. by Dennis Cauchon, USA TODAY
 Why home values may take decades to recover by Dennis Cauchon, USA TODAY 200 180 160 140 120 100 80 The history of housing as an investment 1950 1952 1954 1956 1958 1960 1962 1964 1966 1968 1970 1972 1974
FRBSF ECONOMIC LETTER
 FRBSF ECONOMIC LETTER 2012-25 August 20, 2012 Consumer Debt and the Economic Recovery BY JOHN KRAINER A key ingredient of an economic recovery is a pickup in household spending supported by increased consumer
INSIGHT on the Issues
 INSIGHT on the Issues Housing for Older Adults: The Impacts of the Recession Rodney Harrell, PhD AARP Public Policy Institute This paper summarizes findings from State Housing Profiles 2011 (www.aarp.org/statehousingprofiles),
Economic Outlook 2009/2010
 Economic Outlook 29/21 s Twenty-Eighth Annual Forecast Luncheon Paul R. Portney Dean, Professor of Economics, and Halle Chair in Leadership Marshall J. Vest Director Economic and Business Research Center
US HOUSING MARKET MONTHLY
 US HOUSING MARKET MONTHLY th Oct. Editor: Ed Stansfield New build sales finally making some headway Overview: The drop in mortgage rates towards the end of September has given mortgage applications a boost,
2014 Fourth Quarter & Full Year Refinance Report Borrowers Who Refinanced in 2014 to Save Approximately $5 Billion in Interest Payments
 2014 Fourth Quarter & Full Year Refinance Report Borrowers Who Refinanced in 2014 to Save Approximately $5 Billion in Interest Payments As the origination market evolves from a refinance boom to a purchasemoney
Rural America At A Glance
 United States Department of Agriculture Rural America At A Glance 2014 Edition Overview While the U.S. economy is now in its sixth year of recovery from the Great Recession of 2007-09, its performance
In 1992, the US Congress authorized the Moving to Opportunity (MTO) housing voucher
 housing voucher") A Driving Factor in Moving to Opportunity EVELYN BLUMENBERG AND GREGORY PIERCE In 1992, the US Congress authorized the Moving to Opportunity (MTO) housing voucher program to operate in five large metropolitan
A Driving Factor in Moving to Opportunity EVELYN BLUMENBERG AND GREGORY PIERCE In 1992, the US Congress authorized the Moving to Opportunity (MTO) housing voucher program to operate in five large metropolitan
Obama Administration Efforts to Stabilize the Housing Market and Help American Homeowners
 The Obama Administration s Efforts To Stabilize The Housing Market and Help American Homeowners March 21 U.S. Department of Housing and Urban Development Office of Policy Development Research U.S Department
Spotlight on the Housing Market in the Las Vegas-Henderson-Paradise, NV MSA
 Spotlight on the in the Las Vegas-Henderson-Paradise, NV MSA The Las Vegas-Henderson-Paradise, NV Metropolitan Statistical Area (Las Vegas MSA) is located at the southern tip of Nevada and contains the
PRESS RELEASE. Home Prices Continue Upward Trend According to the S&P/Case-Shiller Home Price Indices
 Home Prices Continue Upward Trend According to the S&P/Case-Shiller Home Price Indices New York, August 25, 2015 today released the latest results for the S&P/Case-Shiller Home Price Indices, the leading
Multifamily Housing: Sustainable Development in Efficient, Walkable Communities
 Multifamily Housing: Sustainable Development in Efficient, Walkable Communities by the Greater Charlotte Apartment Association Multifamily rental housing is a critical piece of the housing market in the
Investment Symposium March 14-15, 2013 New York, NY. Session E5, U.S. Economic Conditions and the Housing/Mortgage Market
 Investment Symposium March 1-15, 213 New York, NY Session E5, U.S. Economic Conditions and the Housing/Mortgage Market Moderator: Jonathan Glowacki Presenter: David Berson Housing & Mortgage Market Outlook
Historically, employment in financial
 Employment in financial activities: double billed by housing and financial crises The housing market crash, followed by the financial crisis of the 2007-09 recession, helped depress financial activities
PRESS RELEASE. Widespread Gains in Home Prices for February According to the S&P/Case-Shiller Home Price Indices
 Widespread Gains in Home Prices for February According to the S&P/Case-Shiller Home Price Indices New York, April 28, 2015 today released the latest results for the S&P/Case-Shiller Home Price Indices,
The Obama Administration s Efforts To Stabilize The Housing Market and Help American Homeowners
 The Obama Administration s Efforts To Stabilize The Housing Market and Help American Homeowners August 2013 U.S. Department of Housing and Urban Development Office of Policy Development Research U.S Department
Housing: Before, During, And After The Great Recession
 SEPTEMBER 2014 Housing: Before, During, And After The Great Recession Demetrio M. Scopelliti Homeownership symbolizes the American dream. The home we live in often represents how we choose to live our
S&P/Case-Shiller Home Price Indices
 August 2008 S&P/Case-Shiller Home Price Indices Frequently Asked Questions 1. What do the S&P/Case-Shiller 1 Home Price Indices measure? The indices are designed to be a reliable and consistent benchmark
Real Estate Trends. in the Sacramento Region. Key Points
 Real Estate Trends The opening of Golden 1 Center in the fall of 2016 will certainly be one of the most significant events in recent Sacramento history. Golden 1 Center Downtown Sacramento photo credit:
Findings: City of Tshwane
 Findings: City of Tshwane What s inside High-level Market Overview Housing Performance Index Affordability and the Housing Gap Leveraging Equity Understanding Housing Markets in Tshwane, South Africa High-level
HUD PD&R WORKING PAPER 10-01 U.S. Rental Housing Characteristics: Supply, Vacancy, and Affordability. By Rob Collinson and Ben Winter January 2010
 HUD PD&R WORKING PAPER 10-01 U.S. Rental Housing Characteristics: Supply, Vacancy, and Affordability By Rob Collinson and Ben Winter January 2010 Abstract The aim of this working paper is to document key
êéëé~êåü=üáöüäáöüí House Prices, Borrowing Against Home Equity, and Consumer Expenditures lîéêîáéï eçìëé=éêáåéë=~åç=äçêêçïáåö ~Ö~áåëí=ÜçãÉ=Éèìáíó
 êéëé~êåü=üáöüäáöüí January 2004 Socio-economic Series 04-006 House Prices, Borrowing Against Home Equity, and Consumer Expenditures lîéêîáéï The focus of the study is to examine the link between house
Homeownership HOMEOWNERSHIP TRENDS JOINT CENTER FOR HOUSING STUDIES OF HARVARD UNIVERSITY
 4 Homeownership The national homeownership rate marked its ninth consecutive year of decline in 213, affecting most segments of the population. The drop among minorities is particularly troubling, given
THE STATE OF THE NATION S HOUSING 2016
 THE STATE OF THE NATION S HOUSING 2016 KEY FACTS Facts from the 2016 State of the Nation s Housing Report from the Joint Center for Housing Studies of Harvard University PURPOSE The State of the Nation
Income and Racial Disparities in Subprime Lending May 2000
 Income and Racial Disparities in Subprime Lending May 2000 U.S. Department of Housing and Urban Development Office of Policy Development and Research UNEQUAL BURDEN IN CHICAGO: INCOME AND RACIAL DISPARITIES
From Widening Deficits to Paying Down the Debt: Benefits for the American People
 From Widening Deficits to Paying Down the Debt: Benefits for the American People August 4, 1999 Office of Economic Policy U.S. Department of Treasury From Widening Deficits to Paying Down the Debt: Benefits
REAL ESTATE MARKETING UPDATE
 From the Desk of Renee Carnes-Rook Vice President, Real Estate Services In the midst of unprecedented economic and market pressures, tight credit markets, difficult-to-obtain loans, and a cloudy employment
Property Tax Reductions to Diminish as Housing Market Improves
 Property Tax Reductions to Diminish as Housing Market Improves MAC TAYLOR LEGISLATIVE ANALYST MAY 5, 2014 Executive Summary Property Tax Reductions for Millions of Properties Due to Real Estate Crisis.
The Current Crisis in the Subprime Mortgage Market. Jason Vinar GMAC ResCap
 The Current Crisis in the Subprime Mortgage Market Jason Vinar GMAC ResCap Overview Merrill s Market Economist, August 2006 Morgan Stanley s Mortgage Finance, March 2007 Citigroup s Housing Monitor, March
Why Did House Prices Drop So Quickly?
 Why Did House Prices Drop So Quickly? David Barker April 26, 2009 Summary: After a long period of stability which ended in the early 1990s, U.S. house prices rose for more than a decade, then suddenly
U.S. and Regional Housing Markets
 U.S. and Regional Housing Markets House Prices Boom, Bust and Rebound Index, 1991: Q1=1* 3 CoreLogic house price index Real FHFA house price index 25 2 15 1 5 1991 199 1997 2 23 26 29 212 215 *Seasonally
The Obama Administration s Efforts To Stabilize The Housing Market and Help American Homeowners
 The Obama Administration s Efforts To Stabilize The Housing Market and Help American Homeowners July 2013 U.S. Department of Housing and Urban Development Office of Policy Development Research U.S Department
A Model of Housing Prices and Residential Investment
 A Model of Prices and Residential Investment Chapter 9 Appendix In this appendix, we develop a more complete model of the housing market that explains how housing prices are determined and how they interact
Public Transportation and Petroleum Savings in the U.S.: Reducing Dependence on Oil
 Public Transportation and Petroleum Savings in the U.S.: Reducing Dependence on Oil Linda Bailey ICF International 9300 Lee Highway Fairfax, Virginia 22031 January 2007 Public Transportation and Petroleum
S&P/Case-Shiller Home Price Indices
 The Fourth Quarter Starts with Broad-based Declines in Home Prices According to the S&P/Case-Shiller Home Price Indices New York, December 27, 2011 Data through October 2011, released today by S&P Indices
Appendix J Santa Monica Travel Demand Forecasting Model Trip Generation Rates
 Appendix J Santa Monica Travel Demand Forecasting Model Trip Generation Rates SANTA MONICA TRAVEL DEMAND FORECASTING MODEL TRIP GENERATION RATES SUBMITTED BY: 201 Santa Monica Blvd., Suite 500 Santa Monica,
Between 1986 and 2010, homeowners and renters. A comparison of 25 years of consumer expenditures by homeowners and renters.
 U.S. BUREAU OF LABOR STATISTICS OCTOBER 2012 VOLUME 1 / NUMBER 15 A comparison of 25 years of consumer expenditures by homeowners and renters Author: Adam Reichenberger, Consumer Expenditure Survey Between
The Housing Downturn in the United States 2009 First Quarter Update
 The Housing Downturn in the United States 2009 First Quarter Update May 2009 TABLE OF CONTENTS The Housing Downturn in the United States: 2009 First Quarter Update Introduction The Housing Downturn: National
METRO ATLANTA STILL AMONG FASTEST-GROWING IN NATION
 October 2012 Despite the dour economic news of the past few years, metro Atlanta remains the key economic driver of the Southeast. But, as with all metro areas, challenges abound. One of those challenges
2013 BUYERS GUIDE. KW Market Navigator
 KW Market Navigator 2013 BUYERS GUIDE Am I ready to buy? How much can I afford? Where do I find homes? Why buy now? How s the market? Is there a right time to buy? What is this home worth in today s market?
Market Segmentation: The Omaha Condominium Market
 Market Segmentation: The Omaha Condominium Market Page 1 Market Segmentation: The Omaha Condominium Market Roger P. Sindt Steven Shultz Department of Economics and Real Estate University of Nebraska at
The Cost of Maintaining Ownership in the Current Crisis
 The Cost of Maintaining Ownership in the Current Crisis Comparisons in 20 Cities Dean Baker, Danilo Pelletiere and Hye Jin Rho April 2008 Center for Economic and Policy Research National Low Income Housing
Florida: An Overview of Foreclosures
 Florida: An Overview of Foreclosures February 4, 2015 Presented by: The Florida Legislature Office of Economic and Demographic Research 850.487.1402 http://edr.state.fl.us Foreclosure Timeline... The housing
The Housing recovery is here! Should you buy a house?
 The Housing recovery is here! Should you buy a house? William Wheaton Department of Economics Center for Real Estate MIT January, 2014 IAP 1). Why there will be a recovery. - Household Formation unusually
PRESS RELEASE. Home Prices Rise Further in August 2013 According to the S&P/Case-Shiller Home Price Indices
 Home Prices Rise Further in August 2013 According to the S&P/Case-Shiller Home Price Indices New York, October 29, 2013 Data through August 2013, released today by S&P Dow Jones Indices for its S&P/Case-Shiller
S&P/Case-Shiller Home Price Indices
 National Home Prices Are Close to the 2009Q1 Trough According to the S&P/Case-Shiller Home Price Indices New York, February 22, 2011 Data through December 2010, released today by Standard & Poor s for
Why Texas Feels Less Subprime Stress than U.S. By Anil Kumar
 Why Texas Feels Less Subprime Stress than U.S. By Anil Kumar Differences in economic factors and mortgage characteristics give the state a lower delinquency rate. Subprime loans and other high-risk mortgages
Twin Cities in Crisis: Unequal Treatment of Communities of Color in Mortgage Lending. Institute on Metropolitan Opportunity.
 Twin Cities in Crisis: Unequal Treatment of Communities of Color in Mortgage Lending Institute on Metropolitan Opportunity April 2014 University of Minnesota Law School N150 Walter Mondale Hall 229 19
The Obama Administration s Efforts To Stabilize The Housing Market and Help American Homeowners
 The Obama Administration s Efforts To Stabilize The Housing Market and Help American Homeowners June 2013 U.S. Department of Housing and Urban Development Office of Policy Development Research U.S Department
The Distressed Property Market and Shadow Inventory in Florida: Estimates and Analysis
 The Distressed Property Market and Shadow Inventory in Florida: Estimates and Analysis Introduction Florida was one of the states hardest hit by the real estate downturn. Delinquencies, foreclosures and
Demographic Trends Driving the Hispanic Consumer Market James W. Gillula and Tabitha Bailey*
 Demographic Trends Driving the Hispanic Consumer Market James W. Gillula and Tabitha Bailey* The rapid growth of the U.S. Hispanic population has captured the attention of most major retailers and consumer
THE ECONOMIC PLIGHT OF MILLENNIALS
 THE ECONOMIC PLIGHT OF MILLENNIALS 6 EconSouth January April 2014 A demographic cohort is never monolithic, but the group that recently entered the labor force had one trait in common: they watched as
Preparing for 2015 Housing Market Opportunities
 January U.S. Economic & Housing Market Outlook Preparing for 2015 Housing Market Opportunities As we enter 2015, the U.S. economy and housing markets are prepared for a robust start. Unlike one year ago,
Boom, Bust, and Beyond: A Look at Housing Market Data in Florida Douglas Holtz- Eakin & Andrew Winkler l November 2012
 Boom, Bust, and Beyond: A Look at Housing Market Data in Florida Douglas Holtz- Eakin & Andrew Winkler l November 212 Overview Summer and early fall of 212 have been marked by noted improvements in housing
March 2015 Prepared by the Department of Finance & Performance Management. 2013 Regional Peer Review PERFORMANCE MEASURES
 March 2015 Prepared by the Department of Finance & Performance Management 2013 Regional Peer Review PERFORMANCE MEASURES CONTENTS CONTENTS... 1 EXECUTIVE SUMMARY... 2 SNAPSHOT... 4 PEER SELECTION... 5
Self-Storage Investment Trends to Watch. April 16, 2015
 Self-Storage Investment Trends to Watch April 16, 2015 Economic Outlook Underpins Self-Storage Sector Hiring Makes Steady Gains Supports Broader Economic Performance Quarterly Job Growth (Millions) 0.9
National Property Type Cycle Locations. Hotel Full-Service Hotel Ltd. Service Retail 1st Tier Regional Mall. Retail Neighborhood/Community
 Cycle Monitor Real Estate Market Cycles Fourth Quarter 0 Analysis February 0 Physical Market Cycle Analysis of All Five Major Property Types in More Than 0 MSAs. U.S. GDP growth of.% was more than double
Short-Run Drivers Response to Un unexpected Gasoline Price Spike
 Short-run Driver Response to a Gasoline Price Spike: Evidence from San Diego, CA Andrew Narwold University of San Diego Dirk Yandell University of San Diego Drivers response to an unexpected gasoline price
PRESS RELEASE. Home Prices Lose Momentum According to the S&P/Case-Shiller Home Price Indices
 Home Prices Lose Momentum According to the S&P/Case-Shiller Home Price Indices New York, February 25, 2014 Data through December 2013, released today by S&P Dow Jones Indices for its S&P/Case-Shiller 1
FIRST-TIME HOMEBUYERS: UPDATE FROM THE 2005 AMERICAN HOUSING SURVEY
 FIRST-TIME HOMEBUYERS: UPDATE FROM THE 2005 AMERICAN HOUSING SURVEY In 2005, there were nearly 75 million homeowning households in the United States, representing nearly 69 percent of all households. During
Virginia s Evolving Foreclosure Problems: Rural Foreclosures and Mortgage Servicing Errors Are Adding New Troubles to an Already Difficult Situation
 Virginia s Evolving Foreclosure Problems: Rural Foreclosures and Mortgage Servicing Errors Are Adding New Troubles to an Already Difficult Situation Key Findings In, the largest increase in foreclosure
The U.S. Economy after September 11. 1. pushing us from sluggish growth to an outright contraction. b and there s a lot of uncertainty.
 Presentation to the University of Washington Business School For delivery November 15, 2001 at approximately 8:05 AM Pacific Standard Time (11:05 AM Eastern) By Robert T. Parry, President and CEO of the