A Profile of Older Americans: Administration on Aging Administration for Community Living U.S. Department of Health and Human Services
|
|
|
- Rachel Phelps
- 8 years ago
- Views:
Transcription
1 A Profile of Older Americans: 2013 Administration on Aging Administration for Community Living U.S. Department of Health and Human Services

2 Table of Contents Highlights. 1 The Older Population. 2 Future Growth 3 Figure 1: Number of Persons 65+: (numbers in millions) Marital Status. 4 Figure 2: Marital Status of Persons 65+: 2013 Living Arrangements. 5 Figure 3: Living Arrangements of Persons 65+: 2013 Racial and Ethnic Composition. 6 Geographic Distribution 6 Figure 4: Persons 65+ as Percentage of Total Population, 2012 (US Map) Figure 5: Percent Increase in Population 65+, 2002 to 2012 (US Map) Figure 6: The 65+ Population by State, 2012 (table) Income. 9 Figure 7: Percent Distribution by Income: 2012 Poverty Housing. 11 Employment. 11 Education.. 11 Health and Health Care Health Insurance Coverage Figure 8: Percentage of Persons 65+ by type of Health Insurance Coverage, 2012 Disability and Activity Limitations.. 14 Figure 9: Percentage of Persons 65+ with a Disability, 2012 Notes... 15
 Income. 9 Figure 7: Percent Distribution by Income: 2012 Poverty...... 10 Housing. 11 Employment. 11 Education.. 11 Health and Health Care... 12 Health Insurance Coverage.")
3 Highlights* The older population (65+) numbered 43.1 million in 2012, an increase of 7.6 million or 21% since The number of Americans aged who will reach 65 over the next two decades increased by 24% between 2002 and About one in every seven, or 13.7%, of the population is an older American. Persons reaching age 65 have an average life expectancy of an additional 19.2 years (20.4 years for females and 17.8 years for males). Older women outnumber older men at 24.3 million older women to 18.8 million older men. In 2012, 21.0% of persons 65+ were members of racial or ethnic minority populations--9% were African-Americans (not Hispanic), 4% were Asian or Pacific Islander (not Hispanic),.5% were Native American (not Hispanic), and 0.7% of persons 65+ identified themselves as being of two or more races. Persons of Hispanic origin (who may be of any race) represented 7% of the older population. Older men were much more likely to be married than older women--71% of men vs. 45% of women (Figure 2). In 2013, 36% older women were widows. About 28% (12.1 million) of noninstitutionalized older persons live alone (8.4 million women, 3.7 million men). Almost half of older women (45%) age 75+ live alone. In 2012, about 518,000 grandparents aged 65 or more had the primary responsibility for their grandchildren who lived with them. The population 65 and over has increased from 35.5 million in 2002 to 43.1 million in 2012 (a 21% increase) and is projected to increase to 79.7 million in The 85+ population is projected to increase from 5.9 million in 2012 to 14.1 million in Racial and ethnic minority populations have increased from 6.1 million in 2002 (17% of the elderly population) to 8.9 million in 2012 (21% of the elderly) and are projected to increase to 20.2 million in 2030 (28% of the elderly). The median income of older persons in 2012 was $27,612 for males and $16,040 for females. Median money income (after adjusting for inflation) of all households headed by older people rose by.1% (not statistically significant) from 2011 to Households containing families headed by persons 65+ reported a median income in 2012 of $48,957. The major sources of income as reported by older persons in 2011 were Social Security (reported by 86% of older persons), income from assets (reported by 52%), private pensions (reported by 27%), government employee pensions (reported by 15%), and earnings (reported by 28%). Social Security constituted 90% or more of the income received by 35% of beneficiaries in 2011 (22% of married couples and 45% of non-married beneficiaries). Over 3.9 million elderly persons (9.1%) were below the poverty level in This poverty rate is statistically different from the poverty rate in 2011 (8.7%). In 2011, the U.S. Census Bureau also released a new Supplemental Poverty Measure (SPM) which takes into account regional variations in the livings costs, non-cash benefits received, and non-discretionary expenditures but does not replace the official poverty measure. In 2012, the SPM shows a poverty level for older persons of 14.8% (more than 5 percentage points higher than the official rate of 9.1%). This increase is mainly due to including medical out-of-pocket expenses in the poverty calculations. *Principal sources of data for the Profile are the U.S. Census Bureau, the National Center for Health Statistics, and the Bureau of Labor Statistics. The Profile incorporates the latest data available but not all items are updated on an annual basis. -1-

4 The Older Population The older population--persons 65 years or older numbered 43.1 million in 2012 (the most recent year for which data are available). They represented 13.7% of the U.S. population, about one in every seven Americans. The number of older Americans increased by 7.6 million or 21% since 2002, compared to an increase of 7% for the under-65 population. However, the number of Americans aged who will reach 65 over the next two decades increased by 24% between 2002 and In 2012, there were 24.3 million older women and 18.8 million older men, or a sex ratio of 129 women for every 100 men. At age 85 and over, this ratio increases to 200 women for every 100 men. Since 1900, the percentage of Americans 65+ has more than tripled (from 4.1% in 1900 to 13.7% in 2012), and the number has increased over thirteen times (from 3.1 million to 43.1 million). The older population itself is increasingly older. In 2012, the age group (24 million) was more than 10 times larger than in 1900; the group (13.3 million) was 17 times larger and the 85+ group (5.9 million) was 48 times larger. In 2011, persons reaching age 65 had an average life expectancy of an additional 19.2 years (20.4 years for females and 17.8 years for males). A child born in 2011 could expect to live 78.7 years, about 30 years longer than a child born in Much of this increase occurred because of reduced death rates for children and young adults. However, the period of also has seen reduced death rates for the population aged 65-84, especially for men by 41.6% for men aged and by 29.5% for men aged Life expectancy at age 65 increased by only 2.5 years between 1900 and 1960, but has increased by 4.2 years from 1960 to Nonetheless, some research has raised concerns about future increases in life expectancy in the US compared to other high-income countries, primarily due to past smoking and current obesity levels, especially for women age 50 and over. About 3.6 million persons celebrated their 65th birthday in Census estimates showed an annual net increase between 2011 and 2012 of 1.8 million in the number of persons 65 and over. Between 1980 and 2012, the centenarian population experienced a larger percentage increase than did the total population. There were 61,985 persons aged 100 or more in 2012 (0.14% of the total 65+ population). This is a 93% increase from the 1980 figure of 32,194. Sources: U.S. Census Bureau, Population Estimates; 2010 Census Special Reports, Centenarians: 2010, C2010SR-03, 2012; and Table 5. Population by Age and Sex for the United States: 1900 to 2000, Part A. Hobbs, Frank and Nicole Stoops, Census 2000 Special Reports, Series CENSR-4, Demographic Trends in the 20 th Century. National Center for Health Statistics, Hoyert DL, Xu JQ. Deaths: Preliminary data for National Vital Statistics Reports, Vol 61 No 6. Hyattsville, MD: National Research Council, Crimmins EM, Preston SH, Cohen B, editors. Explaining Divergent Levels of Longevity in High-Income Countries. Panel on Understanding Divergent Trends in Longevity in High-Income Countries,

5 Future Growth The older population will continue to grow significantly in the future (Figure 1). This growth slowed somewhat during the 1990's because of the relatively small number of babies born during the Great Depression of the 1930's. But the older population is beginning to burgeon as the "baby boom" generation begins to reach age 65. The population 65 and over has increased from 35.5 million in 2002 to 43.1 million in 2012 (a 21% increase) and is projected to more than double to 92 million in By 2040, there will be about 79.7 million older persons, over twice their number in People 65+ represented 13.7% of the population in the year 2012 but are expected to grow to be 21% of the population by The 85+ population is projected to triple from 5.9 million in 2012 to 14.1 million in Racial and ethnic minority populations have increased from 6.1 million in 2002 (17% of the elderly population) to 8.9 million in 2012 (21% of the elderly) and are projected to increase to 20.2 million in 2030 (28% of the elderly). Between 2012 and 2030, the white (not Hispanic) population 65+ is projected to increase by 54% compared with 126% for older racial and ethnic minority populations, including Hispanics (155%), African-Americans (not Hispanic) (104%), American Indian and Native Alaskans (not Hispanic) (116%), and Asians (not Hispanic) (119%). Note: Increments in years are uneven. Source: U.S. Census Bureau, Population Estimates and Projections. Sources: U.S. Census Bureau, Population Estimates, Vintage , National Estimates by Age, Sex, Race: (PE-11) ; 2012 National Population Projections Summary Tables, Table 2. Projections of the Population by Selected Age Groups and Sex for the United States: 2015 to 2060, Middle Series. (NP2012-T2), Released December 2012; and Table 1. Projected Population by Single Year of Age, Sex, Race, and Hispanic Origin for the United States: 2012 to 2060, Released December
 and is projected to more than double to 92 million in 2060. By 2040, there will be about 79.7 million older persons, over twice their number in 2000.")
6 Marital Status In 2013, older men were much more likely to be married than older women--71% of men, 45% of women (Figure 2). Widows accounted for 36% of all older women in There were more than three times as many widows (8.7 million) as widowers (2.3 million). Divorced and separated (including married/spouse absent) older persons represented only 13% of all older persons in However, this percentage has increased since 1980, when approximately 5.3% of the older population were divorced or separated/spouse absent. Source: U.S. Census Bureau, Current Population Survey, Annual Social and Economic Supplement. Source: U.S. Census Bureau, Current Population Survey, Annual Social and Economic Supplement, Table A1. Marital Status of People 15 Years and Over, by Age, Sex, Personal Earnings, Race, and Hispanic origin, Released November

7 Living Arrangements Over half (57%) the older noninstitutionalized persons lived with their spouse in Approximately 13.8 million or 71% of older men, and 10.7 million or 45% of older women, lived with their spouse (Figure 3). The proportion living with their spouse decreased with age, especially for women. Only 32% of women 75+ years old lived with a spouse. About 28% (12.1 million) of all noninstitutionalized older persons in 2013 lived alone (8.4 million women, 3.7 million men). They represented 35% of older women and 19% of older men. The proportion living alone increases with advanced age. Among women aged 75 and over, for example, almost half (45%) lived alone. In 2012, a total of about 2.1 million older people lived in a household with a grandchild present. About 518,000 of these grandparents over 65 years old were the persons with primary responsibility for their grandchildren who lived with them. A relatively small number (1.5 million) and percentage (3.5%) of the 65+ population in 2012 lived in institutional settings such as nursing homes (1.2 million). However, the percentage increases dramatically with age, ranging (in 2012) from 1% for persons years to 3% for persons years and 10% for persons 85+. In addition, in 2009, approximately 2.7% of the elderly lived in senior housing with at least one supportive service available to their residents. Figure 3: Living Arrangements of Persons 65+, 2013 Source: U.S. Census Bureau, Current Population Survey, Annual Social and Economic Supplement. Sources: U.S. Census Bureau, American Community Survey; Current Population Survey, Annual Social and Economic Supplement. Centers for Medicare and Medicaid Services, Medicare Current Beneficiary Survey. -5-
 lived alone.")
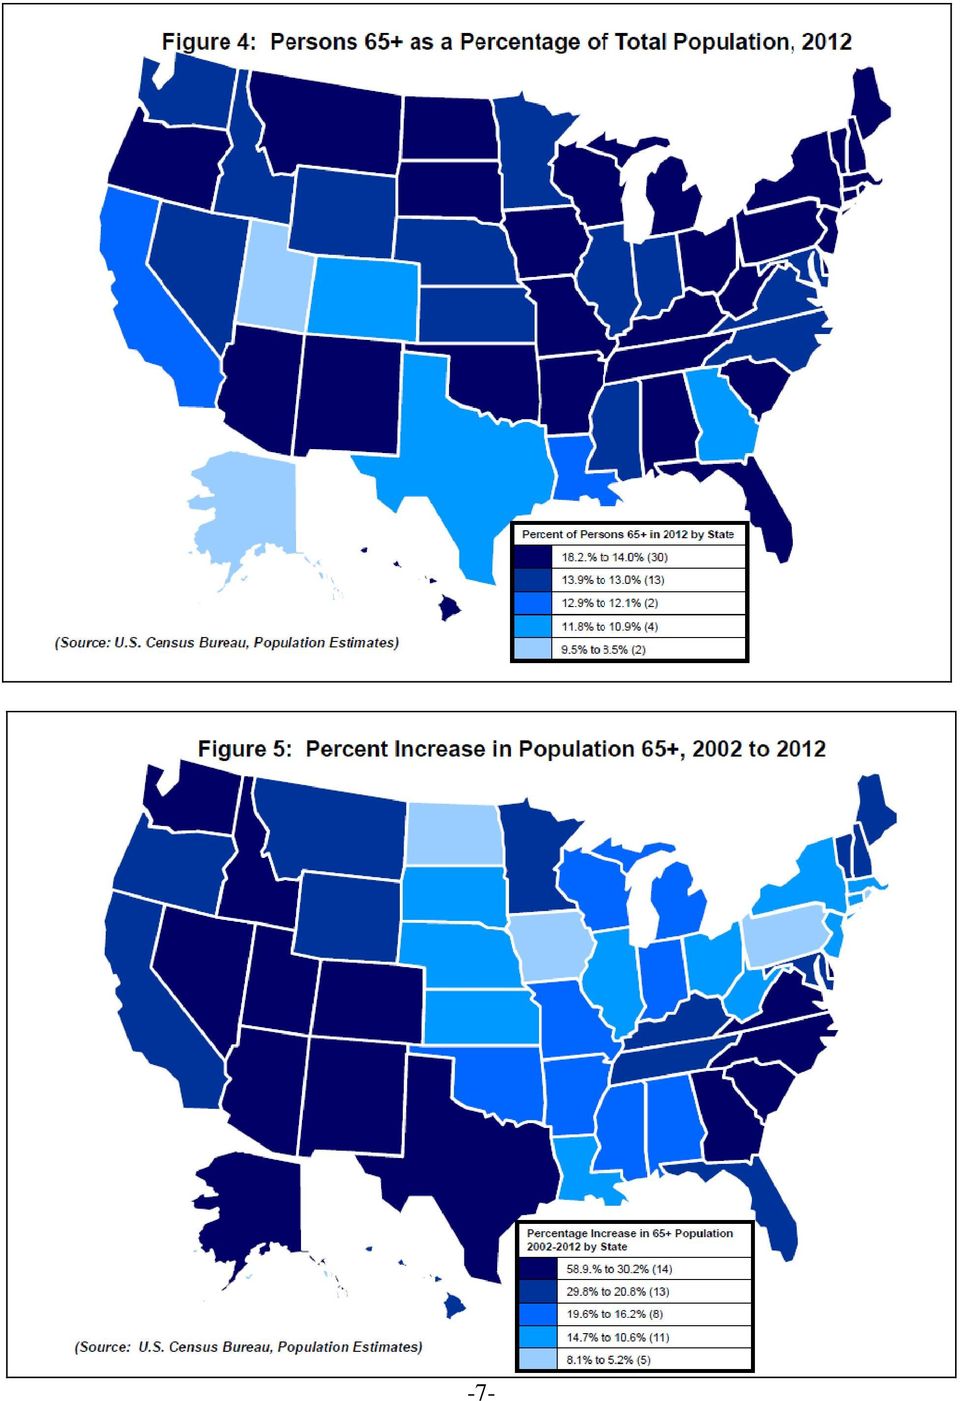
8 Racial and Ethnic Composition In 2012, 21.0% of persons 65+ were members of racial or ethnic minority populations--9% were African- Americans (not Hispanic), 4% were Asian or Pacific Islander (not Hispanic),.5% were Native American (not Hispanic),.1% were Native Hawaiian/Pacific Islander, (not Hispanic), and 0.7% of persons 65+ identified themselves as being of two or more races. Persons of Hispanic origin (who may be of any race) represented 7% of the older population. Only 7.7% of all the people who were members of racial and ethnic minority populations were 65+ in 2012 (9.5% of African-Americans (not Hispanic), 5.9% of Hispanics, 10.3% of Asians, 7% of Native Hawaiian and Other Pacific Islanders (not Hispanic), 8.9% of American Indian and Native Alaskans (not Hispanic)) compared with 17.3% of non-hispanic whites. Source: U.S. Census Bureau, Population Estimates. Geographic Distribution The proportion of older persons in the population varies considerably by state with some states experiencing much greater growth in their older populations (Figures 4 and 5). In 2012, over half (59%) of persons 65+ lived in 12 states: California (4.6 million); Florida (3.5 million); Texas (2.8 million); New York (2.8 million); Pennsylvania (2.0 million); and Ohio, Illinois, Michigan, North Carolina, New Jersey, Virginia, and Georgia each had well over 1 million (Figure 6). Persons 65+ constituted approximately 15% or more of the total population in 11 states in 2012: Florida (18.2%); Maine (17.0%); West Virginia (16.8%); Pennsylvania (16.0%); Montana (15.7%); Vermont (15.7%); Delaware (15.3%); Iowa (15.3%); Hawaii (15.1%); Rhode Island (15.1%); and Arkansas (15.0%). In 14 states, the 65+ population increased by 30% or more between 2002 and 2012: Alaska (58.9%), Nevada (49.3%), Colorado (41.7%), Georgia (40.1%), Arizona (39.6%); Idaho (39.1%), South Carolina (39.1%), Utah (36.6%), North Carolina (34.6%), Washington (33.9%); New Mexico (33.6%); Delaware (33.6%); Texas (33.2%); and Virginia (30.2%). The 17 jurisdictions with poverty rates at or over 10% for elderly during 2012 were: Mississippi (15.1%), Louisiana (12.6%), Kentucky (12.3%), District of Columbia (11.9%), New Mexico (11.9%), Texas (11.6%), New York (11.4%), Georgia (11.2%), Alabama (11.1%), Arkansas (10.9%), North Dakota (10.6%), California (10.4%), Florida (10.2%), South Carolina (10.1%), North Carolina (10.0%), South Dakota (10.0%), and Tennessee (10%). Most persons 65+ lived in metropolitan areas in 2012 (81%). About 66% of these older persons lived outside principal cities and 34% lived inside principal cities. Also, 19% of older persons lived outside of metropolitan areas. The elderly are less likely to change residence than other age groups. From 2012 to 2013, only 4% of older persons moved as opposed to 13% of the under 65 population. Most older movers (57%) stayed in the same county and 81% remained in the same state. Only 19% of the movers moved from out-of-state or abroad. Sources: U.S. Census Bureau, Population Estimates; American Community Survey; and Current Population Survey, Annual Social and Economic Supplement. -6-
 represented 7% of the older population. Only 7.7% of all the people who were members of racial and ethnic minority populations were 65+ in 2012 (9.")
9 -7-
10 Figure 6: The 65+ Population by State, 2012 State Number of Persons 65 and Older Percent of All Ages Percent Increase from 2002 to 2012 Percent Below Poverty 2012 US Total (50 States + DC) 43,145, % % Alabama 699, % % Alaska 62, % % Arizona 971, % % Arkansas 442, % % California 4,600, % % Colorado 613, % % Connecticut 532, % % Delaware 140, % % District of Columbia 71, % % Florida 3,509, % % Georgia 1,139, % % Hawaii 210, % % Idaho 212, % % Illinois 1,694, % % Indiana 889, % % Iowa 470, % % Kansas 394, % % Kentucky 614, % % Louisiana 595, % % Maine 226, % % Maryland 763, % % Massachusetts 958, % % Michigan 1,442, % % Minnesota 729, % % Mississippi 404, % % Missouri 883, % % Montana 158, % % Nebraska 257, % % Nevada 360, % % New Hampshire 193, % % New Jersey 1,250, % % New Mexico 294, % % New York 2,757, % % North Carolina 1,347, % % North Dakota 100, % % Ohio 1,705, % % Oklahoma 534, % % Oregon 581, % % Pennsylvania 2,042, % % Rhode Island 158, % % South Carolina 695, % % South Dakota 122, % % Tennessee 918, % % Texas 2,839, % % Utah 271, % % Vermont 98, % % Virginia 1,062, % % Washington 908, % % West Virginia 311, % % Wisconsin 824, % % Wyoming 75, % % Puerto Rico 584, % % Sources: U.S. Census Bureau, Population Estimates; Current Population Survey, Annual Social and Economic Supplement; and American Community Survey. -8-

11 Income The median income of older persons in 2012 was $27,612 for males and $16,040 for females. From 2011 to 2012, median money income (after adjusting for inflation) of all households headed by older people rose.1% but this was not statistically significant. Households containing families headed by persons 65+ reported a median income in 2012 of $48,957 ($50,701 for non-hispanic Whites, $33,913 for Hispanics, $40,348 for African-Americans, and $56,378 for Asians). About 5% of family households with an elderly householder had incomes less than $15,000 and 67% had incomes of $35,000 or more (Figure 7). Figure 7: Percent Distribution by Income: 2012 Source: U.S. Census Bureau, Current Population Survey, Annual Social and Economic Supplement. -9-
. About 5% of family households with an elderly householder had incomes less than $15,000 and 67% had incomes of $35,000 or more (Figure 7).")
12 For all older persons reporting income in 2012 (41.8 million), 17% reported less than $10,000 and 41% reported $25,000 or more. The median income reported was $20,380. The major sources of income as reported by older persons in 2011 were Social Security (reported by 86% of older persons), income from assets (reported by 52%), private pensions (reported by 27%), government employee pensions (reported by 15%), and earnings (reported by 28%). In 2011, Social Security benefits accounted for 36% of the aggregate income of the older population. The bulk of the remainder consisted of earnings (32%), asset income (11%), and pensions (18%). Social Security constituted 90% or more of the income received by 35% of beneficiaries (22% of married couples and 45% of non-married beneficiaries). Sources: U.S. Census Bureau, Current Population Survey, Annual Social and Economic Supplement; and "Income, Poverty, and Health Insurance Coverage in the United States: 2011," P60-245, issued September, Social Security Administration, Fast Facts and Figures About Social Security, Poverty Over 3.9 million elderly persons (9.1%) were below the poverty level in This poverty rate is statistically different from the poverty rate in 2011 (8.7%). Another 2.4 million or 5.5% of the elderly were classified as "near-poor" (income between the poverty level and 125% of this level). Just over 2.3 million older Whites (not Hispanic) (6.8%) were poor in 2012, compared to 18.2% of elderly African-Americans, 12.3% of Asians, and 20.6% of elderly Hispanics. Higher than average poverty rates were found in 2012 for older persons who lived inside principal cities (12.5%) and in the South (10.2%). Older women had a higher poverty rate (11%) than older men (6.6%) in Older persons living alone were much more likely to be poor (16.8%) than were older persons living with families (5.4%). The highest poverty rates were experienced among older Hispanic women (41.6%) who lived alone and also by older Black women (33%) who lived alone. In 2011, the U.S. Census Bureau released a new Supplemental Poverty Measure (SPM). The SPM methodology shows a significantly higher number of older persons below poverty than is shown by the official poverty measure. For persons 65 and older this poverty measure shows a poverty level of 14.8% in 2012 (more than 5 percentage points higher than the official rate of 9.1%). Unlike the official poverty rate, the SPM takes into account regional variations in the cost of housing etc. and, even more significantly, the impact of both non-cash benefits received (e.g., SNAP/food stamps, low income tax credits, WIC, etc.) and non-discretionary expenditures including medical out-of-pocket (MOOP) expenses. For persons 65 and over, MOOP was the major source of the significant differences between these measures. Bear in mind that the SPM does not replace the official poverty measure. Sources: U.S. Census Bureau, Current Population Survey, Annual Social and Economic Supplement; "Income, Poverty, and Health Insurance Coverage in the United States: 2012," P60-245, issued September, 2013; and The Research Supplemental Poverty Measure: 2012, P60-247, issued November
, asset income (11%), and pensions (18%).")
13 Housing Of the 25.1 million households headed by older persons in 2011, 81% were owners and 19% were renters. The median family income of older homeowners was $32,900. The median family income of older renters was $16,200. In 2011, almost 50% of older householders spent more than one-fourth of their income on housing costs - 43% for owners and 71% for renters - as compared to 50% of all householders. For older homeowners in 2011, the median construction year was 1970 compared with 1976 for all homeowners. Among the homes owned by people age 65 and older, 3.3% had physical problems. In 2011, the median value of homes owned by older persons was $150,000 (with a median purchase price of $55,000) compared to a median home value of $160,000 for all homeowners. About 65% of older homeowners in 2011 owned their homes free and clear. Source: Department of Housing and Urban Development, American Housing Survey, National Tables: Employment In 2013, 8.1 million (18.7 %) Americans age 65 and over were in the labor force (working or actively seeking work), including 4.5 million men (23.5%) and 3.6 million women (14.9%). They constituted 5% of the U.S. labor force. About 5.4% were unemployed. Labor force participation of men 65+ decreased steadily from two thirds in 1900 to 15.8% in 1985; then stayed at 16%-18% until 2002; and has been increasing since then to over 20%. The participation rate for women 65+ rose slightly from 1 of 12 in 1900 to 10.8% in 1956, fell to 7.3% in 1985, was around 7%-9% from However, beginning in 2000, labor force participation of older women has been gradually rising to the 2013 level. This increase is especially noticeable among the population aged Source: Bureau of Labor Statistics, Current Population Survey, Labor Force Statistics. Education The educational level of the older population is increasing. Between 1970 and 2013, the percentage of older persons who had completed high school rose from 28% to 83%. About 25% in 2013 had a bachelor's degree or higher. The percentage who had completed high school varied considerably by race and ethnic origin in 2013: 87% of Whites (not Hispanic), 76% of Asians, 71% of African-Americans, 60% of American Indian/Alaska Natives (in 2012), and 51% of Hispanics. The increase in educational levels is also evident within these groups. In 1970, only 30% of older Whites and 9% of older African-Americans were high school graduates. Source: U.S. Census Bureau, Current Population Survey, Annual Social and Economic Supplement. -11-

14 Health and Health Care In , 42% of noninstitutionalized people age 65 and over assessed their health as excellent or very good (compared to 55% for persons aged years). There was little difference between the sexes on this measure, but older African-Americans (not Hispanic) (26%), older American Indians/Alaska Natives (31%), older Asians (34%), and older Hispanics (31%) were less likely to rate their health as excellent or very good than were older Whites (not Hispanic) (46%). Most older persons have at least one chronic condition and many have multiple conditions. In , the most frequently occurring conditions among older persons were: diagnosed arthritis (50%), all types of heart disease (30%), any cancer (24%), diagnosed diabetes (20% in ), and hypertension (high blood pressure or taking antihypertensive medication) (72 percent in ). In January-June 2013, 69% of people age 65 and over reported that they received an influenza vaccination during the past 12 months and 61% reported that they had ever received a pneumococcal vaccination. About 27% (of persons 60+) reported height/weight combinations that placed them among the obese. Slightly over 42% of persons aged and 29% of persons 75+ reported that they engaged in regular leisure-time physical activity. Only 8% reported that they are current smokers and 7% reported excessive alcohol consumption. Only 2% reported that they had experienced psychological distress during the past 30 days. In , about 13.8 million persons aged 65 and older were discharged from short stay hospitals. This is a rate of 3,436.1 for every 10,000 persons aged 65+ which is about three times the comparable rate for persons of all ages (which was 1,125.1 per 10,000). The average length of stay for persons aged days; for ages it was 5.7 days; and for ages 85 and over it was 5.6 days. The comparable rate for persons of all ages was 4.8 days. The average length of stay for older people has decreased by 5 days since Older persons averaged more office visits with doctors in Among people age 75 and over, 23 percent had 10 or more visits to a doctor or other health care professional in the past 12 months compared to 14 percent among people age 45 to 64. In January-June 2013, 96% of older persons reported that they did have a usual place to go for medical care and only 2.3% said that they failed to obtain needed medical care during the previous 12 months due to financial barriers. In 2012 older consumers averaged out-of-pocket health care expenditures of $5,118, an increase of 43% since In contrast, the total population spent considerably less, averaging $3,556 in out-of-pocket costs. Older Americans spent 12.7% of their total expenditures on health, almost twice the proportion spent by all consumers (6.9%). Health costs incurred on average by older consumers in 2012 consisted of $3,186 (62%) for insurance, $935 (18%) for medical services, $798 (16%) for drugs, and $200 (4.0%) for medical supplies. Sources: National Center for Health Statistics, National Health Interview Survey; Early Release of Selected Estimates Based on Data from the January-June 2013National Health Interview Survey; National Hospital Discharge Survey; and National Health and Nutrition Examination Survey. Bureau of Labor Statistics, Consumer Expenditure Survey, Table Age of Reference Person: Annual Expenditures Means, Shares, Standard Errors, and Coefficient of Variation. -12-

15 Health Insurance Coverage In 2012, almost all (93%) non-institutionalized persons 65+ were covered by Medicare. Medicare covers mostly acute care services and requires beneficiaries to pay part of the cost, leaving about half of health spending to be covered by other sources. About 56% had some type of private health insurance. Almost 9% had military-based health insurance and 8% of the non-institutionalized elderly were covered by Medicaid (Figure 8). Less than 2% did not have coverage of some kind. About 86% of non-institutionalized Medicare beneficiaries in 2009 had some type of supplementary coverage. Among Medicare beneficiaries residing in nursing homes in 2010, almost half (49%) were covered by Medicaid. Note: Figure 8 data are for the non-institutionalized elderly. A person can be represented in more than one category. Source: U.S. Census Bureau, Current Population Survey, Annual Social and Economic Supplement. Sources: Centers for Medicare and Medicaid Services, Medicare Current Beneficiary Survey. U.S. Census Bureau, Current Population Survey, Annual Social and Economic Supplement; and "Income, Poverty, and Health Insurance Coverage in the United States: 2012," P60-245, issued September,

16 Disability and Activity Limitations Some type of disability (i.e., difficulty in hearing, vision, cognition, ambulation, self-care, or independent living) was reported by 36% of people age 65 and over in The percentages for individual disabilities ranged from almost one quarter (23 percent) having an ambulatory disability to 7 percent having a vision difficulty (Figure 9). Some of these disabilities may be relatively minor but others cause people to require assistance to meet important personal needs. There is a strong relationship between disability status and reported health status. Presence of a severe disability is also associated with lower income levels and educational attainment. Source: U.S. Census Bureau, American Community Survey. Using limitations in activities of daily living (ADLs) and instrumental activities of daily living (IADLs) to measure disability, in 2010, 28% of community-resident Medicare beneficiaries age 65+ reported difficulty in performing one or more ADLs and an additional 12% reported difficulty with one or more IADLs. By contrast, 92% of institutionalized Medicare beneficiaries had difficulties with one or more ADLs and 76% of them had difficulty with three or more ADLs. [ADLs include bathing, dressing, eating, and getting around the house. IADLs include preparing meals, shopping, managing money, using the telephone, doing housework, and taking medication.] Limitations in activities because of chronic conditions increase with age. Except where noted, the figures above are taken from surveys of the noninstitutionalized elderly. Although nursing homes are being increasingly used for short-stay post-acute care, about 1.3 million elderly are in nursing homes (more than half are age 85 and over). These individuals often need care with their ADLs and/or have severe cognitive impairment due to Alzheimer's disease or other dementias. Sources: U.S. Census Bureau, American Community Survey. Centers for Medicare and Medicaid Services, Medicare Current Beneficiary Survey. National Center for Health Statistics, National Health Interview Survey. -14-

17 Notes *Principal sources of data for the Profile are the U.S. Census Bureau, the National Center for Health Statistics, and the Bureau of Labor Statistics. The Profile incorporates the latest data available but not all items are updated on an annual basis. A Profile of Older Americans: 2013 was developed by the Administration on Aging (AoA), Administration for Community Living, U.S. Department of Health and Human Services. AoA serves as an advocate for the elderly within the federal government and is working to encourage and coordinate a responsive system of family and community based services throughout the nation. AoA helps states develop comprehensive service systems which are administered by 56 State and Territorial Units on Aging, 618 Area Agencies on Aging, and 246 Native American and Hawaiian organizations. -15-

A Profile of Older Americans: 2012
 A Profile of Older Americans: 2012 Administration on Aging Administration for Community Living U.S. Department of Health and Human Services Table of Contents Highlights. 1 The Older Population. 2 Future
A Profile of Older Americans: 2011
 A Profile of Older Americans: 2011 Administration on Aging U.S. Department of Health and Human Services Table of Contents Highlights. 1 The Older Population. 2 Future Growth 3 Figure 1: Number of Persons
A Profile of Older Americans: 2014
 A Profile of Older Americans: 2014 Administration on Aging Administration for Community Living U.S. partment of Health and Human Services Table of Contents HIGHLIGHTS... 1 THE OLDER POPULATION... 2 FUTURE
Educational Attainment in the United States: 2003
 Educational Attainment in the United States: 2003 Population Characteristics Issued June 2004 P20-550 The population in the United States is becoming more educated, but significant differences in educational
Census Data on Uninsured Women and Children September 2009
 March of Dimes Foundation Office of Government Affairs 1146 19 th Street, NW, 6 th Floor Washington, DC 20036 Telephone (202) 659-1800 Fax (202) 296-2964 marchofdimes.com nacersano.org Census Data on Uninsured
Public School Teacher Experience Distribution. Public School Teacher Experience Distribution
 Public School Teacher Experience Distribution Lower Quartile Median Upper Quartile Mode Alabama Percent of Teachers FY Public School Teacher Experience Distribution Lower Quartile Median Upper Quartile
STATE DATA CENTER. District of Columbia MONTHLY BRIEF
 District of Columbia STATE DATA CENTER MONTHLY BRIEF N o v e m b e r 2 0 1 2 District Residents Health Insurance Coverage 2000-2010 By Minwuyelet Azimeraw Joy Phillips, Ph.D. This report is based on data
Three-Year Moving Averages by States % Home Internet Access
 Three-Year Moving Averages by States % Home Internet Access Alabama Alaska Arizona Arkansas California Colorado Connecticut Delaware Florida Georgia Hawaii Idaho Illinois Indiana Iowa Kansas Kentucky Louisiana
Chex Systems, Inc. does not currently charge a fee to place, lift or remove a freeze; however, we reserve the right to apply the following fees:
 Chex Systems, Inc. does not currently charge a fee to place, lift or remove a freeze; however, we reserve the right to apply the following fees: Security Freeze Table AA, AP and AE Military addresses*
Impacts of Sequestration on the States
 Impacts of Sequestration on the States Alabama Alabama will lose about $230,000 in Justice Assistance Grants that support law STOP Violence Against Women Program: Alabama could lose up to $102,000 in funds
BUSINESS DEVELOPMENT OUTCOMES
 BUSINESS DEVELOPMENT OUTCOMES Small Business Ownership Description Total number of employer firms and self-employment in the state per 100 people in the labor force, 2003. Explanation Business ownership
NON-RESIDENT INDEPENDENT, PUBLIC, AND COMPANY ADJUSTER LICENSING CHECKLIST
 NON-RESIDENT INDEPENDENT, PUBLIC, AND COMPANY ADJUSTER LICENSING CHECKLIST ** Utilize this list to determine whether or not a non-resident applicant may waive the Oklahoma examination or become licensed
Changes in Self-Employment: 2010 to 2011
 Changes in Self-Employment: 2010 to 2011 American Community Survey Briefs By China Layne Issued January 2013 ACSBR/11-21 INTRODUCTION From December 2007 to June 2009, the United States experienced an economic
Real Progress in Food Code Adoption
 Real Progress in Food Code Adoption The Association of Food and Drug Officials (AFDO), under contract to the Food and Drug Administration, is gathering data on the progress of FDA Food Code adoptions by
Workers Compensation State Guidelines & Availability
 ALABAMA Alabama State Specific Release Form Control\Release Forms_pdf\Alabama 1-2 Weeks ALASKA ARIZONA Arizona State Specific Release Form Control\Release Forms_pdf\Arizona 7-8 Weeks by mail By Mail ARKANSAS
MAINE (Augusta) Maryland (Annapolis) MICHIGAN (Lansing) MINNESOTA (St. Paul) MISSISSIPPI (Jackson) MISSOURI (Jefferson City) MONTANA (Helena)
 Maryland (Annapolis) MICHIGAN (Lansing) MINNESOTA (St. Paul) MISSISSIPPI (Jackson) MISSOURI (Jefferson City) MONTANA (Helena)") HAWAII () IDAHO () Illinois () MAINE () Maryland () MASSACHUSETTS () NEBRASKA () NEVADA (Carson ) NEW HAMPSHIRE () OHIO () OKLAHOMA ( ) OREGON () TEXAS () UTAH ( ) VERMONT () ALABAMA () COLORADO () INDIANA
HAWAII () IDAHO () Illinois () MAINE () Maryland () MASSACHUSETTS () NEBRASKA () NEVADA (Carson ) NEW HAMPSHIRE () OHIO () OKLAHOMA ( ) OREGON () TEXAS () UTAH ( ) VERMONT () ALABAMA () COLORADO () INDIANA
Highlights and Trends: ASHA Counts for Year End 2009
 Highlights and Trends: ASHA Counts for Year End 2009 Constituents -- How many are there? How have the numbers changed? v ASHA currently represents 140,039 speech-language pathologists, audiologists, and
STATISTICAL BRIEF #137
 Medical Expenditure Panel Survey STATISTICAL BRIEF #137 Agency for Healthcare Research and Quality August 26 Treatment of Sore Throats: Antibiotic Prescriptions and Throat Cultures for Children under 18
Medicaid Topics Impact of Medicare Dual Eligibles Stephen Wilhide, Consultant
 Medicaid Topics Impact of Medicare Dual Eligibles Stephen Wilhide, Consultant Issue Summary The term dual eligible refers to the almost 7.5 milion low-income older individuals or younger persons with disabilities
APPENDIX A. Tables. Appendix A Tables 119
 118 The Condition of Education 2012 APPENDIX A Tables Appendix A Tables 119 Indicator 1 Enrollment Trends by Age Table A-1-1. Percentage of the population ages 3 34 enrolled in school, by age group: October
Licensure Resources by State
 Licensure Resources by State Alabama Alabama State Board of Social Work Examiners http://socialwork.alabama.gov/ Alaska Alaska Board of Social Work Examiners http://commerce.state.ak.us/dnn/cbpl/professionallicensing/socialworkexaminers.as
The Obama Administration and Community Health Centers
 The Obama Administration and Community Health Centers Community health centers are a critical source of health care for millions of Americans particularly those in underserved communities. Thanks primarily
STATISTICAL BRIEF #273
 STATISTICAL BRIEF #273 December 29 Employer-Sponsored Health Insurance for Employees of State and Local Governments, by Census Division, 28 Beth Levin Crimmel, M.S. Introduction Employees of state and
Net-Temps Job Distribution Network
 Net-Temps Job Distribution Network The Net-Temps Job Distribution Network is a group of 25,000 employment-related websites with a local, regional, national, industry and niche focus. Net-Temps customers'
STATISTICAL BRIEF #117
 Medical Expenditure Panel Survey STATISTICAL BRIEF #117 Agency for Healthcare Research and Quality March 2006 Children s Dental Visits and Expenses, United States, 2003 Erwin Brown, Jr. Introduction Regular
Englishinusa.com Positions in MSN under different search terms.
 Englishinusa.com Positions in MSN under different search terms. Search Term Position 1 Accent Reduction Programs in USA 1 2 American English for Business Students 1 3 American English for Graduate Students
Demographic Profile of ASHA Members Providing Bilingual Services March 2016
 Demographic Profile of ASHA Members Providing Bilingual Services March 2016 Introduction State data on the number of bilingual speech-language pathologists (SLPs) and audiologists are frequently requested
American C.E. Requirements
 American C.E. Requirements Alaska Board of Nursing Two of the following: 30 contact hours 30 hours of professional nursing activities 320 hours of nursing employment Arizona State Board of Nursing Arkansas
High Risk Health Pools and Plans by State
 High Risk Health Pools and Plans by State State Program Contact Alabama Alabama Health 1-866-833-3375 Insurance Plan 1-334-263-8311 http://www.alseib.org/healthinsurance/ahip/ Alaska Alaska Comprehensive
April 2014. For Kids Sake: State-Level Trends in Children s Health Insurance. A State-by-State Analysis
 April 2014 For Kids Sake: State-Level Trends in Children s Health Insurance A State-by-State Analysis 2 STATE HEALTH ACCESS DATA ASSISTANCE CENTER Contents Executive Summary... 4 Introduction... 5 National
Changes in the Cost of Medicare Prescription Drug Plans, 2007-2008
 Issue Brief November 2007 Changes in the Cost of Medicare Prescription Drug Plans, 2007-2008 BY JOSHUA LANIER AND DEAN BAKER* The average premium for Medicare Part D prescription drug plans rose by 24.5
Medicare- Medicaid Enrollee State Profile
 Medicare- Medicaid Enrollee State Profile The National Summary Centers for Medicare & Medicaid Services Introduction... 1 Data Source and General Notes... 2 Types and Ages of Medicare-Medicaid Enrollees...
Population, by Race and Ethnicity: 2000 and 2011
 Table 1 Population, by Race and Ethnicity: 2000 and 2011 Universe: 2000 and 2011 resident population 2011 population 2000 population Percent, 2011 Percent, 2000 Hispanic 51,927,158 35,204,480 16.7 12.5
Data show key role for community colleges in 4-year
 Page 1 of 7 (https://www.insidehighered.com) Data show key role for community colleges in 4-year degree production Submitted by Doug Lederman on September 10, 2012-3:00am The notion that community colleges
State-Specific Annuity Suitability Requirements
 Alabama Alaska Arizona Arkansas California Colorado Connecticut Delaware District of Columbia Effective 10/16/11: Producers holding a life line of authority on or before 10/16/11 who sell or wish to sell
Understanding Socioeconomic and Health Care System Drivers to Increase Vaccination Coverage
 Understanding Socioeconomic and Health Care System Drivers to Increase Vaccination Coverage Jason Baumgartner Life Sciences Consulting Director, Quintiles April 2011 Discussion Topics Title: Understanding
Chapter 3: Promoting Financial Self- Sufficiency
 Chapter 3: Promoting Financial Self- Sufficiency For most people, financial self-sufficiency is achieved through a combination of employment earnings and savings. Labor markets derived from the products
State Tax Information
 State Tax Information The information contained in this document is not intended or written as specific legal or tax advice and may not be relied on for purposes of avoiding any state tax penalties. Neither
$7.5 appropriation $6.5 2011 2012 2013 2014 2015 2016. Preschool Development Grants
 School Readiness: High-Quality Early Learning Head Start $10.5 $9.5 $10.1 +$1.5 +17.7% $8.5 $7.5 +$2.1 +27.0% $6.5 for fiscal year 2010 Included in the budget is $1.078 billion to ensure that every Head
Sources of Health Insurance Coverage in Georgia 2007-2008
 Sources of Health Insurance Coverage in Georgia 2007-2008 Tabulations of the March 2008 Annual Social and Economic Supplement to the Current Population Survey and The 2008 Georgia Population Survey William
Population, by Race and Ethnicity: 2000 and 2010
 Table 1 Population, by Race and Ethnicity: 2000 and 2010 Universe: 2000 and 2010 resident population 2010 population 2000 population Percent, 2010 Percent, 2000 Hispanic 50,729,570 35,204,480 16.4 12.5
NOTICE OF PROTECTION PROVIDED BY [STATE] LIFE AND HEALTH INSURANCE GUARANTY ASSOCIATION
![NOTICE OF PROTECTION PROVIDED BY [STATE] LIFE AND HEALTH INSURANCE GUARANTY ASSOCIATION](/thumbs/25/5402451.jpg "NOTICE OF PROTECTION PROVIDED BY [STATE] LIFE AND HEALTH INSURANCE GUARANTY ASSOCIATION") NOTICE OF PROTECTION PROVIDED BY This notice provides a brief summary of the [STATE] Life and Health Insurance Guaranty Association (the Association) and the protection it provides for policyholders. This
NOTICE OF PROTECTION PROVIDED BY This notice provides a brief summary of the [STATE] Life and Health Insurance Guaranty Association (the Association) and the protection it provides for policyholders. This
million 0.6 million 7.1 million
 KEY STATS Number of Americans who volunteer mainly with arts groups: 1 million volunteer secondarily with arts groups: 0.6 million provide free artistic services to non-arts groups: 7.1 million Research
STATISTICAL BRIEF #435
 STATISTICAL BRIEF #435 April 2014 Premiums and Employee Contributions for Employer-Sponsored Health Insurance: Private versus Public Sector, 2012 Karen E. Davis, MA Introduction Employer-sponsored health
Real Progress in Food Code Adoption
 Real Progress in Food Code Adoption August 27, 2013 The Association of Food and Drug Officials (AFDO), under contract to the Food and Drug Administration, is gathering data on the progress of FDA Food
A/B MAC Jurisdiction 1 Original Medicare Claims Processor
 A/B MAC Jurisdiction 1 Jurisdiction 1 - American Samoa, California, Guam, Hawaii, Nevada and Northern Mariana Islands Total Number of Fee-For-Service Beneficiaries: 3,141,183 (as of Total Number of Beneficiaries
In 2013, 75.9 million workers age 16 and older in the. Characteristics of Minimum Wage Workers, 2013. Highlights CONTENTS
 U.S. BUREAU OF LABOR STATISTICS M A R C H 2 0 1 4 R E P O R T 1 0 4 8 Characteristics of Minimum Wage Workers, 2013 below the figure of 13.4 percent in 1979, when data were first collected on a regular
Medicare Advantage Plan Landscape Data Summary
 2013 Medicare Advantage Plan Landscape Data Summary Table of Contents Report Overview...3 Medicare Advantage Costs and Benefits...4 The Maximum Out of Pocket (MOOP) Benefit How It Works...4 The Prescription
STATE-SPECIFIC ANNUITY SUITABILITY REQUIREMENTS
 Alabama Alaska Arizona Arkansas California This jurisdiction has pending annuity training legislation/regulation Annuity Training Requirement Currently Effective Initial 8-Hour Annuity Training Requirement:
NAIC ANNUITY TRAINING Regulations By State
 Select a state below to display the current regulation and requirements, or continue to scroll down. Light grey text signifies states that have not adopted an annuity training program. Alabama Illinois
State Tax Deductions for Contributions to 529 Plans Presented by Advisor Name
 State Tax Deductions for Contributions to 529 Plans Presented by Advisor Name Alabama Alaska Arizona Arkansas California Colorado Connecticut Delaware District of Columbia Florida Georgia Contributions
State Specific Annuity Suitability Requirements updated 10/10/11
 Alabama Alaska Ai Arizona Arkansas California This jurisdiction has pending annuity training legislation/regulation Initial 8 Hour Annuity Training Requirement: Prior to selling annuities in California,
Schedule B DS1 & DS3 Service
 Schedule B DS1 & DS3 Service SCHEDULE B Private Line Data Services DS1 & DS3 Service... 2 DS-1 Local Access Channel... 2 DS-1 Local Access Channel, New Jersey... 2 DS-1 Local Access Channel, Out-of-State...
THE CHARACTERISTICS OF PERSONS REPORTING STATE CHILDREN S HEALTH INSURANCE PROGRAM COVERAGE IN THE MARCH 2001 CURRENT POPULATION SURVEY 1
 THE CHARACTERISTICS OF PERSONS REPORTING STATE CHILDREN S HEALTH INSURANCE PROGRAM COVERAGE IN THE MARCH 2001 CURRENT POPULATION SURVEY 1 Charles Nelson and Robert Mills HHES Division, U.S. Bureau of the
State Pest Control/Pesticide Application Laws & Regulations. As Compiled by NPMA, as of December 2011
 State Pest Control/Pesticide Application Laws & As Compiled by NPMA, as of December 2011 Alabama http://alabamaadministrativecode.state.al.us/docs/agr/mcword10agr9.pdf Alabama Pest Control Alaska http://dec.alaska.gov/commish/regulations/pdfs/18%20aac%2090.pdf
EMBARGOED UNTIL 6:00 AM ET WEDNESDAY, NOVEMBER 30, 2011
 A State-by-State Look at the President s Payroll Tax Cuts for Middle-Class Families An Analysis by the U.S. Department of the Treasury s Office of Tax Policy The President signed into law a 2 percentage
List of State Residual Insurance Market Entities and State Workers Compensation Funds
 List of State Residual Insurance Market Entities and State Workers Compensation Funds On November 26, 2002, President Bush signed into law the Terrorism Risk Insurance Act of 2002 (Public Law 107-297,
State by State Summary of Nurses Allowed to Perform Conservative Sharp Debridement
 State by State Summary of Nurses Allowed to Perform Conservative Sharp Debridement THE FOLLOWING ARE ONLY GENERAL SUMMARIES OF THE PRACTICE ACTS EACH STATE HAS REGARDING CONSERVATIVE SHARP DEBRIDEMENT
National Sample Survey of Registered Nurses March 2004. Preliminary Findings
 The Registered Nurse Population: National Sample Survey of Registered Nurses March 2004 Preliminary Findings Preliminary Findings 2004 National Sample Survey of Registered Nurses The (NSSRN) is the Nation
Wireless Substitution: Early Release of Estimates From the National Health Interview Survey, July December 2009
 Wireless Substitution: Early Release of Estimates From the National Health Interview Survey, July December by Stephen J. Blumberg, Ph.D., and Julian V. Luke Division of Health Interview Statistics, National
State Tax of Social Security Income. State Tax of Pension Income. State
 State Taxation of Retirement Income The following chart shows generally which states tax retirement income, including and pension States shaded indicate they do not tax these forms of retirement State
States Ranked by Alcohol Tax Rates: Beer (as of March 2009) Ranking State Beer Tax (per gallon)
 Ranking State Beer Tax (per gallon)") States Ranked by Alcohol Tax Rates: Beer (as of March 2009) Ranking State Beer Tax (per gallon) Sales Tax Applied 1 Wyoming $0.02 4% 2 4 8 10 Missouri $0.06 4.225% Wisconsin $0.06 5% Colorado $0.08 2.9%
States Ranked by Alcohol Tax Rates: Beer (as of March 2009) Ranking State Beer Tax (per gallon) Sales Tax Applied 1 Wyoming $0.02 4% 2 4 8 10 Missouri $0.06 4.225% Wisconsin $0.06 5% Colorado $0.08 2.9%
TOTAL AWARD AMOUNT $119,067,687 1. State and Territory Base Awards for Policy and Environmental Change $44,602,383
 American Recovery and Reinvestment Act Prevention and Wellness Initiative Final s for State and Territory Component Friday February 5, 2010 TOTAL AWARD AMOUNT $119,067,687 1. State and Territory Base Awards
A Study About Identity Theft
 A Study About Identity Theft Prepared For: The National Foundation for Credit Counseling Prepared By: Harris Interactive Inc. Public Relations Research 1 INTRODUCTION AND METHODOLOGY This Identity Theft
Outpatient dialysis services
 O n l i n e A p p e n d i x e s 6 Outpatient dialysis services 6-A O n l i n e A p p e n d i x Medicare spending by dialysis beneficiaries is substantial FIGURE 1-3 Figure 6 A1 Medicare population Dialysis
2009-10 STATE AND LOCAL GOVERNMENT TAX AND REVENUE RANKINGS. By Jacek Cianciara
 2009-10 STATE AND LOCAL GOVERNMENT TAX AND REVENUE RANKINGS By Jacek Cianciara Wisconsin Department of Revenue Division of Research and Policy December 12, 2012 TABLE OF CONTENTS Key Findings 3 Introduction
********************
 THE SURETY & FIDELITY ASSOCIATION OF AMERICA 1101 Connecticut Avenue, N.W., Suite 800 Washington, D. C. 20036 Phone: (202) 463-0600 Fax: (202) 463-0606 Web page: www.surety.org APPLICATION Application
Q1 2009 Homeowner Confidence Survey. May 14, 2009
 Q1 2009 Homeowner Confidence Survey Results May 14, 2009 The Zillow Homeowner Confidence Survey is fielded quarterly to determine the confidence level of American homeowners when it comes to the value
Summary Enrollment Report, which can be accessed at http://aspe.hhs.gov/health/reports/2014/marketplaceenrollment/apr2014/ib_2014apr_enrollment.pdf.
 ASPE ISSUE BRIEF HEALTH INSURANCE MARKETPLACE 2015 OPEN ENROLLMENT PERIOD: JANUARY ENROLLMENT REPORT For the period: November 15, 2014 January 16, 2015 1 January 27, 2015 The Health Insurance Marketplace
State Tax Information
 State Tax Information The information contained in this document is not intended or written as specific legal or tax advice and may not be relied on for purposes of avoiding any state tax penalties. Neither
The Financial Burden of Paying for Non-Premium Medical Expenses for Children
 SEHSD Working Paper #2011-12 The Financial Burden of Paying for Non-Premium Medical Expenses for Children Jessica Smith and Brett O Hara Social, Economic, and Housing Statistics Division U.S. Census Bureau
Exploring the Impact of the RAC Program on Hospitals Nationwide
 Exploring the Impact of the RAC Program on Hospitals Nationwide Overview of AHA RACTrac Survey Results, 4 th Quarter 2010 For complete report go to: http://www.aha.org/aha/issues/rac/ractrac.html Agenda
Nurse Aide Training Requirements, 2011
 Nurse Aide Training Requirements, 2011 Background Federal legislation (Omnibus Budget Reconciliation Act of 1987) and associated regulations (42 CFR 483.152) require that Medicare- and Medicaid-certified
American Homicide Supplemental Volume (AHSV) American Homicides Twentieth Century (AHTC)
 American Homicides Twentieth Century (AHTC)") American Homicide Supplemental Volume (AHSV) American Homicides Twentieth Century (AHTC) Randolph Roth October, 29 A supplement to Randolph Roth, American Homicide (The Belknap Press of Harvard University
American Homicide Supplemental Volume (AHSV) American Homicides Twentieth Century (AHTC) Randolph Roth October, 29 A supplement to Randolph Roth, American Homicide (The Belknap Press of Harvard University
Model Regulation Service July 2005 LIFE INSURANCE MULTIPLE POLICY MODEL REGULATION
 Table of Contents Section 1. Section 2. Section 3. Section 4. Section 5. Section 6. Section 1. Model Regulation Service July 2005 Purpose Authority Exemptions Duties of Insurers Severability Effective
What to Know About State CPA Reciprocity Rules. John Gillett, PhD, CPA Chair, Department of Accounting Bradley University, Peoria, IL
 What to Know About State CPA Reciprocity Rules Paul Swanson, MBA, CPA Instructor of Accounting John Gillett, PhD, CPA Chair, Department of Accounting Kevin Berry, PhD, Assistant Professor of Accounting
DOT HS 811 523 August 2011. Time of Day and Demographic Perspective Of Fatal Alcohol-Impaired-Driving Crashes. Time of Day
 TRAFFIC SAFETY FACTS Research Note DOT HS 811 523 August 2011 Time of Day and Demographic Perspective Of Fatal Alcohol-Impaired-Driving Crashes Alcohol-impaired driving continues to be one of the major
Medicare Hospice Benefits
 Large Print Edition Medicare Hospice Benefits a special way of caring for people who have a terminal illness This booklet explains... The hospice program and who is eligible. Your Medicare hospice benefits.
Trends in Asthma Morbidity and Mortality
 Trends in Asthma Morbidity and Mortality American Lung Association Epidemiology and Statistics Unit Research and Health Education Division September 2012 Table of Contents Asthma Mortality, 1999-2009 Asthma
2014 INCOME EARNED BY STATE INFORMATION
 BY STATE INFORMATION This information is being provided to assist in your 2014 tax preparations. The information is also mailed to applicable Columbia fund non-corporate shareholders with their year-end
Healthcare. State Report. Anthony P. Carnevale Nicole Smith Artem Gulish Bennett H. Beach. June 2012
 Healthcare State Report June 2012 Anthony P. Carnevale Nicole Smith Artem Gulish Bennett H. Beach B Table of Contents Healthcare: State Level Analysis... 3 Alabama... 12 Alaska... 14 Arizona... 16 Arkansas...
SECTION 109 HOST STATE LOAN-TO-DEPOSIT RATIOS. The Board of Governors of the Federal Reserve System (Board), the Federal Deposit
, the Federal Deposit") SECTION 109 HOST STATE LOAN-TO-DEPOSIT RATIOS The Board of Governors of the Federal Reserve System (Board), the Federal Deposit Insurance Corporation (FDIC), and the Office of the Comptroller of the Currency
SECTION 109 HOST STATE LOAN-TO-DEPOSIT RATIOS The Board of Governors of the Federal Reserve System (Board), the Federal Deposit Insurance Corporation (FDIC), and the Office of the Comptroller of the Currency
(In effect as of January 1, 2004*) TABLE 5a. MEDICAL BENEFITS PROVIDED BY WORKERS' COMPENSATION STATUTES FECA LHWCA
 TABLE 5a. MEDICAL BENEFITS PROVIDED BY WORKERS' COMPENSATION STATUTES FECA LHWCA") (In effect as of January 1, 2004*) TABLE 5a. MEDICAL BENEFITS PROVIDED BY WORKERS' COMPENSATION STATUTES Full Medical Benefits** Alabama Indiana Nebraska South Carolina Alaska Iowa Nevada South Dakota
(In effect as of January 1, 2004*) TABLE 5a. MEDICAL BENEFITS PROVIDED BY WORKERS' COMPENSATION STATUTES Full Medical Benefits** Alabama Indiana Nebraska South Carolina Alaska Iowa Nevada South Dakota
PUBLIC HOUSING AUTHORITY COMPENSATION
 PUBLIC HOUSING AUTHORITY COMPENSATION Background After concerns were raised about the level of compensation being paid to some public housing authority (PHA) leaders, in August 2011 HUD reached out to
Georgia s Ranking Among the States: Budget, Taxes, and Other Indicators
 THE CENTER FOR STATE AND LOCAL FINANCE JUNE 2015 Georgia s Ranking Among the States: Budget, Taxes, and Other Indicators IN COLLABORATION WITH ABOUT THE CENTER FOR STATE AND LOCAL FINANCE The (CSLF) mission
State Individual Income Taxes: Treatment of Select Itemized Deductions, 2006
 State Individual Income Taxes: Treatment of Select Itemized Deductions, 2006 State Federal Income Tax State General Sales Tax State Personal Property Tax Interest Expenses Medical Expenses Charitable Contributions
ADDENDUM TO THE HEALTH INSURANCE MARKETPLACE SUMMARY ENROLLMENT REPORT FOR THE INITIAL ANNUAL OPEN ENROLLMENT PERIOD
 ASPE Issue BRIEF ADDENDUM TO THE HEALTH INSURANCE MARKETPLACE SUMMARY ENROLLMENT REPORT FOR THE INITIAL ANNUAL OPEN ENROLLMENT PERIOD For the period: October 1, 2013 March 31, 2014 (Including Additional
california Health Care Almanac Health Care Costs 101: California Addendum
 california Health Care Almanac : California Addendum May 2012 Introduction Health spending represents a significant share of California s economy, but the amounts spent on health care rank among the lowest
In-state Tuition & Fees at Flagship Universities by State 2014-15 Rank School State In-state Tuition & Fees Penn State University Park Pennsylvania 1
 In-state Tuition & Fees at Flagship Universities by State 2014-15 Rank School State In-state Tuition & Fees Penn State University Park Pennsylvania 1 $18,464 New New Hampshire 2 Hampshire $16,552 3 Vermont
Nurse Aide Training Requirements, October 2014
 Nurse Aide Training Requirements, October 2014 Background Federal legislation (Omnibus Budget Reconciliation Act of 1987) and associated regulations (42 CFR 483.152) require that Medicare- and Medicaid-certified
SECTION 109 HOST STATE LOAN-TO-DEPOSIT RATIOS. or branches outside of its home state primarily for the purpose of deposit production.
 SECTION 109 HOST STATE LOAN-TO-DEPOSIT RATIOS The Board of Governors of the Federal Reserve System, the Federal Deposit Insurance Corporation, and the Office of the Comptroller of the Currency (the agencies)
Please contact test@test.com if you have any questions regarding this survey.
 1. Which of the following best describes your position within the company? - CEO/owner - Partner/senior executive - Professional (consultant, legal, medical, architect) - Finance/accounting/purchasing
#1: Unemployment benefits provide an important boost to the economy.
 The Economic Program January 2014 TO: Interested Parties FROM: Alicia Mazzara, Policy Advisor RE: Renew Emergency Unemployment Compensation: 4 Facts about Unemployment Benefits On December 28, Congress
Current State Regulations
 Current State Regulations Alabama: Enacted in 1996, the state of Alabama requires all licensed massage therapists to * A minimum of 650 classroom hours at an accredited school approved by the state of
Economic Impact and Variation in Costs to Provide Community Pharmacy Services
 Economic Impact and Variation in Costs to Provide Community Pharmacy Services Todd Brown MHP, R.Ph. Associate Clinical Specialist and Vice Chair Department of Pharmacy Practice School of Pharmacy Northeastern
Demographic and Background Characteristics
 Demographic and Background Characteristics This subsection summarizes background characteristics of respondents. Knowledge Networks has previously compiled a great deal of information on the demographic
2015 National Utilization and Compensation Survey Report. Section 3 Billing Rates. Based on Data Collected: 4 th Quarter 2014
 2015 National Utilization and Compensation Survey Report Section 3 Billing s Based on Data Collected: 4 th Quarter Copyright 2015 Reproduction of this report or portions thereof without express written
Employment and Earnings of Registered Nurses in 2010
 Employment and Earnings of Registered Nurses in 2010 Thursday, May 25, 2011 The Bureau of Labor Statistics (BLS) released 2010 occupational employment data on May 17, 2011. This document provides several
Cancer Screening 22M 36% 56% Only 56% of uninsured women aged 50 74 are up-to-date with mammography screening. Colorectal Cancer Breast Cancer
 July 2010 22M 22 million adults aged 50 75 need to be screened for colorectal cancer, and 7 million women aged 50 74 need to be screened for breast cancer. Cancer Screening Colorectal Cancer Breast Cancer