Consolidated statement of income
|
|
|
- Mabel McGee
- 8 years ago
- Views:
Transcription
1
2
3 Consolidated statement of income TOTAL For the year ended December 31, (a) Sales (notes 4 & 5) 189, , ,693 Excise taxes (17,887) (17,762) (18,143) Revenues from sales 171, , ,550 Purchases net of inventory variation (note 6) (121,113) (126,798) (113,892) Other operating expenses (note 6) (21,687) (22,784) (19,792) Exploration costs (note 6) (1,633) (1,446) (1,019) Depreciation, depletion and amortization of tangible assets and mineral interests (9,031) (9,525) (7,506) Other income (note 7) 1,725 1,462 1,946 Other expense (note 7) (2,105) (915) (1,247) Financial interest on debt (670) (671) (713) Financial income from marketable securities & cash equivalents Cost of net debt (note 29) (606) (571) (440) Other financial income (note 8) Other financial expense (note 8) (529) (499) (429) Equity in income (loss) of affiliates (note 12) 2,571 2,010 1,925 Income taxes (note 9) (11,110) (13,035) (14,091) Consolidated net income 8,661 10,756 12,614 Group share 8,440 10,609 12,309 Non-controlling interests Earnings per share ( ) Fully-diluted earnings per share ( ) (a) Except for per share amounts. Page 1
 Financial interest on debt (670) (671) (713) Financial income from marketable securities & cash equivalents 64 100 273 Cost of net debt (note 29) (606) (571) (440) Other financial income")
4 Consolidated statement of comprehensive income TOTAL For the year ended December 31, Consolidated net income 8,661 10,756 12,614 Other comprehensive income Actuarial gains and losses 513 (911) (533) Tax effect (216) Items not potentially reclassifiable to profit and loss 297 (549) (342) Currency translation adjustment (2,199) (702) 1,483 Available for sale financial assets 25 (338) 337 Cash flow hedge (84) Share of other comprehensive income of equity affiliates, net amount (857) 160 (15) Other (4) (14) (3) Tax effect (47) 63 (55) Items potentially reclassifiable to profit and loss (2,965) (766) 1,663 Total other comprehensive income (net amount) (note 17) (2,668) (1,315) 1,321 Comprehensive income 5,993 9,441 13,935 - Group share 5,910 9,334 13,585 - Non-controlling interests Page 2
 (766) 1,663 Total other comprehensive income (net amount) (note 17) (2,668) (1,315) 1,321 Comprehensive income 5,993 9,441 13,935 - Group share 5,910 9,334")
5 Consolidated balance sheet TOTAL As of December 31, ASSETS Non-current assets Intangible assets, net (notes 5 & 10) 13,341 12,858 12,413 Property, plant and equipment, net (notes 5 & 11) 75,759 69,332 64,457 Equity affiliates : investments and loans (note 12) 14,804 13,759 12,995 Other investments (note 13) 1,207 1,190 3,674 Hedging instruments of non-current financial debt (note 20) 1,028 1,626 1,976 Deferred income taxes (note 9) 2,810 2,279 2,070 Other non-current assets (note 14) 3,195 2,663 2,457 Total non-current assets 112, , ,042 Current assets Inventories, net (note 15) 16,023 17,397 18,122 Accounts receivable, net (note 16) 16,984 19,206 20,049 Other current assets (note 16) 10,798 10,086 10,767 Current financial assets (note 20) 536 1, Cash and cash equivalents (note 27) 14,647 15,469 14,025 Assets classified as held for sale (note 34) 2,359 3,797 - Total current assets 61,347 67,517 63,663 Total assets 173, , ,705 LIABILITIES & SHAREHOLDERS' EQUITY Shareholders' equity Common shares 5,944 5,915 5,909 Paid-in surplus and retained earnings 74,449 70,116 65,430 Currency translation adjustment (4,385) (1,504) (1,004) Treasury shares (3,379) (3,342) (3,390) Total shareholders' equity - Group share (note 17) 72,629 71,185 66,945 Non-controlling interests 2,281 1,280 1,352 Total shareholders' equity 74,910 72,465 68,297 Non-current liabilities Deferred income taxes (note 9) 12,943 12,132 11,855 Employee benefits (note 18) 3,071 3,744 3,385 Provisions and other non-current liabilities (note 19) 12,701 11,585 10,909 Non-current financial debt (note 20) 25,069 22,274 22,557 Total non-current liabilities 53,784 49,735 48,706 Current liabilities Accounts payable 21,958 21,648 22,086 Other creditors and accrued liabilities (note 21) 13,821 14,698 14,774 Current borrowings (note 20) 8,116 11,016 9,675 Other current financial liabilities (note 20) Liabilities directly associated with the assets classified as held for sale (note 34) 626 1,486 - Total current liabilities 44,797 49,024 46,702 Total liabilities and shareholders' equity 173, , ,705 Page 3
 16,023 17,397 18,122 Accounts receivable, net (note 16) 16,984 19,206 20,049 Other current assets (note 16) 10,798 10,086 10,767 Current financial assets (note 20) 536")
6 Consolidated statement of cash flow TOTAL (note 27) For the year ended December 31, CASH FLOW FROM OPERATING ACTIVITIES Consolidated net income 8,661 10,756 12,614 Depreciation, depletion and amortization 10,058 10,481 8,628 Non-current liabilities, valuation allowances and deferred taxes 1,171 1,470 1,632 Impact of coverage of pension benefit plans - (362) - (Gains) losses on disposals of assets (68) (1,321) (1,590) Undistributed affiliates' equity earnings (583) 211 (107) (Increase) decrease in working capital 1,930 1,084 (1,739) Other changes, net Cash flow from operating activities 21,473 22,462 19,536 CASH FLOW USED IN INVESTING ACTIVITIES Intangible assets and property, plant and equipment additions (22,400) (19,905) (17,950) Acquisitions of subsidiaries, net of cash acquired (16) (191) (854) Investments in equity affiliates and other securities (1,318) (898) (4,525) Increase in non-current loans (2,188) (1,949) (1,212) Total expenditures (25,922) (22,943) (24,541) Proceeds from disposals of intangible assets and property, plant and equipment 1,329 1,418 1,439 Proceeds from disposals of subsidiaries, net of cash sold 1, Proceeds from disposals of non-current investments 248 2,816 5,691 Repayment of non-current loans 1,242 1, Total divestments 4,814 5,871 8,578 Cash flow used in investing activities (21,108) (17,072) (15,963) CASH FLOW USED IN FINANCING ACTIVITIES Issuance (repayment) of shares: - Parent company shareholders Treasury shares (179) (68) - Dividends paid: - Parent company shareholders (5,367) (5,184) (5,140) - Non controlling interests (118) (104) (172) Other transactions with non-controlling interests 1,621 1 (573) Net issuance (repayment) of non-current debt 8,359 5,279 4,069 Increase (decrease) in current borrowings (6,804) (2,754) (3,870) Increase (decrease) in current financial assets and liabilities 978 (947) 896 Cash flow used in financing activities (1,145) (3,745) (4,309) Net increase (decrease) in cash and cash equivalents (780) 1,645 (736) Effect of exchange rates (42) (201) 272 Cash and cash equivalents at the beginning of the period 15,469 14,025 14,489 Cash and cash equivalents at the end of the period 14,647 15,469 14,025 Page 4
 (19,905) (17,950) Acquisitions of")
7 Consolidated statement of changes in shareholders equity TOTAL Common shares issued Paid-in surplus Currency Treasury shares and retained translation earnings adjustment Number Amount Number Amount Shareholders' equity Group Share Non-controlling interests Total shareholders' equity As of January 1, 2011 before IAS 19 R application 2,349,640,931 5,874 60,538 (2,495) (112,487,679) (3,503) 60, ,271 IAS 19 R impacts - - (766) (766) (1) (767) As of January 1, 2011 after IAS 19 R application 2,349,640,931 5,874 59,772 (2,495) (112,487,679) (3,503) 59, ,504 Net income , , ,614 Other comprehensive income (Note 17) - - (112) 1, , ,321 Comprehensive Income ,197 1, , ,935 Dividend - - (6,457) (6,457) (172) (6,629) Issuance of common shares (Note 17) 14,126, Purchase of treasury shares Sale of treasury shares (a) - - (113) - 2,933, Share-based payments (Note 25) Share cancellation (Note 17) Other operations with non-controlling interests - - (553) (450) (123) (573) Other items - - (23) (23) As of December 31, ,363,767,313 5,909 65,430 (1,004) (109,554,173) (3,390) 66,945 1,352 68,297 Net income , , ,756 Other comprehensive income (Note 17) - - (769) (506) - - (1,275) (40) (1,315) Comprehensive Income - - 9,840 (506) - - 9, ,441 Dividend - - (5,237) (5,237) (104) (5,341) Issuance of common shares (Note 17) 2,165, Purchase of treasury shares (1,800,000) (68) (68) - (68) Sale of treasury shares (a) - - (116) - 2,962, Share-based payments (Note 25) Share cancellation (Note 17) Other operations with non-controlling interests (16) 1 Other items (59) (43) As of December 31, ,365,933,146 5,915 70,116 (1,504) (108,391,639) (3,342) 71,185 1,280 72,465 Net income , , ,661 Other comprehensive income (Note 17) (2,890) - - (2,530) (138) (2,668) Comprehensive Income - - 8,800 (2,890) - - 5, ,993 Dividend - - (5,358) (5,358) (118) (5,476) Issuance of common shares (Note 17) 11,745, Purchase of treasury shares (4,414,200) (179) (179) - (179) Sale of treasury shares (a) - - (142) - 3,591, Share-based payments (Note 25) Share cancellation (Note 17) Other operations with non-controlling interests ,027 1,584 Other items As of December 31, ,377,678,160 5,944 74,449 (4,385) (109,214,448) (3,379) 72,629 2,281 74,910 (a) Treasury shares related to the restricted stock grants. Page 5
 - - (112) 1,388 - - 1,276 45 1,321 Comprehensive Income - - 12,197 1,388 - - 13,585 350 13,935 Dividend - - (6,457) - - -")
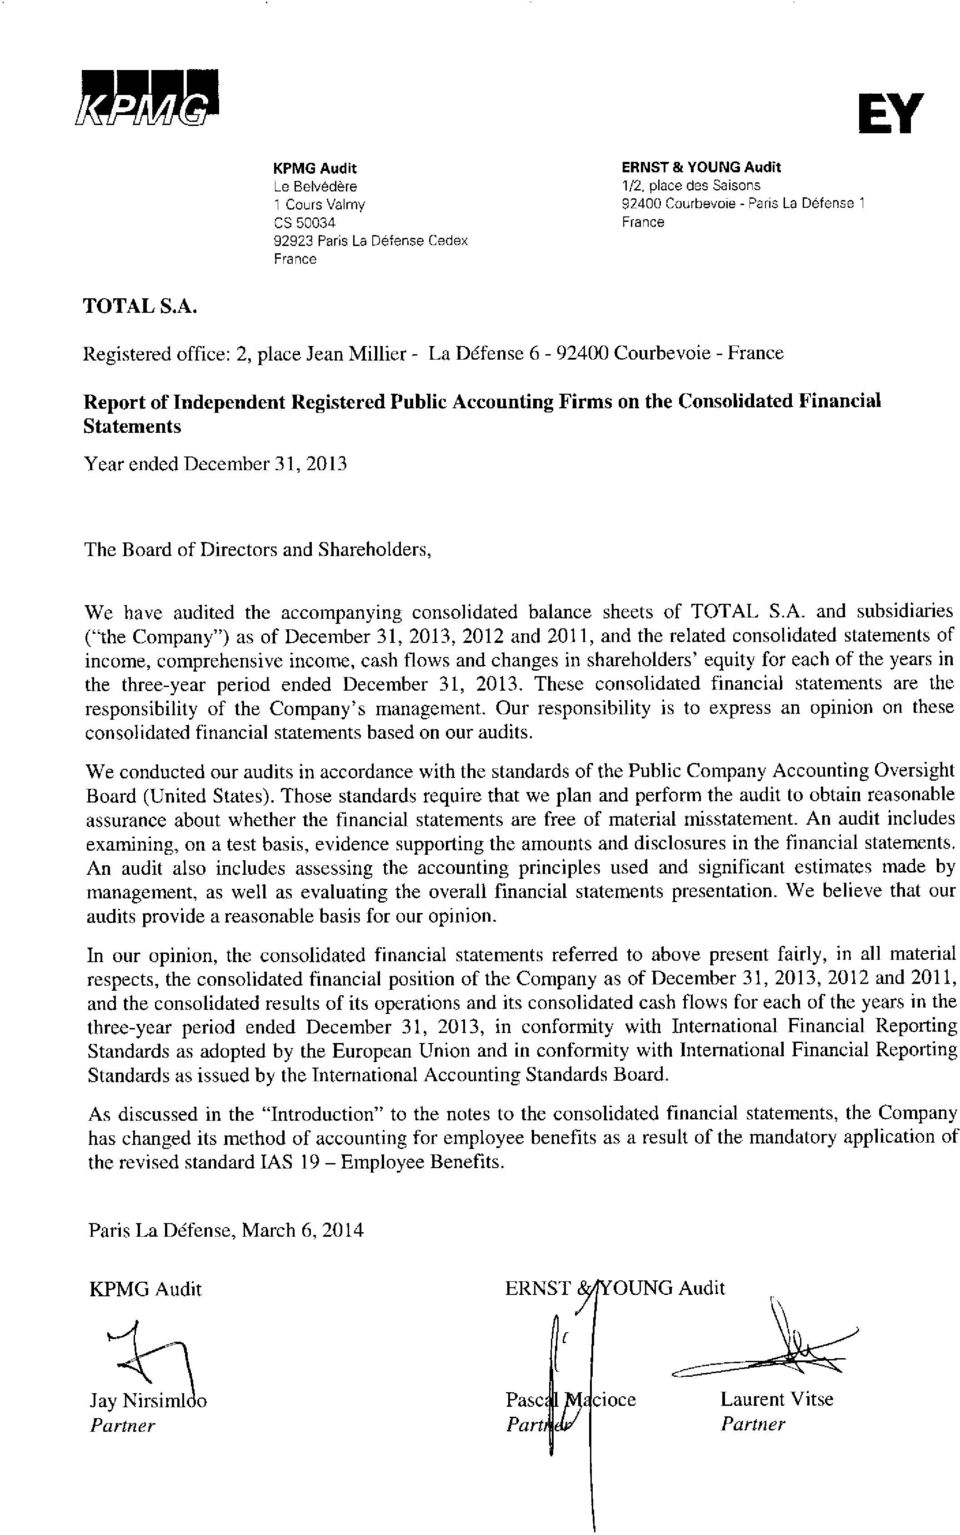
8 TOTAL Notes to the Consolidated Financial Statements On February 11, 2014, the Board of Directors established and authorized the publication of the Consolidated Financial Statements of TOTAL S.A. for the year ended December 31, 2013, which will be submitted for approval to the shareholders meeting to be held on May 16, Introduction The Consolidated Financial Statements of TOTAL S.A. and its subsidiaries (the Group) are presented in Euros and have been prepared on the basis of IFRS (International Financial Reporting Standards) as adopted by the European Union and IFRS as issued by the IASB (International Accounting Standard Board) as of December 31, The accounting principles applied in the Consolidated Financial Statements as of December 31, 2013 were the same as those that were used as of December 31, 2012 except for amendments and interpretations of IFRS which were mandatory for the periods beginning after January 1, 2013 (and not early adopted). The revised standard IAS 19 Employee benefits applicable retrospectively from January 1 st, 2013, led in particular to the full recognition of the net position in respect of employee benefits obligations (liabilities net of assets) in the balance sheet, to the elimination of the corridor approach previously used by the Group, the elimination of the depreciation of past services costs, and to the obligation to evaluate the expected return on plan assets on a normative basis (via the discount rate used to value the debt). The application of this standard had an impact on January 1 st, 2013, on January 1 st, 2012 and on January 1 st, 2011 of an increase in employee benefit provisions of 2.8 billion, 1.8 billion and 1.3 billion respectively, and a respective decrease in equity of 2.8 billion, 1.8 billion and 1.3 billion before tax ( 1.7 billion, 1.1 billion and 0.8 billion after tax). The impact on the profit for 2012 and 2011 is not significant. In accordance with the transitional rules of IAS 19 revised, the comparative periods were restated to take into account the retrospective application of the standard. Application of standards on consolidation: IFRS 10 Consolidated financial statements, IFRS 11 Joint arrangements, IFRS 12 Disclosure of interests in other entities, IAS 27 revised Separate financial statements and IAS 28 revised Investments in associates and joint ventures. The application of these standards did not have a material effect on the Group s consolidated balance sheet, income statement and shareholder s equity as of December 31, The application of standards IFRS 13 Fair value measurement and IAS 1 revised Presentation of financial statements did not have a material effect on the Group s consolidated balance sheet, statement of income and shareholder s equity as of December 31, The preparation of financial statements in accordance with IFRS requires the management to make estimates and assumptions that affect the reported amounts of assets, liabilities and contingent liabilities at the date of preparation of the financial statements and reported income and expenses for the period. The management reviews these estimates and assumptions on an ongoing basis, by reference to past experience and various other factors considered as reasonable which form the basis for assessing the carrying amount of assets and liabilities. Actual results may differ significantly from these estimates, if different assumptions or circumstances apply. These judgments and estimates relate principally to the application of the successful efforts method for the oil and gas accounting, the valuation of long-lived assets, the provisions for asset retirement obligations and environmental remediation, the pensions and post-retirements benefits and the income tax computation. Furthermore, where the accounting treatment of a specific transaction is not addressed by any accounting standard or interpretation, the management applies its judgment to define and apply accounting policies that provide information consistent with the general IFRS concepts: faithful representation, relevance and materiality. Change in presentation currency of the consolidated financial statements To make the financial information of the Group more readable and to better reflect the performance of its activities mainly carried out in U.S. dollars, Total decided to change, effective January 1, 2014, the presentation currency of the consolidated financial statements from the euro to the U.S. dollar. The financial statements of Total S.A., the parent company of the Group remain prepared in euro. The dividend paid therefore remains fixed in euro. Following this change in accounting policy, the comparative consolidated financial statements will be presented in U.S. dollars. Page 6
 as of December 31, 2013.")
9 1) Accounting policies Pursuant to the accrual basis of accounting followed by the Group, the financial statements reflect the effects of transactions and other events when they occur. Assets and liabilities such as property, plant and equipment and intangible assets are usually measured at cost. Assets and liabilities are measured at fair value when required by the standards. Accounting policies used by the Group are described below: A) Principles of consolidation Entities that are directly controlled by the parent company or indirectly controlled by other consolidated entities are fully consolidated. Investments in joint ventures are consolidated under the equity method. The Group accounts for joint operations by recognizing its share of assets, liabilities, income and expenses. Investments in associates, in which the Group has significant influence, are accounted for by the equity method. Significant influence is presumed when the Group holds, directly or indirectly (e.g. through subsidiaries), 20% or more of the voting rights. Companies in which ownership interest is less than 20%, but over which the Company is deemed to exercise significant influence, are also accounted for by the equity method. All intercompany balances, transactions and income are eliminated. B) Business combinations Business combinations are accounted for using the acquisition method. This method requires the recognition of the acquired identifiable assets, assumed liabilities and any non-controlling interests in the companies acquired by the Group at their fair value. The value of the purchase price is finalized within one year from the acquisition date. The acquirer shall recognize goodwill at the acquisition date, being the excess of: The consideration transferred, the amount of non-controlling interests and, in business combinations achieved in stages, the fair value at the acquisition date of the investment previously held in the acquired company; Over the fair value at the acquisition date of acquired identifiable assets and assumed liabilities. If the consideration transferred is lower than the fair value of acquired identifiable assets and assumed liabilities, an additional analysis is performed on the identification and valuation of the identifiable elements of the assets and liabilities. After having completed such additional analysis any residual negative goodwill is recorded as income. In transactions with non-controlling interests, the difference between the price paid (received) and the book value of non-controlling interests acquired (sold) is recognized directly in equity. C) Foreign currency translation The financial statements of subsidiaries are prepared in the currency that most clearly reflects their business environment. This is referred to as their functional currency. (i) Monetary transactions Transactions denominated in foreign currencies other than the functional currency of the entity are translated at the exchange rate on the transaction date. At each balance sheet date, monetary assets and liabilities are translated at the closing rate and the resulting exchange differences are recognized in the statement of income. (ii) Translation of financial statements denominated in foreign currencies Assets and liabilities of foreign entities are translated into euros on the basis of the exchange rates at the end of the period. The income and cash flow statements are translated using the average exchange rates for the period. Foreign exchange differences resulting from such translations are either recorded in shareholders equity under Currency translation adjustments (for the Group share) or under Non-controlling interests (for the share of non-controlling interests) as deemed appropriate. D) Sales and revenues from sales Sales figures include excise taxes collected by the Group within the course of its oil distribution operations. Excise taxes are deducted from sales in order to obtain the Revenues from sales indicator. Page 7

10 (i) Sale of goods Revenues from sales are recognized when the significant risks and rewards of ownership have been passed to the buyer and when the amount is recoverable and can be reasonably measured. Revenues from sales of crude oil, natural gas and coal are recorded upon transfer of title, according to the terms of the sales contracts. Revenues from the production of crude oil and natural gas properties, in which the Group has an interest with other producers, are recognized based on actual volumes sold during the period. Any difference between volumes sold and entitlement volumes, based on the Group net working interest, is recognized as Crude oil and natural gas inventories or Other current assets or Other creditors and accrued liabilities, as appropriate. Quantities delivered that represent production royalties and taxes, when paid in cash, are included in oil and gas sales, except for the United States and Canada. Certain transactions within the trading activities (contracts involving quantities that are purchased from third parties then resold to third parties) are shown at their net value in sales. Exchanges of crude oil and petroleum products within normal trading activities do not generate any income and therefore these flows are shown at their net value in both the statement of income and the balance sheet. (ii) Sale of services Revenues from services are recognized when the services have been rendered. Revenues from gas transport are recognized when services are rendered. These revenues are based on the quantities transported and measured according to procedures defined in each service contract. Shipping revenues and expenses from time-charter activities are recognized on a pro rata basis over a period that commences upon the unloading of the previous voyage and terminates upon the unloading of the current voyage. Shipping revenue recognition starts only when a charter has been agreed to by both the Group and the customer. (iii) Solar Farm Development Projects SunPower develops and sells solar farm projects. This activity generally contains a property component (land ownership or an interest in land rights). The revenue associated with the development of these projects is recognized when the entities-projects and land rights are irrevocably sold. Revenues under contracts for construction of solar systems are recognized based on the progress of construction works, measured according to the percentage of costs incurred relative to total forecast costs. E) Share-based payments The Group may grant employees stock options, create employee share purchase plans and offer its employees the opportunity to subscribe to reserved capital increases. These employee benefits are recognized as expenses with a corresponding credit to shareholders equity. The expense is equal to the fair value of the instruments granted. The expense is recognized on a straight-line basis between the grant date and vesting date. The fair value of the options is calculated using the Black-Scholes model at the grant date. For restricted share plans, the fair value is calculated using the market price at the grant date after deducting the expected distribution rate during the vesting period. The number of allocated equity instruments can be revised during the vesting period in cases of non compliance with performance conditions, with the exception of those related to the market, or according to the rate of turnover of the beneficiaries. The cost of employee-reserved capital increases is immediately expensed. A discount reduces the expense in order to account for the non-transferability of the shares awarded to the employees over a period of five years. F) Income taxes Income taxes disclosed in the statement of income include the current tax expenses and the deferred tax expenses. The Group uses the method whereby deferred income taxes are recorded based on the temporary differences between the carrying amounts of assets and liabilities recorded in the balance sheet and their tax bases, and on carryforwards of unused tax losses and tax credits. Deferred tax assets and liabilities are measured using the tax rates that have been enacted or substantially enacted at the balance sheet date. The tax rates used depend on the timing of reversals of temporary differences, tax losses and Page 8

11 other tax credits. The effect of a change in tax rate is recognized either in the Consolidated Statement of Income or in shareholders equity depending on the item it relates to. Deferred tax assets are recognized when future recovery is probable. Asset retirement obligations and finance leases give rise to the recognition of assets and liabilities for accounting purposes as described in paragraph K Leases and paragraph Q Asset retirement obligations of this Note. Deferred income taxes resulting from temporary differences between the carrying amounts and tax bases of such assets and liabilities are recognized. Deferred taxes resulting from temporary differences between the carrying amounts of equity-method investments and their tax bases are recognized. The deferred tax calculation is based on the expected future tax effect (dividend distribution rates or tax rates on capital gains). G) Earnings per share Earnings per share is calculated by dividing net income (Group share) by the weighted-average number of common shares outstanding during the period, excluding TOTAL shares held by TOTAL S.A. (Treasury shares) and TOTAL shares held by the Group subsidiaries which are deducted from consolidated shareholders equity. Diluted earnings per share is calculated by dividing net income (Group share) by the fully-diluted weighted-average number of common shares outstanding during the period. Treasury shares held by the parent company, TOTAL S.A., and TOTAL shares held by the Group subsidiaries are deducted from consolidated shareholders equity. These shares are not considered outstanding for purposes of this calculation which also takes into account the dilutive effect of stock options, share grants and capital increases with a subscription period closing after the end of the fiscal year. The weighted-average number of fully-diluted shares is calculated in accordance with the treasury stock method provided for by IAS 33. The proceeds, which would be recovered in the event of an exercise of rights related to dilutive instruments, are presumed to be a share buyback at the average market price over the period. The number of shares thereby obtained leads to a reduction in the total number of shares that would result from the exercise of rights. H) Oil and gas exploration and producing properties The Group applies IFRS 6 Exploration for and Evaluation of Mineral Resources. Oil and gas exploration and production properties and assets are accounted for in accordance with the successful efforts method. (i) Exploration costs Geological and geophysical costs, including seismic surveys for exploration purposes are expensed as incurred. Mineral interests are capitalized as intangible assets when acquired. These acquired interests are tested for impairment on a regular basis, property-by-property, based on the results of the exploratory activity and the management s evaluation. In the event of a discovery, the unproved mineral interests are transferred to proved mineral interests at their net book value as soon as proved reserves are booked. Exploratory wells are tested for impairment on a well-by-well basis and accounted for as follows: Costs of exploratory wells which result in proved reserves are capitalized and then depreciated using the unit-ofproduction method based on proved developed reserves; Costs of dry exploratory wells and wells that have not found proved reserves are charged to expense; Costs of exploratory wells are temporarily capitalized until a determination is made as to whether the well has found proved reserves if both of the following conditions are met: The well has found a sufficient quantity of reserves to justify its completion as a producing well, if appropriate, assuming that the required capital expenditures are made; The Group is making sufficient progress assessing the reserves and the economic and operating viability of the project. This progress is evaluated on the basis of indicators such as whether additional exploratory works are under way or firmly planned (wells, seismic or significant studies), whether costs are being incurred for development studies and whether the Group is waiting for governmental or other third-party authorization of a proposed project, or availability of capacity on an existing transport or processing facility. Costs of exploratory wells not meeting these conditions are charged to expense. (ii) Oil and Gas producing assets Development costs incurred for the drilling of wells and for the construction of production and treatment facilities are capitalized, together with borrowing costs incurred during the period of construction and the present value of estimated Page 9

12 future costs of asset retirement obligations. The depletion rate is usually equal to the ratio of oil and gas production for the period to proved developed reserves (unit-of-production method). With respect to production sharing contracts, this computation is based on the portion of production and reserves assigned to the Group taking into account estimates based on the contractual clauses regarding the reimbursement of exploration, development and production costs (cost oil) as well as the sharing of hydrocarbon rights (profit oil). Transportation assets are depreciated using the unit-of-production method based on throughput or by using the straight-line method whichever best reflects the duration of use of the economic life of the asset. Proved mineral interests are depreciated using the unit-of-production method based on proved reserves. I) Goodwill and other intangible assets excluding mineral interests Other intangible assets include goodwill, patents, trademarks, and lease rights. Intangible assets are carried at cost, after deducting any accumulated depreciation and accumulated impairment losses. Guidance for calculating goodwill is presented in Note 1 paragraph B to the Consolidated Financial Statements. Goodwill is not amortized but is tested for impairment annually or as soon as there is any indication of impairment (see Note 1 paragraph L to the Consolidated Financial Statements). In equity affiliates, goodwill is included in the investment book value. Other intangible assets (except goodwill) have a finite useful life and are amortized on a straight-line basis over 3 to 20 years depending on the useful life of the assets. Research and development Research costs are charged to expense as incurred. Development expenses are capitalized when the following can be demonstrated: the technical feasibility of the project and the availability of the adequate resources for the completion of the intangible asset; the ability of the asset to generate probable future economic benefits; the ability to measure reliably the expenditures attributable to the asset; and the feasibility and intention of the Group to complete the intangible asset and use or sell it. Advertising costs are charged to expense as incurred. J) Other property, plant and equipment Other property, plant and equipment are carried at cost, after deducting any accumulated depreciation and accumulated impairment losses. This cost includes borrowing costs directly attributable to the acquisition or production of a qualifying asset incurred until assets are placed in service. Borrowing costs are capitalized as follows: if the project benefits from a specific funding, the capitalization of borrowing costs is based on the borrowing rate; if the project is financed by all the Group s debt, the capitalization of borrowing costs is based on the weighted average borrowing cost for the period. Routine maintenance and repairs are charged to expense as incurred. The costs of major turnarounds of refineries and large petrochemical units are capitalized as incurred and depreciated over the period of time between two consecutive major turnarounds. Other property, plant and equipment are depreciated using the straight-line method over their useful lives, which are as follows: Furniture, office equipment, machinery and tools 3-12 years Transportation equipments 5-20 years Storage tanks and related equipment years Specialized complex installations and pipelines years Buildings years K) Leases Page 10

13 A finance lease transfers substantially all the risks and rewards incidental to ownership from the lessor to the lessee. These contracts are capitalized as assets at fair value or, if lower, at the present value of the minimum lease payments according to the contract. A corresponding financial debt is recognized as a financial liability. These assets are depreciated over the corresponding useful life used by the Group. Leases that are not finance leases as defined above are recorded as operating leases. Certain arrangements do not take the legal form of a lease but convey the right to use an asset or a group of assets in return for fixed payments. Such arrangements are accounted for as leases and are analyzed to determine whether they should be classified as operating leases or as finance leases. L) Impairment of long-lived assets The recoverable amounts of intangible assets and property, plant and equipment are tested for impairment as soon as any indication of impairment exists. This test is performed at least annually for goodwill. The recoverable amount is the higher of the fair value (less costs to sell) or its value in use. Assets are grouped into cash-generating units (or CGUs) and tested. A cash-generating unit is a homogeneous group of assets that generates cash inflows that are largely independent of the cash inflows from other groups of assets. The value in use of a CGU is determined by reference to the discounted expected future cash flows, based upon the management s expectation of future economic and operating conditions. When this value is less than the carrying amount of the CGU, an impairment loss is recorded. It is allocated first to goodwill in counterpart of "Other expenses". These impairment losses are then allocated to "Depreciation, depletion and amortization of tangible assets and mineral interests" for property, plant and mineral interests and to "Other expenses" for other intangible assets. Impairment losses recognized in prior periods can be reversed up to the original carrying amount, had the impairment loss not been recognized. Impairment losses recognized for goodwill cannot be reversed. M) Financial assets and liabilities Financial assets and liabilities are financial loans and receivables, investments in non-consolidated companies, publicly traded equity securities, derivatives instruments and current and non-current financial liabilities. The accounting treatment of these financial assets and liabilities is as follows: (i) Loans and receivables Financial loans and receivables are recognized at amortized cost. They are tested for impairment, by comparing the carrying amount of the assets to estimates of the discounted future recoverable cash flows. These tests are conducted as soon as there is any evidence that their fair value is less than their carrying amount, and at least annually. Any impairment loss is recorded in the statement of income. (ii) Other investments These assets are classified as financial assets available for sale and therefore measured at their fair value. For listed securities, this fair value is equal to the market price. For unlisted securities, if the fair value is not reliably determinable, securities are recorded at their historical value. Changes in fair value are recorded in shareholders equity. If there is any evidence of a significant or long-lasting impairment loss, a loss is recorded in the Statement of Income. This impairment is irreversible. (iii) Derivative instruments The Group uses derivative instruments to manage its exposure to risks of changes in interest rates, foreign exchange rates and commodity prices. Changes in fair value of derivative instruments are recognized in the statement of income or in shareholders equity and are recognized in the balance sheet in the accounts corresponding to their nature, according to the risk management strategy described in Note 31 to the Consolidated Financial Statements. The derivative instruments used by the Group are the following: - Cash management Financial instruments used for cash management purposes are part of a hedging strategy of currency and interest rate risks within global limits set by the Group and are considered to be used for transactions (held for trading). Changes in fair value are systematically recorded in the statement of income. The balance sheet value of those instruments is included in Current financial assets or Other current financial liabilities. - Long-term financing When an external long-term financing is set up, specifically to finance subsidiaries, and when this financing involves currency and interest rate derivatives, these instruments are qualified as: Page 11

14 i. Fair value hedge of the interest rate risk on the external debt and of the currency risk of the loans to subsidiaries. Changes in fair value of derivatives are recognized in the statement of income as are changes in fair value of underlying financial debts and loans to subsidiaries. ii. The fair value of those hedging instruments of long-term financing is included in the assets under Hedging instruments on non-current financial debt or in the liabilities under Non-current financial debt for the noncurrent portion. The current portion (less than one year) is accounted for in Current financial assets or Other current financial liabilities. In case of the anticipated termination of derivative instruments accounted for as fair value hedges, the amount paid or received is recognized in the statement of income and: If this termination is due to an early cancellation of the hedged items, the adjustment previously recorded as revaluation of those hedged items is also recognized in the statement of income; If the hedged items remain in the balance sheet, the adjustment previously recorded as a revaluation of those hedged items is spread over the remaining life of those items. Cash flow hedge of the currency risk of the external debt. Changes in fair value are recorded in Other comprehensive Income for the effective portion of the hedging and in the statement of income for the ineffective portion of the hedging. Amounts recorded in equity are transferred to the income statement when the hedged transaction affects profit or loss. The fair value of those hedging instruments of long-term financing is included in the assets under Hedging instruments on non-current financial debt or in the liabilities under Non-current financial debt for the noncurrent portion. The current portion (less than one year) is accounted for in Current financial assets or Other current financial liabilities. If the hedging instrument expires, is sold or terminated by anticipation, gains or losses previously recognized in equity remain in equity. Amounts are recycled in the income statement only when the hedged transaction affects profit or loss. - Foreign subsidiaries equity hedge Certain financial instruments hedge against risks related to the equity of foreign subsidiaries whose functional currency is not the euro (mainly the dollar). These instruments qualify as net investment hedges and changes in fair value are recorded in Other comprehensive income for the effective portion of the hedging and in the statement of income for the ineffective portion of the hedging. Gains or losses on hedging instruments previously recorded in equity, are reclassified to the statement of income in the same period as the total or partial disposal of the foreign activity. The fair value of these instruments is recorded under Current financial assets or Other current financial liabilities. - Financial instruments related to commodity contracts Financial instruments related to commodity contracts, including crude oil, petroleum products, gas, power and coal purchase/sales contracts within the trading activities, together with the commodity contract derivative instruments such as energy contracts and forward freight agreements, are used to adjust the Group's exposure to price fluctuations within global trading limits. According to the industry practice, these instruments are considered as held for trading. Changes in fair value are recorded in the statement of income. The fair value of these instruments is recorded in Other current assets or Other creditors and accrued liabilities depending on whether they are assets or liabilities. Detailed information about derivatives positions is disclosed in Notes 20, 28, 29, 30 and 31 to the Consolidated Financial Statements. (iv) Current and non-current financial liabilities Current and non-current financial liabilities (excluding derivatives) are recognized at amortized cost, except those for which hedge accounting can be applied as described in the previous paragraph. (v) Fair value of financial instruments Fair values are estimated for the majority of the Group s financial instruments, with the exception of publicly traded equity securities and marketable securities for which the market price is used. Estimations of fair value, which are based on principles such as discounting future cash flows to present value, must be weighted by the fact that the value of a financial instrument at a given time may be influenced by the market environment (liquidity especially), and also the fact that subsequent changes in interest rates and exchange rates are not taken into account. As a consequence, the use of different estimates, methodologies and assumptions could have a material effect on the estimated fair value amounts. The methods used are as follows: - Financial debts, swaps Page 12
 is accounted for in Current financial assets or Other current financial liabilities.")
15 The market value of swaps and of bonds that are hedged by those swaps has been determined on an individual basis by discounting future cash flows with the zero coupon interest rate curves existing at year-end. - Financial instruments related to commodity contracts The valuation methodology is to mark to market all open positions for both physical and paper transactions. The valuations are determined on a daily basis using observable market data based on organized and over the counter (OTC) markets. In particular cases when market data are not directly available, the valuations are derived from observable data such as arbitrages, freight or spreads and market corroboration. For valuation of risks which are the result of a calculation, such as options for example, commonly known models are used to compute the fair value. - Other financial instruments The fair value of the interest rate swaps and of FRA (Forward Rate Agreement) are calculated by discounting future cash flows on the basis of zero coupon interest rate curves existing at year-end after adjustment for interest accrued but unpaid. Forward exchange contracts and currency swaps are valued on the basis of a comparison of the negociated forward rates with the rates in effect on the financial markets at year-end for similar maturities. Exchange options are valued based on the Garman-Kohlhagen model including market quotations at year-end. - Fair value hierarchy IFRS 7 "Financial instruments: disclosures", amended in 2009, introduces a fair value hierarchy for financial instruments and proposes the following three-level classification: level 1: quotations for assets and liabilities (identical to the ones that are being valued) obtained at the valuation date on an active market to which the entity has access; level 2: the entry data are observable data but do not correspond to quotations for identical assets or liabilities; level 3: the entry data are not observable data. For example: these data come from extrapolation. This level applies when there is no market or observable data and the company has to use its own hypotheses to estimate the data that other market players would have used to determine the fair value of the asset. Fair value hierarchy is disclosed in Notes 29 and 30 to the Consolidated Financial Statements. (vi) Commitments to purchase shares held by non-controlling interests (put options written on minority interests) Put options granted to non-controlling-interest shareholders are initially recognized as financial liabilities at the present value of the exercise price of the options with a corresponding reduction in shareholders equity. The financial liability is subsequently measured at fair value at each balance sheet date in accordance with contractual clauses and any variation is recorded in the statement of income (cost of debt). Page 13

16 N) Inventories Inventories are measured in the Consolidated Financial Statements at the lower of historical cost or market value. Costs for petroleum and petrochemical products are determined according to the FIFO (First-In, First-Out) method and other inventories are measured using the weighted-average cost method. In addition stocks held for trading are measured at fair value less costs of sale. Refining & Chemicals Petroleum product inventories are mainly comprised of crude oil and refined products. Refined products principally consist of gasoline, kerosene, diesel, fuel oil and heating oil produced by the Group's refineries. The turnover of petroleum products does not exceed more than two months on average. Crude oil costs include raw material and receiving costs. Refining costs principally include crude oil costs, production costs (energy, labor, depreciation of producing assets) and an allocation of production overheads (taxes, maintenance, insurance, etc.). Costs of chemical product inventories consist of raw material costs, direct labor costs and an allocation of production overheads. Start-up costs, general administrative costs and financing costs are excluded from the cost price of refined and chemicals products. Marketing & Services The costs of refined products include mainly crude oil costs, production costs (energy, labor, depreciation of producing assets) and an allocation of production overheads (taxes, maintenance, insurance, etc.). Start-up costs, general administrative costs and financing costs are excluded from the cost price of refined products. Product inventories purchased from entities external to the Group are valued at their purchase cost plus primary costs of transport. O) Treasury shares Treasury shares of the parent company held by its subsidiaries or itself are deducted from consolidated shareholders' equity. Gains or losses on sales of treasury shares are excluded from the determination of net income and are recognized in shareholders equity. P) Provisions and other non-current liabilities A provision is recognized when the Group has a present obligation (legal or constructive) as a result of a past event for which it is probable that an outflow of resources will be required and when a reliable estimate can be made regarding the amount of the obligation. The amount of the liability corresponds to the best possible estimate. Provisions and non-current liabilities are comprised of liabilities for which the amount and the timing are uncertain. They arise from environmental risks, legal and tax risks, litigation and other risks. Q) Asset retirement obligations Asset retirement obligations, which result from a legal or constructive obligation, are recognized based on a reasonable estimate in the period in which the obligation arises. The associated asset retirement costs are capitalized as part of the carrying amount of the underlying asset and depreciated over the useful life of this asset. An entity is required to measure changes in the liability for an asset retirement obligation due to the passage of time (accretion) by applying a risk-free discount rate to the amount of the liability. The increase of the provision due to the passage of time is recognized as Other financial expense. R) Employee benefits In accordance with the laws and practices of each country, the Group participates in employee benefit plans offering retirement, death and disability, healthcare and special termination benefits. These plans provide benefits based on various factors such as length of service, salaries, and contributions made to the governmental bodies responsible for the payment of benefits. These plans can be either defined contribution or defined benefit pension plans and may be entirely or partially funded with investments made in various non-group instruments such as mutual funds, insurance contracts, and other instruments. Page 14

17 For defined contribution plans, expenses correspond to the contributions paid. Defined benefit obligations are determined according to the Projected Unit Method. Actuarial gains and losses may arise from differences between actuarial valuation and projected commitments (depending on new calculations or assumptions) and between projected and actual return of plan assets. Such gains and losses are recognized in the statement of comprehensive income, with no possibility to subsequently recycle them to the income statement. The past service cost is recorded immediately in the statement of income, whether vested or unvested. The net periodic pension cost is recognized under Other operating expenses. S) Consolidated Statement of Cash Flows The Consolidated Statement of Cash Flows prepared in foreign currencies has been translated into euros using the exchange rate on the transaction date or the average exchange rate for the period. Currency translation differences arising from the translation of monetary assets and liabilities denominated in foreign currency into euros using the closing exchange rates are shown in the Consolidated Statement of Cash Flows under Effect of exchange rates. Therefore, the Consolidated Statement of Cash Flows will not agree with the figures derived from the Consolidated Balance Sheet. Cash and cash equivalents Cash and cash equivalents are comprised of cash on hand and highly liquid short-term investments that are easily convertible into known amounts of cash and are subject to insignificant risks of changes in value. Investments with maturities greater than three months and less than twelve months are shown under Current financial assets. Changes in current financial assets and liabilities are included in the financing activities section of the Consolidated Statement of Cash Flows. Non-current financial debt Changes in non-current financial debt are presented as the net variation to reflect significant changes mainly related to revolving credit agreements. T) Carbon dioxide emission rights In the absence of a current IFRS standard or interpretation on accounting for emission rights of carbon dioxide, the following principles are applied: - Emission rights are managed as a cost of production and as such are recognized in inventories: Emission rights allocated for free are booked in inventories with a nil carrying amount, Purchased emission rights are booked at acquisition cost, Sales or annual restorations of emission rights consist of decreases in inventories recognized based on a weighted average cost, If the carrying amount of inventories at closing date is higher than the market value, an impairment loss is recorded. - At each closing, a provision is recorded in order to materialize the obligation of emission rights restoration related to the emissions of the period. This provision is calculated based on estimated emissions of the period, valued at weighted average cost of the inventories at the end of the period. It is reversed when the emission rights are restored. - If emission rights to be delivered at the end of the compliance period are higher than emission rights (allocated and purchased) booked in inventories, the shortage is accounted for as a liability at market value. - Forward transactions are recognized at their fair market value in the balance sheet. Changes in the fair value of such forward transactions are recognized in the statement of income. U) Energy savings certificates In the absence of current IFRS standards or interpretations on accounting for energy savings certificates, the following principles are applied: - If the obligations linked to the sales of energy are greater than the number of ESC s held then a liability is recorded. These liabilities are valued based on the price of the last transactions. Page 15

18 - In the event that the number of ESC s held exceeds the obligation at the balance sheet date this is accounted for as inventory. - ESC inventories are valued at weighted average cost (acquisition cost for those ESC acquired or cost incurred for those ESC generated internally). If the carrying value of the inventory of certificates at the balance sheet date is higher than the market value, an impairment loss is recorded in income V) Non-current assets held for sale and discontinued operations Pursuant to IFRS 5 "Non-current assets held for sale and discontinued operations, assets and liabilities of affiliates that are held for sale are presented separately on the face of the balance sheet. Depreciation of assets ceases from the date of classifcation in Non-current assets held for sale. Net income from discontinued operations is presented separately on the face of the statement of income. Therefore, the notes to the Consolidated Financial Statements related to the statement of income only refer to continuing operations. A discontinued operation is a component of the Group for which cash flows are independent. It represents a major line of business or geographical area of operations which has been disposed of or is currently being held for sale. W) New accounting principles not yet in effect The standards or interpretations published respectively by the International Accounting Standards Board (IASB) and the International Financial Reporting Interpretations Committee (IFRIC) which were not yet in effect at December 31, 2013, are as follows: Standards not yet adopted by the European Union at December 31, In November 2009, the IASB issued standard IFRS 9 Financial Instruments that introduces new requirements for the classification and measurement of financial assets, and included in October 2010 requirements regarding classification and measurement of financial liabilities. This standard shall be completed with texts on impairment of financial assets measured at amortized cost and hedge accounting. Under standard IFRS 9, financial assets and liabilities are generally measured either at fair value through profit or loss or at amortized cost if certain conditions are met. The standard will not be applicable before The application of the standard as published in 2010 should not have any material effect on the Group s consolidated balance sheet, statement of income and shareholder s equity. - In May 2013, the IASB issued the interpretation IFRIC 21 Levies. This interpretation is applicable retrospectively for annual periods beginning on or after January 1st, The impacts of the application of this interpretation are under review. 2) Main indicators - information by business segment Performance indicators excluding the adjustment items, such as adjusted operating income, adjusted net operating income, and adjusted net income are meant to facilitate the analysis of the financial performance and the comparison of income between periods. Adjustment items The detail of these adjustment items is presented in Note 4 to the Consolidated Financial Statements. Adjustment items include: (i) Special items Due to their unusual nature or particular significance, certain transactions qualified as "special items" are excluded from the business segment figures. In general, special items relate to transactions that are significant, infrequent or unusual. However, in certain instances, transactions such as restructuring costs or assets disposals, which are not considered to be representative of the normal course of business, may be qualified as special items although they may have occurred within prior years or are likely to occur again within the coming years. (ii) The inventory valuation effect The adjusted results of the Refining & Chemicals and Marketing & Services segments are presented according to the replacement cost method. This method is used to assess the segments performance and facilitate the comparability of the segments performance with those of its competitors. In the replacement cost method, which approximates the LIFO (Last-In, First-Out) method, the variation of inventory values in the statement of income is, depending on the nature of the inventory, determined using either the month-end prices differential between one period and another or the average prices of the period rather than the historical value. Page 16

19 The inventory valuation effect is the difference between the results according to the FIFO (First-In, First-Out) and the replacement cost. (iii) Effect of changes in fair value The effect of changes in fair value presented as adjustment items reflects for some transactions differences between internal measures of performance used by TOTAL s management and the accounting for these transactions under IFRS. IFRS requires that trading inventories be recorded at their fair value using period end spot prices. In order to best reflect the management of economic exposure through derivative transactions, internal indicators used to measure performance include valuations of trading inventories based on forward prices. Furthermore, TOTAL, in its trading activities, enters into storage contracts, which future effects are recorded at fair value in Group s internal economic performance. IFRS precludes recognition of this fair value effect. Main indicators (i) Operating income (measure used to evaluate operating performance) Revenue from sales after deducting cost of goods sold and inventory variations, other operating expenses, exploration expenses and depreciation, depletion, and amortization. Operating income excludes the amortization of intangible assets other than mineral interests, currency translation adjustments and gains or losses on the disposal of assets. (ii) Net operating income (measure used to evaluate the return on capital employed) Operating income after taking into account the amortization of intangible assets other than mineral interests, currency translation adjustments, gains or losses on the disposal of assets, as well as all other income and expenses related to capital employed (dividends from non-consolidated companies, equity in income of affiliates, capitalized interest expenses), and after income taxes applicable to the above. The only income and expense not included in net operating income but included in net income are interest expenses related to net financial debt, after applicable income taxes (net cost of net debt) and non-controlling interests. (iii) Adjusted income Operating income, net operating income, or net income excluding the effect of adjustment items described above. (iv) Fully-diluted adjusted earnings per share Adjusted net income divided by the fully-diluted weighted-average number of common shares. (v) Capital employed Non-current assets and working capital, at replacement cost, net of deferred income taxes and non-current liabilities. (vi) ROACE (Return on Average Capital Employed) Ratio of adjusted net operating income to average capital employed between the beginning and the end of the period. (vii) ROE (Return on Equity) Ratio of adjusted consolidated net income to average adjusted shareholders equity (after distribution) between the beginning and the end of the period. (viii) Net debt Non-current debt, including current portion, current borrowings, other current financial liabilities, less cash and cash equivalents and other current financial assets. Page 17

20 3) Changes in the Group structure, main acquisitions and divestments During 2013, 2012 and 2011, main changes in the Group structure and main acquisitions and divestments were as follows: 2013 Upstream TOTAL finalized in February 2013 the acquisition of an additional 6% interest in the Ichthys liquefied natural gas (LNG) project from its partner INPEX. TOTAL s overall equity stake in the Ichthys LNG project increased from 24% to 30%. TOTAL finalized in February 2013 the sale to INPEX of a 9.99% indirect interest in offshore Angola Block 14 On March 27, 2013, TOTAL entered into an agreement for the sale to Suncor Energy Inc. of its 49% interest in the Voyageur upgrader project, which is located in the Canadian province of Alberta and intended to upgrade bitumen from the Fort Hills and Joslyn mines. The transaction amounted to $506 million ( 381 million). The mining development projects of Fort Hills and Joslyn continue according to the production evacuation logistics studies jointly conducted with Suncor. The sale entails a net loss of 1,247 million. TOTAL finalized in June 2013 the sale of a 25% interest in the Tempa Rossa field in Italy to Mitsui. TOTAL finalized in July 2013 the sale of 100% of Transport et Infrastructures Gaz France (TIGF) to a consortium comprising Snam, EDF and GIC (Government of Singapore Investment Corporation) for an amount of 1,558 million, net of cash sold. TOTAL finalized in September 2013 the sale of its Upstream interests in Trinidad & Tobago to The National Gas Company of Trinidad & Tobago for an amount of 236 million ($ 318 million), net of cash sold. TOTAL finalized in December 2013 the acquisition by Qatar Petroleum International of 15% of the capital of Total E&P Congo through a capital increase of 1,225 million ($ 1,627 million), TOTAL finalized during 2013 the acquisition of an additional 1.62% interest in Novatek for an amount of 437 million ($587 million), bringing TOTAL s overall interest in Novatek to 16.96% as at December 31, In October 2013, a consortium in which TOTAL holds a 20% interest was awarded a production sharing contract for 35 years to develop the Libra oil field in Brazil. TOTAL paid a signing bonus of 3,000 million Brazilian Real (approximately $ 1,301 million). Refining & Chemicals TOTAL finalized in June 2013 the sale of its fertilizing businesses in Europe. Information relating to sales in progress is presented in accordance with IFRS 5 "Non-current assets held for sale and discontinued operations in note Upstream TOTAL finalized in February 2012 the acquisition in Uganda of a one-third interest in Blocks 1, 2 and 3A held by Tullow Oil plc for 1,157 million ($1,487 million), entirely consisting of mineral interests. TOTAL became an equal partner with Tullow and CNOOC in the blocks, each with a one-third interest and each being an operator of one of the blocks. TOTAL is the operator of Block 1. TOTAL finalized during 2012 the acquisition of an additional 1.25% interest in Novatek for an amount of 368 million ($480 million), increasing TOTAL s overall interest in Novatek to 15.34% as at December 31, TOTAL finalized in October 2012 the sale of its interest in the Cusiana field as well as a participation in OAM and ODC pipelines in Colombia to Sinochem, for an amount of 318 million ($409 million), net of cash sold. Holding During 2012, TOTAL gradually sold its remaining interest in Sanofi, generating a net capital gain of 341 million after tax. As at the December 31, 2012 the Group retained no further interest in the capital of Sanofi. Page 18

TOTAL S.A. Year ended December 31, 2014
 KPMG Audit ERNST & YOUNG Audit This is a free translation into English of the statutory auditors report on the consolidated financial statements issued in French and it is provided solely for the convenience
Note 2 SIGNIFICANT ACCOUNTING
 Note 2 SIGNIFICANT ACCOUNTING POLICIES BASIS FOR THE PREPARATION OF THE FINANCIAL STATEMENTS The consolidated financial statements have been prepared in accordance with International Financial Reporting
Summary of significant accounting policies
 1 (14) Summary of significant accounting policies The principal accounting policies applied in the preparation of Neste's consolidated financial statements are set out below. These policies have been consistently
CONSOLIDATED STATEMENT OF INCOME
 CONSOLIDATED STATEMENT OF INCOME 4 th quarter (a) 3 rd quarter 4 th quarter 2009 Sales 40,157 40,180 36,228 Excise taxes (4,397) (4,952) (4,933) Revenues from sales 35,760 35,228 31,295 Purchases, net
SIGNIFICANT GROUP ACCOUNTING POLICIES
 SIGNIFICANT GROUP ACCOUNTING POLICIES Basis of consolidation Subsidiaries Subsidiaries are all entities over which the Group has the sole right to exercise control over the operations and govern the financial
SAMPLE MANUFACTURING COMPANY LIMITED CONSOLIDATED FINANCIAL STATEMENTS. Year ended December 31, 2011
 SAMPLE MANUFACTURING COMPANY LIMITED CONSOLIDATED FINANCIAL STATEMENTS Year ended SAMPLE MANUFACTURING COMPANY LIMITED CONSOLIDATED FINANCIAL STATEMENTS For the year ended The information contained in
Residual carrying amounts and expected useful lives are reviewed at each reporting date and adjusted if necessary.
 87 Accounting Policies Intangible assets a) Goodwill Goodwill represents the excess of the cost of an acquisition over the fair value of identifiable net assets and liabilities of the acquired company
Consolidated financial statements
 Summary of significant accounting policies Basis of preparation DSM s consolidated financial statements have been prepared in accordance with International Financial Reporting Standards (IFRS) as adopted
(Amounts in millions of Canadian dollars except for per share amounts and where otherwise stated. All amounts stated in US dollars are in millions.
 Notes to the Consolidated Financial Statements (Amounts in millions of Canadian dollars except for per share amounts and where otherwise stated. All amounts stated in US dollars are in millions.) 1. Significant
INTERIM CONDENSED CONSOLIDATED FINANCIAL STATEMENTS FOR THE PERIOD ENDED SEPTEMBER 30, 2011. (Unaudited)
") INTERIM CONDENSED CONSOLIDATED FINANCIAL STATEMENTS FOR THE PERIOD ENDED SEPTEMBER 30, 2011 (Unaudited) 1 Condensed Consolidated Balance Sheets (Unaudited) September 30, December 31, January 1, (millions
INTERIM CONDENSED CONSOLIDATED FINANCIAL STATEMENTS FOR THE PERIOD ENDED SEPTEMBER 30, 2011 (Unaudited) 1 Condensed Consolidated Balance Sheets (Unaudited) September 30, December 31, January 1, (millions
In addition, Outokumpu has adopted the following amended standards as of January 1, 2009:
 1. Corporate information Outokumpu Oyj is a Finnish public limited liability company organised under the laws of Finland and domiciled in Espoo. The parent company, Outokumpu Oyj, has been listed on the
Consolidated financial statements 2011
 Consolidated financial statements 2011 Page 1 4.2 Consolidated financial statements 4.2.1 Consolidated income statement ( million) 2011 2010 Sales of goods and services 41,192 37,654 Sales financing revenues
The only way is forward
 Neste Oil in 2014 The only way is forward Financial statements 2 FINANCIAL STATEMENTS 3 Key financial indicators 3 Calculation of key financial indicators 4 Consolidated financial statements 6 Consolidated
Consolidated Statement of Financial Position Sumitomo Corporation and Subsidiaries As of March 31, 2016 and 2015. Millions of U.S.
 Consolidated Statement of Financial Position Sumitomo Corporation and Subsidiaries As of March 31, 2016 and 2015 ASSETS Current assets: Cash and cash equivalents 868,755 895,875 $ 7,757 Time deposits 11,930
ACCOUNTING POLICIES. for the year ended 30 June 2014
 ACCOUNTING POLICIES REPORTING ENTITIES City Lodge Hotels Limited (the company) is a company domiciled in South Africa. The group financial statements of the company as at and comprise the company and its
EXPLANATORY NOTES. 1. Summary of accounting policies
 1. Summary of accounting policies Reporting Entity Taranaki Regional Council is a regional local authority governed by the Local Government Act 2002. The Taranaki Regional Council group (TRC) consists
INGENICO GROUP Consolidated Financial Statements
 INGENICO GROUP Consolidated Financial Statements December 31, 2014 Ingenico Consolidated Financial Statements December 31, 2014 I. CONSOLIDATED INCOME STATEMENTS For the years ended December 31, 2014 and
Consolidated Financial Statements Notes to the Consolidated Financial Statements for Fiscal Year 2014
 171 The most important exchange rates applied in the consolidated financial statements developed as follows in relation to the euro: Currency Average rate Closing rate Country 1 EUR = 2014 2013 2014 2013
Acal plc. Accounting policies March 2006
 Acal plc Accounting policies March 2006 Basis of preparation The consolidated financial statements of Acal plc and all its subsidiaries have been prepared in accordance with International Financial Reporting
INTERIM CONSOLIDATED FINANCIAL STATEMENTS
 INTERIM CONSOLIDATED FINANCIAL STATEMENTS (prepared in accordance with US GAAP) As of and for the three-month period ended March 31, 2015 (unaudited) These interim consolidated financial statements were
CONSOLIDATED FINANCIAL STATEMENTS
 CONSOLIDATED FINANCIAL STATEMENTS 2010 Consolidated statement of income Note 2010 2009 Revenue 3 9 104 8 529 Other income from operations 45 61 Cost of sales (7 824) (7 508) Gross margin 1 326 1 082 Research
Investments and advances... 313,669
 Consolidated Financial Statements of the Company The consolidated balance sheet, statement of income, and statement of equity of the Company are as follows. Please note the Company s consolidated financial
Consolidated financial statements 2012
 Consolidated financial statements 2012 Page 1 4.2 Consolidated financial statements 4.2.1 Consolidated income statement ( million) 2012 2011 Revenues (note 4) 41,270 42,628 Cost of goods and services sold
Principal Accounting Policies
 1. Basis of Preparation The accounts have been prepared in accordance with Hong Kong Financial Reporting Standards ( HKFRS ). The accounts have been prepared under the historical cost convention as modified
How To Account For A Financial Adjustment In The Year Ending March 31, 2015
 Notes Notes to to Consolidated Consolidated Financial Financial Statements Statements Mitsubishi Corporation FINANCIAL SECTION 1. REPORTING ENTITY Mitsubishi Corporation
Brussels, March 2014 Summary of significant accounting policies
 Brussels, March 2014 Summary of significant accounting policies Tessenderlo Chemie NV (hereafter referred to as the "company"), the parent company, is domiciled in Belgium. The consolidated financial statements
NOTES TO THE FINANCIAL STATEMENTS
 NOTES TO THE FINANCIAL STATEMENTS 1 SIGNIFICANT ACCOUNTING POLICIES (a) Statement of compliance These financial statements have been prepared in accordance with all applicable Hong Kong Financial Reporting
Consolidated Financial Statements
 Consolidated Financial Statements For the year ended February 20, 2016 Nitori Holdings Co., Ltd. Consolidated Balance Sheet Nitori Holdings Co., Ltd. and consolidated subsidiaries As at February 20, 2016
Japan Vilene Company, Ltd. and Subsidiaries
 - 27 - Japan Vilene Company, Ltd. and Subsidiaries Notes to Consolidated Financial Statements Year Ended March 31, 2015 1. BASIS OF PRESENTATION OF CONSOLIDATED FINANCIAL STATEMENTS The accompanying consolidated
Annual Report 2009 Financial Information
 Annual Report 2009 Financial Information Financial Information 2009 Contents 01 Chief Executive Officer and Chief Financial Officer s Responsibility Statement 02 2009 Consolidated Financial Statements
G8 Education Limited ABN: 95 123 828 553. Accounting Policies
 G8 Education Limited ABN: 95 123 828 553 Accounting Policies Table of Contents Note 1: Summary of significant accounting policies... 3 (a) Basis of preparation... 3 (b) Principles of consolidation... 3
MATRIX IT LTD. AND ITS SUBSIDIARIES CONSOLIDATED FINANCIAL STATEMENTS
 CONSOLIDATED FINANCIAL STATEMENTS AS OF DECEMBER 31, 2013 CONSOLIDATED FINANCIAL STATEMENTS AS OF DECEMBER 31, 2013 NIS IN THOUSANDS INDEX Page Auditors' Reports 2-4 Consolidated Statements of Financial
Notes to Consolidated Financial Statements Year ended March 31, 2014
 Notes to Consolidated Financial Statements Year ended March 31, 2014 Mitsui Oil Exploration Co., Ltd. and Consolidated Subsidiaries 1. Basis of Presenting Consolidated Financial Statements The accompanying
N otes to Consolidated Financial Statements
 N otes to Consolidated Financial Statements Brother Industries, Ltd. and Consolidated Subsidiaries For the Years ended March 31, 2011 and 2010 1. Basis of Presenting Consolidated Financial Statements The
NOTES TO THE CONSOLIDATED FINANCIAL STATEMENTS
 105 SHELL ANNUAL REPORT AND FORM 20-F 2013 CONSOLIDATED FINANCIAL STATEMENTS NOTES TO THE CONSOLIDATED FINANCIAL STATEMENTS 1 BASIS OF PREPARATION The Consolidated Financial Statements of Royal Dutch Shell
CONSOLIDATED FINANCIAL STATEMENTS
 CONSOLIDATED FINANCIAL STATEMENTS TABLE OF CONTENTS MANAGEMENT S STATEMENT OF RESPONSIBILITY FOR FINANCIAL REPORTING 65 INDEPENDENT AUDITOR S REPORT 66 CONSOLIDATED FINANCIAL STATEMENTS 67 Consolidated
CONSOLIDATED FINANCIAL INFORMATION
 www.legrand.com CONSOLIDATED FINANCIAL INFORMATION AS OF DECEMBER 31, LEGRAND STATUTORY AUDITORS REPORT ON THE CONSOLIDATED FINANCIAL STATEMENTS FOR THE YEAR ENDED DECEMBER 31, PricewaterhouseCoopers Audit
ANNUAL FINANCIAL RESULTS
 ANNUAL FINANCIAL RESULTS Directors Statement The directors of Air New Zealand Limited are pleased to present to shareholders the Annual Report* and financial statements for Air New Zealand and its controlled
The consolidated financial statements of
 Our 2014 financial statements The consolidated financial statements of plc and its subsidiaries (the Group) for the year ended 31 December 2014 have been prepared in accordance with International Financial
WWW.SIEMENS.COM/AR/CONSOLIDATED- FINANCIAL-STATEMENTS
 The Consolidated Financial Statements are prepared in accordance with International Financial Reporting Standards (IFRS) as adopted by the European Union (EU), the supplementary requirements of German
A&W Food Services of Canada Inc. Consolidated Financial Statements December 30, 2012 and January 1, 2012 (in thousands of dollars)
") A&W Food Services of Canada Inc. Consolidated Financial Statements December 30, and January 1, (in thousands of dollars) February 12, 2013 Independent Auditor s Report To the Shareholders of A&W Food Services
A&W Food Services of Canada Inc. Consolidated Financial Statements December 30, and January 1, (in thousands of dollars) February 12, 2013 Independent Auditor s Report To the Shareholders of A&W Food Services
Financials. Ahold Annual Report 2014 63. Financials
 at a glance Financials Annual Report 2014 63 Financials Financial statements 64 Consolidated income statement 65 Consolidated statement of comprehensive income 66 Consolidated balance sheet 67 Consolidated
Investments and advances... 344,499
 Consolidated Financial Statements of the Company The consolidated balance sheet, statement of income, and statement of equity of the Company are as follows. Please note the Company s consolidated financial
HARMONIC DRIVE SYSTEMS INC. AND CONSOLIDATED SUBSIDIARIES CONSOLIDATED FINANCIAL STATEMENTS MARCH 31, 2013
 HARMONIC DRIVE SYSTEMS INC. AND CONSOLIDATED SUBSIDIARIES CONSOLIDATED FINANCIAL STATEMENTS MARCH 31, 2013 HARMONIC DRIVE SYSTEMS INC. AND CONSOLIDATED SUBSIDIARIES CONSOLIDATED BALANCE SHEETS ASSETS
ATS AUTOMATION TOOLING SYSTEMS INC. Annual Audited Consolidated Financial Statements
 Annual Audited Consolidated Financial Statements For the year ended March 31, 2014 MANAGEMENT S RESPONSIBILITY FOR FINANCIAL REPORTING The preparation and presentation of the Company s consolidated financial
Consolidated Financial Statements. FUJIFILM Holdings Corporation and Subsidiaries. March 31, 2015 with Report of Independent Auditors
 Consolidated Financial Statements FUJIFILM Holdings Corporation and Subsidiaries March 31, 2015 with Report of Independent Auditors Consolidated Financial Statements March 31, 2015 Contents Report of Independent
FEDERATED CO-OPERATIVES LIMITED CONSOLIDATED STATEMENT OF COMPREHENSIVE INCOME year ended October 31, 2012
 CONSOLIDATED Financial Statements Federated Co-operatives Limited / OCTOBER 31, 2012 In Millions of CAD $ FEDERATED CO-OPERATIVES LIMITED CONSOLIDATED STATEMENT OF COMPREHENSIVE INCOME year ended October
Consolidated Balance Sheets March 31, 2001 and 2000
 Financial Statements SEIKAGAKU CORPORATION AND CONSOLIDATED SUBSIDIARIES Consolidated Balance Sheets March 31, 2001 and 2000 Assets Current assets: Cash and cash equivalents... Short-term investments (Note
D. Consolidated Financial Statements
 Consolidated 254 D.1 Consolidated Statements of Income 255 D.2 Consolidated Statements of Comprehensive Income 256 D.3 Consolidated Statements of Financial Position 257 D.4 Consolidated Statements of Cash
The statements are presented in pounds sterling and have been prepared under IFRS using the historical cost convention.
 Note 1 to the financial information Basis of accounting ITE Group Plc is a UK listed company and together with its subsidiary operations is hereafter referred to as the Company. The Company is required
Interim report to the shareholders for the six months ended March 31, 2012
 Interim report to the shareholders for the six months ended March 31, 2012 CASTING AND EXTRUSION AUTOMOTIVE SOLUTIONS NOTICE TO READER The attached consolidated financial statements have been prepared
Consolidated financial statements December 31, 2013
 Consolidated financial statements December 31, 2013 CONTENTS Consolidated financial statements at December 31, 2013... 3 Consolidated statement of income... 3 Consolidated statement of cash flows... 5
Mood Media Corporation
 Consolidated Financial Statements Mood Media Corporation For the year ended 1 INDEPENDENT AUDITORS REPORT To the Shareholders of Mood Media Corporation We have audited the accompanying consolidated financial
Transition to International Financial Reporting Standards
 Transition to International Financial Reporting Standards Topps Tiles Plc In accordance with IFRS 1, First-time adoption of International Financial Reporting Standards ( IFRS ), Topps Tiles Plc, ( Topps
Consolidated Balance Sheets
 Consolidated Balance Sheets March 31 2015 2014 2015 Assets: Current assets Cash and cash equivalents 726,888 604,571 $ 6,057,400 Marketable securities 19,033 16,635 158,608 Notes and accounts receivable:
FOR THE YEARS ENDED 31 DECEMBER 2010 AND 2009
 IFRS CONSOLIDATED FINANCIAL STATEMENTS AND INDEPENDENT AUDITOR S REPORT FOR THE YEARS ENDED 31 DECEMBER 2010 AND 2009 CONTENTS Page Independent Auditor s Report 3 Consolidated Statement of Financial Position
The Kansai Electric Power Company, Incorporated and Subsidiaries
 The Kansai Electric Power Company, Incorporated and Subsidiaries Consolidated Financial Statements for the Years Ended March 31, 2003 and 2002 and for the Six Months Ended September 30, 2003 and 2002 The
Notes to Consolidated Financial Statements Notes to Non-consolidated Financial Statements
 This document has been translated from the Japanese original for reference purposes only. In the event of discrepancy between this translated document and the Japanese original, the original shall prevail.
1. Basis of Preparation. 2. Summary of Significant Accounting Policies. Principles of consolidation. (a) Foreign currency translation.
 Foreign currency translation.") Nitta Corporation and Subsidiaries Notes to Consolidated Financial Statements March 31, 1. Basis of Preparation The accompanying consolidated financial statements of Nitta Corporation (the Company ) and
Nitta Corporation and Subsidiaries Notes to Consolidated Financial Statements March 31, 1. Basis of Preparation The accompanying consolidated financial statements of Nitta Corporation (the Company ) and
1. Accounting policies for consolidated financial statements
 1 1. Accounting policies for consolidated financial statements Corporate information The Sanoma Group comprises three reporting segments: Media, News and Learning. The Media segment consists of four strategic
D.6 Notes to Consolidated Financial Statements
 D.6 Notes to Consolidated Financial Statements NOTE 1 Basis of presentation The accompanying Consolidated Financial Statements present the operations of Siemens AG with registered offices in Berlin and
Ahold Annual Report 2012 73 Ahold at a glance Our strategy Our performance Governance Financials Investors
 Ahold Annual Report 73 Ahold at a glance Our strategy Our performance Governance Financials Investors Consolidated income statement Consolidated statement of comprehensive income Consolidated balance sheet
CONSOLIDATED FINANCIAL STATEMENTS AND NOTES
 CONSOLIDATED FINANCIAL STATEMENTS AND NOTES Consolidated Income Statements p.2 Statements of profit or loss and other comprehensive Income p.3 Statements of financial position p.4 Consolidated Cash Flow
SAMPLE MANUFACTURING COMPANY LIMITED CONSOLIDATED FINANCIAL STATEMENTS. Year ended December 31, 2012
 SAMPLE MANUFACTURING COMPANY LIMITED CONSOLIDATED FINANCIAL STATEMENTS Year ended SAMPLE MANUFACTURING COMPANY LIMITED CONSOLIDATED FINANCIAL STATEMENTS For the year ended The information contained in
Notes to Consolidated Financial Statements Notes to Non-Consolidated Financial Statements
 This document has been translated from the Japanese original for reference purposes only. In the event of discrepancy between this translated document and the Japanese original, the original shall prevail.
KOREAN AIR LINES CO., LTD. AND SUBSIDIARIES. Consolidated Financial Statements
 Consolidated Financial Statements December 31, 2015 (With Independent Auditors Report Thereon) Contents Page Independent Auditors Report 1 Consolidated Statements of Financial Position 3 Consolidated Statements
CONSOLIDATED FINANCIAL STATEMENTS
 CONSOLIDATED FINANCIAL STATEMENTS * * * The accompanying notes are part of the consolidated financial statements. Contents Consolidated Income Statement... 3 Consolidated Statement of Comprehensive Income...
Empire Company Limited Consolidated Financial Statements May 7, 2016
 Consolidated Financial Statements CONTENTS Independent Auditor s Report... 1-2 Consolidated Balance Sheets... 3 Consolidated Statements of (Loss) Earnings... 4 Consolidated Statements of Comprehensive
Consolidated financial statements of MTY Food Group Inc. November 30, 2015 and 2014
 Consolidated financial statements of MTY Food Group Inc. Independent auditor s report...1 2 Consolidated statements of income... 3 Consolidated statements of comprehensive income... 4 Consolidated statements
PART III. Consolidated Financial Statements of Hitachi, Ltd. and Subsidiaries: Independent Auditors Report 47
 PART III Item 17. Financial Statements Consolidated Financial Statements of Hitachi, Ltd. and Subsidiaries: Schedule: Page Number Independent Auditors Report 47 Consolidated Balance Sheets as of March
Volex Group plc. Transition to International Financial Reporting Standards Supporting document for 2 October 2005 Interim Statement. 1.
 Volex Group plc Transition to International Financial Reporting Standards Supporting document for 2 October 2005 Interim Statement 1. Introduction The consolidated financial statements of Volex Group plc
Consolidated financial statements 2014. Zurich Insurance Group Annual Report 2014
 Consolidated financial statements 2014 Annual Report 2014 2 Annual results 2014 Consolidated financial statements Contents Consolidated income statements 3 Consolidated statements of comprehensive income
Consolidated Financial Statements of. Years ended September 30, 2015 and 2014
 Consolidated Financial Statements of Years ended September 30, 2015 and 2014 1 KPMG LLP Telephone 519-747-8800 115 King Street South, 2 nd Floor Fax 519-747-8830 Waterloo ON N2J 5A3 Internet www.kpmg.ca
Significant Accounting Policies
 Apart from the accounting policies presented within the corresponding notes to the financial statements, other significant accounting policies are set out below. These policies have been consistently applied
5N PLUS INC. Condensed Interim Consolidated Financial Statements (Unaudited) For the three month periods ended March 31, 2016 and 2015 (in thousands
 For the three month periods ended March 31, 2016 and 2015 (in thousands") Condensed Interim Consolidated Financial Statements (Unaudited) (in thousands of United States dollars) Condensed Interim Consolidated Statements of Financial Position (in thousands of United States dollars)
Condensed Interim Consolidated Financial Statements (Unaudited) (in thousands of United States dollars) Condensed Interim Consolidated Statements of Financial Position (in thousands of United States dollars)
NOTES TO THE FINANCIAL STATEMENTS For the financial year ended 31 March 2012
 For the financial year ended 31 March These notes form an integral part of and should be read in conjunction with the accompanying financial statements. 1. GENERAL The Company, Singapore Telecommunications
How To Account For A Company In A Profit Share Of A Company
 Bridgestone Corporation and Subsidiaries NOTE 1 Nature of operations Bridgestone Corporation and its subsidiaries (hereinafter referred to collectively as the Companies ) engage in developing, manufacturing
Interim Consolidated Balance Sheets 1. Interim Consolidated Income Statements 2. Interim Consolidated Statements of Comprehensive Income 3
 Interim Consolidated Financial Statements March 31, 2011, December 31, 2010, March 31, 2010 and January 1, 2010 Expressed in Thousands of US Dollars (except per share amounts and number of shares) Interim
ANNUAL FINANCIAL RESULTS
 ANNUAL FINANCIAL RESULTS For the year ended 31 July 2013 ANNUAL FINANCIAL RESULTS 2013 FONTERRA CO-OPERATIVE GROUP LIMITED Contents: DIRECTORS STATEMENT... 1 INCOME STATEMENT... 2 STATEMENT OF COMPREHENSIVE
CONSOLIDATED INCOME STATEMENT for the year ended 31st December
 CONSOLIDATED INCOME STATEMENT for the year ended 31st December HK$ million Notes 2012 2011 Group turnover 5 4,105 3,493 Share of turnover of jointly controlled entities 5 1,644 1,532 5,749 5,025 Group
accounting policies for the year ended 31 march 2009
 The annual financial statements are prepared on the historical cost basis, unless otherwise indicated, in accordance with International Financial Reporting Standards (IFRS), the requirements of the Companies
Online Disclosures Relating to Notice of the 101st Annual Shareholders Meeting
 Online Disclosures Relating to Notice of the 101st Annual Shareholders Meeting Notes to Consolidated Financial Statements Notes to Non-Consolidated Financial Statements (From April 1, 2015 to March 31,
Accounting policies. General information. Comparatives for 2011. Summary of significant accounting policies. Changes in accounting policies
 Accounting policies General information This document constitutes the Annual Report and Financial Statements in accordance with UK Listing Rules requirements and the Annual Report on Form 20-F in accordance
Consolidated Financial Statements of CGI GROUP INC. For the years ended September 30, 2013 and 2012
 Consolidated Financial Statements of CGI GROUP INC. Management s and Auditors reports MANAGEMENT S STATEMENT OF RESPONSIBILITY FOR FINANCIAL REPORTING The management of CGI Group Inc. ( the Company ) is
2013 Route1 First Quarter Interim Condensed Consolidated Financial Statements
 Interim Condensed Consolidated Financial Statements of March 31, 2013 and 2012 NOTICE OF NO AUDITOR REVIEW OF INTERIM CONDENSED CONSOLIDATED FINANCIAL Under National Instrument 51-102, Part 4, subsection
Financial Statements 2014
 Financial Statements 2014 This financial statement is part of Heijmans annual report 2014. The complete English version of the annual report will be published a number of weeks after the publication of
INDEPENDENT AUDITORS REPORT
 Management s Report The management of Raging River Exploration Inc. has prepared the accompanying financial statements of Raging River Exploration Inc. in accordance with International Financial Reporting
Investments and Other Assets: Investment Securities 11,145 10,339 135,694 Investments in Unconsolidated Subsidiaries and Associated Companies
 Consolidated Balance Sheets IBJ Leasing Company, Limited and Consolidated Subsidiaries As of March 31, 2012 and 2011 Millions of yen Thousands of U.S. dollars (Note 1) ASSETS Current Assets: Cash and Cash
ANNUAL FINANCIAL RESULTS FOR THE YEAR ENDED 31 JULY 2014 FONTERRA ANNUAL FINANCIAL RESULTS 2014 A
 ANNUAL FINANCIAL RESULTS FOR THE YEAR ENDED 31 JULY 2014 FONTERRA ANNUAL FINANCIAL RESULTS 2014 A CONTENTS DIRECTORS STATEMENT 1 INCOME STATEMENT 2 STATEMENT OF COMPREHENSIVE INCOME 3 STATEMENT OF FINANCIAL
OAO LUKOIL INTERIM CONSOLIDATED FINANCIAL STATEMENTS. (prepared in accordance with US GAAP) (unaudited)
 (unaudited)") INTERIM CONSOLIDATED FINANCIAL STATEMENTS (prepared in accordance with US GAAP) As of and for the three-month period ended March 31, 2014 (unaudited) These interim consolidated financial statements were
INTERIM CONSOLIDATED FINANCIAL STATEMENTS (prepared in accordance with US GAAP) As of and for the three-month period ended March 31, 2014 (unaudited) These interim consolidated financial statements were
Fiat Group Consolidated Financial Statements
 Fiat Group 120 Income Statement 121 Statement of Comprehensive Income 122 Statement of Position 124 Statement of Cash Flows 125 Statement of Changes in Equity 126 Income Statement pursuant to Consob Resolution
Ricoh Company, Ltd. INTERIM REPORT (Non consolidated. Half year ended September 30, 2000)
") Ricoh Company, Ltd. INTERIM REPORT (Non consolidated. Half year ended September 30, 2000) *Date of approval for the financial results for the half year ended September 30, 2000, at the Board of Directors'
Ricoh Company, Ltd. INTERIM REPORT (Non consolidated. Half year ended September 30, 2000) *Date of approval for the financial results for the half year ended September 30, 2000, at the Board of Directors'
FLUIDRA, S.A. AND SUBSIDIARIES. Consolidated Annual Accounts and Consolidated Directors Report
 FLUIDRA, S.A. AND SUBSIDIARIES Consolidated Annual Accounts and Consolidated Directors Report (Prepared in accordance with International Financial Reporting Standards as adopted by the European Union)
(unaudited expressed in Canadian Dollars)
") Condensed Consolidated Interim Financial Statements of CARGOJET INC. For the three month periods ended (unaudited expressed in Canadian Dollars) This page intentionally left blank Condensed Consolidated
Condensed Consolidated Interim Financial Statements of CARGOJET INC. For the three month periods ended (unaudited expressed in Canadian Dollars) This page intentionally left blank Condensed Consolidated
FINANCIAL STATEMENT 2010
 FINANCIAL STATEMENT 2010 CONTENTS Independent Auditors Report------------------------------ 2 Consolidated Balance Sheets ------------------------------ 3 Consolidated Statements of Operations ----------------
GOODYEAR (THAILAND) PUBLIC COMPANY LIMITED FINANCIAL STATEMENTS 31 DECEMBER 2011
 PUBLIC COMPANY LIMITED FINANCIAL STATEMENTS 31 DECEMBER 2011") GOODYEAR (THAILAND) PUBLIC COMPANY LIMITED FINANCIAL STATEMENTS 31 DECEMBER 2011 AUDITOR S REPORT To the Shareholders of Goodyear (Thailand) Public Company Limited I have audited the accompanying statements
GOODYEAR (THAILAND) PUBLIC COMPANY LIMITED FINANCIAL STATEMENTS 31 DECEMBER 2011 AUDITOR S REPORT To the Shareholders of Goodyear (Thailand) Public Company Limited I have audited the accompanying statements
ATS AUTOMATION TOOLING SYSTEMS INC.
 Interim Consolidated Financial Statements For the period ended June 29, 2014 (Unaudited) (Condensed) Interim Consolidated Statements of Financial Position (in thousands of Canadian dollars unaudited) June
Condensed Consolidated Statement of Operations and Comprehensive Income (Loss) 3. Condensed Consolidated Balance Sheet 4
 3. Condensed Consolidated Balance Sheet 4") CONSOLIDATED FINANCIAL STATEMENTS For the fiscal year ended March 31, 2014 INDEX Page Condensed Consolidated Statement of Operations and Comprehensive Income (Loss) 3 Condensed Consolidated Balance Sheet
CONSOLIDATED FINANCIAL STATEMENTS For the fiscal year ended March 31, 2014 INDEX Page Condensed Consolidated Statement of Operations and Comprehensive Income (Loss) 3 Condensed Consolidated Balance Sheet
NOTES TO THE ANNUAL FINANCIAL STATEMENTSNOTE
 NOTES TO THE ANNUAL FINANCIAL STATEMENTSNOTE Notes to the ANNUAL FINANCIAL STATEMENTS 19 1. SUMMARY OF SIGNIFICANT ACCOUNTING POLICIES The principal accounting policies adopted in the preparation of these
Preliminary Final report
 Appendix 4E Rule 4.3A Preliminary Final report AMCOR LIMITED ABN 62 000 017 372 1. Details of the reporting period and the previous corresponding period Reporting Period: Year Ended Previous Corresponding