Programming Manual. IW Graphic Tool Pro. for IW QuickTrade. User s Manual
|
|
|
- Cassandra Hutchinson
- 8 years ago
- Views:
Transcription
1 Programming Manual IW Graphic Tool Pro for IW QuickTrade User s Manual

2 TABLE OF CONTENTS ProBacktest Introduction Chapter I: Introduction Accessing ProBacktest...2 ProBacktest setup window sections...2 ProBacktest Results ) Equity Curve ) Positions histogram ) Detailed report...13 Chapter II: Programming ProBacktest Entering and exiting the market ) Position entry and exit commands...15 a. Number...15 b. Mode...15 c. Type...16 d. Date/time of execution ) STOP commands...18 Position verification commands ) Commands verifying the type of positions open ) Position Counters ) ENTRYINDEX ) ENTRYQUOTE ) PreviousTrade...23 Chapter III: Practical Applications Indicator Strategies ) Heiken Ashi strategy ) ZigZag Strategy ) Range breakout with trailing stop ) Smoothed Stochastic Strategy ) Swing Trading, ADX and Moving Averages...28
 PreviousTrade...23 Chapter III: Practical Applications Indicator Strategies...25 1) Heiken Ashi strategy...25 2) ZigZag Strategy...26 3) Range breakout with trailing stop.")
3 Money management strategies ) Stop loss ) Take profit stop ) Inactivity Stop ) Pyramiding a position ) Dynamic position size management ) Taking into account previous performance ) The classic martingale ) The great martingale ) The Piquemouche ) The Whittacker ) The D Alembert Pyramid ) The contre d Alembert...37 Annex: Capital Management Setup Capital...38 Risk Management ) Maximum limit of investment ) Max investment per transaction and leverage ) Minimum investment per transaction...39 Orders management...39 Round the number of securities to buy/sell ) Brokerage fees for stocks ) Brokerage fees for futures...40 a. Commission by lot...41 b. Deposit by lot...41 c. The value of a point (one point worth) ) Brokerage fees for Forex...42 a. Commission by lot / Spread...42 b. Deposit by lot...43 c. The value of a point (one point worth)...43 Glossary
 Minimum investment per transaction...39 Orders management...39 Round the number of securities to buy/sell...40 1) Brokerage fees for stocks...40 2) Brokerage fees for futures...40 a.")
4 ProBackt est Introduction ProBacktest Introduction ProBacktest is a tool from ProRealTime that will allow you to create and test personalized investment strategies on any available timeframe and period of historical data for a given security. ProBacktest uses ProBuilder programming language (it is advised that you also consult the ProBuilder manual) with extensions that are used exclusively in creating strategies with ProBacktest. In this module, you can simulate taking based on on personalized conditions including: Technical indicators with personalized parameters Your current market position (open positions or not...) Dates and times you want to open or close the position (ex: open of next day...) The way in which you take a position (market order, limit order,...) Positioning stops Performance of previous trades Execution price of previous orders The results of a ProBacktest simulation are presented in the form of : The "Equity curve" (or "Gain and Loss Curve"), which shows you the state of your virtual portfolio over the course of the period on which you are simulating your trading strategy. The positions histogram which shows your open positions (green bar for a long position, red bar for a short position, no bar for no position). The detailed report which shows the general results of your strategy simulation over the period tested and on the security tested. This document is written as a continuation of the ProBuilder manual but can be read independently Readers who are used to programming can skip directly to chapter 2 or consult the glossary to quickly find an explanation related to a function they are looking for. For beginning users, we advise you to watch the video titled "Backtest your strategies without writing a single line of code" and read the ProBuilder manual. As the manual is very practically oriented, you will be able to learn to program in no time. The ideas in this section and in the rest of the manual are meant to help you code and test your own ideas. They are not investment advice. We wish you the best of success in your trading and hope you will enjoy the manual. 1 / 53

5 Ch apter I: Introduction Chapter I: Introduction Accessing ProBacktest The zone for ProBacktest creation may be accessed with the "Indicator/Backtest" button in the upper-right corner of every ProRealTime chart. You can then access the indicator and backtest management window. Click the ProBacktest tab. You will be able to: Access the list of existing ProBacktests (predefined or your own) Create a new ProBacktest which can then be applied to any security or timeframe Modify or delete an existing ProBacktest To create a new backtest, click Create ProBacktest. You will then be able to create a backtest with the assisted creation wizard (no programming required) or create a backtest by programming. ProBacktest setup window sections Lets concentrate on creation by programming by clicking on the appropriate tab. The window is composed of 5 sections that can be setup: Programming of ProBacktest Money Management Variable Optimization Beginning and ending date Code sharing 2 / 53

6 Ch apter I: Introduction The first section allows you to: Program your ProBacktest directly in the text zone or Use the Insert function button which allows you to open a new window with a list of ProBuilder and ProBacktest commands separated into 9 categories to give you contextual help while programming. You can see a help text related to the command or function selected in the lower part of the window. 3 / 53

7 Ch apter I: Introduction Let's use the function library by clicking on "Insert Function". Choose the section "ProBacktest Commands" and click "BUY", then click the button "Add". The command will be inserted into your program. Let's create a backtest. Suppose we want toy bu 10 shares at market price. Proceed as above to find the functions "SHARES", "AT" and "MARKET" (separating each word with a space). Specify between "BUY" and "SHARES" the number to buy (10). Then give a name to your backtest: in this example, we have named it "MyStrategy". 4 / 53
.")
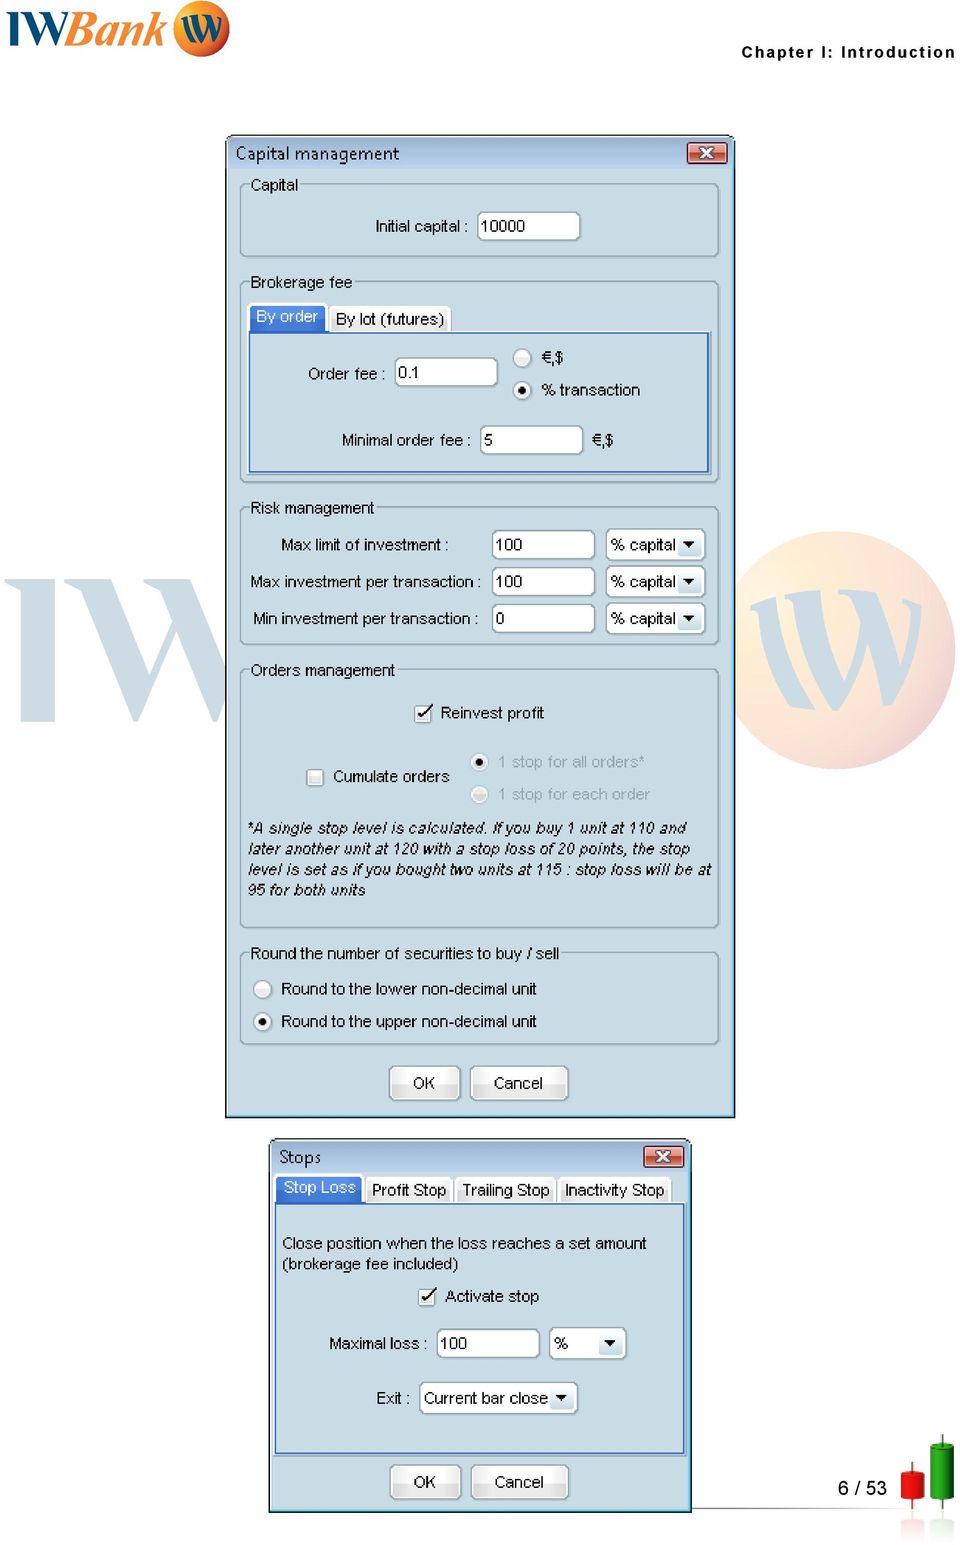
8 Ch apter I: Introduction The second section (Money Management), allows you to setup the cost of trading, the capital to invest and your stops. In "Capital Management",,you can define your initial capital for your Backtest, your brokerage fees and the method by which you are charged (by lot or by order) for these fees, your risk management and position management strategy. In Stops, you can choose to include or not 4 different types of stops: Stop losses, Profit stops (take-profit), Trailing stops and Inactivity stops. 5 / 53
 for these fees, your risk management and position management strategy.")
9 Ch apter I: Introduction 6 / 53
10 Ch apter I: Introduction For more details concerning capital management, read the annexes at the end of the manual (page 38). The third section allows you to optimize variables. This function allows you to test different combinations of values for the variables to know which give the best performance in your simulation. To learn more and see a concrete example, you can watch the video "Money management, stops and dynamic variable optimization". The result of the optimization is presented in an "Optimization report". You will learn the results of each value tested and determine which combination of variables would best optimize your strategy. Here is an example strategy where we will optimize the moving average number of periods n and m: IF ExponentialAverage[n](Close) Crosses Over ExponentialAverage[m](Close) THEN BUY 100 SHARES AT MARKET IF ExponentialAverage[m](Close) Crosses Over ExponentialAverage[n](Close) THEN SELL 100 SHARES AT MARKET We define the variables to be optimized in the following way: 7 / 53

11 Ch apter I: Introduction "Name in the program" is the name of the variable in the program (here n and m). This variable is case sensitive (upper case or lower case). "Label in the properties window" is the name attributed to the variable that will be shown in the properties window of the backtest to make it more easy to recognize (for example: "Number of periods" for n). "Minimum value" and "maximum value" are the highest and lowest values of the variable to be tested in the optimization tests. "Step" defines the interval of values to test in the optimization process. Here is an example of an optimization report : The report includes 6 statistics for each combination of variables tested (here: n and m). These statistics are as follows: Net Profits, shows the gain from trades. Mathematically, profit is equal to: Net Profits = Capital at the end of the simulation Initial Capital This statistic allows you to evaluate the potential gains of the strategy defined (for each value of the variable tested). Note: the brokerage fees defined in the "Capital management" section are taken into account in this calculation. 8 / 53

12 Ch apter I: Introduction Return on capital, is the Profit in percentage. The formula is : Return on capital = (100 x Net Profits) / Initial Capital It indicates the relative performance of the strategy simulated with the different variable values tested. Max drawdown, designates the maximum loss at any given point in the simulation measured by the difference between the highest level of the equity curve and the lowest subsequent point. Let's look at an example of maximum drawdown on this chart: The max drawdown of the strategy can be considered as a measure of riskiness of the trading strategy: if you are not ready to accept the risk of losing the max drawdown amount, you could choose a different strategy with less risk. Nbr orders, indicates the number of orders since the beginning of the strategy simulation. 9 / 53

13 Ch apter I: Introduction % Winning trades shows the % of winning trades in the simulation and is also an indicator of riskiness complementary to Max drawdown. Mathematically, the formula is: % Winning trades = (100 x Number of winning trades) / Number of total trades Expectancy is the average gain per trade and is useful to determine the average efficiency of each trade. Expectancy is particularly important if you want to limit the number of orders in the strategy. In this case, it can be an important factor in the decision to apply the strategy or not; Mathematically, the formula is: Expectancy = Net Profit / Number of Trades Note: the optimal values of variables for a strategy may be different for the same security depending on the unit of time used in the chart and the historical dataset you are looking at. The fourth section allows you to define the period of time you will backtest your strategy over. The beginning date corresponds to the beginning date of the strategy and the end date is the date at which all of your remaining positions will be liquidated if you choose a date other than the real-time date. This function of ProBacktest is configured by default to test your strategy over all the historical data displayed (in this case, open positions are closed only when the exit conditions are verified). The fifth section allows you to manage whether you want to share your code in the community section on the site ProRealTime.com. If you want to publish your strategy on the ProRealTime site, you need to fill in the section "ProBacktest help" and check the option : "Publish in the 'Strategies' section of ProRealTime". This section will help other users to interpret and use the ProBacktest strategy if you want to publish it. 10 / 53

14 Ch apter I: Introduction ProBacktest Results In addition to the optimization report presented above, ProBacktest displays results in 3 complementary forms. 1) Equity Curve The Equity Curve shows the evolution of the initial invested capital (defined in the capital management section) since the beginning of your strategy simulation. 2 important pieces of information are communicated by the shading and the line color. The shading of the equity curve will be green if the overall performance is positive (current capital is higher than initial capital) and red if it is negative. The color of the equity curve will be green to indicate a positive variation from the previous level or red to indicate a negative variation from the previous level. 11 / 53
 and red if it is negative.")
15 Ch apter I: Introduction 2) Positions histogram The positions histogram allows you to show in histogram form the evolution of your positions during the strategy simulation. A green bar indicates an open long position. A red bar indicates an open short position. No bar indicates no open position. Several consecutive bars of the same color indicate the position(s) is still open. On the vertical axis on the right-side of the chart, you will see how many positions you have open currently (highlighted). In the example below, there is currently 1 short position open. 12 / 53
.")
16 Ch apter I: Introduction 3) Detailed report The detailed report allows you to view the statistics of your strategy in terms of performance, length of positions and list of orders. The detailed report is shown in an independent window made up of 3 tabs: In Statistics, you will get an exhaustive view of the performance of your strategy (net gains or loss, number of winning and losing trades, and many other statistics ). Beyond the classical statistics displayed, the statistics Highest Profit and Highest Loss and Max Drawdown may help determine if this strategy is acceptable to you in terms of risk. 13 / 53
.")
17 Ch apter I: Introduction In the "Orders list" you will find details on the time, the direction (buy or sell), the quantity and the price of orders. The order times displayed will be in local market time. Finally, "Trades list" gives details about the positions taken during the simulation (long or short, duration expressed in number of bars, absolute and relative performance, entry and exit dates...). 14 / 53
.")
18 Ch apter II: Programming ProBacktest Chapter II: Programming ProBacktest Entering and exiting the market 2 categories of instruction allow you to enter and exit the market: position entry and exit instructions and stop instructions. 1) Position entry and exit commands Different instructions are used depending on the type of position: Long positions - BUY enter long position instruction (buy securities) - SELL exit long position instruction (sell securities) Short positions - SELLSHORT enter short position instruction (short sell securities) - EXITSHORT exit long position instruction (buy back shorted securities) ProBacktest does not allow simulation of "hedging", meaning taking simultaneous short and long positions on the same security. For this reason, the SELLSHORT command will first close any open long position before opening a short position and the BUY command will first close any short positions before opening a long position. It is advised to use the recommended commands to close positions (SELL for closing long positions and EXITSHORT for closing short positions). Each command above may be followed by one or more of the following elements which we will describe: SELLSHORT "Number" "Mode" AT "TYPE" "DATE/TIME" a. Number This is the quantity you want to buy or sell. Note: It is possible to not insert a number. In this case, the program will consider the quantity to be 1 stock or one lot. b. Mode You can define the mode in which to buy or sell in absolute or relative terms. SHARES transaction defined in number of stocks or contracts CASH transaction defined in cash (ex: n or $ worth of the security) % CAPITAL transaction defined in percent of capital (ex : 10% of capital) % LIQUIDITY transaction defined in percent of remaining liquidity 15 / 53
 Short positions - SELLSHORT enter short position instruction (short sell securities) - EXITSHORT exit long position instruction (buy back shorted securities) ProBacktest")
19 Ch apter II: Programming ProBacktest Example : Buy (enter long) for 10% of capital when the RSI is oversold (RSI < 30) and the price is below the lower Bollinger band. Sell (exit long) when the RSI is overbought (RSI > 70) and price is above the upper Bollinger band. IF RSI[14](Close) < 30 AND Close < BollingerDown[25](Close) THEN BUY 10 %CAPITAL AT MARKET IF RSI[14](Close) > 70 AND Close > BollingerUp[25](Close) THEN SELL 10 %CAPITAL AT MARKET c. Type Three order types are available: AT MARKET : The order will be executed at market price AT (price) LIMIT : The order will be executed at the indicated price AT (price) STOP : The order will be executed at the indicated price Example : Volatility Breakout This strategy is based on volatility. On each bar, a BUY AT LIMIT and a SELLSHORT AT STOP order are placed. The BUY order is placed on the close of the previous bar plus 50% of the range of the previous bar (Range = High Low). The SELLSHORT order is placed at the close of the previous bar minus 50% of the range of the previous bar. REM Volatility Breakout BuyLimit = Close[1] + (Range[1] * 50 / 100) SellLimit = Close[1] - (Range[1] * 50 / 100) BUY 1 SHARES AT BuyLimit Stop SELLSHORT 1 SHARES AT SellLimit Stop 16 / 53
 < 30 AND Close < BollingerDown[25](Close) THEN BUY 10 %CAPITAL AT MARKET IF RSI[14](Close) > 70 AND Close > BollingerUp[25](Close) THEN SELL 10 %CAPITAL AT MARKET c.](/docs-images/42/3283388/images/page_19.jpg "Type Three order types are available: AT MARKET : The order will be executed at market price AT (price) LIMIT : The order will be executed at the indicated price AT (price) STOP : The order will be")
20 Ch apter II: Programming ProBacktest d. Date/time of execution By default, AT MARKET orders are executed on the open of the next bar. In the case of AT MARKET orders, it is possible to set the time of execution using the following commands. Parenthesis and brackets are not used with these commands. NextBarOpen : places the order on the open of the next bar (default) NextBarClose : places the order on the close of the next bar ThisBarOnClose : places the order on the close of the current bar TodayOnClose : places the order on the close of the current day (relevant only if used with an intraday timeframe) TomorrowOpen : places the order on the open of the next day (relevant only if used with an intraday timeframe) TomorrowClose : places the order on the close of the next day (relevant only if used with an intraday timeframe) RealTime : places the order in real-time (on the current tick) The "Date/time of execution" commands are usable only when the instruction "AT MARKET" precedes them. Example : Channel breakout We define the resistance and support of the channel as the highest and lowest points of the two first bars of the trading day. If before 16H00, price breaks the resistance of the channel, we open a long position with 70% of our capital. We close any long positions and open a short position if price beaks the support of the channel before 16H00. REM Close of the second bar (IntradayBar index=1) IF IntradayBarIndex = 1 THEN Resist = Highest[2](High) Support = Lowest[2](Low) REM Buy / Short on breakout if before 16H00:00 (Local market time) IF IntradayBarIndex > 1 AND Time < THEN REM Resistance breakout IF Close > Resist THEN BUY 70 %CAPITAL AT MARKET THISBARONCLOSE REM Support breakout IF Close < Support THEN SELLSHORT 70 %CAPITAL AT MARKET THISBARONCLOSE 17 / 53
 TomorrowOpen : places the order on the open of the next day (relevant only if used")
21 Ch apter II: Programming ProBacktest 2) STOP commands It is possible to manually program STOPs in your ProBacktest strategy. In addition to the 4 types of predefined stops in section 2 in the ProBacktest window (see chapter one), you can also insert stops which you program yourself. The command to create a stop in the program is: In addition to the 4 types of predefined stops in section 2 in the ProBacktest window (see the "Money Management" section), can also insert stops which you program yourself. The command to create a stop in the program is: SET STOP (price) where the constant "price" designates the level at which the position will be closed. Example: Price and Parabolic SAR cross strategy The following strategy will place a buy (or shortsell) order when the price crosses over (or under) the SAR. A trailing stop is set to exit the position when the price hits a certain level (called cut in the program). Indicator1 = Close Indicator2 = SAR[0.02,0.02,0.2] REM Buy c1 = (Indicator1 Crosses Over Indicator2) IF c1 THEN BUY 1 SHARES AT MARKET REM Sell c2 = (Indicator1 Crosses Under Indicator2) IF c2 THEN SELLSHORT 1 SHARES AT MARKET REM placing the trailing stop IF Lowest[5](Close)< (1.2 * Low) THEN IF Lowest[5](Close) >= Close THEN Cut = Lowest[5](Close) ELSE Cut = Lowest[20](Close) SET STOP Cut 18 / 53
22 Ch apter II: Programming ProBacktest Note the difference between STOP commands: AT (price) STOP, is used to enter a short position when a certain price level is reached. SET STOP (price), is used to define a protection stop (to exit an open position). Position verification commands 1) Commands verifying the type of positions open ProBacktest allows you to create conditions for placing an order based on whether or not you currently have open long or short positions in the current ProBacktest simulation. Here are the commands that let you check the status of your current positions: ONMARKET : checks if there are positions open LONGONMARKET : checks if there are long positions open SHORTONMARKET : checks if there are short positions open They are used without parenthesis or brackets and are usually preceded by the IF command. The commands checking the state of positions open are particularly interesting if you want to cumulate or pyramid positions (see page 30). These positions must be in the same direction (long or short). It is not possible to cumulate positions in different directions during a backtest simulation. Here is an example of how these commands might be used. Example: MACD Strategy (use of LONGONMARKET and SHORTONMARKET) : This strategy is based on the changes in the sign of the MACD histogram (positive or negative state). It will take a certain number of positions which will be progressively closed. This progressive advance has the goal of locking in gains and limiting risk. REM We give the value of the MACD to the variable Indicator1 Indicator1 = MACD[12,26,9](Close) REM We observe the changes in sign of the MACD c1 = (Indicator1 Crosses Over 0.0) REM Buy : If we do not have an open long position and MACD > 0, we buy 3 lots IF NOT LONGONMARKET AND c1 THEN BUY 3 SHARES AT MARKET ThisBarOnClose Long = 0 Entry = Close REM Sell : of our 3 lots, we sell successively at 7, 15 and 25% profit if possible. REM We close the remaining positions when MACD crosses under 0. IF LONGONMARKET AND Long = 0 AND Close > (Entry * 1.07) THEN 19 / 53
23 Ch apter II: Programming ProBacktest SELL 1 SHARES AT MARKET ThisBarOnClose Long = 1 ELSIF LONGONMARKET AND Long = 1 AND Close > (Entry * 1.15) THEN SELL 1 SHARES AT MARKET ThisBarOnClose Long = 2 ELSIF LONGONMARKET AND Long = 2 AND Close > (Entry * 1.25) THEN SELL 1 SHARES AT MARKET ThisBarOnClose Long = 3 REM SHORT: If we do not have an open short position and MACD < 0, we sell short 3 lots IF NOT c1 AND NOT SHORTONMARKET THEN SELLSHORT 3 SHARES AT MARKET ThisBarOnClose Short = 0 Entry = Close REM EXIT SHORT: Of the 3 lots, we successively buy back at profits of 7, 15 and 25% profit REM if possible. We close the remaining positions when MACD crosses under 0. IF SHORTONMARKET AND Short = 0 AND Close < (Entry * 0.93) THEN EXITSHORT 1 SHARES AT MARKET ThisBarOnClose Short = 1 ELSIF SHORTONMARKET AND Short = 1 AND Close < (Entry * 0.85) THEN EXITSHORT 1 SHARES AT MARKET ThisBarOnClose Short = 2 ELSIF SHORTONMARKET AND Short = 2 AND Close < (Entry * 0.75) THEN EXITSHORT 1 SHARES AT MARKET ThisBarOnClose Short = 3 20 / 53
24 Ch apter II: Programming ProBacktest 2) Position Counters The following commands allow users to build strategies that take into account the number of positions entered since the beginning of the simulation (long or short). COUNTOFPOSITION : number of positions taken since the beginning of the backtest COUNTOFLONGSHARES : number of LONG positions since the beginning of the backtest COUNTOFSHORTSHARES : number of SHORT positions since the beginning of the backtest Similar to commands verifying the type of positions open, these commands are usually preceded by the IF command. Below is an example Backtest using COUNTOFLONGSHARES and COUNTOFSHORTSHARES. Example: Inverse Fisher Transform applied to RSI. This Backtest is based on the "Inverse Fisher Transform RSI" to place buy or sell orders. The system enters long when Inverse Fisher Transform RSI crosses over 50 and exits long when Inverse Fisher Transform RSI crosses under 80. It enters short when Inverse Fisher Transform RSI crosses under 50 and exits short when Inverse Fisher Transform RSI crosses over 20. This backtest was designed for use with futures in a 1h view or stocks in a daily view. REM Inverse Fisher Transform Applied to RSI REM Parameters : n = Number of bars for the calculation of the RSI n = 10 Ind=RSI[n](Close) x = 0.1 * (Ind - 50) y = (EXP (2 * x) - 1) / (EXP (2 * x) + 1) z = 50 * (y + 1) myinversefishertransformsrsi = z[7] IF (myinversefishertransformsrsi Crosses Over 50) THEN BUY 1 SHARES AT MARKET IF (myinversefishertransformsrsi Crosses Under 80) THEN SELL COUNTOFLONGSHARES SHARES AT MARKET IF (myinversefishertransformsrsi Crosses Under 50) THEN SELLSHORT 1 SHARES AT MARKET IF (myinversefishertransformsrsi Crosses Over 20) THEN EXITSHORT COUNTOFSHORTSHARES SHARES AT MARKET 21 / 53
25 Ch apter II: Programming ProBacktest 3) ENTRYINDEX The command ENTRYINDEX[n] allows you to access the index of the bar of the nth previous transaction. The command has the same characteristics as BarIndex and IntradayBarIndex (introduced in the ProBuilder manual) : The bars are numbered from the first to last loaded (left to right) The first bar has an index of 0. Example: If ENTRYINDEX[0] has a value of 3; it means that the last order created was done on the fourth bar since the beginning of the historical data loaded. The syntax is like the syntax for a constant: ENTRYINDEX[nth previous order] Note: It is possible to use ENTRYINDEX without brackets following it. In this case, the program will consider the BarIndex of the last order created. Example : Inside bar strategy The following example is a strategy based on a common price pattern called "Inside Bar" based on 2 candlestick forms: The first form occurs if the range of the 2 nd candle preceding the current candle is greater than the range of the candle preceding the current candle. The candle preceding the current candle must be white (close > open). In this case, a long position is taken. The second form occurs if the range of the 2 nd candle preceding the current candle is lower than the range of the candle preceding the current candle and the candle preceding the current one is black (close < open). In this case we take a short position. The position exit in this system is systematically 3 bars after the position is opened. Condition1 = (High[2] >= High[1] AND Low[2] <= Low[1]) Condition2 = (High[2] <= High[1] AND Low[2] <= Low[1]) Condition3 = (Close[1] > Open[1]) Condition4 = (Close[1] < Open[1]) IF (Condition1 AND Condition3) THEN BUY 10 %CAPITAL AT MARKET NextBarOpen IF LONGONMARKET AND (BarIndex - ENTRYINDEX) = 3 THEN SELL 10 %CAPITAL AT MARKET ThisBarOnClose IF (Condition2 AND Condition4) THEN SELLSHORT 10 %CAPITAL AT MARKET NextBarOpen IF SHORTONMARKET AND (BarIndex - ENTRYINDEX) = 3 THEN EXITSHORT AT MARKET ThisBarOnClose 22 / 53
26 Ch apter II: Programming ProBacktest 4) ENTRYQUOTE The command ENTRYQUOTE[n] allows you to call the price at which the nth previous transaction was executed. This is particularly useful when the length of time between trades is short (intraday strategies). The syntax is as follows: ENTRYQUOTE[nth previous order] As for all constants, you can specify within the brackets the order which you are referring to. If you do not specify a number in brackets after ENTRYQUOTE, the price of the previous order is called. Example : Creation of a take profit stop We define 2 conditions: No open positions Low RSI(<30) We buy when these conditions are true and the price crosses above the 10-period moving average. We close the position when the price exceeds 15% above the ENTRYQUOTE in real-time (using the limit command). IF NOT ONMARKET AND RSI < 30 THEN IF Close > AVERAGE[10](Close) THEN BUY 100 %CAPITAL AT MARKET SELL 100 %CAPITAL AT ENTRYQUOTE * 1.15 LIMIT 5) PreviousTrade Some traders refer to the performance of their previous trade in the construction of their trading strategies. The command PreviousTrade(n) allows the construction and backtesting of this type of strategy. The command returns the performance in % of the nth previous trade. PreviousTrade(nth previous trade) PreviousTrade(1) = Performance of the last trade executed. Note: the parenthesis are required. 23 / 53
27 Ch apter II: Programming ProBacktest Example : Here is an example based on the crossings of stochastic and RSI lines. We first create a buy at market order based on a bullish exponential moving averages crossing and then we create another position : Buy (pyramiding) if : Sell if: - The first trade has a positive performance - RSI is less than 30 - RSI > 70 ONCE StochPeriod = 14 ONCE KPeriod = 3 ONCE DPeriod = 3 - Stochastic %K crosses under Stochastic %D LineK = Stochastic[StochPeriod, KPeriod](Close) LineD = Average[DPeriod](LineK) //We place the first order if there is a bullish EMA crossing IF ExponentialAverage[12](Close) Crosses Over ExponentialAverage[20](Close) THEN BUY AT MARKET //We place the second order IF LineK Crosses Over LineD THEN IF RSI < 30 THEN REM Buy if the previous trade has a positive result IF PreviousTrade(1) > 0 THEN BUY 100 %LIQUIDITY AT MARKET IF RSI > 70 AND LineK Crosses Under LineD THEN SELL 100 %CAPITAL AT MARKET 24 / 53
28 Ch apter II I: Practical Ap p li cations Chapter III: Practical Applications Indicator Strategies 1) Heiken Ashi strategy This system generates a buy signal when a green Heiken Ashi candle appears after a red one. A sell signal is given if a red Heiken Ashi candle appears after a green one. This backtest reconstructs the Heiken Ashi view from normal candlesticks. It must be applied to a chart using the normal candlestick style. ONCE PreviousStatus = 0 IF BarIndex = 0 THEN ELSE XClose = TotalPrice XOpen = (Open + Close) / 2 XClose = TotalPrice XOpen = (XOpen[1] + Xclose[1]) / 2 IF XClose >= XOpen THEN IF PreviousStatus = -1 THEN ELSE BUY 1 SHARES AT MARKET PreviousStatus = 1 IF PreviousStatus = 1 THEN SELLSHORT 1 SHARES AT MARKET PreviousStatus = / 53
29 Ch apter II I: Practical Ap p li cations 2) ZigZag Strategy This is a backtest based on the zigzag to determine what would have been the best buy and sell opportunities. The excellent results of this strategy on both stocks and futures are related to the nonpredictive character of the ZigZag. The signals are recalculated after the fact and as a result do not always give valid signals in real-time. The reason the results of this system are interesting is that they give nearly ideal results that can be compared to other systems. // Periods of the zigzag could be a variable to optimized c11 = (myzigzag > myzigzag[1]) c12 = (myzigzag < myzigzag[1]) IF c11 AND (SHORTONMARKET OR NOT LONGONMARKET) THEN EXITSHORT COUNTOFSHORTSHARES SHARES AT MARKET BUY 50 %CAPITAL AT MARKET IF c12 AND (LONGONMARKET OR NOT SHORTONMARKET) THEN SELL COUNTOFLONGSHARES SHARES AT MARKET SELLSHORT 50 %CAPITAL AT MARKET 3) Range breakout with trailing stop This is a Breakout strategy. The signals are generated by breakouts of highest high levels calculated over a certain number of periods. This system only takes long positions and includes a trailing stop protection. The number of periods should be declared as a variable to be optimized by ProBacktest. REM Period = Optimizable variable (from 2 to 20 by steps of 1) ONCE MMentry = 5 ONCE Period = 14 REM Enter Long: Condition = High > Highest[Period](High)[1] IF Condition AND Summation[Period](Condition) = 1 THEN BUY 1 SHARES AT MARKET c2 = Lowest[10](Low[1]) StopLoss = Highest[MMentry](High)[BarIndex - ENTRYINDEX + 1] / Average[20](High / Low) SET STOP MAX(StopLoss,(c2-0.01)) 26 / 53
30 Ch apter II I: Practical Ap p li cations 4) Smoothed Stochastic Strategy This strategy is based on the smoothed stochastic applied to median price and on moving averages. When the indicator is above its exponential moving average, the system will exit short positions and enter a long position. The system exits long positions and enters a short position when the indicator is below its moving average. REM Variable Definitions Indicator1 = SmoothedStochastic[9,9](MedianPrice) Indicator2 = ExponentialAverage[9](Indicator1) StopLimit = 10 c1 = (Indicator1 >= Indicator2) REM Buy IF c1 THEN BUY 1 SHARES AT MARKET RealTime IF LONGONMARKET THEN SELL AT ENTRYQUOTE * (1 + StopLimit / 100) Limit IF SHORTONMARKET THEN REM Sell EXITSHORT AT ENTRYQUOTE / (1 + StopLimit / 100) Limit IF NOT c1 THEN REM Short SELL AT MARKET RealTime IF NOT c1 THEN SELLSHORT 1 SHARES AT MARKET RealTime REM Exit short IF c1 THEN EXITSHORT AT MARKET RealTime 27 / 53
31 Ch apter II I: Practical Ap p li cations 5) Swing Trading, ADX and Moving Averages This backtest uses the ADX indicator and its position with regard to the level 30 since at least 5 to 10 bars, with the goal of reducing false signals and minimizing risk. The strategy has many conditions that limit the number of trading opportunities. MyADX12 = ADX[12] ADXperiods = 5 MyMM20 = Average[20](Close) IsLow30 = 0 FOR Count = 0 TO ADXperiods DO NEXT // LONG IF MyADX12[Count] < 30.0 THEN IsLow30 = 1 BREAK // ADX 12 is greater than 30 since at least 5 to 10 bars Condition1 = NOT IsLow30 // If the 20-period moving average of the current period is between the high and low of the current // period and the moving average of the previous period is between the high and low of the previous period Condition2 = High > MyMM20 AND Low < MyMM20 AND High[1] < MyMM20[1] AND Low[1] < MyMM20[1] // If the high of the current day is higher than the high of the previous day Condition3 = Dhigh(0) > Dhigh(1) IF Condition1 AND Condition2 AND Condition3 THEN // SHORT BUY 1 SHARES AT MARKET ThisBarOnClose // ADX 12 is greater than 30 since at least 5 to 10 bars Condition4 = NOT IsLow30 // If the 20-period moving average of the current period is between the high and low of the current // period and the moving average of the previous period is between the high and low of the previous period Condition5 = High > MyMM20 AND Low < MyMM20 AND High[1] > MyMM20[1] AND Low[1] > MyMM20[1] // If the low of the current day is less than the low of the previous day Condition6 = Dlow(0) < Dlow(1) IF Condition4 AND Condition5 AND Condition6 THEN SELLSHORT 1 SHARES AT MARKET ThisBarOnClose 28 / 53
32 Ch apter II I: Practical Ap p li cations Money management strategies A backtest's result can be improved by using advanced money management strategies. These strategies are often formalized in martingales. They are aimed at optimizing the mathematical expectancy of a strategy. The expectancy is the average win or loss for each transaction if many transactions are done. This implies being able to estimate the probability of a transaction being winning and the probable amount of profit or loss. In order to implement a martingale, it can be very useful to have stop loss, take profit and inactivity orders directly coded in a strategy, so that they are fully customizable, and to have sub-strategies allowing us to dynamically manage a position's size. 1) Stop loss The code below allows you to program a stop directly in your strategy. Don't forget to define the conditions of your stop called StopLossLong and StopLossShort in this code. ONCE Level1 = 0.05 REM Determines the loss threshold above which the position will be closed (0.05 = 5%). REM If we are long, we close the position as soon as the price moves Level1 % below the entry price. IF LONGONMARKET AND (Close - ENTRYQUOTE) / (ENTRYQUOTE) < Level THEN SELL AT MARKET StopLossLong REM If we are short, we close the position when the price has increased Level1 % above the entry price. IF SHORTONMARKET AND (Close - ENTRYQUOTE) / (ENTRYQUOTE) > Level THEN EXITSHORT AT MARKET StopLossShort 2) Take profit stop The code below allows you to set a fixed take profit stop. Don't forget to define the conditions of your take profit stop, called TakeProfitLong and TakeProfitShort in this code. ONCE Level2 = 0.05 REM Determines the gains threshold above which the position will be closed (0.05 is equivalent to 5%). REM If we are long, we close the position as soon as the price moves Level2 % above the entry price. IF LONGONMARKET AND (Close - ENTRYQUOTE) / (ENTRYQUOTE) > Level THEN SELL AT MARKET TakeProfitLong REM If we are short, we close the position when the price has decreased Level2 % from the entry price. IF SHORTONMARKET AND (Close - ENTRYQUOTE) / (ENTRYQUOTE) < Level THEN EXITSHORT AT MARKET TakeProfitShort 29 / 53
33 Ch apter II I: Practical Ap p li cations 3) Inactivity Stop The following code allows you to use an inactivity stop in your strategy. Don't forget to define the conditions of your stop, here called InactivityStopLong and InactivityStopShort. In the following example, the stop is triggered after 10 bars. ONCE Count = 10 REM Choice of the number of bars after which the position will be systematically closed. IF ONMARKET AND (BarIndex - ENTRYINDEX + 1) > Count THEN IF LONGONMARKET THEN SELL AT MARKET InactivityStopLong IF SHORTONMARKET THEN EXITSHORT AT MARKET InactivityStopShort 4) Pyramiding a position To pyramid positions, first check Cumulate positions in the backtest's Capital management window. Pyramiding means placing several successive orders in the same directions to increase the position size. An example of coding pyramiding in a backtest is shown in this example: REM BUY when RSI > 30 IF RSI[14](Close) < 30 THEN BUY 1 SHARES AT MARKET REM If there is a long position open and Open is greater than Previous close, buy 1 additional stock/lot. IF LONGONMARKET AND Open > Close[1] THEN BUY 1 SHARES AT MARKET REM If price crosses under simple moving average, sell the entire position. IF Close Crosses Under Average[14](Close) THEN SELL 100 %CAPITAL AT MARKET 30 / 53
34 Ch apter II I: Practical Ap p li cations 5) Dynamic position size management To dynamically vary a position size without pyramiding, you can use a variable indicating the amount of stocks/lots to purchase when an order is placed as shown in this example. ONCE OrderSize = 1 REM The variable order size is initially set at 1. We buy OrderSize shares. BUY OrderSize SHARES AT MARKET REM The position is closed after 2 bars systematically. IF BarIndex - ENTRYINDEX >= 2 THEN SELL AT MARKET REM IF RSI is less than 30, we increase OrderSize by 1 each bar. REM OrderSize may not be greater than 50. IF RSI[14](Close) < 30 THEN OrderSize = MAX(OrderSize + 1, 50) REM If RSI is more than 70, we decrease OrderSize by 1 each bar. REM OrderSize may not be less than 0. IF RSI[14](Close) > 70 THEN OrderSize = MIN(OrderSize - 1, 0) 31 / 53
35 Ch apter II I: Practical Ap p li cations 6) Taking into account previous performance By using the PreviousTrade(n), we can modify a strategy based on its performance. By taking the previous backtest, we can make it more intelligent by increasing position size when previous trades were winning or decreasing position size when previous trades were losing. ONCE OrderSize = 1 REM The variable order size is initially set at 1. We buy OrderSize shares. BUY OrderSize SHARES AT MARKET REM The position is closed after 2 bars systematically. IF BarIndex - ENTRYINDEX >= 2 THEN SELL AT MARKET REM IF RSI is less than 30, we increase OrderSize by 1 each bar. REM OrderSize may not be greater than 50. IF RSI[14](Close) < 30 THEN OrderSize = MAX(OrderSize + 1, 50) REM If RSI is more than 70, we decrease OrderSize by 1 each bar. REM OrderSize may not be less than 0. IF RSI[14](Close) > 70 THEN OrderSize = MIN(OrderSize - 1, 0) REM Application of behavior modification depending on past performance. REM We analyze successively the 3 previous trades. REM If a trade was losing, the position size decreases by 1. Otherwise, it increases by 1. FOR n = 1 TO 3 DO NEXT IF PreviousTrade(n) >= 0 THEN OrderSize = MAX(OrderSize + 1, 50) ELSIF PreviousTrade(n) < 0 THEN OrderSize = MIN(OrderSize - 1, 0) With these tools, we can now use different martingales in ProBacktest strategies. Here are some examples of capital management techniques that can be used with other strategies. 32 / 53
36 Ch apter II I: Practical Ap p li cations 7) The classic martingale The classic martingale doubles the position size when it loses in order to make up for the loss if the next trade is a winner. The disadvantage of a strategy like this is that successive losses make it more and more difficult (or impossible) to double your position. Starting with 1000 for example, if you lose 5 times in a row, you would need 1000 x 2 5 or to continue with this strategy. As a result, strategies with the martingale may be more adapted to trading stocks than Futures or Forex because the initial capital required to trade may be much larger in these 2 types of markets. This code must be integrated with your own entry and exit conditions. //***********Code to insert at the beginning of the Strategy*********// ONCE OrderSize = 1 REM We start with a position size of 1. //*********************// //***********Code to insert just after closing a position**********// IF PreviousTrade(1) < 0 THEN OrderSize = OrderSize * 2 REM If the last trade was a losing trade, we double the position size. ELSIF PreviousTrade(1) > 0 THEN OrderSize = 1 REM If the last trade was a winning trade, we go back to a position size of 1. //*********************// REM In the backtest, the position size must be set using the variable OrderSize. 33 / 53
37 Ch apter II I: Practical Ap p li cations 8) The great martingale The great martingale is similar to the classic martingale, except that in addition to doubling the position size after each loss, we add one additional unit. This is more risky than the classic martingale in case of successive losses but it allows significantly increasing gains otherwise. This code must be integrated with your own entry and exit conditions. //***********Code to insert at the beginning of the Strategy*********// ONCE OrderSize = 1 REM We start with a position size of 1. //*********************// //***********Code to insert just after closing a position**********// IF PreviousTrade(1) < 0 THEN OrderSize = OrderSize * // If the last trade was a losing trade, we double position size and add one. ELSIF PreviousTrade(1) >= 0 THEN OrderSize = 1 // If the last trade was a winning trade, we go back to a position size of 1. //*********************// REM In the backtest, the position size must be set using the variable OrderSize. 34 / 53
38 Ch apter II I: Practical Ap p li cations 9) The Piquemouche The Piquemouche is another variant of the classic martingale. In case of loss, we increase the position size by 1 if there are less than 3 consecutive losses. If there are more than 3 consecutive losses, we double the position. A gain resets the position size to 1 unit. This strategy is less risky than the 2 previous ones because the position size is not exponentially increased until 3 successive losses are attained. This code must be integrated with your own entry and exit conditions. //***********Code to insert at the beginning of the Strategy*********// ONCE OrderSize = 1 REM We start with a position size of 1. ONCE BadTrades = 0 // We initiate the counter of losing trades. //*********************// //***********Code to insert just after closing a position**********// IF PreviousTrade(1) < 0 THEN BadTrades = BadTrades + 1 IF BadTrades < 3 THEN // If the last trade was losing and there are less than 3 consecutive losses, we // increase the size of the position by 1. OrderSize = OrderSize + 1 ELSIF PreviousTrade(1) < 0 AND BadTrades MOD 3 = 0 THEN ELSIF PreviousTrade(1) >= 0 THEN //*********************// // If the last trade was losing and there were more than 3 consecutive losses, // we double the size of the next position. OrderSize = OrderSize * 2 // If the last trade was a winning trade, we go back to a position size of 1. OrderSize = 1 BadTrades = 0 REM In the backtest, the position size must be set using the variable OrderSize. 35 / 53
39 Ch apter II I: Practical Ap p li cations 10) The Whittacker In a Whittacker, when there is a loss, we set the position size to the sum of the two previous position sizes. In case of a gain, the position size is set to 1 unit. This code must be integrated with your own entry and exit conditions. //***********Code to insert at the beginning of the Strategy*********// ONCE OrderSize = 1 REM We start with a position size of 1. //*********************// //***********Code to insert just after closing a position**********// IF PreviousTrade(1) < 0 THEN OrderSize = OrderSize + OrderSize[1] ELSIF PreviousTrade(1) >= 0 THEN OrderSize = 1 // If the last trade was a winning trade, we go back to a position size of 1. //*********************// REM In the backtest, the position size must be set using the variable OrderSize. 11) The D Alembert Pyramid This martingale was made famous by d Alembert, a French 18 th century mathematician. In case of loss, the position size is increased by 1 unit, in case of gain it is decreased by 1 unit. This technique of position size management is relevant only if we suppose that successive gains reduce the probability of winning again and successive losses reduce the probability of losing again. This code must be integrated with your own entry and exit conditions. //***********Code to insert at the beginning of the Strategy*********// ONCE OrderSize = 1 REM We start with a position size of 1. //*********************// //***********Code to insert just after closing a position**********// IF PreviousTrade(1) < 0 THEN OrderSize = OrderSize + 1 ELSIF PreviousTrade(1) >= 0 THEN OrderSize = MAX(OrderSize -1, 1) //*********************// REM In the backtest, the position size must be set using the variable OrderSize. 36 / 53
40 Ch apter II I: Practical Ap p li cations 12) The contre d Alembert This is the reciprocal strategy of the D'Alembert Pyramid. We decrease the position size in case of a loss and increase the position size in case of a gain. This technique is relevant if we believe that a past loss increases the probability of a future loss and a past gain increases the probability of a future gain. This code must be integrated with your own entry and exit conditions. //***********Code to insert at the beginning of the Strategy*********// ONCE OrderSize = 1 REM We start with a position size of 1. //*********************// //***********Code to insert just after closing a position**********// IF PreviousTrade(1) < 0 THEN OrderSize = MAX(OrderSize - 1, 1) ELSIF PreviousTrade(1) >= 0 THEN OrderSize = OrderSize + 1 //*********************// 37 / 53
41 An n ex: Capital Management Setup Annex: Capital Management Setup The "capital management" window is available in the Money Management section of the ProBacktest programming window. Capital management is a key element that can make strategy results vary widely. For example, reducing brokerage fees or different risk management rules can significantly increase net backtest results. This window is made of 5 customizable sections : Capital Brokerage Fees Risk Management Orders Management (Position management) Round the number of securities to buy/sell Different rules apply for the brokerage fees depending on what type of security you are working with such as stocks, futures or Forex We will explain how to setup brokerage fee settings for each of these types of securities at the end of this annex. Capital In this section, you just enter the amount you want for the starting capital of the trading strategy. Note : except in special cases (see the section on risk management), ProBacktest will not take any more positions if the initial capital is all lost. If your strategy is not generating orders, increase your initial capital to make sure it is sufficient to place an order. Risk Management Risk management allows you to setup these 3 parameters: 38 / 53
42 An n ex: Capital Management Setup 1) Maximum limit of investment This field is very useful to limit your losses or manage leverage. Begin by selecting how you want to set your max limit of investment. You can choose % of capital, % of liquidity or absolute amount. 2) Max investment per transaction and leverage The max investment per transaction allows you to limit the amount allowed for each order and works in the same way as the previous field. By combining this feature with the max limit of investment, you can manage leverage. Let s look at an example: Max limit of investment: 500 %Capital Max limit per transaction: 500 % Capital With this configuration, you will be able to use a leverage of 5 in your backtest. If you limit yourself to 100% of capital, the maximum loss possible would be the total amount of your backtest portfolio. 3) Minimum investment per transaction The use of minimum investment per transaction is to avoid an investment which is too small implying brokerage fees which will be proportionately too large compared to the possible gain from trading. (Example: The purchase of one stock X at a price of 5 with a brokerage fee of 5 /order meaning that the brokerage fee represents 100% of the invested capital and that your loss would immediately be -100% or -200% if you then sell the stock at the same price at which you bought it). Orders management This section allows you to check a maximum of 3 options. "Reinvest profit" allows you to decide how you will manage your profits: reinvest them or not. By default, the system does not increase Initial Capital with the gains obtained. If you check this box, the gains will increase the capital available for the backtest. "Cumulate positions" allows you to define whether to cumulate unclosed positions in case the condition to enter a position is true for several successive bars. By default, only one one position is taken at a time except in the case of explicit definition in your code. In this case, checking this option or not will have no effect on your backtest. If in the interface, you have setup predefined STOPs, you may associate them to your positions with the following parameters: One stop for all positions (if cumulate positions is checked) One stop for each position 39 / 53
43 An n ex: Capital Management Setup This section becomes particularly interesting if you use trailing stops. A trailing stop is a stop that follows the price and is usually defined as a distance in % from the last price. In the case of cumulated positions, the the system will have a choice of using only one trailing stop (based on the average entry price) or use one trailing stop per position. Round the number of securities to buy/sell This section is relatively simple to fill in. You decide how the number of securities to buy or sell will be rounded. This is applicable for example if you decide to buy a certain % of your available capital worth of shares. Just choose one of the following options: 1) Brokerage fees for stocks To apply a ProBacktest to stocks or similar securities (ex: warrants, ) you need to choose the tab "by order", in the brokerage fees section. As you can see in the figure below, its possible to setup the brokerage fees as an absolute amount of cash or in %. The brokerage fees are applied to one order. Opening and then closing a position (ex: buy and then selling a stock) will charge you 2 times the brokerage fee (one charge for each order) in the ProBacktest simulation. The "minimum order fee" allows you to define a minimum brokerage fee per order for brokerage fees calculated in % of the transaction. Ex : If the "minimum order fee" is 15 and the % of your transaction is only 10, then the total brokerage fee for the order taken into account by ProBacktest will be 15 for that order. 2) Brokerage fees for futures Begin by choosing the tab "by lot (futures)" in the section "Brokerage fees". You must then define : The commission by lot The deposit by lot The value of one point 40 / 53
ProRealTime's trading system tools let you create investment strategies that can be backtested or used automated trading mode.
 ProRealTime's trading system tools let you create investment strategies that can be backtested or used automated trading mode. Follow ProRealTime Programming on Google+ for updates about ProRealTime programming
Follow ProRealTime Programming on Google+ for updates about ProRealTime programming languages.
 ProBuilder is a BASIC-type programming language that allows you to create personalized technical indicators, trading systems and market scanning programs for the ProRealTime platform. Follow ProRealTime
My Techniques for making $150 a Day Trading Forex *Note for my more Advanced Strategies check out my site: Click Here
 My Techniques for making $150 a Day Trading Forex *Note for my more Advanced Strategies check out my site: Click Here The Strategy We will be looking at 2 different ways to day trade the Forex Markets.
Chapter 2.3. Technical Indicators
 1 Chapter 2.3 Technical Indicators 0 TECHNICAL ANALYSIS: TECHNICAL INDICATORS Charts always have a story to tell. However, sometimes those charts may be speaking a language you do not understand and you
START-UP MANUAL FOR MTI 4.0 TECHNICAL ANALYSIS CHARTING
 START-UP MANUAL FOR MTI 4.0 TECHNICAL ANALYSIS CHARTING Introduction Thank you for your subscription to the MTI 4.x Technical Analysis Charting Program, the only true Multiple Time Frame Analysis Platform.
Chapter 2.3. Technical Analysis: Technical Indicators
 Chapter 2.3 Technical Analysis: Technical Indicators 0 TECHNICAL ANALYSIS: TECHNICAL INDICATORS Charts always have a story to tell. However, from time to time those charts may be speaking a language you
How I Trade Profitably Every Single Month without Fail
 How I Trade Profitably Every Single Month without Fail First of all, let me take some time to introduce myself to you. I am Kelvin and I am a full time currency trader. I have a passion for trading and
WEB TRADER USER MANUAL
 WEB TRADER USER MANUAL Web Trader... 2 Getting Started... 4 Logging In... 5 The Workspace... 6 Main menu... 7 File... 7 Instruments... 8 View... 8 Quotes View... 9 Advanced View...11 Accounts View...11
Leon Wilson Trading Success
 Leon Wilson Trading Success A talk given by Mary de la Lande to the BullCharts User Group Meeting on 13 February 2008 1. Who is Leon Wilson? His Books and where to get them. 2. Book 1: The Business of
macquarie.com.au/prime Charts Macquarie Prime and IT-Finance Advanced Quick Manual
 macquarie.com.au/prime Charts Macquarie Prime and IT-Finance Advanced Quick Manual Macquarie Prime Charts Advanced Quick Manual Contents 2 Introduction 3 Customisation examples 9 Toolbar description 12
The 15 50 Trading System
 Main Premise: This is considered to be one of the most straight forward systems for a live trading style for day- and/or intraday trading. The 50 SMA is one of the most commonly used moving average numbers
A Powerful Day Trading Strategy For Futures And Forex Markets Markus Heitkoetter
 A Powerful Day Trading Strategy For Futures And Forex Markets Markus Heitkoetter Agenda How To Configure Your Charts The Three (3) Best Indicators The Best Timeframe A Powerful Day Trading Strategy When
Day Trading Stock Controller
 Day Trading Stock Controller Disclaimer: Trading stocks, including ETFs, involves substantial risk of loss and is not suitable for all people. You should carefully consider whether trading, especially
Trade Navigator. Genesis. TradeSense Manual. Finally Strategy Development and Back Testing Just Got Easier! Financial Technologies Inc.
 100 90 55 0 5 10 80 70 60 50 40 30 20 100 90 55 0 5 10 0 140 130 120 110 80 70 60 50 40 30 20 10 Trade Navigator TradeSense Manual 140 130 120 110 10 0 brought to you by... Genesis Financial Technologies
A powerful dashboard utility to improve situational awareness of the markets, place precise orders, and graphically monitor trading positions.
 A powerful dashboard utility to improve situational awareness of the markets, place precise orders, and graphically monitor trading positions. Position DashBoard Powered by BAR ANALYZER Position DashBoard
Forex Cantata User Manual
 Forex Cantata User Manual CFTC RULE 4.41 - HYPOTHETICAL OR SIMULATED PERFORMANCE RESULTS HAVE CERTAIN LIMITATIONS. UNLIKE AN ACTUAL PERFORMANCE RECORD, SIMULATED RESULTS DO NOT REPRESENT ACTUAL TRADING.
The 2e trading system is designed to take a huge bite out of a trending market on the four hour charts.
 2e Trading System The 2e trading system is designed to take a huge bite out of a trending market on the four hour charts. The basic theory behind the system is that a trending market will often pause,
Take it E.A.S.Y.! Dean Malone 4X Los Angeles Group - HotComm January 2007
 Take it E.A.S.Y.! Dean Malone 4X Los Angeles Group - HotComm January 2007 Dean Malone Partner of Compass Foreign Exchange, LLC. Co-Founder of Forex Signal Service.com. Previous Senior National for 4X Made
Alerts & Filters in Power E*TRADE Pro Strategy Scanner
 Alerts & Filters in Power E*TRADE Pro Strategy Scanner Power E*TRADE Pro Strategy Scanner provides real-time technical screening and backtesting based on predefined and custom strategies. With custom strategies,
Professional Trader Series: Moving Average Formula & Strategy Guide. by John Person
 Professional Trader Series: Moving Average Formula & Strategy Guide by John Person MOVING AVERAGE FORMULAS & STRATEGY GUIDE In an online seminar conducted for the Chicago Board of Trade, I shared how to
Turk s ES ZigZag Day Trading Strategy
 Turk s ES ZigZag Day Trading Strategy User Guide 11/15/2013 1 Turk's ES ZigZag Strategy User Manual Table of Contents Disclaimer 3 Strategy Overview.. 4 Strategy Detail.. 6 Data Symbol Setup 7 Strategy
Ed Heath s Guerilla Swing Trading Plan (as of 1/22/13)
") Ed Heath s Guerilla Swing Trading Plan (as of 1/22/13) Synopsis: I call my trading style Guerilla Swing Trading. I trade upward momentum stocks that have pulled back for a buying opportunity and my goal
Ed Heath s Guerilla Swing Trading Plan (as of 1/22/13) Synopsis: I call my trading style Guerilla Swing Trading. I trade upward momentum stocks that have pulled back for a buying opportunity and my goal
CURRENCY TRADING Using Swing Breakouts in Forex Trading
 CURRENCY TRADING Using Swing Breakouts in Forex Trading 28 MAY 2009 Doug Schaff discusses the use of intermediate swing highs and swing lows to develop a shortterm approach to trading the currency markets.
CHART TRADING GUIDE 1
 CHART TRADING GUIDE 1 How to understand chart trading This guide is designed to teach you the basics of chart trading- the chart patterns that are covered in this booklet can be used for short and medium
The Day Trade Forex System: The ULTIMATE Step-By-Step Guide to Online Currency Trading
 The Day Trade Forex System: The ULTIMATE Step-By-Step Guide to Online Currency Trading How You Can Earn $50 to $500 A Day Currency Trading From The Comfort of Your Own Home! By Erol Bortucene and Cynthia
The Day Trade Forex System: The ULTIMATE Step-By-Step Guide to Online Currency Trading
 The Day Trade Forex System: The ULTIMATE Step-By-Step Guide to Online Currency Trading How You Can Earn $50 to $500 A Day Currency Trading From The Comfort of Your Own Home! 2003 Copyright DayTradeForex.com
Forex Volatility Patterns
 Spotting Early Breakouts Forex Volatility Patterns BRUCE WALDMAN Want to catch 40 to 00 pips in each trade? Here s how you can find those entry and exit signals to make your forex trading a success. C
StrategyDesk TM User Manual Version 3.3
 StrategyDesk TM User Manual Version 3.3 Brokerage services are provided by TD AMERITRADE, Inc., member FINRA/SIPC. TD AMERITRADE, Inc. and Think Tech, Inc. are both subsidiaries of TD AMERITRADE Holding
MATHEMATICAL TRADING INDICATORS
 MATHEMATICAL TRADING INDICATORS The mathematical trading methods provide an objective view of price activity. It helps you to build up a view on price direction and timing, reduce fear and avoid overtrading.
ValueCharts TradeStation
 ValueCharts TradeStation ValueCharts TradeStation indicator suite can be located in the TradeStation Strategy Network under MicroQuantSM products. Free trial subscription periods are available for all
EF MetaTrader 5 for Android OS
 User Guide for the online trading platform EF MetaTrader 5 for Android OS Euro-Finance 43 Christopher Columbus blvd., 1592 Sofia, Bulgaria tel.: +359 (0) 700 156 56; fax: +359 (0) 2 981 14 96 support@eurofinance.bg
Technical Indicators Explained
 Chapter I. Technical Indicators Explained In This Chapter The information in this chapter is provided to help you learn how to use the technical indicators that are available for charting on the AIQ TradingExpert
TOMORROW'S TRADING TECHNOLOGY. 100% automated Fibonacci support and resistance levels that you can count on every single trading day in an instant.
 TOMORROW'S TRADING TECHNOLOGY 100% automated Fibonacci support and resistance levels that you can count on every single trading day in an instant. ProTrader Table of Contents 1. Areas A. Fibonacci Confluence
Intra-Day Trading Techniques
 Pristine.com Presents Intra-Day Trading Techniques With Greg Capra Co-Founder of Pristine.com, and Co-Author of the best selling book, Tools and Tactics for the Master Day Trader Copyright 2001, Pristine
7. Analysis... 36 7.1 Chart... 36 7.2 Whatif Calculator... 39
 Contents 1. Introduction... 5 2. Getting Started... 7 2.1 What you need... 7 2.2 How to login... 7 At a Glance... 8 3. Atrad Home... 11 3.1 Ticker... 11 3.2 Indices... 11 3.3 Themes... 12 3.3.1 Full screen
FOREX PLATFORM USER S GUIDE
 FOREX PLATFORM USER S GUIDE Table of Content 1. Introduction... 2 2. Top Menu Bar... 2 3. Distinguishing Features of the Forex Platform... 3 3.1 Market Orders... 3 3.2 Trailing Stops... 4 3.3 Margin Watcher...
Thinking Man s Trader
 Thinking Man s Trader Advanced Trader s Package Trading is a three dimensional world and the Advanced Trader s Package covers all three. Dimension three: Market Dynamics, conditions and change of conditions
Forex Success Formula Presents Forex Success Mini Forex Success Formula Presents Forex Success Mini
 Forex Success Formula Presents Forex Success Mini - 1 www.forexsuccessformula.com/forextradingblog Risk Disclosure Statement The contents of this e-book are for informational purposes only. No Part of
Lesson 5: The Trading Station
 Lesson 5: The Trading Station Objective To understand the basic functions of the Trading Station and become proficient with market order entry, the stop loss and limit functions, closing trades manually,
Your Personal Trading Journal
 Your Personal Trading Journal This guide provides instructions for the setup and helps you getting started with your Edgewonk trading journal. It is recommended that you read it thoroughly to fully leverage
THIS IS THE TRADING METHOD FOR THE STEALTH FOREX TRADING SYSTEM V10
 THIS IS THE TRADING METHOD FOR THE STEALTH FOREX TRADING SYSTEM V10 YOU SHOULD HAVE ALREADY READ AND APPLIED THE INFORMATION IN THE SET-UP DOCUMENT. IF YOU HAVE NOT ALREADY DONE SO - PLEASE COMPLETE SET
Copyright 2010 by Kelvin Lee
 All rights reserved. No part of this publication may be reproduced, stored in a retrieval system, or transmitted, in any form or by any means, electronic, mechanical, photocopying, recording or otherwise,
The types of alarm you can set. How to set up alarms. How to view triggered alarms. How to change the default settings for alarms.
 What you will learn in this chapter: The types of alarm you can set. How to set up alarms. How to view triggered alarms. How to change the default settings for alarms. ShareScope User Guide Page 1 of 15
A) Setup. 2. For more information about TGS, click on TGS Guide.
 Setup. 2. For more information about TGS, click on TGS Guide.") A) Setup 1. To open TradeGuide, login to the OrionLite trading terminal and click on the start button. Click on the TradeGuide Signal (TGS), or simply use the shortcut Ctrl+T. To start receiving signals,
A) Setup 1. To open TradeGuide, login to the OrionLite trading terminal and click on the start button. Click on the TradeGuide Signal (TGS), or simply use the shortcut Ctrl+T. To start receiving signals,
Trading Binary Options Strategies and Tactics
 Trading Binary Options Strategies and Tactics Binary options trading is not a gamble or a guessing game. By using both fundamental and technical market analysis, you are able to get a better understanding
Metatrader 4 Tutorial
 Metatrader 4 Tutorial Thank you for your interest in Best Metatrader Broker! This tutorial goes in detail about how to install and trade with your new Metatrader Forex trading platform. With Best Metatrader
Pro Picks Quick Reference
 SUMMARY PAGE Asset Tabs Filter Bar Subscription Status Portfolio Performance Summary Multi-select Filter Drop-down lists Asset Performance Summary Listing Panel Asset Tabs The tabs in the upper left allow
NEXGEN DEMO TRADING & EDUCATIONAL PLAN SIMPLIFIED
 NEXGEN DEMO TRADING & EDUCATIONAL PLAN SIMPLIFIED Please watch the intro Video so you understand Nexgen's expectations for your demo time and what you should expect from us during your demo. CLICK TO WATCH
Welcome to FOREX e-book
 Welcome to FOREX e-book Table of Contents 1. About BRAND... 2 2. Trading Platforms... 3 3. What is Traded in the Forex Market?... 4 4. What is Forex?... 4 5. Advantages of the Forex Market... 5 6. How
Let s Get to Know Spread Bets
 Let s Get to Know Spread Bets Spread betting is pretty cool. Here are three reasons why. Even if you ve never traded before, you probably know how the financial market works buy in and hope it goes up.
Getting Around in thinkorswim
 1 Getting Around in thinkorswim If you don t have a real account, the virtual account that you sign up for is called papermoney. If you sign up and fund a real account with TD Ameritrade s thinkorswim
High Probability Trading Triggers for Gold & Silver
 Welcome to a CBOT Online Seminar High Probability Trading Triggers for Gold & Silver Presented by: John Person Sponsored by Interactive Brokers Live Presentation Starts at 3:30 PM Chicago Time NOTE: Futures
FXCM Metatrader4. User Guide to the No Dealing Desk Platform. 1 P a g e
 FXCM Metatrader4 User Guide to the No Dealing Desk Platform 1 P a g e Table of Content Benefits of FXCM Metatrader 4...4 Expert Advisor Use...4 Metatrader 4 versus Trading Station II...4 Expert Advisor
Technical Analysis. Technical Analysis. Schools of Thought. Discussion Points. Discussion Points. Schools of thought. Schools of thought
 The Academy of Financial Markets Schools of Thought Random Walk Theory Can t beat market Analysis adds nothing markets adjust quickly (efficient) & all info is already in the share price Price lies in
Stop Investing and Start Trading. How I Trade Technical Strategies Over Fundamental Strategies
 Stop Investing and Start Trading How I Trade Technical Strategies Over Fundamental Strategies PREPARATION PRIOR TO OPENING MARKET 1. On Daily Log Sheet record NAV [Net Asset Value] of portfolio. 2. Note
Technical Indicators Tutorial - Forex Trading, Currency Forecast, FX Trading Signal, Forex Training Cour...
 Page 1 Technical Indicators Tutorial Technical Analysis Articles Written by TradingEducation.com Technical Indicators Tutorial Price is the primary tool of technical analysis because it reflects every
Trading Equities through CFDs With the Cycle Trends Live Program
 Trading Equities through CFDs With the Cycle Trends Live Program The live Cycle Trends program is especially suited to the trading of CFDs (Contracts for Difference).The reason is that the CFD mimics almost
My EA Builder 1.1 User Guide
 My EA Builder 1.1 User Guide COPYRIGHT 2014. MyEABuilder.com. MetaTrader is a trademark of MetaQuotes www.metaquotes.net. Table of Contents MAIN FEATURES... 3 PC REQUIREMENTS... 3 INSTALLATION... 4 METATRADER
FreeStockCharts.com Workbook
 FreeStockCharts.com Workbook Updated March 2010 FREESTOCKCHARTS.COM WORKBOOK Worden Brothers, Inc. www.worden.com Five Oaks Office Park 4905 Pine Cone Drive Durham, NC 27707 0 FREESTOCKCHARTS.COM WORKBOOK
SFT Simple Strategy. Version by Radim Frycka www.sftmgm.com
 SFT Simple Strategy Version by Radim Frycka www.sftmgm.com What is it based on? Old School Simple Technical Analysis based on EMA (Exponential Moving Average) with use of Stochastic oscilator and RSI(Relative
My Daily Trading Preparation. Establishing Risk Parameters and Positions
 My Daily Trading Preparation Establishing Risk Parameters and Positions My Trading Goals My goals have to be consistent with my trading plan each day. For stocks, I am primarily a long-only trader (and
Intra-Day Trading Techniques. Pristine.com Presents. Greg Capra. book, Tools and Tactics for the Master Day Trader
 Pristine.com Presents Intra-Day Trading Techniques With Greg Capra Co-Founder of Pristine.com, and Co-Author of the best selling book, Tools and Tactics for the Master Day Trader Copyright 2001, Pristine
STREET SMARTS I. Planetary 2 Library. Introduction: Benefits: L I B R A R I E S
 Planetary 2 Library STREET SMARTS I Introduction: In today s world of computer trading, the small speculator often feels at a disadvantage to traders and corporations that have access to more powerful
Manual: I. Getting Started:
 Manual: I. Getting Started: II. Layout: Download the Latest version of Laser trading platform from http://sharktraders.com/nyse-nasdaq-amex/platforms-nyse/laser/ Install to the appropriate directory (it
Disclaimer: The authors of the articles in this guide are simply offering their interpretation of the concepts. Information, charts or examples
 Disclaimer: The authors of the articles in this guide are simply offering their interpretation of the concepts. Information, charts or examples contained in this lesson are for illustration and educational
Click on the below banner to learn about my revolutionary method to trade the forex market:
 By Avi Frister http://www.forex-trading-machine.com Click on the below banner to learn about my revolutionary method to trade the forex market: Copyright 2008 The Forex Navigator System. All rights reserved
SYNERGY Trading Method. CompassFX, 2009 www.compassfx.com Rev. 81009
 SYNERGY Trading Method SYNERGY Method INSTALLATION Basic Synergy is designed to automatically download onto the C: drive of your computer. If your local drive is not the C: drive, please send an email
Commodity Channel Index
 Commodity (CCI) Developed by Donald Lambert, the Commodity (CCI) was designed to identify cyclical turns in commodities but can be applied to shares as well. The Commodity Channel Index uses a typical
Trend Determination - a Quick, Accurate, & Effective Methodology
 Trend Determination - a Quick, Accurate, & Effective Methodology By; John Hayden Over the years, friends who are traders have often asked me how I can quickly determine a trend when looking at a chart.
Alarm Manager. 1. About the Alarm Manager... 4. 2. Overview of the Alarm Manager... 5
 Table of Contents 1. About the... 4 2. Overview of the... 5 2.1 Alarms and groups... 5 2.2 Display of alarms... 5 2.3 Triggers... 5 2.3.1 Alarms not yet triggered... 6 2.3.2 Alarm triggered, and condition
STOCK TRADING INDICATORS EXPLAINED. How To Make Profit Trading Stocks Using Indicators
 STOCK TRADING INDICATORS EXPLAINED How To Make Profit Trading Stocks Using Indicators Contents What are Indicators?... 4 The ADX Indicator... 5 How to Use ADX Indicator... 5 Technical Indicator ADX...
Fibonacci Trader. Robert Krausz s. 32-Bit, Version 3.01
 PRODUCT REVIEW Robert Krausz s Fibonacci Trader 32-Bit, Version 3.01 FIBONACCI TRADER CORPORATION 1835 US 1 South 119, Suite 352 St. Augustine, FL 32086 To order: 512 443-5751 Fax: 512 443-7119 Internet:
Table of Contents. Introduction Opening A Demo Account Overview Market Watch (Quotes Window) Charts Navigator
 Charts Navigator") Table of Contents Introduction Opening A Demo Account Overview Market Watch (Quotes Window) Charts Navigator (Folder File) Trade Terminal (Your Account Details) New Order Execution News Service Account
Table of Contents Introduction Opening A Demo Account Overview Market Watch (Quotes Window) Charts Navigator (Folder File) Trade Terminal (Your Account Details) New Order Execution News Service Account
PipStrider II User Manual
 PipStrider II User Manual CFTC RULE 4.41 - HYPOTHETICAL OR SIMULATED PERFORMANCE RESULTS HAVE CERTAIN LIMITATIONS. UNLIKE AN ACTUAL PERFORMANCE RECORD, SIMULATED RESULTS DO NOT REPRESENT ACTUAL TRADING.
The Forex Profit System :
 The Forex Profit System : How to Earn $50 to $500 a day Forex Trading from the Comfort of Your Own Home! OVERVIEW Dear Friend, Thanks for your interest in my Forex Profit System. The Forex Profit System
UNLEASH THE POWER OF SCRIPTING F A C T S H E E T AUTHOR DARREN HAWKINS APRIL 2014
 UNLEASH THE POWER OF SCRIPTING F A C T S H E E T AUTHOR DARREN HAWKINS APRIL 2014 Summary The ability to create your own custom formulas to scan or filter large sets of data can be a huge time-saver when
Free Scalping Indicator
 Free Scalping Indicator Risk and Liability: The author and the publisher of the information contained herein are not responsible for any actions that you undertake, including but not limited to, implementing
Trading the Daniel Code Numbers
 Trading the Daniel Code Numbers INTRODUCTION... 2 ABOUT THE DC NUMBERS... 2 BEFORE YOU START... 2 GETTING STARTED... 2 Set-Up Bars... 3 DC Number Sequences... 4 Reversal Signals... 4 DC TRADING METHODOLOGY...
Stochastic Oscillator.
 Stochastic Oscillator. By Jay Lakhani www.4x4u.net George Lane was the originator of the stochastic indicator in the 1960 s; the indicator tracks the market momentum. Lane observed that as prices rise
MAGIC BREAKOUT Forex Trading Strategy
 Tim Trush & Julie Lavrin Introducing MAGIC BREAKOUT Forex Trading Strategy Your guide to financial freedom. Tim Trush, Julie Lavrin, T&J Profit Club, 2007 2015, All rights reserved www.magicbreakout.com
Definitions to Basic Technical Analysis Terms. www.recognia.com
 Definitions to Basic Technical Analysis Terms www.recognia.com A Alert An alert is a notification sent when a significant event occurs in one or more investments of importance to a trader. Recognia sends
ForexIndicator.org. Presents. Written By Kelvin Lee
 ForexIndicator.org Presents Written By Kelvin Lee All rights reserved. No part of this publication may be reproduced, stored in a retrieval system, or transmitted, in any form or by any means, electronic,
Table of Contents. Preface. Chapter 1: TRADING BASICS. Chapter 2: BASIC TOOLS. Chapter 3: ADX. Chapter 4: ACCUMULATION LINE
 Table of Contents Preface Chapter 1: TRADING BASICS Chapter 2: BASIC TOOLS Chapter 3: ADX Chapter 4: ACCUMULATION LINE Chapter 5: AVERAGE TRUE RANGE Chapter 6: CANDLESTICKS Chapter 7: MACD Chapter 8: MOVING
5min Forex Trade Strategy Imran Sait Version 1.2 updated on 16 th Nov 2007
 5min Forex Trade Strategy Imran Sait Version 1.2 updated on 16 th Nov 2007 ( Works on All Time Frames and for all Pairs - Best used on 5Min/15min/ for short term Trades and 30min/1Hr/4hr/daily for Long
APPLICATION PLATFORMS:
 APPLICATION PLATFORMS: FIRST CHARTING WEB FIRST CHARTING DESK FIRST CHARTING MOBILE WE PROVIDE: NSE CHARTING APP MCX CHARTING APP BOTH MCX/NSE CHART APP PROFESSIONAL TECHNICAL ANALYSIS CHARTING TOOLS:
NEDBANK PRIVATE WEALTH STOCKBROKERS Graphical Analysis Manual
 This advanced charting application displays interactive, feature-rich, automatically-updated financial charts; The application also provides you with the ability to perform advanced technical analysis
www.gainsy.com Tading Platform Manual
 Tading Platform Manual Table of contents Description... 4 General... 5 Layout and windows management... 5 Working on several monitors... 5 Drag and drop... 5 Columns management... 5 Windows links... 6
VBM-ADX40 Method. (Wilder, J. Welles from Technical Analysis of Stocks and Commodities, February 1986.)
") VBM-ADX40 Method " I ve found that the most important thing in trading is always doing the right thing, whether or not you win or lose this is market savvy money management... I would go so far as to say
VBM-ADX40 Method " I ve found that the most important thing in trading is always doing the right thing, whether or not you win or lose this is market savvy money management... I would go so far as to say
Trading Contracts for Difference on margin involves a high degree of risk and may not be suitable for all investors.
 User Guide Ver 3.0 Disclaimer Trading Contracts for Difference on margin involves a high degree of risk and may not be suitable for all investors. The leverage created by trading on margin can work against
The Shield, Inc. 2014 www.turnkeybroker.com support@turnkeybroker.com
 TurboTick PRO manual version 2.022 updated 7.7.2014 Table of Contents Contents Table of Contents... 2 Getting started in TurboTick Pro... 3 Level 2... 5 Order Entry... 8 Streamlined Order Entry... 10 Portfolio
FOREXTrader PRO. User Guide. Version 3.1.0.80 REF 20120905V4UK
 FOREXTrader PRO User Guide Version 3.1.0.80 REF 20120905V4UK 1 Table of Contents I. Setup 4 a. Edit Trading Preferences i. Overview and Wizard ii. General Preferences iii. Product Settings iv. Dealing
HOW I TRIPLED MY ACCOUNT IN 4 MONTHS WITH FXJAKE.COM
 HOW I TRIPLED MY ACCOUNT IN 4 MONTHS WITH FXJAKE.COM By Nicola McLaughlin IMPORTANT While we make every effort to ensure that we accurately represent all the products and services reviewed on this website
EUR/USD Trading Strategy
 EUR/USD Trading Strategy TRADING SIGNALS TRADING EDUCATION TRADING STRATEGIES Kathy Lien & Boris Schlossberg www.bkforex.com TRADING SIGNALS & TRADING EDUCATION Risk Disclosure BKForex LLC is a registered
Active Trend Trading System
 Active Trend Trading System Candle Light Trader: Dennis W. Wilborn A Trend Should Be Assumed to Continue in Effect Until Such Time as Its Reversal Has Been Definitely Signaled Edwards & Magee Disclaimer
Client Software Feature Guide
 RIT User Guide Build 1.00 Client Software Feature Guide Introduction Welcome to Rotman Interactive Trader 2.0 (RIT 2.0). This document assumes that you have installed the Rotman Interactive Trader 2.0
Daytrading Stock Pairs
 TRADING TECHNIQUES Using Volatility And Correlation Daytrading Stock Pairs Tired of trading Level II quotes and one-minute charts? Try a market-neutral strategy. by Mark Conway and Aaron Behle I t can
Trading with the High Performance Intraday Analysis Indicator Suite
 Trading with the High Performance Intraday Analysis Indicator Suite PowerZone Trading indicators can provide detailed information about the conditions of the intraday market that may be used to spot unique
FOREX PROFIT MASTER USER GUIDE. http://www.forexprofitmaster.com
 FOREX PROFIT MASTER USER GUIDE http://www.forexprofitmaster.com DISCLAIMER Please be aware of the loss, risk, personal or otherwise consequences of the use and application of this book s content. The author
Excel Project Creating a Stock Portfolio Simulation
 Background Vocabulary Excel Project Creating a Stock Portfolio Simulation 1. What is a stock? A stock is a share in the ownership of a corporation, a large business organization. A stock, also, represents
SANLAM itrade FULL SERVICE ONLINE SHARE TRADING
 SANLAM itrade FULL SERVICE ONLINE SHARE TRADING What is Sanlam itrade? Sanlam itrade is an online trading platform so advanced in its design and user compatibility, so liberating in its spread of options,