Agenda. Global Energy Outlook. Energy Potential of Our Region. Energy Investments in our Region
|
|
|
- Alisha Chase
- 8 years ago
- Views:
Transcription
1
2 Agenda Global Energy Outlook Energy Potential of Our Region Energy Investments in our Region


3 Our Energy Politics Billion TEP Billion TEP IEA, World Energy Outlook 214


4 Global Renewable Energy Report, 214 Our Energy Politics


5 Global Renewable Energy Report, 214 Our Energy Politics


6 Global Renewable Energy Report, 214 Our Energy Politics


7 Our Energy Politics IEA, World Energy Outlook GW Renewable Energy


8 IEA, World Energy Outlook 214 Our Energy Politics

9 Our Energy Politics Evaluating the Energy Potential of Region Solar Plants Thermic Plant Our Mission Solar Power Industry Building up an energy industrial at the region Wind Power Industry Nuclear Power Industry

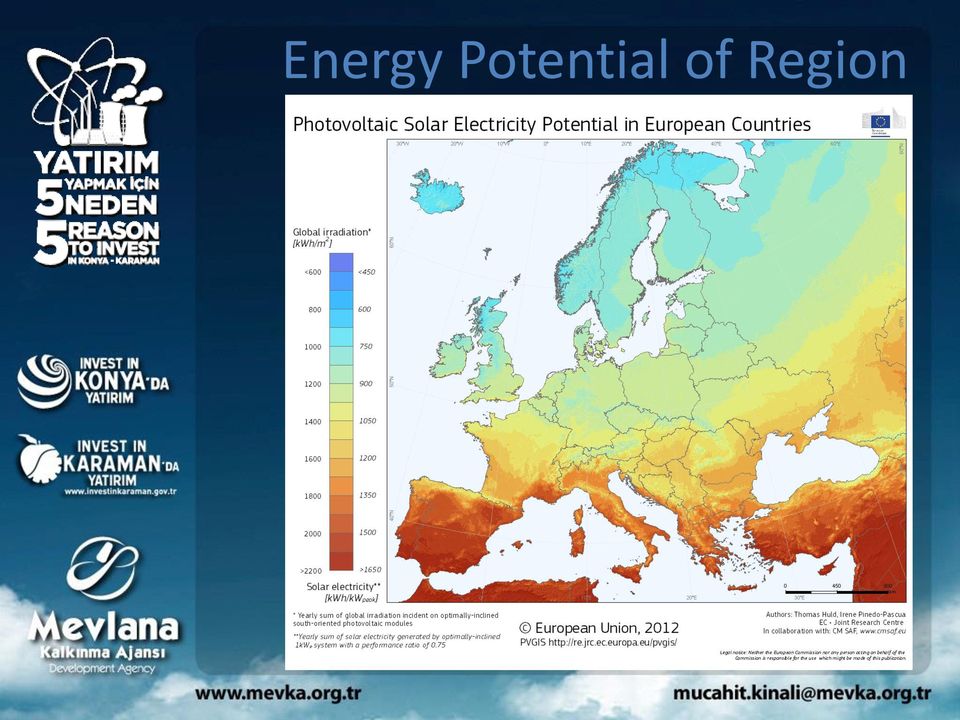
10 Energy Potential of Region High Renewable Energy Potential Highest Capacity Permission Ready Investment Lands and Infrastructure Strong Industry Energy Incentives

11 kwh/m2-day Energy Potential of Region 8 Global Radiation (kwh/m2-day) January February March April May June July August September October November December Average Global Radiation (kwh/m2-day) Turkey 1,79 2,5 3,87 4,93 6,14 6,57 6,5 5,81 4,81 3,46 2,14 1,59 4,18 Global Radiation (kwh/m2-day) Konya 1,98 2,56 4,23 5,2 6,3 6,78 6,81 6,5 5,12 3,73 2,35 1,77 4,41 Global Radiation (kwh/m2-day) Karaman 2,16 2,69 4,38 5,35 6,45 6,98 6,91 6,15 5,22 3,86 2,52 1,91 4,55 Global Radiation (kwh/m2-day) Karapınar 2,6 2,59 4,33 5,25 6,31 6,85 6,8 6,7 5,2 3,8 2,46 1,81 4,46 Konya %5,53, Karapınar %6,82, Karaman %8,92 are more efficiency than Turkey s avarage
 Karapınar 2,6 2,59 4,33 5,25 6,31 6,85 6,8 6,7 5,2 3,8 2,46 1,81 4,46 Konya %5,53, Karapınar %6,82, Karaman %8,92 are more efficiency than")
12 Saat Energy Potential of Region 14 Sunshine Duration ( Hour ) January February March April May June July August Septembe r October November December Average Sunshine Duration ( Hour ) Turkey 4,11 5,22 6,27 7,46 9,1 1,81 11,31 1,7 9,23 6,87 5,15 3,75 7,5 Sunshine Duration ( Hour ) Konya 4,19 5,51 6,68 8,3 9,46 11,28 11,97 11,35 9,79 7,35 5,53 3,93 7,92 Sunshine Duration ( Hour ) Karaman 4,46 5,85 7,14 8,44 9,84 11,51 12,2 11,47 1,11 7,77 5,95 4,31 8,24 Sunshine Duration ( Hour ) Karapınar 4,18 5,65 6,91 8,25 9,58 11,53 12,22 11,6 1,5 7,6 5,74 3,98 8,11 Konya %5,66, Karapınar %8,12, Karaman %9,88 are more efficiency than Turkey s avarage
 Karapınar 4,18 5,65 6,91 8,25 9,58 11,53 12,22 11,6 1,5 7,6 5,74 3,98 8,11 Konya %5,66, Karapınar %8,12, Karaman %9,88 are more efficiency than Turkey s")

13 Energy Potential of Region MONTHS Global Radiation (kwh/m2-day) Sunshine Duration ( Hour ) Turkey Konya Karaman Karapınar Turkey Konya Karaman Karapınar January 1,79 1,98 2,16 2,6 4,11 4,19 4,46 4,18 February 2,5 2,56 2,69 2,59 5,22 5,51 5,85 5,65 March 3,87 4,23 4,38 4,33 6,27 6,68 7,14 6,91 April 4,93 5,2 5,35 5,25 7,46 8,3 8,44 8,25 May 6,14 6,3 6,45 6,31 9,1 9,46 9,84 9,58 June 6,57 6,78 6,98 6,85 1,81 11,28 11,51 11,53 July 6,5 6,81 6,91 6,8 11,31 11,97 12,2 12,22 August 5,81 6,5 6,15 6,7 1,7 11,35 11,47 11,6 September 4,81 5,12 5,22 5,2 9,23 9,79 1,11 1,5 October 3,46 3,73 3,86 3,8 6,87 7,35 7,77 7,6 November 2,14 2,35 2,52 2,46 5,15 5,53 5,95 5,74 December 1,59 1,77 1,91 1,81 3,75 3,93 4,31 3,98 Average 4,18 4,41 4,55 4, , ,1 3.11, ,47 3.1, 3., 2.9, 2.8, 2.7, 2.6, Annual Average Sunshine Duration ( Hour ) 3.11, , , ,7 Turkey Konya Karaman Karapınar Annual Average Sunshine Duration ( Hour ) Konya %5,66, Karapınar %8,12, Karaman %9,88 are more efficiency than Turkey s avarage


14 Energy Potential of Region
15 kwh (kwh/m2) Energy Potential of Region Paris Case 4., 35., 3., 25., 2., 15., 1., 5., Avarage Monthly Electricity Production 25, 2, 15, 1, 5,, Jan Feb Mar Apr May Jun Jul Aug Sep Oct Nov Dec, Values are taken from PVGIS site. Paris Konya Paris Konya Konya is %49,61 more efficiency than Paris s avarage for Avarage Monthly Electricity Production Konya is %51,45 more efficiency than Paris s avarage for Avarage Monthly Irradiation per square meter

16 kwh Euro Energy Potential of Region Paris Case Annual Elecricity Production and Revenue 35., 35., EUR 3., 3., EUR 25., 25., EUR Konya is %49,61 more efficiency than Paris s Yearly Elecricity Production 2., 2., EUR 15., 1., 5.,, Paris Konya 15., EUR 1., EUR 5., EUR, EUR The Power Plant in Konya is %97,7 more efficiency than Paris s Annual Revenue Yearly Electricity Production (kwh) Annual Revenue (Euro) Paris Konya Month Yearly average Total for year Average daily electricity production Ed (kwh) Average monthly electricity production E m (kwh) Average daily sum of global irradiation per square meter H d (kwh/m2) Average sum of global irradiation per square meter H m (kwh/m2) 58, ,67 3,77 114, , 1.379,5 Month Yearly average Total for year Average daily electricity production E d (kwh) Average monthly electricity production E m (kwh) Average daily sum of global irradiation per square meter H d (kwh/m2) Average sum of global irradiation per square meter H m (kwh/m2) 867, ,67 5,71 173, , 2.87, Annual Revenue 15.63,2 EUR,736 Euro / kwh Annual Revenue 3.749, EUR,97 Euro / kwh Values are taken from PVGIS site. Tariffs taken from CRE site.
 Average monthly electricity production E m (kwh) Average daily sum of global irradiation per square meter H d (kwh/m2) Average sum of global irradiation")
17 kwh (kwh/m2) Energy Potential of Region Berlin Case Avarage Monthly Electricity Production 4., 35., 3., 25., 2., 15., 1., 5.,, Jan Feb Mar Apr May Jun Jul Aug Sep Oct Nov Dec Berlin Konya Berlin Konya 25, 2, 15, 1, 5,, Konya is %81,15 more efficiency than Berlin s avarage for Avarage Monthly Electricity Production Konya is %82,45 more efficiency than Berlin s avarage for Avarage Monthly Irradiation per square meter Values are taken from PVGIS site.


18 kwh Euro Energy Potential of Region Berlin Case Annual Elecricity Production and Revenue 35., 35., EUR 3., 3., EUR 25., 25., EUR 2., 2., EUR Konya is %81,15 more efficiency than Berlin s Yearly Elecricity Production 15., 1., 5.,, Berlin Konya 15., EUR 1., EUR 5., EUR, EUR The Power Plant in Konya is %69,61 more efficiency than Berlin s Annual Revenue Yearly Electricity Production (kwh) Annual Revenue (Euro) Berlin Konya Month Yearly average Total for year Average daily electricity production Ed (kwh) Average monthly electricity production E m (kwh) Average daily sum of global irradiation per square meter H d (kwh/m2) Average sum of global irradiation per square meter H m (kwh/m2) 478, ,5 3,13 95, , 1.144,3 Month Yearly average Total for year Average daily electricity production E d (kwh) Average monthly electricity production E m (kwh) Average daily sum of global irradiation per square meter H d (kwh/m2) Average sum of global irradiation per square meter H m (kwh/m2) 867, ,67 5,71 173, , 2.87, Annual Revenue ,96 EUR,1153 Euro / kwh (Av.,136 E) Monthly %1,48 Decline Annual Revenue 3.749, EUR,97 Euro / kwh Values are taken from PVGIS site. Tariffs taken from Bundesnetzagentur site. _EEG-VergSaetze/DatenMeldgn_EEG-VergSaetze_node.html;jsessionid=5579EEAD6F7DC4B17FF71F2BE586#doc45794bodyText4
 Average monthly electricity production E m (kwh) Average daily sum of global irradiation per square meter H d (kwh/m2) Average sum of global irradiation")
19 kwh (kwh/m2) Energy Potential of Region Malaga Case 4., 35., 3., 25., 2., 15., 1., 5., Avarage Monthly Electricity Production 25, 2, 15, 1, 5,, Jan Feb Mar Apr May Jun Jul Aug Sep Oct Nov Dec, Konya is %1,5 more efficiency than Malaga s avarage for Avarage Monthly Electricity Production Konya is %6,72 more efficiency than Malaga s avarage for Avarage Monthly Irradiation per square meter Values are taken from PVGIS site. Malaga Konya Malaga Konya


20 kwh Euro Energy Potential of Region Malaga Case Annual Elecricity Production and Revenue 32., 45., EUR 28., 4., EUR 24., 35., EUR 2., 3., EUR 16., 25., EUR 2., EUR 12., 15., EUR 8., 1., EUR 4., 5., EUR,, EUR Malaga Konya Konya is %1,5 more efficiency than Malaga s Yearly Elecricity Production The Power Plant in Konya is %2,91 less efficiency than Malaga s Annual Revenue Yearly Electricity Production (kwh) Annual Revenue (Euro) Malaga Konya Month Yearly average Total for year Average daily electricity production Ed (kwh) Average monthly electricity production E m (kwh) Average daily sum of global irradiation per square meter H d (kwh/m2) Average sum of global irradiation per square meter H m (kwh/m2) 788,17 24., 5,35 162, , 1.955, Month Yearly average Total for year Average daily electricity production E d (kwh) Average monthly electricity production E m (kwh) Average daily sum of global irradiation per square meter H d (kwh/m2) Average sum of global irradiation per square meter H m (kwh/m2) 867, ,67 5,71 173, , 2.87, Annual Revenue 38.88, EUR,135 Euro / kwh Annual Revenue 3.749, EUR,97 Euro / kwh Values are taken from PVGIS site. Tariffs taken from El Ministro de Industria, Turismo y Comercio
 Average sum of global irradiation per square meter H m (kwh/m2) 788,17 24., 5,35 162,92 288., 1.")
21 kwh Euro Energy Potential of Region Month PVGIS Average monthly electricity production E m (kwh) MEDAS Power Plant Eelectricity production E m (kwh) Efficiency of Generated to Calculated Annual Revenue of MEDAS Power Plant Jan 17.4, 16.66, -4, ,2 EUR Feb 19.7, 2.8, 5, ,6 EUR Mar 26.4, 27.45, 3, ,65 EUR Apr 27.5, 3.79, 11, ,63 EUR May 3.4, 36.57, 2, ,29 EUR Jun 3.8, 37.9, 23, ,3 EUR Jul 32.9, 4.63, 23, ,11 EUR Aug 33.7, 4.19, 19, ,43 EUR Sep 31.6, 34.85, 1, ,45 EUR Oct 27.6, 31.74, 15, 3.78,78 EUR Nov 22.4, 2.15, -1, ,55 EUR Dec 16.6, 13.62, -17, ,14 EUR Total 317., , 8, ,95 EUR Konya, %8,39 Regarding average monthly energy production Konya s actual value is more efficient than calculated. 35., 3., 25., 2., 15., 1., 5.,, Annual Elecricity Production and Revenue Malaga (Calculated) Konya (Calculated) Berlin (Calculated) Paris (Calculated) Konya (Produced) 4., EUR 35., EUR 3., EUR 25., EUR 2., EUR 15., EUR 1., EUR Yearly Electricity Production (kwh) Annual Revenue (Euro)
22 Energy Potential of Region Total Electricity Cunsumption (MWh) Electricity Compsumption of Turkey Turkey has %6,65 Avarage Annual Electricity compsumption growth 1, 9, 8, 7, 6, 1,4 1,3 8,77 8,13 7,53 6,88 7,12 7,4 7,4 6,58 6,2 2,67 2,54 2,6 2,49 2,45 2,65 2,92 2,33 2,53 2,5 2,33 22,88 22,54 22,8 23,75 24,9 23,51 24,44 24,95 24,7 23,79 23,28 1,56 11,52 12,92 14,24 14,16 14,92 14,76 15,95 16,12 16,4 16,33 5, 4, 3, 49,4 49,3 49,17 47,82 47,55 47,57 46,22 44,92 46,11 47,28 47,35 2, 1,, 4,45 4,7 3,74 3,58 4,23 4,47 4,53 4,46 4,13 3,91 4, State Offices Consumption (MWh) Industrial Consumption ( MWh) Commercial Comsuption (MWh) Residental Comsupmtion (MWh) Agricultural irrigation (MWh) Loss or Leak or Other Compsumptions
23 , 9, 8, 7, 6, 5, Energy Potential of Region 14,37 15,64 26,3 Total Electricity Cunsumption (MWh) ,19 11,95 13,45 11,59 17,14 16,81 6,75 6,54 Electricity Compsumption of Konya 8,32 7,9 6,8 7,46 4,9 4,64 4,35 3,67 19,6 7,47 13,89 15,9 15,85 7,62 8,31 16,87 15,52 17,4 2,61 8,77 1,39 Konya has %13,9 Avarage Annual Electricity compsumption growth 13,24 18,19 21,42 1,1 11,2 13,17 3,88 15,73 11,85 18,3 13,8 4, 1,6 3, 2, 31,96 55,5 55,51 51,6 55,6 54,5 47,8 43,45 49,75 45,1 39,51 1,, 1,68 1,1 2,11 2,15 2,37 3,81 4,51 5,67 5,5 2,86 3, State Offices Consumption (MWh) Industrial Consumption ( MWh) Commercial Comsuption (MWh) Residental Comsupmtion (MWh) Agricultural irrigation (MWh) Loss or Leak or Other Compsumptions
24 Energy Potential of Region Total Electricity Cunsumption (MWh) Electricity Compsumption of Karaman Karaman has %9,4 Avarage Annual Electricity compsumption growth 1, 9, 12,9 23,44 6,58 1,79 14,44 6,28 4,93 5,65 1,2 15,7 12,83 8, 7, 25,92 13,9 29,42 25,88 25,28 28,74 3,84 27,18 23,81 12,18 18,2 6, 5, 4, 22,43 5,57 21,76 2,53 19,8 7,71 6,33 9,75 19,16 8,2 18,46 18,75 6,66 6,97 19,87 2,9 7,15 11,38 19,9 12,55 19,5 9,61 3, 2, 29,77 3,6 31,39 3,78 29,31 33,99 33,8 34,76 32,63 38,7 37,63 1,, 3,41 3,39 5,74 2,99 3,79 5,87 5,43 5,38 2,6 2,41 2, State Offices Consumption (MWh) Industrial Consumption ( MWh) Commercial Comsuption (MWh) Residental Comsupmtion (MWh) Agricultural irrigation (MWh) Loss or Leak or Other Compsumptions
25 % Energy Potential of Region 3,5 3, 2,5 2, Ratio of Electricity Cunsumption to Turkey 1,5 1,,5, Konya Karaman TR52 Konya has a 2,77% annual average in Turkey's electricity consumption Karaman has a,27% annual average in Turkey's electricity consumption

26 Number % Energy Investments in Region Total Applications for Licensed Solar Energy 6 12, 5 1, 4 8, 3 6, 2 4, 1 2, Konya Karaman TR-52 Turkey Number Percentage 24,19 15,73 39,92 1,, For the number of Licensed Applications Konya-Karaman is % 39,92
27 % MW Energy Investments in Region Total Applications for Licensed Solar Energy 9 1, 75 8, , 4, 2, Konya Karaman TR-52 Turkey Installed Capacity Percentage 2,79 12,55 33,34 1,, For the installed capacity of Licensed Applications Konya-Karaman is % 33,34; For the Allowed Licensed Capacity Konya-Karaman is % 21,66; ( 13 MW / 6 MW )


28 Energy Investments in Region Unlicensed Applications 6 UNLICENSED APPLICATIONS BY STATUS Turkey Konya Karaman 32 TR52 Other Approved Applications Denied Applications Evaluating Applications
29 Energy Investments in Region 1% 8% 6% 4% 2% % 1% 8% 6% 4% 2% % Unlicensed Applications Applications of Unlicensed Energy,April ,16 3,8 23,4 85,62 1,37 13,1 39,67 9,6 5,72 Total Application Approved Application Evaluating Application %74,8 %79,32 %4,25 %1,49 %2,95 %19,19 Konya Karaman Türkiye (Others) Applications of Unlicensed Energy,November 214 %24,38 %14,13 %61,48 %92,67 %2,91 %4,42 Total Applications Approved Applications Denied Applications Evaluating Applications Konya Karaman Turkey (Other)
30 Energy Investments in Region 1% 9% 8% 7% 6% 8,8% 51,43% Unlicensed Applications by Regions Unlicensed Applications 26,21% 47,42% 5% 4% 58,25% 5,71% 3% 2% 4,49% 46,87% 1% % 15,53% Konya Karaman Turkey (Other) Approved Applications Denied Applications Evaluating Applications
31 Number Energy Investments in Region Unlicensed Applications April 214 November 214 Türkiye (Other) Karaman Konya Konya Karaman Türkiye (Other) Percentage of Improvement 4846 Unlicensed Applications Unlicensed Applications, November ,8% 2,95% Unlicensed Applications, April ,4% 4,25% Konya Karaman Türkiye Turkey Avarage Türkiye (Other) Karaman Konya % 73,16% %3,8 Konya Karaman Türkiye
32 Number Energy Investments in Region April November 214 Türkiye (Other) Karaman Konya Turkey Avarage Approved Applications Konya Karaman Türkiye (Other) Percentage of Improvement 145 Unlicensed Applications November 214 Others 79% April 214 Konya 19% Karaman 2% 13,1% 1,37% Türkiye (Other) 127 Karaman Konya % 85,62% Konya Karaman Others
33 Number Energy Investments in Region Evaluating Applications April November 214 Türkiye (Other) Karaman Konya Unlicensed Applications November 214 Konya 4% Karaman 3% Others 93% Konya Karaman Türkiye (Other) Percentage of Improvement April 214 Turkey Avarage 236 Türkiye (Other) Karaman % 51% -71Konya % 9% Konya Karaman Others
34 Number Energy Investments in Region Denied Applications April November 214 Türkiye (Other) Karaman 12 Konya 522 Konya Karaman Türkiye (Other) Unlicensed Applications November 214 Others 24% Karaman 14% April 214 % Konya 62% 1% Konya Karaman Others
35 Number % Energy Investments in Region Approved Applications for Unlicensed Solar Energy 14 8,% Konya Karaman TR52 Others Number Percentage 23,99% 1,82% 25,81% 74,19% 6,% 4,% 2,%,% Number Percentage For the number of Unlicensed Applications Konya-Karaman is % 25,81
36 Installed Capacity (MW) % Energy Investments in Region Approved Applications for Unlicensed Solar Energy Konya Karaman TR52 Others Capacity (kw) Percentage 28,72% 2,4% 3,76% 69,24% 8,% 6,% 4,% 2,%,% Capacity (kw) Percentage For the installed capacity of Approved Unlicensed Applications Konya-Karaman is % 3,76

37 MW Energy Investments in Region 8 7 Konya-Karaman Unlicensed Application Capacity (MW) Konya-Karaman Unlicensed PS Capacities 14; 21% Konya Capacity 8 TM MW Karaman Capacity 4 TM - 19 MW TEİAŞ, ; 79%
38 Energy Investments in Region KONYA-1 License Bid, TEİAŞ, ALİBEY GES SBD ENERJİ ÜRETİM VE TİC. LTD. ŞTİ. Yönlendirilen TM: ALİBEYHÖYÜĞÜ TM 5 MW TL/MW ME-SE GES ME-SE ENERJİ YATIRIM İNŞ. TUR. TİC. LTD. ŞTİ. (AKFEN) Yönlendirilen TM: LADİK TM 9.9 MW TL/MW ALİBEYHÖYÜĞÜ GES ZORLU ENERJİ ELEKTRİK ÜRETİM A.Ş. Yönlendirilen TM: ALİBEYHÖYÜĞÜ TM 18 MW TL/MW APA GES LE GÜNEŞ ELEKTRİK ÜRETİM A.Ş. (LİMAK) Yönlendirilen TM: ALİBEYHÖYÜĞÜ TM 13.1 MW TL/MW
39 Energy Investments in Region KONYA-1 License Bid, TEİAŞ, IŞIKLAR GES HASEN ENERJİ ÜRETİM VE TİC. LTD. ŞTİ. Yönlendirilen TM: EREĞLİ TM 6 MW TL/MW YAYSUN GES YAYSUN ELEKTRİK İNŞAAT ENERJİ TURİZM TARIM HAYV.SAN.TİC.LTD.ŞTİ.(EREĞLİ) Yönlendirilen TM: EREĞLİ TM 9.98 MW TL/MW MT GES MT DOĞAL ENERJİ ÜRETİM A.Ş. Yönlendirilen TM: EREĞLİ TM 9.98 MW TL/MW AFTA GES AFTA ENERJİ ÜRETİM SAN. VE TİC. A.Ş. (KONYA) Yönlendirilen TM: KARAPINAR TM 9,8 MW TL/MW GİTAŞ-1 GES AAB ENERJİ ÜRETİM TAR. ÜR. GI. İNŞ. SAN. TİC. LTD.ŞTİ. (KONYA) Yönlendirilen TM: KARAPINAR TM 8 MW TL/MW
40 Energy Investments in Region Karapınar Energy Industry Zone Total Area m² ( 5971 ha) 3.5 MW Installed Power Capacity ( 1 MW = 1,7 ha) 2 MW Energy Infrastructure ( Karapınar TM ) - There are 55 firms which have constracted measurement station for 6 licensed solar power plant application company / person has applied for unlicensed solar power plants. - Totally 9 firm has applied for 88 MW licensed or unlicensed solar power capacity at KARAPINAR Energy Industry Zone
41 Energy Investments in Region Council of ministers decision Karapınar Energy Industry Zone Transfer of Land to Investors Removing attribute of pasture Infrastructure Studies Transfer of land to the Ministry of Industry Parcelization Studies Geological Studies
42 PV Panel and Components Trade of Turkey Solar Industry $3.. $25.. $2.. $15.. $1.. $5.. $ -$5.. -$1.. -$15.. -$2.. -$25.. -$ Import Value ($) Export Value ($) Trade Balance ($) Import Annual Growth (%) 51,25 26,31-11,61 152,49 3,78 18, 16, 14, 12, 1, 8, 6, 4, 2,, -2, Total Import $ Import Average Growth %49,84 Total Export $ Export Average Growth %76,99
43 Solar Industry 4, 35, 3, 25, 2, 15, 1, 5,, Top 5 Exporter Countries to Turkey, 29 37, 23,61 15,23 14,86 4,89 4,41 China Germany USA Others India Spain 3, 25, 2, 15, 1, 5,, Top 5 Exporter Countries to Turkey, 21 24,57 24,19 15,86 15,71 11,6 8,6 China Greece Taiwan Germany Others USA 35, 3, 25, 2, 15, 1, 5,, 7, 6, 5, 4, 3, 2, 1,, Top 5 Exporter Countries to Turkey, ,98 28,57 21,87 8,74 5,83 3,1 China Taiwan Germany Others USA India Top 5 Exporter Countries to Turkey,213 62,85 16,41 8,16 5,42 4,1 3,6 China Germany Others Taiwan South Korea Italy 6, 5, 4, 3, 2, 1,, 8, 6, 4, 2,, Top 5 Exporter Countries to Turkey,212 53,65 17,34 1,14 9,82 4,62 4,43 China Germany Taiwan Others USA Japan Top 5 Exporter Countries to Turkey,214 68,96 15,7 6,62 5,84 3,33,18 China Singapore Malaysia Germany Others Italy
44 Solar Industry Years Number of Panel Capacity (KW) Price for 25 W ($) Price per Watt ($) Price per Watt (Euro) ,66 1, ,95 2, ,32 1, ,88, ,87, ,95,69 TOTAL ,21,87 For China Price per Watt,62 Euro For Germany Price per Watt,84 Euro
45 Contact Specialist of Energy Mücahit Yasir KINALI Electric-Electronic Engineer Konya Investment Support Office Tel : Medrese Mahallesi Ulaşbaba Caddesi No:28 Selçuklu/KONYA Türkiye 426 Karaman Investment Support Office karamanydo@mevka.org.tr Tel : İmaret Mahallesi Atatürk Bulvarı No:2 Merkez/KARAMAN Türkiye 71
AT&T Global Network Client for Windows Product Support Matrix January 29, 2015
 AT&T Global Network Client for Windows Product Support Matrix January 29, 2015 Product Support Matrix Following is the Product Support Matrix for the AT&T Global Network Client. See the AT&T Global Network
Where we are? Konya is the largest city in Turkey with 38.873 km 2 area. Comes 7th in Turkey with 2.100.000 population. (2,7% of Turkey s Population)
") Where we are? Konya is the largest city in Turkey with 38.873 km 2 area. Comes 7th in Turkey with 2.100.000 population. (2,7% of Turkey s Population) Who we are? Mevlana Development Agency is a regional
Where we are? Konya is the largest city in Turkey with 38.873 km 2 area. Comes 7th in Turkey with 2.100.000 population. (2,7% of Turkey s Population) Who we are? Mevlana Development Agency is a regional
COMPARISON OF FIXED & VARIABLE RATES (25 YEARS) CHARTERED BANK ADMINISTERED INTEREST RATES - PRIME BUSINESS*
 CHARTERED BANK ADMINISTERED INTEREST RATES - PRIME BUSINESS*") COMPARISON OF FIXED & VARIABLE RATES (25 YEARS) 2 Fixed Rates Variable Rates FIXED RATES OF THE PAST 25 YEARS AVERAGE RESIDENTIAL MORTGAGE LENDING RATE - 5 YEAR* (Per cent) Year Jan Feb Mar Apr May Jun
COMPARISON OF FIXED & VARIABLE RATES (25 YEARS) 2 Fixed Rates Variable Rates FIXED RATES OF THE PAST 25 YEARS AVERAGE RESIDENTIAL MORTGAGE LENDING RATE - 5 YEAR* (Per cent) Year Jan Feb Mar Apr May Jun
ADB s Rooftop Solar Project. Aiming Zhou Senior Energy Specialist 15-19 June 2015 10 th Asia Clean Energy Forum
 ADB s Rooftop Solar Project Aiming Zhou Senior Energy Specialist 15-19 June 2015 10 th Asia Clean Energy Forum 1. Project Summary 2 3 4 5 6 7 8 9 10 11 12 13 14 15 16 17 18 19 20 21 22 23 24 25 26 >27
Analysis One Code Desc. Transaction Amount. Fiscal Period
 Analysis One Code Desc Transaction Amount Fiscal Period 57.63 Oct-12 12.13 Oct-12-38.90 Oct-12-773.00 Oct-12-800.00 Oct-12-187.00 Oct-12-82.00 Oct-12-82.00 Oct-12-110.00 Oct-12-1115.25 Oct-12-71.00 Oct-12-41.00
Case 2:08-cv-02463-ABC-E Document 1-4 Filed 04/15/2008 Page 1 of 138. Exhibit 8
 Case 2:08-cv-02463-ABC-E Document 1-4 Filed 04/15/2008 Page 1 of 138 Exhibit 8 Case 2:08-cv-02463-ABC-E Document 1-4 Filed 04/15/2008 Page 2 of 138 Domain Name: CELLULARVERISON.COM Updated Date: 12-dec-2007
Perspectives on Global Competitiveness in Solar Energy at the U.S Department of Energy
 Perspectives on Global Competitiveness in Solar Energy at the U.S Department of Energy 1 Minimum Take-Aways from This Talk Q: How do you pronounce photovoltaic? A: fō-tō-vōlt-a-ic Q: Why is Germany leading
Enhanced Vessel Traffic Management System Booking Slots Available and Vessels Booked per Day From 12-JAN-2016 To 30-JUN-2017
 From -JAN- To -JUN- -JAN- VIRP Page Period Period Period -JAN- 8 -JAN- 8 9 -JAN- 8 8 -JAN- -JAN- -JAN- 8-JAN- 9-JAN- -JAN- -JAN- -JAN- -JAN- -JAN- -JAN- -JAN- -JAN- 8-JAN- 9-JAN- -JAN- -JAN- -FEB- : days
welcome! Turkish Renewable Energy Market Rome 29 th April 2015 Levent Çelepçi
 welcome! Turkish Renewable Energy Market Rome 29 th April 2015 Levent Çelepçi Turkish Map 65,000,000,000 Dollars Current Deficit Overview Turkish Electricity Market-Growth Potential Turkey s importance
Status of Renewable Energy in Liberia
 Status of Renewable Energy in Liberia Augustus V. Goanue Principal Officer Prototype Rural and Renewable Energy Agency of Liberia Email: gusgoanue@yahoo.com Mobile: +231 655 9266 Presentation Outline Background
Renewable Energy Solutions
 Renewable Energy Solutions About Us Mission, Vision and Management Approach Business Segments Energy Solar Power Plants (SPP) Hydroelectric Power Plant (HPP) Wind Power Plant (WPP) EPC (Engineering, Procurement
www.tte.com.tr 3 RE ELEKTRİK ENERJİSİ YATIRIMLARI A.Ş.
 www.tte.com.tr 3 RE ELEKTRİK ENERJİSİ YATIRIMLARI A.Ş. JUNE 2013 ABOUT US BRIEFLY 3 RE ABOUT US 3 RE ELEKTRİK ENERJİSİ YATIRIMLARI A.Ş. IS ESTABLISHED IN ORDER TO PROVIDE CONSULTANCY SERVICES IN PROJECT
The Renewable Energy Sector in Cyprus
 Energie The Renewable Energy Sector in Cyprus Dr. Isabelle Riesenkampff, German Energy Agency (dena) Cologne, 29 November 2010 Conference Solar Industry in the Republic of Cyprus Outline: The Renewable
150 Watts. Solar Panel. one square meter. Watts
 Tool USE WITH Energy Fundamentals Activity land art generator initiative powered by art! 150 Watts 1,000 Watts Solar Panel one square meter 600 Watts SECTION 1 ENERGY EFFICIENCY 250 Watts 1,000 Watts hits
Ashley Institute of Training Schedule of VET Tuition Fees 2015
 Ashley Institute of Training Schedule of VET Fees Year of Study Group ID:DECE15G1 Total Course Fees $ 12,000 29-Aug- 17-Oct- 50 14-Sep- 0.167 blended various $2,000 CHC02 Best practice 24-Oct- 12-Dec-
Presenter: Bruce Clay Clay Energy Fiji
 IRENA - Renewable Energy Applications for Island Tourism: The Business Case for PV Systems - Fiji Presenter: Bruce Clay Clay Energy Fiji Page01 The Pacific Page02 Off-Grid Island RE Power 01/ PV/Diesel
Turkish Energy Market & Coal Investments. Ibrahim Ciftci, Greenpeace Mediterranean 15.03.2014, NY
 Turkish Energy Market & Coal Investments Ibrahim Ciftci, Greenpeace Mediterranean 15.03.2014, NY Outline Turkey Energy Sector Outlook Privatization of Electricity Market Official Energy Vision Future of
Photovoltaic and Solar Thermal in Germany Status quo and Outlook
 Photovoltaic and Solar Thermal in Germany Status quo and Outlook Bangalore, 14 November 2011 Dr. Matthias Eichelbrönner This presentation was supported by Mr. Chrometzka, German Solar Industry Association
The Central Role of Energy Efficiency in the Energy Outlook and EIA s Energy Data Program
 The Central Role of Energy Efficiency in the Energy Outlook and EIA s Energy Data Program For MIT Energy Initiative Symposium May 12, 2014 Cambridge, MA By Howard Gruenspecht, Deputy Administrator U.S.
U.S. Concentrating Solar Power
 U.S. Concentrating Solar Power World Bank October 29, 2009 Chuck Kutscher National Renewable Energy Laboratory CSP: The Other Solar Energy Parabolic trough Linear Fresnel Power tower Dish-Stirling Parabolic
Distributed Solar Power Generation in Turkey and its Impact on Utilities Business Models
 Distributed Solar Power Generation in Turkey and its Impact on Utilities Business Models Hannes Beushausen, Senior Consultant Istanbul, April 9, 2014 So far, utilities have delivered power to customers
POLICY FEEDING RENEWABLE. How the Energy Bill might affect green electricity suppliers and also renewable generators
 FEEDING RENEWABLE POLICY How the Energy Bill might affect green electricity suppliers and also renewable generators Holly Tomlinson Regulation and Compliance Analyst for Ecotricity 18 th January 2013 Contents
EMERGING MARKET CURRENCY PAIRS CURRENCY GUIDE
 EMERGING MARKET CURRENCY PAIRS CURRENCY GUIDE /MXN /Mexico 14.597/12.548 168.8 14.5500 14.2500 13.9500 13.7000 13.4000 13.1000 12.7767 JAN 9 FEB 28 APR 21 JUN 11 JUL 30 SEP 18 NOV 7 12.5500 The /MXN is
Photovoltaik und globale Energieversorgung
 11/05/2011 EKZ Elektrizitätswerke des Kantons Zürich 1 Photovoltaik und globale Energieversorgung Arnulf Jäger-Waldau European Commission, DG JRC, Ispra Institute for Energy Renewable Energies Disclaimer
Hawai i s PV Challenge/Opportunity
 Hawai i s PV Challenge/Opportunity UWIG Solar Integration Workshop Lahaina, Maui October 11, 2011 Mark Duda President, PO Box 37070 Honolulu HI, 96837 www.hsea.org mark@dephawaii.com Hawai i Market Drivers
ENERGY SUPPLY ANALYSIS Pucioasa city, Dambovita County
 ENERGY SUPPLY ANALYSIS Pucioasa city, Dambovita County -Abstract of Romanian version- CONTENT 1. National Legislation on the energy supply 2. Description of the involved end-users 3. Description of the
COMPARISON OF ELECTRICITY GENERATION COST OF NPP WITH ALTERNATES IN PAKISTAN
 COMPARISON OF ELECTRICITY GENERATION COST OF NPP WITH ALTERNATES IN PAKISTAN IAEA INPRO dialogue forum 8 toward nuclear energy system sustainability: economics, resource availability and institutional
2015 U.S. ETHANOL EXPORTS AND IMPORTS STATISTICAL SUMMARY
 2015 U.S. ETHANOL EXPORTS AND IMPORTS STATISTICAL SUMMARY Copyright 2016 Renewable Fuels Association. All Rights Reserved Million Gallons Million Gallons 2015 U.S. ETHANOL EXPORTS U.S. Ethanol Exports,
Turkish Arab Economic Forum June 29, 2012. Mehmet Şimşek. Minister of Finance
 Turkish Arab Economic Forum June 29, 2012 Mehmet Şimşek Minister of Finance 1 Outline Turkey: Short Term Outlook Managing a Soft Landing Fallout from the Euro Crisis Turkey & MENA REBALANCING Growing ON
October 2013 - Bottled Water Exports and Imports continue to grow!
 October 13 - Bottled Water Exports and Imports continue to grow! Annualised exports for the year to October 13 continue an upwards climb following their break through NZD1m last month. Leading markets
Solar PV and Project Financing
 Solar PV and Project Financing Global Workshop on Grid Connected Renewable Energy USEA / USAid Washington, DC September 1 st 2009 January 2009 1 The Company Solarpack is a Solar Photovoltaic developer
CENTERPOINT ENERGY TEXARKANA SERVICE AREA GAS SUPPLY RATE (GSR) JULY 2015. Small Commercial Service (SCS-1) GSR
 JULY 2015. Small Commercial Service (SCS-1) GSR") JULY 2015 Area (RS-1) GSR GSR (LCS-1) Texarkana Incorporated July-15 $0.50690/Ccf $0.45450/Ccf $0.00000/Ccf $2.85090/MMBtu $17.52070/MMBtu Texarkana Unincorporated July-15 $0.56370/Ccf $0.26110/Ccf $1.66900/Ccf
JULY 2015 Area (RS-1) GSR GSR (LCS-1) Texarkana Incorporated July-15 $0.50690/Ccf $0.45450/Ccf $0.00000/Ccf $2.85090/MMBtu $17.52070/MMBtu Texarkana Unincorporated July-15 $0.56370/Ccf $0.26110/Ccf $1.66900/Ccf
The Situation of Photovoltaics in Hungary
 The Situation of Photovoltaics in Hungary Miklos Palfy Solart-System PV global production PV installations 1460 MWp PV in 2005 Yearly growing rate >40% Largest market = EU Topics Radiation energy History
Full Length Research Article
 International Journal of Information Research and Review, October 2014 sz International Journal of Information Research and Review Vol. 1, Issue, 10, pp. 113-117, October, 2014 Full Length Research Article
Review of Canadian Apple Market & Trends
 Review of Canadian Apple Market & Trends 215 Mid-Summer Meeting- Canadian Apple Industry Wolfville, NS August 4 th, 215 Farid Makki Sector Development & Analysis Directorate Agriculture and Agri-Food Canada
Prospects of the Renewable Energy in Egypt
 Prospects of the Renewable Energy in Egypt AbdelRahman Shawky Elsadawy Project Manager at OnaSolar S.A.E October 9, 2014 Tunis, Tunisia OnaSolar S.A.E OnaSolar is a solar integrator that provides a turnkey
Regulation by the Feed-in Tariff: Experiences from Germany
 Solar Power International 08 Panel Technology & Regulation: How to do it Right 16th October 2008, San Diego, California, USA Regulation by the Feed-in Tariff: Experiences from Germany Gerhard Stryi-Hipp
Photovoltaic in Mexico Recent Developments and Future
 Photovoltaic in Mexico Recent Developments and Future Rodolfo Martínez Strevel Berlin, Germany May 23th, 2013 Bufete de Tecnología Solar, S.A. (BUTECSA) Production of Primary Energy in Mexico, 2011 % 7,0
An Overview of Offshore RMB Market. Nov 2013
 An Overview of Offshore RMB Market Nov 2013 Contents 1. Outlook of RMB Internationalisation 2. Implications for Offshore RMB Bonds 2 Section 1 Outlook of RMB Internationalisation 3 RMB The next international
Yield Reduction due to Shading:
 1x4 1x16 10 x CBC Energy A/S x Danfoss Solar Inverters CBC-40W Poly 40 W TLX 1,5k 5 ; 1x11 3x4 0 1,5kW 1536 x CBC Energy A/S 1 x Power-One CBC-40W Poly 40 W TRIO-7,6-TL-OUTD 30 ; 4x14 0 7,6kW Location:
Shade Analysis & Inspection Protocol www.energycenter.org
 Pacific Power California Solar Incentive Program Shade Analysis & Inspection Protocol Agenda Conducting a Shade Analysis Process Tools Methodology Determining Tilt and Azimuth Field Inspection Overview
Consumer ID Theft Total Costs
 Billions Consumer and Business Identity Theft Statistics Business identity (ID) theft is a growing crime and is a growing concern for state filing offices. Similar to consumer ID theft, after initially
STENSEA. Stored Energy in Sea. The Feasibility of an Underwater Pumped Hydro Storage System. Dr. Andreas Garg Christoph Lay Robert Füllmann
 STENSEA Stored Energy in Sea The Feasibility of an Underwater Pumped Hydro Storage System Presentation IRES, 12 November 2012 Dr. Andreas Garg Christoph Lay Robert Füllmann 1 Market Status Quo and Forecasts
WIND AND SOLAR ENERGY DEVELOPMENTS IN IRAN
 WIND AND SOLAR ENERGY DEVELOPMENTS IN IRAN H. Kazemi Karegar a,b, A.Zahedi a,v. Ohis a, G. taleghani b and M. Khalaji b a Department of Electrical & Computer Systems Engineering, PO Box 35, Monash University,
PRELIMINARY STEEL IMPORTS INCREASE 17% IN JANUARY Import Market Share 32% in January
 News Release FOR IMMEDIATE RELEASE February 25, 2015 CONTACT: Lisa Harrison 202.452.7115/ lharrison@steel.org PRELIMINARY STEEL IMPORTS INCREASE 17% IN JANUARY Import Market Share 32% in January Washington,
Course CME 310 Solar Power For Africa. NGOs and SITUATION OF ELECTRICITY IN RWANDA
 Course CME 310 Solar Power For Africa NGOs and SITUATION OF ELECTRICITY IN RWANDA BY Dr Schadrack Nsengiyumva Rhodes University Physics Department Grahamstown South Africa RWANDA Capital (and largest
Commercial Outlook for Solar Power Generation
 Commercial Outlook for Solar Power Generation International Conference on Alternative Energy 2010 March 27, 2010 Karachi Expo Center Nadeem Haque Nadeem Haque Energy Potential Inc. Topics 1. Market Scenario
Update on the Latest Developments of the Madrid System Madrid Working Group Roundtable
 Update on the Latest Developments of the Madrid System Madrid Working Group Roundtable Asta Valdimarsdottir Director Operations Division Madrid Registry Geneva Ocotber 23, 2014 Main points 2013 2014 Figures
ABENGOA SOLAR Solar Power for a Sustainable World
 ASES National Solar Conference Phoenix, May 20 th 2010 Kate Maracas 1 Abengoa Solar corporate overview 2 Business philosophy Index 3 Solar technologies and accomplishments 4 A little about Solana 2 About
TEACHING SUSTAINABLE ENERGY SYSTEMS A CASE STUDY
 M. Brito 1,3, K. Lobato 2,3, P. Nunes 2,3, F. Serra 2,3 1 Instituto Dom Luiz, University of Lisbon (PORTUGAL) 2 SESUL Sustainable Energy Systems at University of Lisbon (PORTUGAL) 3 FCUL, University of
Gross/Active PV Surface Area: 13.094,40 / 13.086,29 m². Energy Produced by PV Array (AC):
:") 1x17 1x17 1x 8 x Trina Solar Trina TSM-PC5A 6 6 W 5 ; x Danfoss Solar Inverters TLX 1,5k 1,5kW Location: Arrondissement d'issoire Climate Data Record: Arrondissement d'issoire PV Output:.8, kwp Gross/Active
1x17 1x17 1x 8 x Trina Solar Trina TSM-PC5A 6 6 W 5 ; x Danfoss Solar Inverters TLX 1,5k 1,5kW Location: Arrondissement d'issoire Climate Data Record: Arrondissement d'issoire PV Output:.8, kwp Gross/Active
Yukon Government Solar Energy Pilot: Performance Monitoring Yukon Government s Energy Solutions Centre. February 2014
 Yukon Government Solar Energy Pilot: Performance Monitoring Yukon Government s Energy Solutions Centre February 2014 Contents 1. Project Overview... 3 2. System Specifications... 3 2.1. Yukon Government
CHP Plant based on a Hybrid Biomass and Solar System of the Next Generation EU project No. ENER/FP7/249800/"SUNSTORE 4" Dipl.-Ing. Alfred Hammerschmid
 CHP Plant based on a Hybrid Biomass and Solar System of the Next Generation EU project No. ENER/FP7/249800/"SUNSTORE 4" Dipl.-Ing. Alfred Hammerschmid BIOS BIOENERGIESYSTEME GmbH, Austria TEL.: +43 (316)
Developing solar in emerging markets
 Developing solar in emerging markets Swedbank Conference March 17, 2016 Our values Predictable Driving results Change makers Working together Disclaimer The following presentation is being made only to,
Outline. Solar Energy II. Solar Power II March 10, 2009. ME 496ALT Alternative Energy 1. Alternative Energy
 Solar Energy II Larry Caretto Mechanical Engineering 496ALT Alternative Energy Outline Review last week Concentrating solar power Passive solar Photovoltaics March 10, 2009 2 Optimum Fixed Collector Tilt
Jeff Haby, P.E. Director Sewer System Improvements. September 15, 2015. Agenda
 SAWS Sanitary Sewer Overflow Reduction Program Jeff Haby, P.E. Director Sewer System Improvements SA Military Engineers Meeting Agenda SAWS Overview Consent Decree CD Compliance Programs Program Transition
PV POTENTIAL IN HUNGARY. Miklós Pálfy SOLART-SYSTEM Ltd.
 PV POTENTIAL IN HUNGARY Miklós Pálfy Solar radiation in Hungary until 1965 7 6 5 kwh/m 2 day 4 3 2 1 0 jan. feb. márc. ápr. máj. jun. jul. aug. szept. okt. nov. dec. Békéscsaba Budapest Debrecen Kalocsa
Renewable Energy market in Egypt
 Renewable Energy market in Egypt By : Hesham Enan June 10 th 2015 1 Agenda Energy Mix in Egypt Electricity Authority and Electricity Tariffs RE Strategy & Policies Hydro Power Solar Energy & Wind Energy
3 rd Party Solar Sales April 2012
 3 rd Party Solar Sales April 2012 About SolarCity The Leading Solar Service Provider in the U.S. More than 30,000 projects completed or underway Serving thousands of markets nationwide AZ, CA, CO, DC,
4th Basic Plan Targets of Renewable Energy Deployment
 Yeonji Kim 4th Basic Plan Targets of Renewable Energy Deployment Changes in 2035 RE Share Target ratio of waste has decreased largely PV Generation Capacity Target : 17.5GW by 2035 Expected Share of RE
NYC Solar Workshop NYSERDA s Programs
 NYC Solar Workshop NYSERDA s Programs Con Edison: The Learning Center Auditorium 4382 Vernon Blvd. Long Island City, NY 11101 April 14, 2014 Peter Savio Frank Mace Where is NY Clean Energy Policy Headed?
PV Farms Solar Electric Power for Wholesale Distribution
 PV Farms Solar Electric Power for Wholesale Distribution UC ENERGY WEEK 2010 California Solar Energy Workshop UC Davis Energy Institute Davis, California Larry Asera Chairman/CEO Asera Group, Inc. May
CAFIS REPORT 2015.10
 CAFIS REPORT 2015.10 INDEX Message CAFIS Inbound 03-06 07-08 CAFIS Arch 09-10 CAFIS Brain 11-12 CAFIS Global 13-14 What We Do 15-16 About CAFIS 17-18 Services for Member Stores 19-34 Services for Card
FLEXIBLE FUEL USE IN RENEWABLE THERMAL SYSTEMS - OPPORTUNITIES AND COSTS
 FLEXIBLE FUEL USE IN RENEWABLE THERMAL SYSTEMS - OPPORTUNITIES AND COSTS Monica Havskjold, Erik Trømborg (presenting author), Torjus Folsland Bolkesjø og Åsa Grytli Tveten RERC Session Renewable Energy
Detailed guidance for employers
 April 2015 3 Detailed guidance for employers Appendix A: Pay reference periods This document accompanies: Detailed guidance no. 3 Assessing the workforce Pay reference period calendars where the definition
Deutsche Global Infrastructure Fund (TOLLX)
") Global Infrastructure Fund (TOLLX) A step beyond MLPs Important risk information Any fund that concentrates in a particular segment of the market will generally be more volatile than a fund that invests
Global Infrastructure Fund (TOLLX) A step beyond MLPs Important risk information Any fund that concentrates in a particular segment of the market will generally be more volatile than a fund that invests
2010 AIRLINE HULL & LIABILITY INSURANCE MARKET REVIEW MARCH 2011
 2010 AIRLINE HULL & LIABILITY INSURANCE MARKET REVIEW MARCH 2011 Algeria - Brazil - Colombia - Dubai - Germany - India - Japan - Korea - Malaysia - Mexico - Romania - Singapore - Sweden - Switzerland -
Renewable Energy Financing point view
 Renewable Energy Financing point view 16 May 2013 Prepared by: Samar Obaid Partner TAS Presentation Agenda 1. Energy Leaders 2. MENA Cleantech Trends 3. How to Establish an RE Project 4. Investment Risks
TRENDS 2015 IN PHOTOVOLTAIC APPLICATIONS EXECUTIVE SUMMARY
 TRENDS 2015 IN PHOTOVOLTAIC APPLICATIONS EXECUTIVE SUMMARY Report IEA-PVPS T1-27:2015 FOREWORD.... The IEA PVPS Programme is proud to provide you with its 20 th edition of the international survey report
Assessing Sources of Funding for Insurance Risk Based Capital
 Assessing Sources of Funding for Insurance Risk Based Capital Louis Lee Session Number: (ex. MBR4) AGENDA for Today 1. Motivations of Capital Needs 2. Practical Risk Based Capital Funding Options 3. Types
SEMI Microelectronic Manufacturing Supply Chain Quarterly Market Data - CYQ1 2016 www.semi.org/marketinfo
 SEMI Microelectronic Manufacturing Supply Chain Quarterly Market Data - CYQ1 2016 www.semi.org/marketinfo March 2016 Economic Trends Weakening Currency, especially Yen & Euro, dampened 2015 industry figures
Volume 11: January December 2014
 BIST TRENDS REPORT By TUYID TURKISH INVESTOR RELATIONS SOCIETY & MKK CENTRAL REGISTRY AGENCY Volume 11: January December 2014 January 15, 2015 1 / 21 January 28, 2015 Dear Readers, We proudly present Volume
Newfoundland and Labrador Hydro Electricity Rates
 Newfoundland and Hydro Electricity Rates The following charts and descriptions outline: 1) residential rates by area 2) general service rates information including basic customer charges, energy charges,
Accident & Emergency Department Clinical Quality Indicators
 Overview This dashboard presents our performance in the new A&E clinical quality indicators. These 8 indicators will allow you to see the quality of care being delivered by our A&E department, and reflect
2016 Examina on dates
 Please note the following informa on: The following exams are available throughout the year: Please click on the exam for which you wish to see the dates. When you have finished, you can select to return
Jon Buschke 3059 Austin Ave Simi Valley, CA 93063 (805) 813-1647 jbuschke@hotmail.com
 813-1647 jbuschke@hotmail.com") PDF Raw Data < B Na ec Solar Lease Quote Prepared For: Jon Buschke 3059 Austin Ave Simi Valley, CA 93063 (805) 813-1647 jbuschke@hotmail.com Prepared By: Michael Garcia Solarology 2524 Townsgate rd unit
PDF Raw Data < B Na ec Solar Lease Quote Prepared For: Jon Buschke 3059 Austin Ave Simi Valley, CA 93063 (805) 813-1647 jbuschke@hotmail.com Prepared By: Michael Garcia Solarology 2524 Townsgate rd unit
Current and expected contribution of RES-E in NA countries
 Arab Republic of Egypt Ministry of Electricity & Energy New & Renewable Energy Authority (NREA) Current and expected contribution of RES-E in NA countries Ehab Ismail Ameen General Manager of Planning
2015 Examination dates
 Please note the following information: The following exams are available throughout the year: BULATS Paper-based: Please click on the exam for which you wish to see the dates. When you have finished, you
Solar Power: Photovoltaic Systems for a Variety of Applications. Christian Hinsch Director Corporate Communications juwi Holding AG
 Solar Power: Photovoltaic Systems for a Variety of Applications Christian Hinsch Director Corporate Communications juwi Holding AG Contents 1. We make it happen 1.1 Our Vision & Our Services 1.2 juwi at
Dividends Tax: Summary of withholding tax rates per South African Double Taxation Agreements currently in force Version: 2 Updated: 2012-05-22
 Dividends Tax: Summary of withholding tax rates per South African Double Taxation Agreements currently in force Version: 2 Updated: 2012-05-22 Note: A summary of the rates and the relevant provisions relating
Oil Price and Korean Economy
 Oil Price and Korean Economy April 17, 2015 Jaerang Lee - Contents - I. Oil Price Outlook II. Effects on Korean Economy III. Conclusion I. Oil Price Outlook Oil prices have lowered to around mid 50 dollars
Your guide to electricity pricing in Ontario
 Your guide to electricity pricing in Ontario A guide designed to help you understand and decipher the components of your electricity bill for your Ontario-based commercial or manufacturing business. -
Working Holiday Maker visa programme report
 Working Holiday Maker visa programme report 30 June 2015 This page is left blank intentionally. Table of Contents About this report 1 Enquiries 1 Definition of terms 2 Background to the Working Holiday
Opportunities and Challenges
 Current International Perspectives on Smart Grid Developments in Mexico in Light of Energy Reforms Opportunities and Challenges Presented to: Austin Electricity Conference UT Executive Education and Conference
Electric Market National Overview
 Electric Market Overview Electric Market National Overview 1122 Electric Market Overview: Generation Output and Temperatures Page 2 of 8 Weekly U.S. Electric Generation Output and Temperatures Electric
Energy Savings from Business Energy Feedback
 Energy Savings from Business Energy Feedback Behavior, Energy, and Climate Change Conference 2015 October 21, 2015 Jim Stewart, Ph.D. INTRODUCTION 2 Study Background Xcel Energy runs the Business Energy
February 23, 2016. Paul Helstrom Minnesota Power Renewable Program Lead. Stacy Miller Minnesota Department of Commerce Solar Policy Specialist
 February 23, 2016 Paul Helstrom Minnesota Power Renewable Program Lead Stacy Miller Minnesota Department of Commerce Solar Policy Specialist Agenda Overview of Solar Energy Markets in the US Overview
For millennia people have known about the sun s energy potential, using it in passive
 Introduction For millennia people have known about the sun s energy potential, using it in passive applications like heating homes and drying laundry. In the last century and a half, however, it was discovered
A Spotlight on. Cem Ali ATILGAN Atılgan Energy Ltd. June 3-4, 2009 - Budapest
 A Spotlight on Turkish Electricity market by Cem Ali ATILGAN Atılgan Energy Ltd. June 3-4, 2009 - Budapest Outline Section 1 : Brief Turkish Electricity Market Overview Turkey at a Glance Comparison of
Effects of PV Electricity Generation on Wholesale Power Prices Summary 2012 and January 2013
 Effects of PV Electricity Generation on Wholesale Power Prices Summary 2012 and January 2013 3 Embarcadero Center, Suite 2360 San Francisco, CA 94111 USA tel: 415.692.7730 research@renewableanalytics.com
ENERGY SAVINGS FROM SOLAR HEATED WATER IN BULGARIA
 ENERGY SAVINGS FROM SOLAR HEATED WATER IN BULGARIA R. Todorova National Institute of Meteorology and Hydrology Blvd.Tzarigradsko shousee 66 Email: Radostina.Todorova@meteo.bg Abstract At the present work
NATIONAL CREDIT UNION SHARE INSURANCE FUND
 NATIONAL CREDIT UNION SHARE INSURANCE FUND PRELIMINARY & UNAUDITED FINANCIAL HIGHLIGHTS RENDELL L. JONES CHIEF FINANCIAL OFFICER MANAGEMENT OVERVIEW Balance Sheet Other - Insurance and Guarantee Program
Best Timing for Year-end Sales Season!
 GUIDE TO EXHIBIT Best Timing for Year-end Sales Season! Dates September 8(Mon) 3(Wed), 5 Venue Organiser Sunshine City Convention Center (Ikebukuro, Tokyo) Reed Exhibitions Japan Ltd. www.ijt.jp/en/autumn/
Bijlagen. Bijlage F. Slagschaduw
 Bijlagen Bijlage F. Slagschaduw 53 SHADOW - Main Result Calculation: Enercon E92 Assumptions for shadow calculations Maximum distance for influence Calculate only when more than 20 % of sun is covered
First estimate for 2014 Euro area international trade in goods surplus 194.8 bn 24.2 bn surplus for EU28
 30/2015-16 February 2015 First estimate for 2014 Euro area international trade in goods surplus 194.8 bn 24.2 bn surplus for EU28 The first estimate for the euro area 1 (EA18) trade in goods balance with
Working Holiday Maker visa programme report. 31 December 2014
 Working Holiday Maker visa programme report 31 December 2014 Contents Page About this report 1 Enquiries 1 Definition of terms 2 Background to the Working Holiday Maker programme 3 Recent developments
1. Introduction. 2. User Instructions. 2.1 Set-up
 1. Introduction The Lead Generation Plan & Budget Template allows the user to quickly generate a Lead Generation Plan and Budget. Up to 10 Lead Generation Categories, typically email, telemarketing, advertising,
Mustafa Karahan, Ahmet Toker APLUS Energy Investment Technology Consultancy. New markets on the European south-east energy corridor
 Mustafa Karahan, Energy Traders Association Ahmet Toker APLUS Energy Investment Technology Consultancy New markets on the European south-east energy corridor Turkish Energy Sector History Turkish Electrcity
Small Business Credit Guarantee Corporation Thailand. Miss Yanee Ruamragsa
 Workshop on SME Credit Guarantee Systems in Asia-Pacific Region ( June 16 18 2010, Hangzhou, P.R. China ) Small Business Credit Guarantee Corporation Thailand Miss Yanee Ruamragsa Mr. Siripong i Pansanit