Visually driven analysis of movement data by progressive clustering
|
|
|
- Willis Hopkins
- 7 years ago
- Views:
Transcription
1 Visually driven analysis of movement data by progressive clustering Salvatore Rinzivillo, Dino Pedreschi, Mirco Nanni, Fosca Giannotti, Natalia Andrienko, Gennady Andrienko Information Visualization 2008 Eric Shook
2 Outline Introduction Density-based clustering method (OPTICS) Visualizing Cluster Trajectories Progressive Clustering Methods Case study Car trajectories in Milan Summary Conclusions

3 Movement data examples Andrienko, G. and Andrienko, N. Interactive spatio temporal cluster analysis of VAST challenge 2008 datasets. SIGKDD 2009.
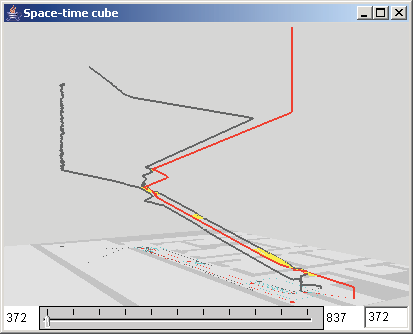
4 Space-time cubes
5 Motivation Recent interest, because of availability of large amounts of movement or trajectory data GPS RFID Clustering is a good approach to explore and analyze large trajectory data sets Visual and interactive techniques play a key role in this analysis and exploration Combine clustering and visual techniques
6 Quick review: Clustering methods Partition-based K-means K-mediod Self-Organizing Map (SOM) Dendrogram (Tree-like representation) Top-down Bottom-up Density-based OPTICS
7 OPTICS algorithm Density-based clustering algorithm DBSCAN family Robust to noise and outliers desirable trait when analyzing trajectory data Covered by Dr. Yu in previous lectures Has core, reachable, and noise objects
8 High-level Definitions Core object Reachable object If the number of objects, N, within search radius (Eps) is greater than MinNbs from a given point then that point is a core point A point that is within search radius (Eps) distance to a core point, but not a core point Noise object A point that is not a core or reachable point
9 Example Eps: A distance threshold or maximum search radius If MinPts=3 then point is a core point If MinPts=5 then point is not a core point Core distance: Distance to its 3rd neighbor if MinPts=3 Reachable point: Point inside Eps radius
10 OPTICS algorithm pseudo-code OPTICS (SetOfTrajectories, Eps, MinNbs, Distance_function) for each t in SetOfTrajectories do if (not t.isprocessed()) then neighbors := Distance.neighbors(t, Eps) t.setprocessed(true); t.setreachabilitydistance(infinity); t.setcoredistance(neighbors, Eps, MinNbs); emit(t); if (t.getcoredistance() < Infinity) then // This is a core point Expand the cluster PriorityQueue.updateOrAddAll(Neighbors); while (not PriorityQueue.isEmpty()) t1 = PriorityQueue.pop(); t1_neighbors = Distance.neighbors(t1, Eps) t1.setprocessed(true) t1.setcoredistance(t1_neighbors, Eps, MinNbs) emit(t1); if (t1.getcoredistance() < Infinity) then // This is a core point PriorityQueue.updateOrAddAll(t1_neighbors); end while end if end if end for
11 OPTICS algorithm pseudo-code for each in SetOfTrajectories For eachtunprocessed point do if (not t.isprocessed()) then get neighboring points (closer than Eps) neighbors := Distance.neighbors(t, Eps) t.setprocessed(true); mark point as processed t.setreachabilitydistance(infinity); not currently a reachable point t.setcoredistance(neighbors, Eps, MinNbs); see if a core point (coredistance) emit(t);... end if end for
12 OPTICS algorithm pseudo-code If if (t.getcoredistance() a core point < Infinity) then PriorityQueue.updateOrAddAll(Neighbors); Add all neighbors to priority queue While(not priority queue has points while PriorityQueue.isEmpty()) Get a point t1 = PriorityQueue.pop(); Get the points neighbors t1_neighbors = Distance.neighbors(t1, Eps) t1.setprocessed(true) Mark point as processed t1.setcoredistance(t1_neighbors, Eps, MinNbs) See if point is a core point (coredistance) emit(t1); If point is a core point if (t1.getcoredistance() < Infinity) then PriorityQueue.updateOrAddAll(t1_neighbors); Add all point's neighbors to priority queue end while end if
13 Reachability plot in relation to clusters Clusters represented as valleys OPTICS algorithm generates a distance for each point that can be plotted in a reachability plot
14 Case study Car trajectory data
15 Data for analysis Using a subset of a larger dataset consisting of: GPS-tracked cars: 17,241 Trajectories: 6187 Date: Wednesday, 4/4/2007 Time: 6:00 am to 10:00 am Location: Milan, Italy Complete data set contains 176,000 trajectories
16 Trajectories data Spatio-temporal data x,y + time {id, (x1,y1,t1), (x2,y2,t2), } Most clustering methods experience difficulty handling poly-lines (trajectories) Convert trajectory? to be analyzed by clustering methods Two primary approaches for clustering trajectories Feature-based Direct geometric models *
17 Clustering trajectory data? OPTICS algorithm takes a distance function to compute a relative distance between two objects (or trajectories) We discuss several distance functions
18 Simple distance functions Common source Common destination Distance between start points of trajectory Distance between end points of trajectory Common source and destination Average distance between source and destinations
19 Distance functions k-points Defines the number of intermediate points to check when comparing two paths Time steps Defines the desired temporal distance between check points Generally these only work for perfect data Equal time intervals Minor positioning error
20 Distance functions Route similarity Tolerate incomplete trajectories Repeatedly search for the closest pair of positions in the two trajectories Compute mean distance between these positions Subtract penalty distance for unmatched positions Computationally expensive Route similarity + dynamics Account for relative times of arriving in corresponding positions Temporal distance to some reference time moment Andrienko G, Andrienko N, Wrobel S. Visual analytics tools for analysis of movement data. ACM SIGKDD Explorations 2007
21 Visualizing clustered trajectories
22 Visualizing a cluster of trajectories Single trajectory Cluster of trajectories (each trajectory at 30% opacity) Summarized representation of the cluster (thicker lines represent more shared trajectories)
23 Shared trajectories Summarized representation does not work for arbitrary movement data Hard to make sense of the data
24 Dynamic aggregator Compute aggregate attributes for all members in the aggregator Member count, minimum, maximum, average, median, etc. Responds to interactive filtering mechanisms Two types of aggregators Summation places Aggregate moves
25 Aggregator Summation places An area in space that is 'aware' of all trajectories that pass through it Record positions and times entering and exiting the area for each trajectory
26 Aggregator Aggregate moves A B Two areas (A & B) that are 'aware' of all trajectories that go directly from A to B without passing another area Record member count, statistical summaries, lengths of fragments, durations, and speeds A C B
27 Finding areas for aggregators Important to find interesting areas for aggregators that contain many trajectories Method for finding some interesting areas Extract start, end, stop, and turn points Parameter: Minimum duration of a stop Parameter: Minimum angle of turn Build circles around concentration of points Parameter: Minimum circle area Parameter: Maximum circle area
28 Automated method Automated method used to find summation places Aggregation of trajectories using summation places
29 Comparing methods Semantically defined significant places Automated method for finding interesting places
30 Improving the understanding of clusters of trajectories Further work is needed to automatically find interesting areas for these methods to work sufficiently well Therefore other methods are also used Interactive filtering Visualize aggregate attributes Progressive clustering
31 Interactive filtering
32 Interactive filters Temporal filter Spatial filter Select a 'window' of space Attribute filter Select a time interval Select by attributes such as length and speed Cluster filter Selection of clusters
33 Results of interactive filters Aggregate moves Only clusters with >=15 members
34 Visualize non trajectory attributes
35 Visualize aggregate attributes Yellow Start Blue End Places from automated method Grid cells
36 Progressive clustering
37 Progressive clustering example The data set contains the trajectories for people primarily driving to work. Goal: Find the major areas where people drive to work. Problem: Density of data set is not uniform causing problems for OPTICS density-based algorithm Solution: Progressive clustering is a practical approach to analyzing unevenly dense data
38 Progressive clustering steps Pick a large minimum number of neighbors (MinNbs) Play with parameter values until a few easy to distinguish clusters appear Examine, describe, and explain clusters Remove the objects in these clusters from analysis Continue analysis with a smaller number of minimum neighbors (MinNbs) Repeat until analysis is sufficiently complete
39 First clustering Route Destination Large clusters Destination function Eps=500m MinNbs= , 893, 354 trajectories
40 Second clustering Smaller clusters (large clusters removed) Destination function Eps=500m MinNbs= trajectories
41 Third clustering Smallest clusters (larger clusters removed) Destination function Eps=500m MinNbs= trajectories
42 Results of progressive clustering on destination locations Large clusters Eps=500m MinNbs= , 893, 354 trajectories Smaller clusters (large clusters removed) Eps=500m MinNbs= trajectories Smallest clusters (larger clusters removed) Eps=500m MinNbs= trajectories
43 Analyzing the largest (red) cluster Select largest cluster out of the previous analysis step and apply further analysis Cluster routes based on 'route similarity' Most routes are short and in the center 517 short routes (29% of cluster) Eps=1000m MinNbs=5
44 Analyzing the largest (red) cluster Without short routes Cluster routes based on 'route similarity' Very few clusters Cluster sizes range from 11 to 28 Few routes are distance routes Remaining 63% trajectories are noise * Other 2 large clusters generate similar results
45 Second example: source and destination Apply source + destination function to cluster trajectories in entire dataset 2% (127 trajectories) significantly different start/end 23% (1439 trajectories) starts close to ends 75% (4621 trajectories) noise (gray) Includes roundtrips Eps=800m MinNbs=8
46 Long distance routes Remove short and roundtrip routes Apply 'route similarity' to remaining routes Peripheral routes Inward routes Outward routes
47 Long distance routes 41 clusters 66-5 trajectories per cluster Inward routes are larger and more numerous than outward routes Authors note that different cluster functions bring similar results
48 Summary of findings No destinations are significantly more popular than other destinations Most trips are short local trips Most trajectories follow unique routes Many peripheral routes that do not enter city and follow belt around the city Inward trips are more frequent than outward trips, since the morning traffic
49 Progressive clustering + simple distance functions Progressive clustering with simple distance functions Only apply computationally intensive functions to small areas of interest User understands the steps created for each result Its possible to combine distance functions into a comprehensive function to address heterogeneous attributes Computational limitations may make this approach infeasible User will have a difficult time making sense of the clusters and the results of the analysis
50 Future work Re-clustering Automatically search a range of parameters 500<=Eps<=1000 and 5<=MinNbs<=10 Return the set of results for the user to review Automatic quality assessment Automate a process to evaluate a large number of possibilities Use quality measure such as average density or cohesion Applying to trajectory data is an open problem
51 Conclusions Trajectories are complex spatiotemporal constructs and are difficult to analyze Progressive clustering with visualization and interaction techniques are a suitable approach to explore and analyze the data Combine several functions iteratively helps users better understand the data Allows the user to control the amount of computation to apply to each step
52 Thank you Questions?
Visually driven analysis of movement data by progressive clustering
 Visually driven analysis of movement data by progressive clustering Salvatore Rinzivillo* Dino Pedreschi Mirco Nanni Fosca Giannotti KDD Lab, University of Pisa {rinziv,pedre}@di.unipi.it Natalia Andrienko
The STC for Event Analysis: Scalability Issues
 The STC for Event Analysis: Scalability Issues Georg Fuchs Gennady Andrienko http://geoanalytics.net Events Something [significant] happened somewhere, sometime Analysis goal and domain dependent, e.g.
Space-Time Cube in Visual Analytics
 Gennady Andrienko Natalia Andrienko /and in cooperation with P.Gatalsky, G.Fuchs, K.Vrotsou, I.Peca, C.Tominski, H.Schumann inspired by T.Hagerstrand, M-J Kraak, M-P Kwan and others 1 A bit of STC history
Scalable Cluster Analysis of Spatial Events
 International Workshop on Visual Analytics (2012) K. Matkovic and G. Santucci (Editors) Scalable Cluster Analysis of Spatial Events I. Peca 1, G. Fuchs 1, K. Vrotsou 1,2, N. Andrienko 1 & G. Andrienko
Cluster Analysis: Advanced Concepts
 Cluster Analysis: Advanced Concepts and dalgorithms Dr. Hui Xiong Rutgers University Introduction to Data Mining 08/06/2006 1 Introduction to Data Mining 08/06/2006 1 Outline Prototype-based Fuzzy c-means
Clustering. Data Mining. Abraham Otero. Data Mining. Agenda
 Clustering 1/46 Agenda Introduction Distance K-nearest neighbors Hierarchical clustering Quick reference 2/46 1 Introduction It seems logical that in a new situation we should act in a similar way as in
Data Mining. Cluster Analysis: Advanced Concepts and Algorithms
 Data Mining Cluster Analysis: Advanced Concepts and Algorithms Tan,Steinbach, Kumar Introduction to Data Mining 4/18/2004 1 More Clustering Methods Prototype-based clustering Density-based clustering Graph-based
An Analysis on Density Based Clustering of Multi Dimensional Spatial Data
 An Analysis on Density Based Clustering of Multi Dimensional Spatial Data K. Mumtaz 1 Assistant Professor, Department of MCA Vivekanandha Institute of Information and Management Studies, Tiruchengode,
Constructing Semantic Interpretation of Routine and Anomalous Mobility Behaviors from Big Data
 Constructing Semantic Interpretation of Routine and Anomalous Mobility Behaviors from Big Data Georg Fuchs 1,3, Hendrik Stange 1, Dirk Hecker 1, Natalia Andrienko 1,2,3, Gennady Andrienko 1,2,3 1 Fraunhofer
Spatio-Temporal Clustering: a Survey
 Spatio-Temporal Clustering: a Survey Slava Kisilevich, Florian Mansmann, Mirco Nanni, Salvatore Rinzivillo Abstract Spatio-temporal clustering is a process of grouping objects based on their spatial and
DATA MINING CLUSTER ANALYSIS: BASIC CONCEPTS
 DATA MINING CLUSTER ANALYSIS: BASIC CONCEPTS 1 AND ALGORITHMS Chiara Renso KDD-LAB ISTI- CNR, Pisa, Italy WHAT IS CLUSTER ANALYSIS? Finding groups of objects such that the objects in a group will be similar
Use of mobile phone data to estimate mobility flows. Measuring urban population and inter-city mobility using big data in an integrated approach
 Use of mobile phone data to estimate mobility flows. Measuring urban population and inter-city mobility using big data in an integrated approach Barbara Furletti, Lorenzo Gabrielli, Giuseppe Garofalo,
CAB TRAVEL TIME PREDICTI - BASED ON HISTORICAL TRIP OBSERVATION
 CAB TRAVEL TIME PREDICTI - BASED ON HISTORICAL TRIP OBSERVATION N PROBLEM DEFINITION Opportunity New Booking - Time of Arrival Shortest Route (Distance/Time) Taxi-Passenger Demand Distribution Value Accurate
Forschungskolleg Data Analytics Methods and Techniques
 Forschungskolleg Data Analytics Methods and Techniques Martin Hahmann, Gunnar Schröder, Phillip Grosse Prof. Dr.-Ing. Wolfgang Lehner Why do we need it? We are drowning in data, but starving for knowledge!
Data Mining Cluster Analysis: Basic Concepts and Algorithms. Lecture Notes for Chapter 8. Introduction to Data Mining
 Data Mining Cluster Analsis: Basic Concepts and Algorithms Lecture Notes for Chapter 8 Introduction to Data Mining b Tan, Steinbach, Kumar Tan,Steinbach, Kumar Introduction to Data Mining /8/ What is Cluster
Public Transportation BigData Clustering
 Public Transportation BigData Clustering Preliminary Communication Tomislav Galba J.J. Strossmayer University of Osijek Faculty of Electrical Engineering Cara Hadriana 10b, 31000 Osijek, Croatia tomislav.galba@etfos.hr
Clustering. Adrian Groza. Department of Computer Science Technical University of Cluj-Napoca
 Clustering Adrian Groza Department of Computer Science Technical University of Cluj-Napoca Outline 1 Cluster Analysis What is Datamining? Cluster Analysis 2 K-means 3 Hierarchical Clustering What is Datamining?
Discovering Trajectory Outliers between Regions of Interest
 Discovering Trajectory Outliers between Regions of Interest Vitor Cunha Fontes 1, Lucas Andre de Alencar 1, Chiara Renso 2, Vania Bogorny 1 1 Dep. de Informática e Estatística Universidade Federal de Santa
Real-time Processing and Visualization of Massive Air-Traffic Data in Digital Landscapes
 Real-time Processing and Visualization of Massive Air-Traffic Data in Digital Landscapes Digital Landscape Architecture 2015, Dessau Stefan Buschmann, Matthias Trapp, and Jürgen Döllner Hasso-Plattner-Institut,
Data Mining Clustering (2) Sheets are based on the those provided by Tan, Steinbach, and Kumar. Introduction to Data Mining
 Sheets are based on the those provided by Tan, Steinbach, and Kumar. Introduction to Data Mining") Data Mining Clustering (2) Toon Calders Sheets are based on the those provided by Tan, Steinbach, and Kumar. Introduction to Data Mining Outline Partitional Clustering Distance-based K-means, K-medoids,
Data Mining Clustering (2) Toon Calders Sheets are based on the those provided by Tan, Steinbach, and Kumar. Introduction to Data Mining Outline Partitional Clustering Distance-based K-means, K-medoids,
Clustering Data Streams
 Clustering Data Streams Mohamed Elasmar Prashant Thiruvengadachari Javier Salinas Martin gtg091e@mail.gatech.edu tprashant@gmail.com javisal1@gatech.edu Introduction: Data mining is the science of extracting
Data Mining Cluster Analysis: Advanced Concepts and Algorithms. Lecture Notes for Chapter 9. Introduction to Data Mining
 Data Mining Cluster Analysis: Advanced Concepts and Algorithms Lecture Notes for Chapter 9 Introduction to Data Mining by Tan, Steinbach, Kumar Tan,Steinbach, Kumar Introduction to Data Mining 4/18/2004
Data Mining Cluster Analysis: Basic Concepts and Algorithms. Lecture Notes for Chapter 8. Introduction to Data Mining
 Data Mining Cluster Analysis: Basic Concepts and Algorithms Lecture Notes for Chapter 8 Introduction to Data Mining by Tan, Steinbach, Kumar Tan,Steinbach, Kumar Introduction to Data Mining 4/8/2004 Hierarchical
Linköpings Universitet - ITN TNM033 2011-11-30 DBSCAN. A Density-Based Spatial Clustering of Application with Noise
 DBSCAN A Density-Based Spatial Clustering of Application with Noise Henrik Bäcklund (henba892), Anders Hedblom (andh893), Niklas Neijman (nikne866) 1 1. Introduction Today data is received automatically
How To Understand The History Of Navigation In French Marine Science
 E-navigation, from sensors to ship behaviour analysis Laurent ETIENNE, Loïc SALMON French Naval Academy Research Institute Geographic Information Systems Group laurent.etienne@ecole-navale.fr loic.salmon@ecole-navale.fr
Advanced Methods for Pedestrian and Bicyclist Sensing
 Advanced Methods for Pedestrian and Bicyclist Sensing Yinhai Wang PacTrans STAR Lab University of Washington Email: yinhai@uw.edu Tel: 1-206-616-2696 For Exchange with University of Nevada Reno Sept. 25,
Content Delivery Network (CDN) and P2P Model
 and P2P Model") A multi-agent algorithm to improve content management in CDN networks Agostino Forestiero, forestiero@icar.cnr.it Carlo Mastroianni, mastroianni@icar.cnr.it ICAR-CNR Institute for High Performance Computing
A multi-agent algorithm to improve content management in CDN networks Agostino Forestiero, forestiero@icar.cnr.it Carlo Mastroianni, mastroianni@icar.cnr.it ICAR-CNR Institute for High Performance Computing
Data Mining Cluster Analysis: Basic Concepts and Algorithms. Clustering Algorithms. Lecture Notes for Chapter 8. Introduction to Data Mining
 Data Mining Cluster Analsis: Basic Concepts and Algorithms Lecture Notes for Chapter 8 Introduction to Data Mining b Tan, Steinbach, Kumar Clustering Algorithms K-means and its variants Hierarchical clustering
Visual Analytics Tools for Analysis of Movement Data
 Visual Analytics Tools for Analysis of Movement Data Gennady Andrienko 1 Natalia Andrienko 1 Stefan Wrobel 1,2 1 Fraunhofer Institute for Intelligent Analysis and Information Systems IAIS Schloss Birlinghoven
Data Mining Cluster Analysis: Basic Concepts and Algorithms. Lecture Notes for Chapter 8. Introduction to Data Mining
 Data Mining Cluster Analysis: Basic Concepts and Algorithms Lecture Notes for Chapter 8 by Tan, Steinbach, Kumar 1 What is Cluster Analysis? Finding groups of objects such that the objects in a group will
A comparison of various clustering methods and algorithms in data mining
 Volume :2, Issue :5, 32-36 May 2015 www.allsubjectjournal.com e-issn: 2349-4182 p-issn: 2349-5979 Impact Factor: 3.762 R.Tamilselvi B.Sivasakthi R.Kavitha Assistant Professor A comparison of various clustering
Clustering UE 141 Spring 2013
 Clustering UE 141 Spring 013 Jing Gao SUNY Buffalo 1 Definition of Clustering Finding groups of obects such that the obects in a group will be similar (or related) to one another and different from (or
CONTENTS. List of Contributors Preface Acknowledgments. mobility data modeling and representation
 CONTENTS List of Contributors Preface Acknowledgments page xi xv xix part i mobility data modeling and representation 1 Trajectories and Their Representations 3 S. Spaccapietra, C. Parent, L. Spinsanti
Data Mining Cluster Analysis: Advanced Concepts and Algorithms. Lecture Notes for Chapter 9. Introduction to Data Mining
 Data Mining Cluster Analysis: Advanced Concepts and Algorithms Lecture Notes for Chapter 9 Introduction to Data Mining by Tan, Steinbach, Kumar Tan,Steinbach, Kumar Introduction to Data Mining 4/18/2004
Mapping Linear Networks Based on Cellular Phone Tracking
 Ronen RYBOWSKI, Aaron BELLER and Yerach DOYTSHER, Israel Key words: Cellular Phones, Cellular Network, Linear Networks, Mapping. ABSTRACT The paper investigates the ability of accurately mapping linear
Similarity Search and Mining in Uncertain Spatial and Spatio Temporal Databases. Andreas Züfle
 Similarity Search and Mining in Uncertain Spatial and Spatio Temporal Databases Andreas Züfle Geo Spatial Data Huge flood of geo spatial data Modern technology New user mentality Great research potential
Clustering & Visualization
 Chapter 5 Clustering & Visualization Clustering in high-dimensional databases is an important problem and there are a number of different clustering paradigms which are applicable to high-dimensional data.
Large data computing using Clustering algorithms based on Hadoop
 Large data computing using Clustering algorithms based on Hadoop Samrudhi Tabhane, Prof. R.A.Fadnavis Dept. Of Information Technology,YCCE, email id: sstabhane@gmail.com Abstract The Hadoop Distributed
Use of mobile phone data to estimate visitors mobility flows
 Use of mobile phone data to estimate visitors mobility flows Lorenzo Gabrielli, Barbara Furletti, Fosca Giannotti, Mirco Nanni, Salvatore Rinzivillo Abstract Big Data originating from the digital breadcrumbs
The Role of Visualization in Effective Data Cleaning
 The Role of Visualization in Effective Data Cleaning Yu Qian Dept. of Computer Science The University of Texas at Dallas Richardson, TX 75083-0688, USA qianyu@student.utdallas.edu Kang Zhang Dept. of Computer
Context-aware taxi demand hotspots prediction
 Int. J. Business Intelligence and Data Mining, Vol. 5, No. 1, 2010 3 Context-aware taxi demand hotspots prediction Han-wen Chang, Yu-chin Tai and Jane Yung-jen Hsu* Department of Computer Science and Information
Comparative Analysis of EM Clustering Algorithm and Density Based Clustering Algorithm Using WEKA tool.
 International Journal of Engineering Research and Development e-issn: 2278-067X, p-issn: 2278-800X, www.ijerd.com Volume 9, Issue 8 (January 2014), PP. 19-24 Comparative Analysis of EM Clustering Algorithm
OPTICS: Ordering Points To Identify the Clustering Structure
 Proc. ACM SIGMOD 99 Int. Conf. on Management of Data, Philadelphia PA, 1999. OPTICS: Ordering Points To Identify the Clustering Structure Mihael Ankerst, Markus M. Breunig, Hans-Peter Kriegel, Jörg Sander
Proposed Application of Data Mining Techniques for Clustering Software Projects
 Proposed Application of Data Mining Techniques for Clustering Software Projects HENRIQUE RIBEIRO REZENDE 1 AHMED ALI ABDALLA ESMIN 2 UFLA - Federal University of Lavras DCC - Department of Computer Science
Unsupervised Data Mining (Clustering)
") Unsupervised Data Mining (Clustering) Javier Béjar KEMLG December 01 Javier Béjar (KEMLG) Unsupervised Data Mining (Clustering) December 01 1 / 51 Introduction Clustering in KDD One of the main tasks in
Unsupervised Data Mining (Clustering) Javier Béjar KEMLG December 01 Javier Béjar (KEMLG) Unsupervised Data Mining (Clustering) December 01 1 / 51 Introduction Clustering in KDD One of the main tasks in
Data Mining and Knowledge Discovery in Databases (KDD) State of the Art. Prof. Dr. T. Nouri Computer Science Department FHNW Switzerland
 State of the Art. Prof. Dr. T. Nouri Computer Science Department FHNW Switzerland") Data Mining and Knowledge Discovery in Databases (KDD) State of the Art Prof. Dr. T. Nouri Computer Science Department FHNW Switzerland 1 Conference overview 1. Overview of KDD and data mining 2. Data
Data Mining and Knowledge Discovery in Databases (KDD) State of the Art Prof. Dr. T. Nouri Computer Science Department FHNW Switzerland 1 Conference overview 1. Overview of KDD and data mining 2. Data
Identifying users profiles from mobile calls habits
 Identifying users profiles from mobile calls habits Barbara Furletti KDDLAB - ISTI CNR Pisa, Italy barbara.furletti@isti.cnr.it Lorenzo Gabrielli KDDLAB- ISTI CNR Pisa, Italy lorenzo.gabrielli@isti.cnr.it
Dr. Shih-Lung Shaw s Research on Space-Time GIS, Human Dynamics and Big Data
 Dr. Shih-Lung Shaw s Research on Space-Time GIS, Human Dynamics and Big Data for Geography Department s Faculty Research Highlight October 12, 2014 Shih-Lung Shaw, Ph.D. Alvin and Sally Beaman Professor
Visual Exploration of Sparse Traffic Trajectory Data
 Visual Exploration of Sparse Traffic Trajectory Data Zuchao Wang, Tangzhi Ye, Min Lu, Xiaoru Yuan, Member, IEEE, Huamin Qu, Member, IEEE, Jacky Yuan and Qianliang Wu Fig. 1. Our sparse traffic trajectory
Geospatial Data Integration Open Service Bus Architecture
 Geospatial Data Integration Open Service Bus Architecture Authors Erel Rosenberg Dieter Schneider Correlation Systems Ltd. Israel 1 Hamlacha St. Or-Yehuda, 60372, Israel Erel@cs.co.il Tel-Aviv University
Comparison and Analysis of Various Clustering Methods in Data mining On Education data set Using the weak tool
 Comparison and Analysis of Various Clustering Metho in Data mining On Education data set Using the weak tool Abstract:- Data mining is used to find the hidden information pattern and relationship between
Data Mining: Foundation, Techniques and Applications
 Data Mining: Foundation, Techniques and Applications Lesson 1b :A Quick Overview of Data Mining Li Cuiping( 李 翠 平 ) School of Information Renmin University of China Anthony Tung( 鄧 锦 浩 ) School of Computing
Clustering methods for Big data analysis
 Clustering methods for Big data analysis Keshav Sanse, Meena Sharma Abstract Today s age is the age of data. Nowadays the data is being produced at a tremendous rate. In order to make use of this large-scale
Medial Axis Construction and Applications in 3D Wireless Sensor Networks
 Medial Axis Construction and Applications in 3D Wireless Sensor Networks Su Xia, Ning Ding, Miao Jin, Hongyi Wu, and Yang Yang Presenter: Hongyi Wu University of Louisiana at Lafayette Outline Introduction
SPATIO-TEMPORAL TRAJECTORY ANALYSIS OF MOBILE OBJECTS FOLLOWING THE SAME ITINERARY
 SPATIO-TEMPORAL TRAJECTORY ANALYSIS OF MOBILE OBJECTS FOLLOWING THE SAME ITINERARY Laurent ETIENNE a, Thomas DEVOGELE a and Alain BOUJU b a French naval academy research institute (IRENAV), CC 600, 29240
Large-Network Travel Time Distribution Estimation, with Application to Ambulance Fleet Management
 Large-Network Travel Time Distribution Estimation, with Application to Ambulance Fleet Management Bradford S. Westgate, Dawn B. Woodard, David S. Matteson, Shane G. Henderson Cornell University June 5,
Visualizing and Understanding Players Behavior in Video Games: Discovering Patterns and Supporting Aggregation and Comparison
 Visualizing and Understanding Players Behavior in Video Games: Discovering Patterns and Supporting Aggregation and Comparison Dinara Moura dinara@sfu.ca Magy Seif el-nasr magy@sfu.ca Christopher D. Shaw
MOBILITY DATA MODELING AND REPRESENTATION
 PART I MOBILITY DATA MODELING AND REPRESENTATION 1 Trajectories and Their Representations Stefano Spaccapietra, Christine Parent, and Laura Spinsanti 1.1 Introduction For a long time, applications have
Big Data and Analytics: Getting Started with ArcGIS. Mike Park Erik Hoel
 Big Data and Analytics: Getting Started with ArcGIS Mike Park Erik Hoel Agenda Overview of big data Distributed computation User experience Data management Big data What is it? Big Data is a loosely defined
Monitoring of Complex Industrial Processes based on Self-Organizing Maps and Watershed Transformations
 Monitoring of Complex Industrial Processes based on Self-Organizing Maps and Watershed Transformations Christian W. Frey 2012 Monitoring of Complex Industrial Processes based on Self-Organizing Maps and
Online Temporal-Spatial Analysis for Detection of Critical Events in Cyber-Physical Systems
 2014 IEEE International Conference on Big Data Online Temporal-Spatial Analysis for Detection of Critical Events in Cyber-Physical Systems Zhang Fu, Magnus Almgren, Olaf Landsiedel, Marina Papatriantafilou
Big Data Analytics in Mobile Environments
 1 Big Data Analytics in Mobile Environments 熊 辉 教 授 罗 格 斯 - 新 泽 西 州 立 大 学 2012-10-2 Rutgers, the State University of New Jersey Why big data: historical view? Productivity versus Complexity (interrelatedness,
Visual Analytics and Data Mining
 Visual Analytics and Data Mining in S-T-applicationsS Gennady Andrienko & Natalia Andrienko Fraunhofer Institute AIS Sankt Augustin Germany http://www.ais.fraunhofer.de/and Mining Spatio-Temporal Data
Distances, Clustering, and Classification. Heatmaps
 Distances, Clustering, and Classification Heatmaps 1 Distance Clustering organizes things that are close into groups What does it mean for two genes to be close? What does it mean for two samples to be
RESEARCH ARTICLE. Interpreting Map Usage Patterns using Geovisual Analytics and Spatio-Temporal Clustering
 International Journal of Digital Earth (preprint) Vol. 00, No. 00, Month 201X, 1 19 RESEARCH ARTICLE Interpreting Map Usage Patterns using Geovisual Analytics and Spatio-Temporal Clustering Gavin McArdle
. Learn the number of classes and the structure of each class using similarity between unlabeled training patterns
 Outline Part 1: of data clustering Non-Supervised Learning and Clustering : Problem formulation cluster analysis : Taxonomies of Clustering Techniques : Data types and Proximity Measures : Difficulties
A Visual Analytics Framework for Spatiotemporal Analysis and Modelling
 A Visual Analytics Framework for Spatiotemporal Analysis and Modelling Natalia Andrienko and Gennady Andrienko Fraunhofer Institute IAIS (Intelligent Analysis and Information Systems), Sankt Augustin,
Analysis of kiva.com Microlending Service! Hoda Eydgahi Julia Ma Andy Bardagjy December 9, 2010 MAS.622j
 Analysis of kiva.com Microlending Service! Hoda Eydgahi Julia Ma Andy Bardagjy December 9, 2010 MAS.622j What is Kiva? An organization that allows people to lend small amounts of money via the Internet
A Comparative Study of clustering algorithms Using weka tools
 A Comparative Study of clustering algorithms Using weka tools Bharat Chaudhari 1, Manan Parikh 2 1,2 MECSE, KITRC KALOL ABSTRACT Data clustering is a process of putting similar data into groups. A clustering
Clustering: Techniques & Applications. Nguyen Sinh Hoa, Nguyen Hung Son. 15 lutego 2006 Clustering 1
 Clustering: Techniques & Applications Nguyen Sinh Hoa, Nguyen Hung Son 15 lutego 2006 Clustering 1 Agenda Introduction Clustering Methods Applications: Outlier Analysis Gene clustering Summary and Conclusions
Information Management course
 Università degli Studi di Milano Master Degree in Computer Science Information Management course Teacher: Alberto Ceselli Lecture 01 : 06/10/2015 Practical informations: Teacher: Alberto Ceselli (alberto.ceselli@unimi.it)
Environmental Remote Sensing GEOG 2021
 Environmental Remote Sensing GEOG 2021 Lecture 4 Image classification 2 Purpose categorising data data abstraction / simplification data interpretation mapping for land cover mapping use land cover class
ARTIFICIAL INTELLIGENCE (CSCU9YE) LECTURE 6: MACHINE LEARNING 2: UNSUPERVISED LEARNING (CLUSTERING)
 LECTURE 6: MACHINE LEARNING 2: UNSUPERVISED LEARNING (CLUSTERING)") ARTIFICIAL INTELLIGENCE (CSCU9YE) LECTURE 6: MACHINE LEARNING 2: UNSUPERVISED LEARNING (CLUSTERING) Gabriela Ochoa http://www.cs.stir.ac.uk/~goc/ OUTLINE Preliminaries Classification and Clustering Applications
ARTIFICIAL INTELLIGENCE (CSCU9YE) LECTURE 6: MACHINE LEARNING 2: UNSUPERVISED LEARNING (CLUSTERING) Gabriela Ochoa http://www.cs.stir.ac.uk/~goc/ OUTLINE Preliminaries Classification and Clustering Applications
PhoCA: An extensible service-oriented tool for Photo Clustering Analysis
 paper:5 PhoCA: An extensible service-oriented tool for Photo Clustering Analysis Yuri A. Lacerda 1,2, Johny M. da Silva 2, Leandro B. Marinho 1, Cláudio de S. Baptista 1 1 Laboratório de Sistemas de Informação
Social Media Mining. Data Mining Essentials
 Introduction Data production rate has been increased dramatically (Big Data) and we are able store much more data than before E.g., purchase data, social media data, mobile phone data Businesses and customers
Using Data Mining for Mobile Communication Clustering and Characterization
 Using Data Mining for Mobile Communication Clustering and Characterization A. Bascacov *, C. Cernazanu ** and M. Marcu ** * Lasting Software, Timisoara, Romania ** Politehnica University of Timisoara/Computer
Spatial Data Analysis
 14 Spatial Data Analysis OVERVIEW This chapter is the first in a set of three dealing with geographic analysis and modeling methods. The chapter begins with a review of the relevant terms, and an outlines
Robust Outlier Detection Technique in Data Mining: A Univariate Approach
 Robust Outlier Detection Technique in Data Mining: A Univariate Approach Singh Vijendra and Pathak Shivani Faculty of Engineering and Technology Mody Institute of Technology and Science Lakshmangarh, Sikar,
Machine Learning and Data Mining. Regression Problem. (adapted from) Prof. Alexander Ihler
 Prof. Alexander Ihler") Machine Learning and Data Mining Regression Problem (adapted from) Prof. Alexander Ihler Overview Regression Problem Definition and define parameters ϴ. Prediction using ϴ as parameters Measure the error
Machine Learning and Data Mining Regression Problem (adapted from) Prof. Alexander Ihler Overview Regression Problem Definition and define parameters ϴ. Prediction using ϴ as parameters Measure the error
Data Mining Cluster Analysis: Basic Concepts and Algorithms. Lecture Notes for Chapter 8. Introduction to Data Mining
 Data Mining Cluster Analsis: Basic Concepts and Algorithms Lecture Notes for Chapter 8 Introduction to Data Mining b Tan, Steinbach, Kumar Tan,Steinbach, Kumar Introduction to Data Mining 4/8/4 What is
SPATIAL DATA CLASSIFICATION AND DATA MINING
 , pp.-40-44. Available online at http://www. bioinfo. in/contents. php?id=42 SPATIAL DATA CLASSIFICATION AND DATA MINING RATHI J.B. * AND PATIL A.D. Department of Computer Science & Engineering, Jawaharlal
LiDAR Point Cloud Processing with
 LiDAR Research Group, Uni Innsbruck LiDAR Point Cloud Processing with SAGA Volker Wichmann Wichmann, V.; Conrad, O.; Jochem, A.: GIS. In: Hamburger Beiträge zur Physischen Geographie und Landschaftsökologie
Mobile phone data for Mobility statistics
 International Conference on Big Data for Official Statistics Organised by UNSD and NBS China Beijing, China, 28-30 October 2014 Mobile phone data for Mobility statistics Emanuele Baldacci Italian National
Available online at www.sciencedirect.com. ScienceDirect. Procedia Computer Science 52 (2015 ) 902 907
 902 907") Available online at www.sciencedirect.com ScienceDirect Procedia Computer Science 52 (2015 ) 902 907 The 4th International Workshop on Agent-based Mobility, Traffic and Transportation Models, Methodologies
Available online at www.sciencedirect.com ScienceDirect Procedia Computer Science 52 (2015 ) 902 907 The 4th International Workshop on Agent-based Mobility, Traffic and Transportation Models, Methodologies
A Distribution-Based Clustering Algorithm for Mining in Large Spatial Databases
 Published in the Proceedings of 14th International Conference on Data Engineering (ICDE 98) A Distribution-Based Clustering Algorithm for Mining in Large Spatial Databases Xiaowei Xu, Martin Ester, Hans-Peter
«VISUALIZATION OF POTENTIAL CUSTOMERS»
 «VISUALIZATION OF POTENTIAL CUSTOMERS» Cubas Saiz, Tinguaro. Pérez Bello, Miguel. Rodríguez Pardo, Guillermo. Team: ETSII ULL Motivations We love to innovate in developing software and this contest gives
Chemotaxis and Migration Tool 2.0
 Chemotaxis and Migration Tool 2.0 Visualization and Data Analysis of Chemotaxis and Migration Processes Chemotaxis and Migration Tool 2.0 is a program for analyzing chemotaxis and migration data. Quick
The Quality of Internet Service: AT&T s Global IP Network Performance Measurements
 The Quality of Internet Service: AT&T s Global IP Network Performance Measurements In today's economy, corporations need to make the most of opportunities made possible by the Internet, while managing
GE-INTERNATIONAL JOURNAL OF ENGINEERING RESEARCH VOLUME -3, ISSUE-6 (June 2015) IF-4.007 ISSN: (2321-1717) EMERGING CLUSTERING TECHNIQUES ON BIG DATA
 IF-4.007 ISSN: (2321-1717) EMERGING CLUSTERING TECHNIQUES ON BIG DATA") EMERGING CLUSTERING TECHNIQUES ON BIG DATA Pooja Batra Nagpal 1, Sarika Chaudhary 2, Preetishree Patnaik 3 1,2,3 Computer Science/Amity University, India ABSTRACT The term "Big Data" defined as enormous
EMERGING CLUSTERING TECHNIQUES ON BIG DATA Pooja Batra Nagpal 1, Sarika Chaudhary 2, Preetishree Patnaik 3 1,2,3 Computer Science/Amity University, India ABSTRACT The term "Big Data" defined as enormous
Recommendations in Mobile Environments. Professor Hui Xiong Rutgers Business School Rutgers University. Rutgers, the State University of New Jersey
 1 Recommendations in Mobile Environments Professor Hui Xiong Rutgers Business School Rutgers University ADMA-2014 Rutgers, the State University of New Jersey Big Data 3 Big Data Application Requirements
ASSOCIATION RULE MINING ON WEB LOGS FOR EXTRACTING INTERESTING PATTERNS THROUGH WEKA TOOL
 International Journal Of Advanced Technology In Engineering And Science Www.Ijates.Com Volume No 03, Special Issue No. 01, February 2015 ISSN (Online): 2348 7550 ASSOCIATION RULE MINING ON WEB LOGS FOR
Clustering. Chapter 7. 7.1 Introduction to Clustering Techniques. 7.1.1 Points, Spaces, and Distances
 240 Chapter 7 Clustering Clustering is the process of examining a collection of points, and grouping the points into clusters according to some distance measure. The goal is that points in the same cluster
Visual Analytics for Understanding Spatial Situations from Episodic Movement Data
 Visual Analytics for Understanding Spatial Situations from Episodic Movement Data Natalia Andrienko, Gennady Andrienko, Hendrik Stange, Thomas Liebig, Dirk Hecker Fraunhofer Institute IAIS (Intelligent
Cluster Analysis: Basic Concepts and Algorithms
 Cluster Analsis: Basic Concepts and Algorithms What does it mean clustering? Applications Tpes of clustering K-means Intuition Algorithm Choosing initial centroids Bisecting K-means Post-processing Strengths
Procedure for Marine Traffic Simulation with AIS Data
 http://www.transnav.eu the International Journal on Marine Navigation and Safety of Sea Transportation Volume 9 Number 1 March 2015 DOI: 10.12716/1001.09.01.07 Procedure for Marine Traffic Simulation with
A PHOTOGRAMMETRIC APPRAOCH FOR AUTOMATIC TRAFFIC ASSESSMENT USING CONVENTIONAL CCTV CAMERA
 A PHOTOGRAMMETRIC APPRAOCH FOR AUTOMATIC TRAFFIC ASSESSMENT USING CONVENTIONAL CCTV CAMERA N. Zarrinpanjeh a, F. Dadrassjavan b, H. Fattahi c * a Islamic Azad University of Qazvin - nzarrin@qiau.ac.ir
Identifying erroneous data using outlier detection techniques
 Identifying erroneous data using outlier detection techniques Wei Zhuang 1, Yunqing Zhang 2 and J. Fred Grassle 2 1 Department of Computer Science, Rutgers, the State University of New Jersey, Piscataway,
Geovisualization of Dynamics, Movement and Change: Key Issues and Developing Approaches in Visualization Research
 Geovisualization of Dynamics, Movement and Change: Key Issues and Developing Approaches in Visualization Research Gennady Andrienko, Natalia Andrienko, Jason Dykes, Sara Irina Fabrikant, Monica Wachowicz
Aggregation of Spatio-temporal and Event Log Databases for Stochastic Characterization of Process Activities
 Aggregation of Spatio-temporal and Event Log Databases for Stochastic Characterization of Process Activities Rodrigo M. T. Gonçalves, Rui Jorge Almeida, João M. C. Sousa Planning and Scheduling In logistic
Location-Based Social Networks: Users
 Chapter 8 Location-Based Social Networks: Users Yu Zheng Abstract In this chapter, we introduce and define the meaning of location-based social network (LBSN) and discuss the research philosophy behind