Technical Analysis for FX Options
|
|
|
- Georgia Riley
- 7 years ago
- Views:
Transcription
1 Technical Analysis for FX Options

2 What is Technical Analysis? Technical analysis, also known as charting, is an attempt to predict future prices, by studying the trading history of a traded security (currencies, equities, commodities, etc.). Technical analysts evaluate securities by analyzing the statistics generated by market activity, such as past prices and volume, and use charts and other tools to identify patterns that can suggest future activity.

3 Using Technical Analysis Technical analysis assumes that, at any given time, the currency s price reflects everything that has or could affect the currency - including fundamental factors, along with broader economic factors and market psychology are all priced in, removing the need to actually consider these factors separately. This only leaves the analysis of price movement, which the chartists view as a product of the supply and demand. Although there are many different methods and tools used in technical analysis, all of them rely on the assumption that price patterns and trends exist in markets, and they can be identified and exploited.

4 Interpretation of Technical Analysis The underlying assumptions of technical analysis can be described in three ways. The market discounts everything. Over a period of time price reflects all information impacting the currency, and its future potential direction. Price tends to trend or form patterns. Most technical trading strategies are based on this assumption. This means that after a trend has been established, the future price movement is more likely to be in the same direction as the trend than to be against it. History tends to repeat itself. Price trends occur and reoccur in patterns that are fairly predictable. The repetitive nature of price movements is attributed to market psychology.

5 Candlestick Charts Candlestick charts are one of the most popular graphical charts. They provide a variety of information about the current market prices, and they are relatively easy to read and understand. Candlestick charts are used by short and long term traders alike, and are used by many different trading systems. There are only two groups of people in the market - buyers and sellers. One can use the candles to figure out which group is in control of the price action.

6 This image shows how candlesticks are constructed. The highs and lows of the time period are called the "wicks" and the open and close form the "body". The candle itself is the "range". When the currency closes at the bottom of the range we conclude that the sellers are in control. When currencies close at the top of the range we conclude that buyers are in control.

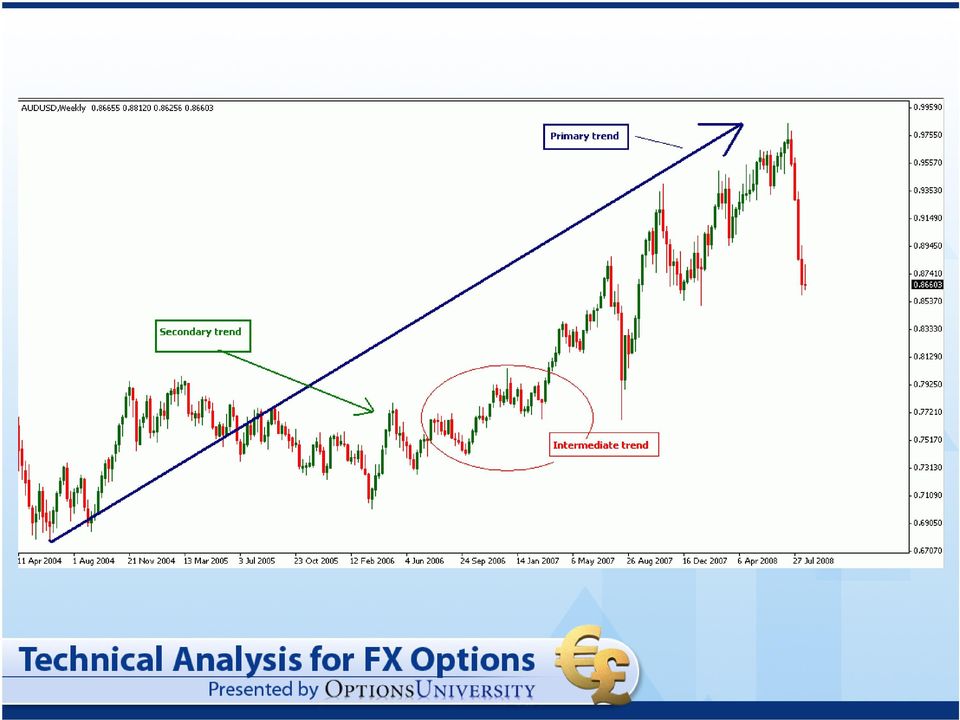
7 Trends In any given chart, one can notice that price does not tend to move in a straight line in any direction, but rather in a series of highs and lows. In technical analysis, it is the movement of these highs and lows that constitute a trend. Trends can also be divided into three separate stages: Primary or major trend. It is the most important trend to investors who want to buy and hold currencies for a longer time Secondary trends are counter trend movements in the direction of the major trend. These counter movements cause price to correct back to a more realistic price value. Once these counter trends are over the primary trend is resumed. Intermediate trends are that part when price swings both, in the direction and against the direction of the primary trend. The intermediate trends are important to investors to spot the best price level to enter the primary trend or to add to their positions. Minor trends. The day to day price fluctuations within these moves are called minor trends. These minor trends are important to day traders who want to exit trade after the end of the day.

8
9 Types of Trends It is important to be able to understand and identify trends so that you can trade with rather than against them. Two important sayings in technical analysis are "the trend is your friend" and "don't buck the trend," which shows how important trend analysis is for technical traders. There are three types of trend Uptrend - when each successive peak and trough of the price movement is higher, it's referred to as an upward trend. Downtrend - If the peaks and troughs are getting lower, it's a downtrend. Sideways/Horizontal trends - When there is little movement up or down in the peaks and troughs, it's a sideways or horizontal trend. One can say that a sideways trend is actually not a trend on its own, but a lack of a well-defined trend in either direction.

10 Trend Lines A trend line is a simple charting technique that adds a line to a chart to represent the trend in the market. These lines are used to clearly show the trend and are also used in the identification of trend reversals. An upward trend line is drawn at the lows of an upward trend. This line represents the support that price forms every time it moves from a high to a low. This type of trend line helps traders to anticipate the point at which price will begin moving upwards again. A break of this trend line is the simplest indication of a change of trend towards the downside. Similarly, a downward trend line is drawn at the highs of the downward trend. This line represents the resistance level that price faces every time it moves from a low to a high. Likewise a break of this trend line is the simplest indication of a change of trend towards the upside.

11

12 Support and Resistance The support and resistance levels are important in terms of market psychology and supply and demand. These are the levels at which a lot of traders are willing to buy the currency (in the case of a support) or sell it (in the case of resistance). When these levels are broken, the supply and demand and the psychology behind the price movement is thought to have shifted, in which case new levels of support and resistance will likely be established. Once a resistance or support level is broken, its role is reversed. If the price falls below a support level, that level will become resistance. If the price rises above a resistance level, it will often become support. For a true reversal to occur, however, it is important that the price make a strong move through either the support or resistance.

13

14 Indicators Indicators are calculations based on the price of the currency that measure such things as trends, volatility and momentum. Indicators are used as a secondary measure to the actual price movements and add additional information to the analysis. They can be used in two main ways: to confirm price movement & chart patterns, and to form buy and sell signals.

15 Moving Averages Most chart patterns show a lot of variation in price movement. This can make it difficult for traders to get an idea of the currency's overall trend. One simple method traders use to combat this is to apply Moving Averages. A moving average is the average price of the currency over a set amount of time. By plotting the currency's average price, the price movement is smoothed out. Once the day-to-day fluctuations are removed, traders are better able to identify the true trend and increase the probability that it will work in their favor. Since moving averages rely on historical data for calculation, they have a lagging effect. The drawback of moving averages is these lags which can delay buying and selling decisions. Therefore averaging is typical choice between desired level of smoothing and the percentage of lag that a trader is willing to tolerate.

16 Types of Moving Averages Three types of moving averages exist. These are Simple moving averages (SMA) Weighted moving averages (WMA) Exponential moving averages (EMA). Each of these averages should be judged upon its own merits. There are also time periods when any of these is an appropriate choice.

17 Use of Moving Averages Moving averages can be used to quickly identify whether the currency is moving in an uptrend or a downtrend depending on the direction of the moving average. When a moving average is heading upward and the price is above it, the currency is in an uptrend. Conversely, a downward sloping moving average with the price below can be used to signal a downtrend.

18

19 Another method of determining momentum is to use a pair of moving averages. When a short-term average is above a longer-term average, the trend is up. On the other hand, a long-term average above a shorter-term average signals a downward movement in the trend.

20

21 Another major way moving averages are used is to identify support and resistance levels. It is not uncommon to see a currency that has been falling, stop its decline and reverse direction once it hits the support of a major moving average. And a move through a major moving average is often used as a signal by technical traders that the trend is reversing.
22
23 The Stochastic Oscillator The Stochastic Oscillator was developed by George Lane, and is a momentum indicator that measures the price of a currency, relative to the high/low range over a set period of time. The indicator oscillates between 0 and 100, with readings below 20 considered oversold and readings above 80 considered overbought. The stochastic method relies on the principle that prices tend to close near the upper part of the trading range during an uptrend and near the lower part of the trading range in a downtrend. As a trend approaches a turning point, the price closes further away from the extremes.(that is, further away from the highs in a rising market and further away from the lows in a declining market.) The objective of the slow stochastic is to identify these points in the trend since this indicates a reversal may be at hand.
24 Interpretation of the Slow Stochastic The basic interpretation of this indicator, would be 1. A stochastic value above 80 indicates an overbought market, while a stochastic below 20 indicates an oversold market. 2. The crossing of the %K and %D lines generates buy and sell signals. But they are more effective when the stochastic has been overbought or oversold and then moved out of the zone. This is especially important in a strong trend as the stochastic will remain in the overbought/oversold zone and give false crossovers. 3. Stochastic can show divergence, when the stochastic values are moving in one direction and the price values are moving in the opposite direction.
25 Drawback of the Slow Stochastic The basic drawback of this indicator is that it looses its effectiveness in trending markets. While it is one of the most effective indicators for ranging markets, it should not be relied upon when the market is in a trend. This is because the stochastic lines tend to remain in the extreme zones during a trend, giving false crossover signals. To overcome this drawback during trends, take signals only in the direction of the trend and never go long when stochastic is overbought, nor short when oversold. And as mentioned earlier, wait for the lines to move out of the extreme zone.
26
27 The Relative Strength Index (RSI) The Relative Strength Index (RSI) is one of the most widely used technical indicators by traders. It is used primarily to help identify overbought or oversold conditions in a particular currency, as it is formulated to fluctuate between 0 and 100, enabling fixed overbought and oversold levels. It does this by confirming changes in momentum which signals an imminent change in price direction or trend for the particular currency. The advantage of the RSI over other oscillators such as the Momentum or Rate of Change oscillators, is that it is smoother and is not as susceptible to distortion from unusually high or low prices
28 Interpretation of the RSI If used properly, the RSI is a very valuable tool in interpreting chart movement. Its two basic functions to interpret price movement are the overbought/oversold levels, and divergence. It also identifies price movement by forming patterns such as a double top/bottom, head & shoulders etc, when the same would not be clearly visible in the price movement. Similarly areas of support/resistance found on the RSI, prove to be more effective. It would generate more precise signals when the market is in a range bound state. Here, the overbought/oversold levels as well as divergences show up more accurately on the RSI. When price is trending, it would give false signals since it remains in the overbought/oversold state for an extended period of time.
29
30 Bollinger Bands Developed by John Bollinger, Bollinger Bands is an indicator that allows users to compare volatility and relative price levels over a period time. In short, the Bollinger Bands provide a relative definition of high and low. The indicator consists of three bands which usually to encompasses the majority of price action. A simple moving average in the middle An upper band (SMA plus 2 standard deviations) A lower band (SMA minus 2 standard deviations
31 Interpretation of the Bollinger Bands The basic interpretation of Bollinger Bands is that prices tend to stay within the upper and lower band. Because standard deviation is a measure of volatility, the bands adjust themselves to the market conditions. When the markets become more volatile, the bands widen (move further away from the average), and during less volatile periods, the bands contract (move closer to the average). The tightening of the bands is often used by technical traders as an early indication that the volatility is about to increase sharply.
32 Characteristics of Bollinger Bands 85% of the price action is contained within the bands. Sharp price changes tend to occur after the bands tighten, as volatility lessens. When prices move outside the bands, a continuation of the current trend is implied. Bottoms and tops made outside the bands followed by bottoms and tops made inside the bands call for reversals in the trend. A move that originates at one band tends to go all the way to the other band. This observation is useful when projecting price targets.
33
34 Fibonacci Ratios Fibonacci ratios are a very popular tool among technical traders and are based on a particular series of numbers identified by mathematician Leonardo Fibonacci in the thirteenth century. The Fibonacci sequence of numbers is as follows: 0, 1, 1, 2, 3, 5, 8, 13, 21, 34, 55, 89, 144, etc. Each term in this sequence is simply the sum of the two preceding terms and sequence continues infinitely. However, the sequence of numbers is not as important as the mathematical relationships, expressed as ratios, between the numbers in the series. One of the remarkable characteristics of this numerical sequence is that each number is approximately times greater than the preceding number. This common relationship between every number in the series is the foundation of the common ratios used in retracement studies. The key Fibonacci ratio of 61.8% - also referred to as "the golden ratio" or "the golden mean" - is found by dividing one number in the series by the number that follows it. For example: 8/13 = , and 55/89 =
35 Using Fibonacci Ratios For some reason, these ratios seem to play an important role in the financial markets, just as they do in nature, and can be used to determine critical points that cause price to reverse. Price has an uncanny way of respecting Fibonacci ratio s, often quite precisely. Hence one can use these ratios to ascertain the correct technical levels. Fibonacci retracements. In technical analysis, the Fibonacci retracement is calculated by taking two extreme points (usually a swing high and swing low) on the price movement and dividing the vertical distance by the key Fibonacci ratios of 23.6%, 38.2%, 50%, 61.8% and 100%. Once these levels are identified, horizontal lines are drawn and used to identify possible support and resistance levels. The direction of the prior trend is likely to continue once the price has retraced to any of the ratios.
36
37 The Pivot Point The Pivot point system is a technique developed by floor traders, to help ascertain where the price is relative to previous market action. The Pivot point in a very basic sense can be defined as a turning point. It can be classified as a technical indicator derived by calculating the numerical average of the high, low and closing prices, of any currency / index / stock etc. One can say that it is a level at which the sentiment of the market changes. It can tell us where the sentiment of traders and investors changes, from bull to bear or vice versa. Pivot points work best on highly liquid markets, like the spot currency market, but they can be used in other markets as well. The main advantage of this technique is that it is price-based as opposed to indicator-based. By the time most indicators generate a signal, the move is already well under way. By following this system, one can get into a trade before the indicator-following traders, and be well into the trend when a signal is just being generated on a stochastic or other oscillator.
38 Interpretation In its basic interpretation, we can say that if the market breaks the Pivot level up, then the sentiment is said to be a bull market and it is likely to continue its way up, on the other hand if the market breaks this level down, then the sentiment is bearish, and is expected to continue its way down. The pivot point can thus be used as a predictive indicator. If the following day's market price falls below the pivot point, it may be used as a new resistance level. Conversely, if the market price rises above the pivot point, it may act as the new support level.
39 Calculating the Pivot Levels There are different methods for calculating pivot points, the most common of which is the five-point system. This system uses the previous day's high, low and close, to derive the pivot point along with two support levels and two resistance levels (totaling five levels) The equations are as follows: R2 = P + (R1 - S1) R1 = (P x 2) - L P = (H + L + C) / 3 S1 = (P x 2) - H S2 = P -(R1 -S1) Here, "P" represents the pivot point, "S" the support levels, "R" the resistance levels and "H", "L" and "C" represent the High, Low and Close respectively. These levels form the support and resistance levels for the current session.
40 Chart Patterns A chart pattern is a distinct formation on a chart that creates a trading signal, or a sign of future price movements. Chartists use these patterns to identify current trends and trend reversals and to trigger buy and sell signals. There are two types of patterns within this area of technical analysis, Reversal and Continuation. A reversal pattern signals that a prior trend will reverse upon completion of the pattern. A continuation pattern, on the other hand, signals that a trend will continue once the pattern is complete. These patterns can be found over charts of any time frame. The most commonly used chart patterns are the Head & Shoulders, Double top/bottom, Flag formations, Triangles, 123 pattern etc.
41 Using Multiple Technical Indicators Technical analysis is used for predicting price action in the financial markets. This is just another factor to put the odds in favor of the trader to increase the probability of a successful trade. Since the forex is a very liquid market and the currencies tend to trend well, we should try and ascertain a trend at its early stage, and a confirmation of 2 different factors gives the edge for a successful trade. But relying on any single indicator to provide signals for a trade is not advisable. If we have another factor confirming the same signal, the probability of a successful trade is increased. Using multiple sources of confirmation helps to avoid the potential false signals, and preserve our capital for only those situations that provide us with the most favorable risk to reward scenarios. The confirming factor could another indicator, but ideally price action should confirm the signals shown by the indicator. Hence a combination of an indicator with a chart formation can give better results.
42 Example of Using Multiple Technical Indicators For using multiple indicators, one must use indicators which are non-correlated. Most indicators tend to give similar inferences & one must understand the advantages & drawbacks of each to achieve an effective result. In the following example we have used the Moving average crossover method along with the slow stochastic indicator. In the trend as indicated by the moving averages, we identify overbought / oversold situations by the slow stochastic. We are thus using the characteristics of both to give us a better trade setup.
43
44 Thank you Sunil Mangwani
Disclaimer: The authors of the articles in this guide are simply offering their interpretation of the concepts. Information, charts or examples
 Disclaimer: The authors of the articles in this guide are simply offering their interpretation of the concepts. Information, charts or examples contained in this lesson are for illustration and educational
Chapter 2.3. Technical Analysis: Technical Indicators
 Chapter 2.3 Technical Analysis: Technical Indicators 0 TECHNICAL ANALYSIS: TECHNICAL INDICATORS Charts always have a story to tell. However, from time to time those charts may be speaking a language you
8 Day Intensive Course Lesson 5 Stochastics & Bollinger Bands
 8 Day Intensive Course Lesson 5 Stochastics & Bollinger Bands A)Trading with Stochastic Trading With Stochastic What is stochastic? Stochastic is an oscillator that works well in range-bound markets.[/i]
CHART TRADING GUIDE 1
 CHART TRADING GUIDE 1 How to understand chart trading This guide is designed to teach you the basics of chart trading- the chart patterns that are covered in this booklet can be used for short and medium
Sunil Mangwani www.fibforex123.com
 The 123 chart pattern. The 123 pattern is a reversal chart pattern which occurs very frequently and has a very high success ratio. 123 s occur at the end of trends and swings, and they are an indication
MATHEMATICAL TRADING INDICATORS
 MATHEMATICAL TRADING INDICATORS The mathematical trading methods provide an objective view of price activity. It helps you to build up a view on price direction and timing, reduce fear and avoid overtrading.
FOREX analysing made easy
 FOREX analysing made easy UNDERSTANDING TECHNICAL ANALYSIS An educational tool by Blackwell Global Contents Technical Analysis 2 Line Chart 3 Bar Chart 4 Candlestick Chart 5 Support and Resistance 6 Fibonacci
Technical Indicators Tutorial - Forex Trading, Currency Forecast, FX Trading Signal, Forex Training Cour...
 Page 1 Technical Indicators Tutorial Technical Analysis Articles Written by TradingEducation.com Technical Indicators Tutorial Price is the primary tool of technical analysis because it reflects every
Understanding the market
 Understanding the market Technical Analysis Approach: part I Xiaoguang Wang President, Purdue Quantitative Finance Club PhD Candidate, Department of Statistics Purdue University wang913@purdue.edu Outline
Chapter 2.3. Technical Indicators
 1 Chapter 2.3 Technical Indicators 0 TECHNICAL ANALYSIS: TECHNICAL INDICATORS Charts always have a story to tell. However, sometimes those charts may be speaking a language you do not understand and you
How I Trade Profitably Every Single Month without Fail
 How I Trade Profitably Every Single Month without Fail First of all, let me take some time to introduce myself to you. I am Kelvin and I am a full time currency trader. I have a passion for trading and
The Use of Trend Lines and Charting Patterns in Trading the Forex Markets
 The Use of Trend Lines and Charting Patterns in Trading the Forex Markets The use of Trends and Trend Lines forms the basis of establishing the support and resistance levels and charting patterns that
Trend Determination - a Quick, Accurate, & Effective Methodology
 Trend Determination - a Quick, Accurate, & Effective Methodology By; John Hayden Over the years, friends who are traders have often asked me how I can quickly determine a trend when looking at a chart.
Stochastic Oscillator.
 Stochastic Oscillator. By Jay Lakhani www.4x4u.net George Lane was the originator of the stochastic indicator in the 1960 s; the indicator tracks the market momentum. Lane observed that as prices rise
atching Currency Moves with The Schaff Trend Cycle Indicator
 JULY/AUGUST 2002. VOLUME 4 CRunning a trend indicator through a cycle oscillator creates an effective entry technique into today s strongly trending currency markets, says Doug Schaff, a 20-year veteran
Professional Trader Series: Moving Average Formula & Strategy Guide. by John Person
 Professional Trader Series: Moving Average Formula & Strategy Guide by John Person MOVING AVERAGE FORMULAS & STRATEGY GUIDE In an online seminar conducted for the Chicago Board of Trade, I shared how to
6. Get Top Trading Signals with the RSI
 INTERMEDIATE 6. Get Top Trading Signals with the RSI The Relative Strength Index, or RSI, is one of the most popular momentum indicators in technical analysis. The RSI is an oscillator that moves between
The Ultimate Fibonacci Guide By Fawad Razaqzada, technical analyst at FOREX.com
 The Ultimate Fibonacci Guide By Fawad Razaqzada, technical analyst at FOREX.com Who is Fibonacci? Leonardo Bonacci also known as Leonardo Fibonacci was an Italian mathematician in the 12 th century. He
8 Day Intensive Course Lesson 3
 8 Day Intensive Course Lesson 3 A) What are Fibonacci Retracements? Fibonacci Retracements What are Fibonacci retracements? Levels at which the market is expected to retrace to after a strong trend. Based
Heikin-Ashi-two-Bar-Strategy Guide to Strategic and Tactical Forex Trading Pull the Trigger and Hit your Targets
 Heikin-Ashi-two-Bar-Strategy Guide to Strategic and Tactical Forex Trading Pull the Trigger and Hit your Targets Currency: EUR/JPY, GBP/JPY Time frame: 5 min Indicators: BB 14, 2, ADX 14, SSD 5, 3, 3,
Basic Forex forecast methods: Technical analysis and fundamental analysis
 Forex forecasting Basic Forex forecast methods: Technical analysis and fundamental analysis This article provides insight into the two major methods of analysis used to forecast the behavior of the Forex
Using Bollinger Bands. by John Bollinger
 Article Text Copyright (c) Technical Analysis Inc. 1 Stocks & Commodities V. 10:2 (47-51): Using Bollinger Bands by John Bollinger Using Bollinger Bands by John Bollinger Trading bands, which are lines
A GUIDE TO WL INDICATORS
 A GUIDE TO WL INDICATORS GETTING TECHNICAL ABOUT TRADING: USING EIGHT COMMON INDICATORS TO MAKE SENSE OF TRADING What s a technical indicator and why should I use them? What s the market going to do next?
Advanced Trading Systems Collection FOREX TREND BREAK OUT SYSTEM
 FOREX TREND BREAK OUT SYSTEM 1 If you are a part time trader, this is one system that is for you. Imagine being able to take 20 minutes each day to trade. A little time at night to plan your trades and
Action Forex Company Limited 2010
 1 2 Sponsored by 3 TABLE OF CONTENTS TABLE OF CONTENTS... 4 INTRODUCTION... 5 CHAPTER 1 CHART ANALYSIS IN CURRENCY TRADING... 6 1.1 - IMPORTANCE OF CHART ANALYSIS IN CURRENCY TRADING... 6 1.2 - BASIC CHART
THE MACD: A COMBO OF INDICATORS FOR THE BEST OF BOTH WORLDS
 THE MACD: A COMBO OF INDICATORS FOR THE BEST OF BOTH WORLDS By Wayne A. Thorp Moving averages are trend-following indicators that don t work well in choppy markets. Oscillators tend to be more responsive
Alerts & Filters in Power E*TRADE Pro Strategy Scanner
 Alerts & Filters in Power E*TRADE Pro Strategy Scanner Power E*TRADE Pro Strategy Scanner provides real-time technical screening and backtesting based on predefined and custom strategies. With custom strategies,
New York Traders Expo 2012
 New York Traders Expo 2012 with JAMES CHEN, CTA, CMT Director of Technical Research and Education All rights reserved, FXDD Inc. 2010 Today s Topic: High Probability Strategies for Trading Forex www.fxdd.com
Using Formations To Identify Profit Opportunities
 Using Formations To Identify Profit Opportunities Using Formations To Identify Profit Opportunities The concepts and strategies discussed may not be suitable for all investors. It is important that investors
High Probability Trading Triggers for Gold & Silver
 Welcome to a CBOT Online Seminar High Probability Trading Triggers for Gold & Silver Presented by: John Person Sponsored by Interactive Brokers Live Presentation Starts at 3:30 PM Chicago Time NOTE: Futures
A Primer On Technical Analysis. Written by. Available at
 A Primer On Technical Analysis Written by Available at Page 1 of 23 Overview Technical Analysis (Versus Fundamental Analysis) Technical analysis is a method of forecasting price movements by looking at
Technical Analysis. Technical Analysis. Schools of Thought. Discussion Points. Discussion Points. Schools of thought. Schools of thought
 The Academy of Financial Markets Schools of Thought Random Walk Theory Can t beat market Analysis adds nothing markets adjust quickly (efficient) & all info is already in the share price Price lies in
THE CYCLE TRADING PATTERN MANUAL
 TIMING IS EVERYTHING And the use of time cycles can greatly improve the accuracy and success of your trading and/or system. THE CYCLE TRADING PATTERN MANUAL By Walter Bressert There is no magic oscillator
A Practical Guide to Technical Indicators; (Part 1) Moving Averages
 Moving Averages") A Practical Guide to Technical Indicators; (Part 1) Moving Averages By S.A Ghafari Over the past decades, attempts have been made by traders and researchers aiming to find a reliable method to predict
A Practical Guide to Technical Indicators; (Part 1) Moving Averages By S.A Ghafari Over the past decades, attempts have been made by traders and researchers aiming to find a reliable method to predict
Technical Analysis Fibonacci Levels
 Technical Analysis Fibonacci Levels Retracements A retracement is a pullback within the context of a trend. Dip After a rise from 0 to 1, short term market participants start to take profit. This drives
Why the E.A.S.Y. Method?
 Why the E.A.S.Y. Method? Mark Douglas, author of Trading in the Zone, states: The best traders have developed an edge and more importantly, they trust their edge. Why the E.A.S.Y. Method? My trading edge
THE A-Z GUIDE TO E-MINI FUTURES TRADING
 THE A-Z GUIDE TO E-MINI FUTURES TRADING 1.800.800.3840 2 PAST PERFORMANCE IS NOT NECESSARILY INDICATIVE OF FUTURE PERFORMANCE. THE RISK OF LOSS IN TRADING FUTURES CONTRACTS OR COMMODITY OPTIONS CAN BE
Definitions to Basic Technical Analysis Terms. www.recognia.com
 Definitions to Basic Technical Analysis Terms www.recognia.com A Alert An alert is a notification sent when a significant event occurs in one or more investments of importance to a trader. Recognia sends
FX Trading Guide: 4 Simple Ways to Spot a Trend JON MCFARLANE AND VERNON LEES
 FX Trading Guide: 4 Simple Ways to Spot a Trend JON MCFARLANE AND VERNON LEES 0 BetOnMarkets 2011 Foreword We wrote this guide to give people wanting to trade Financial Fixed Odds some simple tools and
More informed trading Technical Analysis: Trading Using Multiple Time-frames
 Technical Analysis: Trading Using Multiple Time-frames Intermediate Level Introduction 1 Stock markets worldwide function because, at any given time, some traders want to buy whilst others want to sell.
The 5 Exit Heroes. Exiting Your Forex Trades For Maximum Profits
 The 5 Exit Heroes Exiting Your Forex Trades For Maximum Profits IMPORTANT : As an added bonus for downloading this report, you also received additional free training videos. To access your bonuses, go
BROKER SERVICES AND PLATFORM
 BROKER SERVICES AND PLATFORM A broker is an individual who executes buy and sell orders and get commission in the form of SPREAD (I will talk about SPREAD in the subsequent lessons). You trade through
RISK DISCLOSURE STATEMENT / DISCLAIMER AGREEMENT
 RISK DISCLOSURE STATEMENT / DISCLAIMER AGREEMENT Trading any financial market involves risk. This report and all and any of its contents are neither a solicitation nor an offer to Buy/Sell any financial
Candlesticks For Support And Resistance
 NOVICE TRADER Candlesticks For Support And Resistance Even as you read this, the candlestick charting technique, with its origins in Japan, is being absorbed into the ways of Western technical analysis.
Charting Glossary Version 1 September 2008
 Charting Glossary Version 1 September 2008 i Contents 1 Price...1 2 Charts...1 2.1 Line, Step, Scatter, Mountain charts... 1 2.2 Bar Charts (Open/High/Low/Close charts)... 1 2.3 Candle charts... 2 2.4
Advanced Trading Systems Collection MACD DIVERGENCE TRADING SYSTEM
 MACD DIVERGENCE TRADING SYSTEM 1 This system will cover the MACD divergence. With this trading system you can trade any currency pair (I suggest EUR/USD and GBD/USD when you start), and you will always
Timing the Trade How to Buy Right before a Huge Price Advance
 Timing the Trade How to Buy Right before a Huge Price Advance By now you should have read my first two ebooks and learned about the life cycle of a market, stock, or ETF, and discovered the best indicators
Chapter 4.2. Technical Analysis: Fibonacci
 1 Chapter 4.2 Technical Analysis: Fibonacci 0 Contents TECHNICAL ANALYSIS: FIBONACCI Fibonacci analysis is the study of identifying potential support and resistance levels in the future based on past price
Forex Volatility Patterns
 Spotting Early Breakouts Forex Volatility Patterns BRUCE WALDMAN Want to catch 40 to 00 pips in each trade? Here s how you can find those entry and exit signals to make your forex trading a success. C
6.14. Oscillators and Indicators.
 6.14. Oscillators and Indicators. What is Momentum? The word momentum has two meanings to market technicians, one of them is a generic concept about how prices move, and the second one is a specific indicator.
marketsurvival.net guide: The advanced guide to fibonacci trading How to trade stocks and Forex with Fibonacci numbers
 marketsurvival.net guide: The advanced guide to fibonacci trading How to trade stocks and Forex with Fibonacci numbers Contents FOREWORD... 5 PART 1. INTRODUCTION...7 WHY IS USING THE FIBONACCI TOOLS BETTER
Day Trade System EZ Trade FOREX
 Day Trade System The EZ Trade FOREX Day Trading System is mainly used with four different currency pairs; the EUR/USD, USD/CHF, GBP/USD and AUD/USD, but some trades are also taken on the USD/JPY. It uses
The Crown pattern BY DENNIS BOLZE FIGURE 1 FROM HEAD-AND-SHOULDERS TO BULL CROWN
 & UTURS The rown pattern H e r e s a way to use some specific calculations to improve the odds of trading a variation of a classic chart pattern on an intraday basis. Y NNIS OLZ IGUR 1 ROM H-N-SHOULRS
Guidelines to use with Fibonacciqueen trade setups!!!
 Guidelines to use with Fibonacciqueen trade setups!!! Updated January 2014 As far as the price analysis that I run every day in the markets, there are three different types of Fibonacci price relationships
Metatrader 4 Edition. Version 1.XX
 Dynamic Sync Trading System Metatrader 4 Edition Version 1.XX Free Forex Studio http://www.f-fx.com http://www.forexsync.com 1 Contents I. Welcome...3 II. III. General Setup Procedures...4 System Overview...5
INTRODUCTION - TIPS - STRATEGY
 EBOOK INTRODUCTION - TIPS - STRATEGY Table of Contents 1. What are Binary Options 2. The flow of decisions in a Trade 3. Advantagesw 4. Risk Management 5. What You Need to Succeed 6. Risk Tolerance 7.
The Shark Attack System
 The Shark Attack System by Ashwani Gujral Reviewed and recommended by Rita Lasker & Green Forex Group Disclaimer Please be aware of the loss, risk, personal or otherwise consequences of the use and application
Chart Patterns Trader. Trader SUPPLEMENT. Understanding and Trading Classic Chart Patterns. By: Kevin Matras Zacks Investment Research, Inc
 Chart Patterns Trader Trader SUPPLEMENT Understanding and Trading Classic Chart Patterns By: Kevin Matras Zacks Investment Research, Inc Table of Contents Introduction.........................................................................
Trend Analysis From Fibonacci to Gann Ichimoku versus MACD Proprietary Signals
 Trend Analysis From Fibonacci to Gann Ichimoku versus MACD Proprietary Signals Cornelius Luca Luca Global Research Banco Best Lisbon 2010 From Fibonacci to Gann Who is Fibonacci? Leonardo of Pisa (1170s
The 15 50 Trading System
 Main Premise: This is considered to be one of the most straight forward systems for a live trading style for day- and/or intraday trading. The 50 SMA is one of the most commonly used moving average numbers
Technical Analysis. Chart Formations. Brought to you by: FX-ebooks.com. Forex ebooks Library
 Technical Analysis Chart Formations Brought to you by: FX-ebooks.com Forex ebooks Library 1 Forex Mentor by Peter Bain The new Leading Professional Currency Trading System shows you how to trade currencies
The Building Blocks for Succeeding with Forex Trading
 The Building Blocks for Succeeding with Forex Trading This e-book was created by traders and for traders with the aim of equipping traders with the right skills of earning big returns from trading forex
TOMORROW'S TRADING TECHNOLOGY. 100% automated Fibonacci support and resistance levels that you can count on every single trading day in an instant.
 TOMORROW'S TRADING TECHNOLOGY 100% automated Fibonacci support and resistance levels that you can count on every single trading day in an instant. ProTrader Table of Contents 1. Areas A. Fibonacci Confluence
Take it E.A.S.Y.! Dean Malone 4X Los Angeles Group - HotComm January 2007
 Take it E.A.S.Y.! Dean Malone 4X Los Angeles Group - HotComm January 2007 Dean Malone Partner of Compass Foreign Exchange, LLC. Co-Founder of Forex Signal Service.com. Previous Senior National for 4X Made
FOREIGN EXCHANGE CYCLES:
 January 1999 FOREIGN EXCHANGE CYCLES: Get Ready to Sell the Upcoming Cycle Top in the Dollar versus the Deutschemark Trade Sell the Dollar-Mark on a break below last week's low of 1.6625 and look for 5
TECHNICAL ANALYSIS GLOSSARY
 TECHNICAL ANALYSIS GLOSSARY A ABC: Elliott Wave terminology for a three-wave countertrend price movement. Wave A is the first price wave against the trend of the market. Wave B is a corrective wave to
SYNERGY Trading Method. CompassFX, 2009 www.compassfx.com Rev. 81009
 SYNERGY Trading Method SYNERGY Method INSTALLATION Basic Synergy is designed to automatically download onto the C: drive of your computer. If your local drive is not the C: drive, please send an email
Methods to Trade Forex Successfully for Quick Profits
 Methods to Trade Forex Successfully for Quick Profits This article is devoted to the techniques that are used to trade Forex on an intraday basis for quick profits. The aim is to make the trading a successful
Chart Patterns Tutorial - Forex Trading, Currency Forecast, FX Trading Signal, Forex Training Course, E...
 Page 1 Chart Patterns Tutorial Technical Analysis Articles Written by TradingEducation.com Chart Patterns Tutorial Traders have debated the merits of "technical analysis" versus "fundamental analysis"
VBM-ADX40 Method. (Wilder, J. Welles from Technical Analysis of Stocks and Commodities, February 1986.)
") VBM-ADX40 Method " I ve found that the most important thing in trading is always doing the right thing, whether or not you win or lose this is market savvy money management... I would go so far as to say
VBM-ADX40 Method " I ve found that the most important thing in trading is always doing the right thing, whether or not you win or lose this is market savvy money management... I would go so far as to say
Equity Basics: Introduction
 Equity Basics: Introduction Over the last few decades, the average person's interest in the equity market has grown exponentially. This demand coupled with advances in trading technology has opened up
Stock Breakout Profits Strategy
 Stock Breakout Profits Strategy Introduction Welcome and thank you for downloading the Stock Breakout Profits system. The Stock Breakout Profits is a complete trading strategy for trading not only the
Retracement Or Reversal. Kennsei Trading, Inc. Chief Trader Dinger dinger@kennseitrading.com www.hotstocksforincome.com
 Retracement Or Reversal Kennsei Trading, Inc. Chief Trader Dinger dinger@kennseitrading.com www.hotstocksforincome.com Retracement Or Reversal Most of us have wondered, at some point, whether a decline
An Objective Leading Indicator Fibonacci Retracements
 An Objective Leading Indicator Fibonacci Retracements This article explains how to use Fibonacci as a leading indicator, combining it with other technical analysis tools to provide precise, objective entry
Channel Lines. Charts of futures price
 File A2-20 April 2005 www.extension.iastate.edu/agdm Charting Commodity Futures Channel Lines. Charts of futures price movements can guide agricultural producers in timing farm marketings and can be of
WELCOME TO Trading Boot Camp Day 2
 Icoachtrader Consulting Service www.icoachtrader.weebly.com WELCOME TO Trading Boot Camp Day 2 David Ha Ngo Trading Coach Phone: 1.650.899.1088 Email: icoachtrader@gmail.com The information presented is
Pattern Recognition Software Guide
 Pattern Recognition Software Guide 2010 Important Information This material is for general information only and is not intended to provide trading or investment advice. All analysis and resulting conclusions
2:... 12 14 NYSE 2 15 NYSE
 1 Contents Introduction:... 4 Philosophy:... 5 Trading strategies an overview:... 6 Introduction to direct access trading:... 8 The US stock markets:... 9 Bids and offers:... 10 NASDAQ and level 2:...
Chapter 3.4. Forex Options
 Chapter 3.4 Forex Options 0 Contents FOREX OPTIONS Forex options are the next frontier in forex trading. Forex options give you just what their name suggests: options in your forex trading. If you have
The Moving Average. 2004 W. R. Booker II. All rights reserved forever and ever. And ever.
 The Moving Average By Rob Booker 2004 W. R. Booker II. All rights reserved forever and ever. And ever. The information contained in this ebook is designed to teach you methods of watching forex quotes
Trading with the High Performance Intraday Analysis Indicator Suite
 Trading with the High Performance Intraday Analysis Indicator Suite PowerZone Trading indicators can provide detailed information about the conditions of the intraday market that may be used to spot unique
Simple & Consistent Fibonacci Method Prepared by: Simone Guy. {Free learning resource: NOT FOR RESALE}
 Simple & Consistent Fibonacci Method Prepared by: Simone Guy {Free learning resource: NOT FOR RESALE} 3/13/2010 Overview This is a mechanical trading method that is based on Support and Resistance. The
Leon Wilson Trading Success
 Leon Wilson Trading Success A talk given by Mary de la Lande to the BullCharts User Group Meeting on 13 February 2008 1. Who is Leon Wilson? His Books and where to get them. 2. Book 1: The Business of
Understanding Classic Chart Patterns Recognia Inc.
 Understanding Classic Chart Patterns Recognia Inc. www.recognia.com 2009 Copyright Recognia Inc. Table of Contents Introduction...3 Head and Shoulders Top...5 Head and Shoulders Bottom... 10 Symmetrical
Trading with the Intraday Multi-View Indicator Suite
 Trading with the Intraday Multi-View Indicator Suite PowerZone Trading, LLC indicators can provide detailed information about the conditions of the intraday market that may be used to spot unique trading
New Trendlens Indicators & Functions
 New Trendlens Indicators & Functions There are 83 new indicators and functions available in TrendLens. Formation Functions Highest Value The Highest Value formation function looks back bar count number
Elliott-Wave Fibonacci Spread Trading
 Elliott-Wave Fibonacci Spread Trading Presented by Ryan Sanden The inevitable disclaimer: Nothing presented constitutes a recommendation to buy or sell any security. While the methods described are believed
The Best-Kept Secret of Forex
 The Best-Kept Secret of Forex Many traders go through trading system after trading system, only to find that most of them don t work. The truth of the matter is that there are many effective trading systems
Chapter 1 Introduction Disclaimer: Forex Involves risk. So if you lose money you can't blame us we told you trading involves risk.
 By Casey Stubbs -Winners Edge Trading.com Table of Contents Chapter 1. Introduction Chapter 2.. Trading Plan Chapter 3.. Money Management Chapter 4. Moving Average Strategy Chapter 5. Stochastic Strategy
Understanding the Technical Market Indicators
 Understanding the Technical Market Indicators Revised: October 2009 Article Written By: Md Saeed Ul Hoque Golden Gate University San Francisco, CA Sharif Gias Assistant Professor of Finance University
FREEFOREXEBOOK.ORG. Forex Trading
 FREEFOREXEBOOK.ORG Forex Trading Index Index 2 I - Forex Advantages 3 II 5 Myths about Forex Trading 5 III How Can I Start Making Money on Forex? 7 III.1 Educate Yourself 7 III.2 Plan How You Will Trade
Trading Binary Options Strategies and Tactics
 Trading Binary Options Strategies and Tactics Binary options trading is not a gamble or a guessing game. By using both fundamental and technical market analysis, you are able to get a better understanding
Using Order Book Data
 Q3 2007 Using Order Book Data Improve Automated Model Performance by Thom Hartle TradeFlow Charts and Studies - Patent Pending TM Reprinted from the July 2007 issue of Automated Trader Magazine www.automatedtrader.net
Technical Indicators Explained
 Chapter I. Technical Indicators Explained In This Chapter The information in this chapter is provided to help you learn how to use the technical indicators that are available for charting on the AIQ TradingExpert
Technical analysis. Course 11
 Course 11 Technical analysis Topic 1: Introduction to technical analysis... 3 Topic 2: Chart types... 4 Line charts... 4 Bar chart... 4 Candle stick charts... 5 Topic 3: Trend analysis... 6 Defining an
Nexgen Software Services
 Nexgen Software Services Trading Guide June 2016 2016 Nexgen Software Services Inc. Please read and understand the following disclaimers before proceeding: Futures, FX and SECURITIES and or options trading
My Techniques for making $150 a Day Trading Forex *Note for my more Advanced Strategies check out my site: Click Here
 My Techniques for making $150 a Day Trading Forex *Note for my more Advanced Strategies check out my site: Click Here The Strategy We will be looking at 2 different ways to day trade the Forex Markets.
A FRACTAL MARKET THEORY REVISITED THROUGH CHART ANALYSIS FOR A BETTER RISK/REWARD MANAGEMENT STRATEGY
 International Journal of Economics, Commerce and Management United Kingdom Vol. III, Issue 1, Jan 2015 http://ijecm.co.uk/ ISSN 2348 0386 A FRACTAL MARKET THEORY REVISITED THROUGH CHART ANALYSIS FOR A
Expert- Forex- Systems.com
 Expert- Forex- Systems.com Profit From The Forex Market Andrew Fields 1 2 Expert-Forex-Systems.com www.expert-forex-systems.com This book has been written in order to provide Forex traders with two tried
*Technical indicators look to predict the future price levels, or simply the general price direction, of a security by looking at past patterns.
 *Technical indicators, collectively called "technicals", are distinguished by the fact that they do not analyze any part of the fundamental business, like earnings, revenue and profit margins *Technical