How To Measure The Frequency Response Of An Audio System With A Microphone
|
|
|
- Prosper Berry
- 3 years ago
- Views:
Transcription
1 Method for Extracting the Frequency Response of an Audio System from a Recording Herman Orgeron Abstract. The ability to compare the technical performance of audio systems is necessary to choose the microphone system that best meets operational requirements. A common method to evaluate a system s performance is to generate a transfer function for the system and determine the frequency response. Normally this is done by connecting the system to a network analyzer, however not all systems have this ability. This paper outlines procedures developed to non-traditionally measure the frequency response of audio systems using recorded data files.

2 INTRODUCTION There are a variety of systems used to record and transmit audio signals. Each system has its own advantages and disadvantages, typically trading off cost, size, and power consumption for audio fidelity. In order to select the right system for a given situation, it is desirable to use unbiased indicators of performance to determine which system has the best audio quality for a given set of circumstances. Therefore, it is necessary to develop a simple method to quantify and compare systems that operate in vastly different ways. One of the best ways of quantifying audio quality is to measure a system s frequency response a gauge of a system s output spectrum given a specific input. The frequency response is used to graphically display how the recording system changes or distorts the input audio signal. The most desirable result is that the plot of the frequency response is a nearly flat line, meaning that at any given frequency the system s response to the input signal is constant. Historically, an audio system s frequency response was determined by placing the microphone in an anechoic chamber and sweeping through the audio spectrum with a well defined noise source, i.e. a loudspeaker. The system output would then be connected to a network analyzer which would display its response across the desired audio spectrum. This technique is not available to digital systems that record audio for later review there is no connection to allow audio to be fed into an analyzer. The lack of a real time analog audio stream prevents the use of traditional network analyzers and associated procedures. This complicates extracting the frequency response of the system and must be taken into account when developing a test methodology. I. APPROACH The method presented in this paper is designed to generate the frequency response for systems that do not produce continuous audio output instead they save the audio data into packets or files and all of the analysis must be done post-process. This method utilizes data acquisition and processing programs in this instance MATLAB was used due to availability and computer data acquisition cards to acquire the audio from multiple systems and to process the system frequency response. The basis for this method is that if two systems, one whose properties are known, and one whose properties are unknown, are exposed to the same audio environment, the unknown system s response can be determined based on the known system s response. In order to determine the frequency response of a particular system, the Power Spectral Density (PSD) of the saved recording is taken. The PSD plots acoustic power (db) against a specific frequency spectrum (Hz). By comparing two systems with the same inputs, any differences in the PSDs is a difference in the systems. In this case, a system is defined as anything that takes an input signal, operates on it, and produces an output signal.

3 x(t) System h(t) y(t) The transfer response for the system is h(t) and the output defined in the time domain is y(t) = x(t) * h(t) (1) where * is the convolution operator 1 and is defined as (f * g)(t) = f(τ)g(t-τ)dτ. (2) Convolution is used to mathematically describe the interaction between two signals and how they produce a third, different signal. Typically the third signal created by using the convolution operator is a modified version of one of the original signals. The convolution theorem can be used to simplify equation (1) by converting it from the time to the frequency domain. The convolution theorem states that the Fourier transform of two convoluted signals is equal to the Fourier transform of each signal multiplied together, F[f * g] = F[f] F[g] (3) where F denotes a Fourier transform operator 2. Fourier transforming x(t) and h(t) converts the signals from the time domain, (t), into the frequency domain, (ω). Thus, equation (1) is simplified from a convolution of signals at a given time to a product of signals at a given frequency: y(ω) = x(ω) h(ω). (4) The raw data being fed into the system from the respective microphones is in volts and needs to be converted into a decibel scale, a measure of loudness, using the identity L db = 10 log 10 (A 1 2 /A 0 2 ), (5) where L db is the ratio of A 1 to A 0 in decibels, A 1 is the measured amplitude, and A 0 is the reference amplitude 3. In this case, the reference amplitude is 1 V. Equation (5) can be applied to the x(ω) and h(ω) signals from equation (4), along with the general multiplicative logarithm identity, log(x y) = log(x) + log(y), (6) to simplify equation (1) into vector addition, where x(ω) and h(ω) are signals in the frequency domain with the units of decibels. The frequency equation is now represented by log(y(ω)) = log(x(ω)) + log(h(ω)). (7)
 by converting it from the time to the frequency domain.")
4 The general form to calculate the frequency response for the unknown system based on the known system s input can be written as a system of equations: log(y k (ω)) = log(x(ω)) + log(h k (ω)) (8) log(y u (ω)) = log(x(ω)) + log(h u (ω)) (9) where y k (ω) is the measured PSD of the known system, y u (ω) is the measured PSD of the unknown system, h k (ω) is the transfer response of the known system, h u (ω) is the transfer response of the unknown system, and x(ω) is the sound pressure level in the anechoic test chamber. The unknown transfer response, h u (ω), can be determined by solving equation (8) for x(ω) and substituting into equation (9), resulting in log(y u (ω)) = log(y k (ω)) - log(h k (ω)) + log(h u (ω)). (10) We can now determine h u (ω) as a function of the two measurements, y k (ω) and y u (ω), and the given transfer response, h k (ω): log(h u (ω)) = log(y u (ω)) [log(y k (ω)) log(h k (ω))] (11) Expression (11) can be simplified down into its final form, h u (ω) = [y u (ω) h k (ω)] / y k (ω) (12) using logarithmic identities and then taking the inverse logarithm of both sides of the equation. The transfer response of the unknown system is determined by subtracting the test chamber sound pressure level from the measured system response. The sound pressure level in the test chamber is determined using the measured response of the known system, from here on referred to as the reference microphone, and the published frequency response taken from the manufacturer s specifications. The final accuracy of the transfer response for the unknown system, from here out referred to as the System Under Test (SUT), depends on the accuracy of the reference microphone, so only high quality laboratory microphone systems should be used. II. EXPERIMENTAL PROCEDURE In order to acoustically isolate the systems, all measurements were made using a Brüel & Kjær Type 4232 Portable Anechoic Chamber 4. The reference microphone and the microphone for the SUT were placed inside the chamber. Using the chamber s internal loudspeaker, a frequency sweep, or chirp was played. The chirp spanned from 500 to 5000 Hz and lasted 5 seconds. This was repeated with one second of silence
, can be determined by solving equation (8) for x(ω) and substituting into equation (9), resulting in log(y u (ω)) = log(y k (ω)) - log(h k (ω)) + log(h u (ω)).")
5 between each sweep. The chirp was generated using Sound Forge, a computer software program designed for digital audio editing. The digital signal was then converted into analog via computer sound card and output to a loudspeaker. A sound card with a flat frequency response is necessary to avoid distorting the signal and changing the results. Based on this requirement, an Echo Gina 3G card 5 was used. The reference microphone was an ACO Pacific Type 7012 microphone 6, paired with a matched preamplifier, which was already calibrated. Its manufacturer-provided frequency response is extremely flat from 10 to Hz (Fig 1), making it a good reference choice. The output of the reference microphone was recorded using a Tektronix TDS6804B Digital Oscilloscope. The SUT audio was recorded using the equipment and software provided with the system. Both recordings were then transferred into MATLAB for post-processing (Fig 2). This test method was used to compare three audio systems. The first system tested was another microphone with a known frequency response (Tibbetts Model ). If the methodology was accurate, the transfer response generated would be the same as (or within a reasonable error to) the theoretical frequency response published for the microphone. The second SUT was a digital proprietary wireless microphone. This system used a microphone connected to a wireless radio frequency (RF) transmitter. The data from the microphone was digitized and transmitted to a receiver attached to a computer. Software included with the system captured the signal and recorded the audio. The final system tested was a wireless microphone system which communicated using a cellular network, GSM (Global System for Mobile communications). The system used Bluetooth to transmit the audio signal from the microphone to a base unit. The base unit then sent the signal over the cellular network to a computer in order to be recorded. Both the RF and the GSM cellular systems provided true unknowns to test this method because there is no frequency response data published for either system, and neither provides a real-time audio stream for measurements using conventional audio test equipment. Audio recordings of the chirp were made simultaneously in the chamber with the SUT and reference microphone and saved as.wav files. The data taken from the RF and GSM systems was done using the best-case scenario short range transmission with no interfering obstacles. A MATLAB program was written to process the data and to calculate the frequency responses of the systems. In MATLAB the two time domain data sets from each system were cut to the same size, approximately six seconds the length of the full sweep including silence in the beginning and the end. Then the PSD via periodogram was taken for each data set. The normalized PSD for the reference microphone, y k (ω), was then subtracted from the published frequency response, h k (ω). This provides a measure of the audio signal that is present in the chamber at the input of the SUT. With the input known, the SUT transfer response could then be determined by subtracting the SUT measured response from the input, x(ω). III. RESULTS

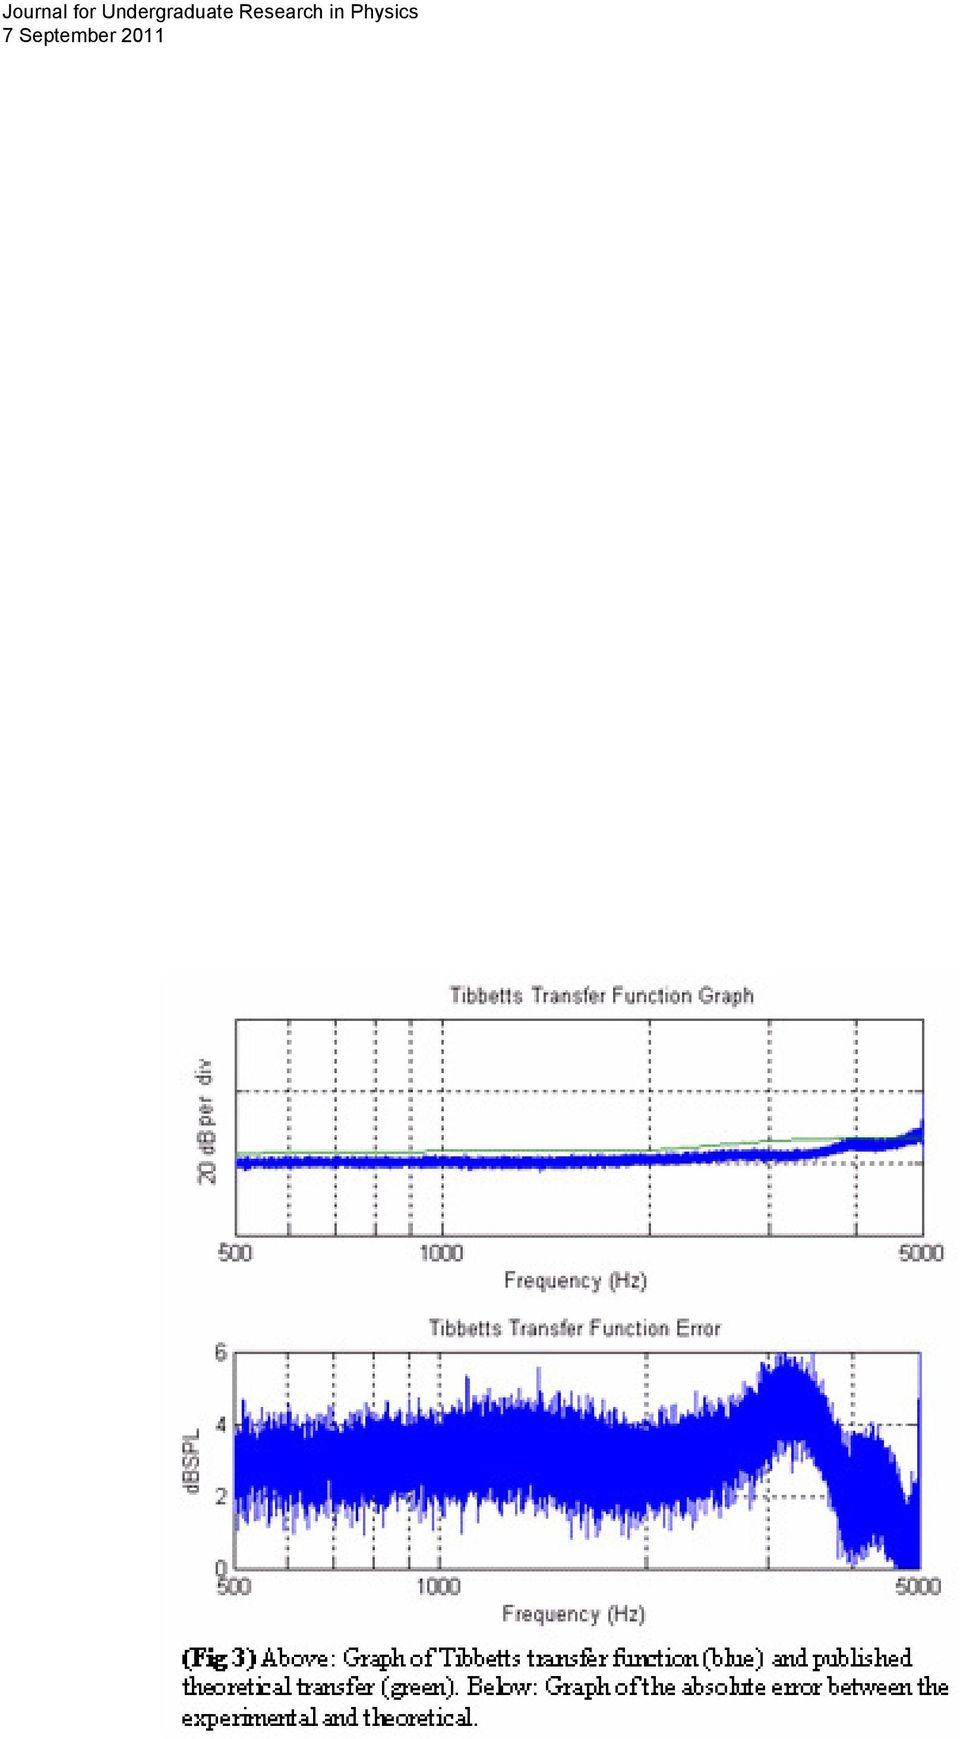
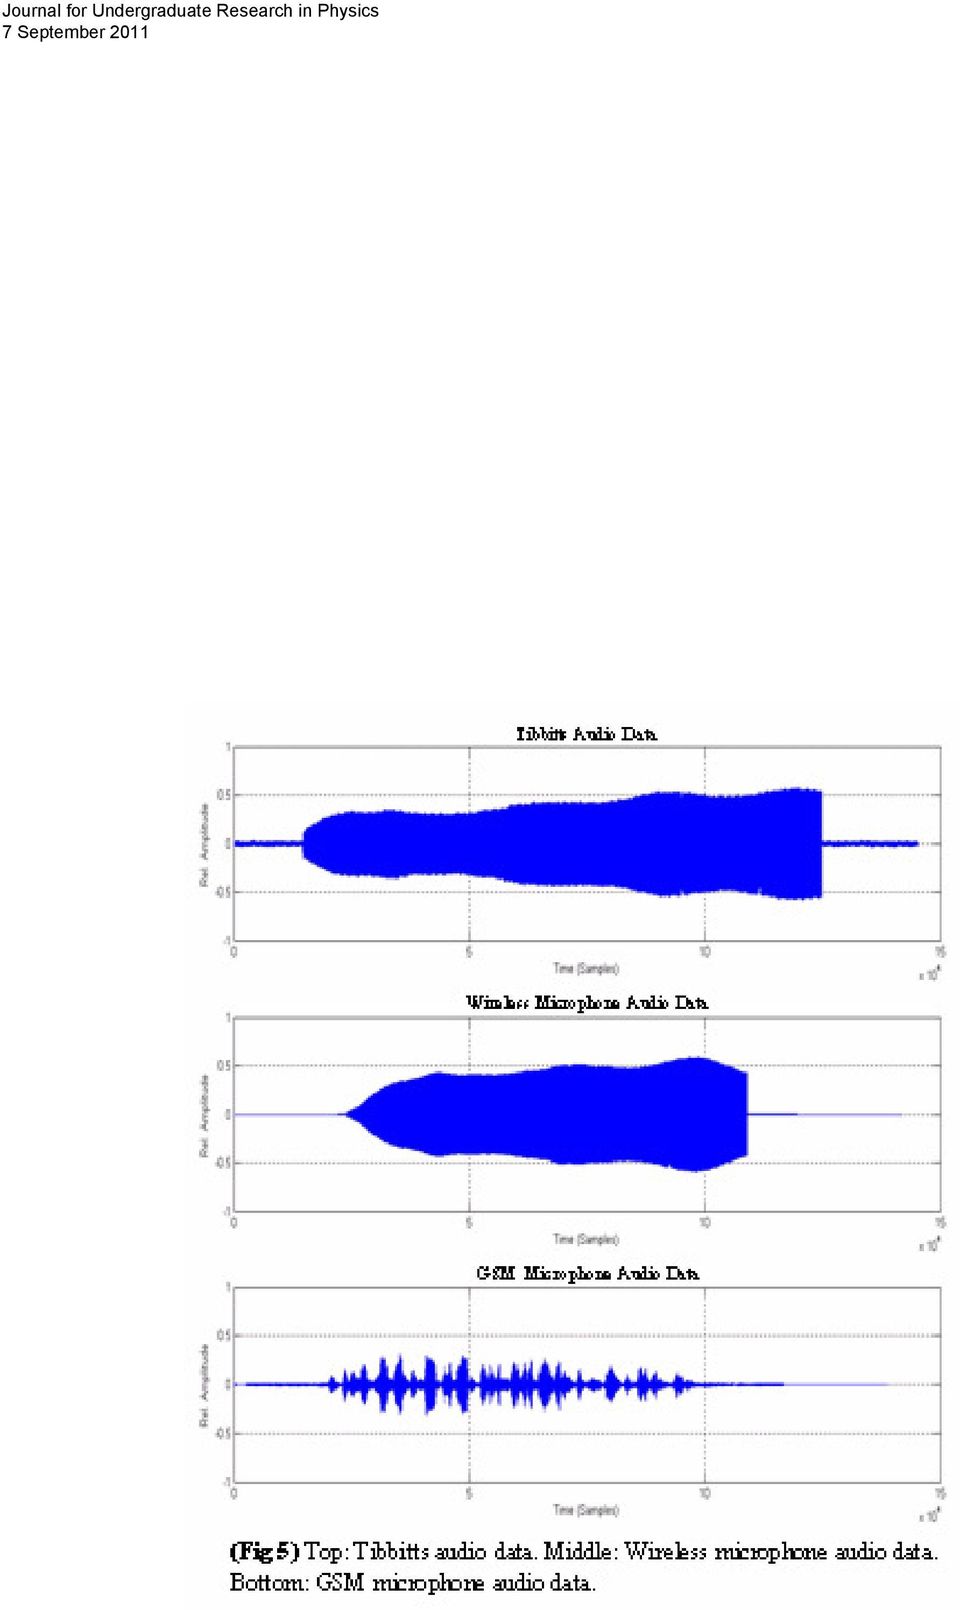
6 The results from the tests were very promising. The Tibbetts microphone performed closely to its published data 7 (Fig 3). The published frequency response variance from unit to unit for the microphone was ±3 db. The absolute difference between the frequency response measured using this technique and the published response was less than 6 db at all frequencies. The digital wireless microphone displayed an almost perfectly flat frequency response graph. The GSM system did not perform as well, displaying a very broken, choppy curve (Fig 4). These results were further verified by plotting the time domain audio data received from each of the units (Fig 5). The plots for the Tibbetts microphone and the digital wireless microphone are both very smooth, where the GSM plot is very distorted. The poor response from the GSM system is most likely due to the way that the cellular network transmits the data. The data is compressed for efficiency using adaptive codecs before sending it through the network. Unfortunately, the codecs can result in the loss of audio quality, especially if there is not a high signal to noise ratio. IV. CONCLUSION The experimental method described has proven to be a useful tool for evaluating and comparing audio systems. The accuracy of the technique was validated on a known system before being used to test two unknown systems. The response output from the two unknown systems was validated by comparing the frequency response to their audio output as expected, the system that output smooth audio had a far better response than the system that produced choppy audio. This method provides a good comparison because it does not just account for the acoustic capabilities of a recording device, but the entire system, including losses from other causes such as encoding and transmission. The next step for this method would be to fine tune it so that it would be able to extract an averaged frequency response from any common, broad-spectrum audio source, i.e. a voice recording or white noise. This would add robustness to system testing where the operator would not need the system to be physically present, just data that it had recorded. Additionally, the frequency responses generated from this method could be used to correct recorded signals from these systems in post-processing. V. ACKNOWLEDGEMENTS Every paper gains from the critical comments of its author's friends and colleagues. I would like to thank in particular Mr. John Latess, without whose guidance this project would never have been realized. VI. REFERENCES 1. Weisstein, E. W. (n.d.). Convolution. MathWorld A Wolfram Web Resource. Retrieved on October 13, 2009 from wolfram.com/convolution.html
.")
7 2. Weisstein, E. W. (n.d.). Convolution theorem. MathWorld A Wolfram Web Resource. Retrieved on October 13, 2009 from wolfram.com/convolutiontheorem.html 3. Everest, F. A. (2001). Master handbook of acoustics, Fourth edition. New York: McGraw-Hill. 4. Product data: Anechoic Test Box Type (2005). Brüel & Kjær. Retrieved on November 28, 2008 from File.4232.pdf 5. Layla 3G/Gina 3G owner s manual version for Windows. (2007, April 23). Echo Audio. Retrieved on November 26, 2008 from 1.pdf 6. Precision microphones and systems for end users and OEM. (2002). Aco Pacific. Retrieved on December 1, 2008 from com/acopaccat.pdf 7. Microphone products 251 Series technical data sheet. (2004). Tibbetts Industries. Retrieved on November 28, 2008 from industries.com/pdf/ pdf
. Aco Pacific. Retrieved on December 1, 2008 from http://www.acopacific.")
8 (Fig 1) Theoretical frequency response graph for the reference microphone and the MATLAB curve fit, from 100 to Hz

9 (Fig 2) Diagram of experiment set-up.

10

11

12
Electronic Communications Committee (ECC) within the European Conference of Postal and Telecommunications Administrations (CEPT)
 within the European Conference of Postal and Telecommunications Administrations (CEPT)") Page 1 Electronic Communications Committee (ECC) within the European Conference of Postal and Telecommunications Administrations (CEPT) ECC RECOMMENDATION (06)01 Bandwidth measurements using FFT techniques
Page 1 Electronic Communications Committee (ECC) within the European Conference of Postal and Telecommunications Administrations (CEPT) ECC RECOMMENDATION (06)01 Bandwidth measurements using FFT techniques
Sound Pressure Measurement
 Objectives: Sound Pressure Measurement 1. Become familiar with hardware and techniques to measure sound pressure 2. Measure the sound level of various sizes of fan modules 3. Calculate the signal-to-noise
Agilent AN 1316 Optimizing Spectrum Analyzer Amplitude Accuracy
 Agilent AN 1316 Optimizing Spectrum Analyzer Amplitude Accuracy Application Note RF & Microwave Spectrum Analyzers Table of Contents 3 3 4 4 5 7 8 8 13 13 14 16 16 Introduction Absolute versus relative
The Phase Modulator In NBFM Voice Communication Systems
 The Phase Modulator In NBFM Voice Communication Systems Virgil Leenerts 8 March 5 The phase modulator has been a point of discussion as to why it is used and not a frequency modulator in what are called
FREQUENCY RESPONSE OF AN AUDIO AMPLIFIER
 2014 Amplifier - 1 FREQUENCY RESPONSE OF AN AUDIO AMPLIFIER The objectives of this experiment are: To understand the concept of HI-FI audio equipment To generate a frequency response curve for an audio
HD Radio FM Transmission System Specifications Rev. F August 24, 2011
 HD Radio FM Transmission System Specifications Rev. F August 24, 2011 SY_SSS_1026s TRADEMARKS HD Radio and the HD, HD Radio, and Arc logos are proprietary trademarks of ibiquity Digital Corporation. ibiquity,
RF Measurements Using a Modular Digitizer
 RF Measurements Using a Modular Digitizer Modern modular digitizers, like the Spectrum M4i series PCIe digitizers, offer greater bandwidth and higher resolution at any given bandwidth than ever before.
Interference to Hearing Aids by Digital Mobile Telephones Operating in the 1800 MHz Band.
 Interference to Hearing Aids by Digital Mobile Telephones Operating in the 1800 MHz Band. Reference: EB968 Date: January 2008 Author: Eric Burwood (National Acoustic Laboratories) Collaborator: Walter
Department of Electrical and Computer Engineering Ben-Gurion University of the Negev. LAB 1 - Introduction to USRP
 Department of Electrical and Computer Engineering Ben-Gurion University of the Negev LAB 1 - Introduction to USRP - 1-1 Introduction In this lab you will use software reconfigurable RF hardware from National
Making Accurate Voltage Noise and Current Noise Measurements on Operational Amplifiers Down to 0.1Hz
 Author: Don LaFontaine Making Accurate Voltage Noise and Current Noise Measurements on Operational Amplifiers Down to 0.1Hz Abstract Making accurate voltage and current noise measurements on op amps in
DT3: RF On/Off Remote Control Technology. Rodney Singleton Joe Larsen Luis Garcia Rafael Ocampo Mike Moulton Eric Hatch
 DT3: RF On/Off Remote Control Technology Rodney Singleton Joe Larsen Luis Garcia Rafael Ocampo Mike Moulton Eric Hatch Agenda Radio Frequency Overview Frequency Selection Signals Methods Modulation Methods
Optimizing IP3 and ACPR Measurements
 Optimizing IP3 and ACPR Measurements Table of Contents 1. Overview... 2 2. Theory of Intermodulation Distortion... 2 3. Optimizing IP3 Measurements... 4 4. Theory of Adjacent Channel Power Ratio... 9 5.
Achieving New Levels of Channel Density in Downstream Cable Transmitter Systems: RF DACs Deliver Smaller Size and Lower Power Consumption
 Achieving New Levels of Channel Density in Downstream Cable Transmitter Systems: RF DACs Deliver Smaller Size and Lower Power Consumption Introduction By: Analog Devices, Inc. (ADI) Daniel E. Fague, Applications
CIRCUITS LABORATORY EXPERIMENT 3. AC Circuit Analysis
 CIRCUITS LABORATORY EXPERIMENT 3 AC Circuit Analysis 3.1 Introduction The steady-state behavior of circuits energized by sinusoidal sources is an important area of study for several reasons. First, the
Jeff Thomas Tom Holmes Terri Hightower. Learn RF Spectrum Analysis Basics
 Jeff Thomas Tom Holmes Terri Hightower Learn RF Spectrum Analysis Basics Agenda Overview: Spectrum analysis and its measurements Theory of Operation: Spectrum analyzer hardware Frequency Specifications
MICROPHONE SPECIFICATIONS EXPLAINED
 Application Note AN-1112 MICROPHONE SPECIFICATIONS EXPLAINED INTRODUCTION A MEMS microphone IC is unique among InvenSense, Inc., products in that its input is an acoustic pressure wave. For this reason,
Application Note Noise Frequently Asked Questions
 : What is? is a random signal inherent in all physical components. It directly limits the detection and processing of all information. The common form of noise is white Gaussian due to the many random
Spectrum Level and Band Level
 Spectrum Level and Band Level ntensity, ntensity Level, and ntensity Spectrum Level As a review, earlier we talked about the intensity of a sound wave. We related the intensity of a sound wave to the acoustic
Electrical Resonance
 Electrical Resonance (R-L-C series circuit) APPARATUS 1. R-L-C Circuit board 2. Signal generator 3. Oscilloscope Tektronix TDS1002 with two sets of leads (see Introduction to the Oscilloscope ) INTRODUCTION
Broadband Networks. Prof. Dr. Abhay Karandikar. Electrical Engineering Department. Indian Institute of Technology, Bombay. Lecture - 29.
 Broadband Networks Prof. Dr. Abhay Karandikar Electrical Engineering Department Indian Institute of Technology, Bombay Lecture - 29 Voice over IP So, today we will discuss about voice over IP and internet
MODULATION Systems (part 1)
") Technologies and Services on Digital Broadcasting (8) MODULATION Systems (part ) "Technologies and Services of Digital Broadcasting" (in Japanese, ISBN4-339-62-2) is published by CORONA publishing co.,
Technologies and Services on Digital Broadcasting (8) MODULATION Systems (part ) "Technologies and Services of Digital Broadcasting" (in Japanese, ISBN4-339-62-2) is published by CORONA publishing co.,
Non-Data Aided Carrier Offset Compensation for SDR Implementation
 Non-Data Aided Carrier Offset Compensation for SDR Implementation Anders Riis Jensen 1, Niels Terp Kjeldgaard Jørgensen 1 Kim Laugesen 1, Yannick Le Moullec 1,2 1 Department of Electronic Systems, 2 Center
RF Network Analyzer Basics
 RF Network Analyzer Basics A tutorial, information and overview about the basics of the RF Network Analyzer. What is a Network Analyzer and how to use them, to include the Scalar Network Analyzer (SNA),
Application Note. Introduction to. Page 1 / 10
 Application Note Introduction to RAPID-TEST Page 1 / 10 ABSTRACT With the RAPID-TEST instruments, NTI offers a series of powerful multitone analyzers for an extremely fast, yet precise audio performance
6.4 Logarithmic Equations and Inequalities
 6.4 Logarithmic Equations and Inequalities 459 6.4 Logarithmic Equations and Inequalities In Section 6.3 we solved equations and inequalities involving exponential functions using one of two basic strategies.
The continuous and discrete Fourier transforms
 FYSA21 Mathematical Tools in Science The continuous and discrete Fourier transforms Lennart Lindegren Lund Observatory (Department of Astronomy, Lund University) 1 The continuous Fourier transform 1.1
Frequency Response of Filters
 School of Engineering Department of Electrical and Computer Engineering 332:224 Principles of Electrical Engineering II Laboratory Experiment 2 Frequency Response of Filters 1 Introduction Objectives To
Signal to Noise Instrumental Excel Assignment
 Signal to Noise Instrumental Excel Assignment Instrumental methods, as all techniques involved in physical measurements, are limited by both the precision and accuracy. The precision and accuracy of a
Log-Likelihood Ratio-based Relay Selection Algorithm in Wireless Network
 Recent Advances in Electrical Engineering and Electronic Devices Log-Likelihood Ratio-based Relay Selection Algorithm in Wireless Network Ahmed El-Mahdy and Ahmed Walid Faculty of Information Engineering
ANALYZER BASICS WHAT IS AN FFT SPECTRUM ANALYZER? 2-1
 WHAT IS AN FFT SPECTRUM ANALYZER? ANALYZER BASICS The SR760 FFT Spectrum Analyzer takes a time varying input signal, like you would see on an oscilloscope trace, and computes its frequency spectrum. Fourier's
International Journal of Computer Sciences and Engineering. Research Paper Volume-4, Issue-4 E-ISSN: 2347-2693
 International Journal of Computer Sciences and Engineering Open Access Research Paper Volume-4, Issue-4 E-ISSN: 2347-2693 PAPR Reduction Method for the Localized and Distributed DFTS-OFDM System Using
Email: tjohn@mail.nplindia.ernet.in
 USE OF VIRTUAL INSTRUMENTS IN RADIO AND ATMOSPHERIC EXPERIMENTS P.N. VIJAYAKUMAR, THOMAS JOHN AND S.C. GARG RADIO AND ATMOSPHERIC SCIENCE DIVISION, NATIONAL PHYSICAL LABORATORY, NEW DELHI 110012, INDIA
The Effective Number of Bits (ENOB) of my R&S Digital Oscilloscope Technical Paper
 of my R&S Digital Oscilloscope Technical Paper") The Effective Number of Bits (ENOB) of my R&S Digital Oscilloscope Technical Paper Products: R&S RTO1012 R&S RTO1014 R&S RTO1022 R&S RTO1024 This technical paper provides an introduction to the signal
The Effective Number of Bits (ENOB) of my R&S Digital Oscilloscope Technical Paper Products: R&S RTO1012 R&S RTO1014 R&S RTO1022 R&S RTO1024 This technical paper provides an introduction to the signal
Computer Networks and Internets, 5e Chapter 6 Information Sources and Signals. Introduction
 Computer Networks and Internets, 5e Chapter 6 Information Sources and Signals Modified from the lecture slides of Lami Kaya (LKaya@ieee.org) for use CECS 474, Fall 2008. 2009 Pearson Education Inc., Upper
Experiment 3: Double Sideband Modulation (DSB)
") Experiment 3: Double Sideband Modulation (DSB) This experiment examines the characteristics of the double-sideband (DSB) linear modulation process. The demodulation is performed coherently and its strict
Experiment 3: Double Sideband Modulation (DSB) This experiment examines the characteristics of the double-sideband (DSB) linear modulation process. The demodulation is performed coherently and its strict
Jeff Thomas Tom Holmes Terri Hightower. Learn RF Spectrum Analysis Basics
 Jeff Thomas Tom Holmes Terri Hightower Learn RF Spectrum Analysis Basics Learning Objectives Name the major measurement strengths of a swept-tuned spectrum analyzer Explain the importance of frequency
Audio Engineering Society. Convention Paper. Presented at the 129th Convention 2010 November 4 7 San Francisco, CA, USA
 Audio Engineering Society Convention Paper Presented at the 129th Convention 2010 November 4 7 San Francisco, CA, USA The papers at this Convention have been selected on the basis of a submitted abstract
Agilent E3830 Series Wide-bandwidth Signal Analyzer Custom Systems 100 MHz Bandwidth Microwave Vector Signal Analysis
 Agilent E3830 Series Wide-bandwidth Signal Analyzer Custom Systems 100 MHz Bandwidth Microwave Vector Signal Analysis The measurement challenge 2 Many advanced microwave applications involve complex wideband
NRZ Bandwidth - HF Cutoff vs. SNR
 Application Note: HFAN-09.0. Rev.2; 04/08 NRZ Bandwidth - HF Cutoff vs. SNR Functional Diagrams Pin Configurations appear at end of data sheet. Functional Diagrams continued at end of data sheet. UCSP
MATRIX TECHNICAL NOTES
 200 WOOD AVENUE, MIDDLESEX, NJ 08846 PHONE (732) 469-9510 FAX (732) 469-0418 MATRIX TECHNICAL NOTES MTN-107 TEST SETUP FOR THE MEASUREMENT OF X-MOD, CTB, AND CSO USING A MEAN SQUARE CIRCUIT AS A DETECTOR
Room Acoustic Reproduction by Spatial Room Response
 Room Acoustic Reproduction by Spatial Room Response Rendering Hoda Nasereddin 1, Mohammad Asgari 2 and Ayoub Banoushi 3 Audio Engineer, Broadcast engineering department, IRIB university, Tehran, Iran,
PRODUCT INFORMATION. Insight+ Uses and Features
 PRODUCT INFORMATION Insight+ Traditionally, CAE NVH data and results have been presented as plots, graphs and numbers. But, noise and vibration must be experienced to fully comprehend its effects on vehicle
Visual System Simulator White Paper
 Visual System Simulator White Paper UNDERSTANDING AND CORRECTLY PREDICTING CRITICAL METRICS FOR WIRELESS RF LINKS Understanding and correctly predicting cellular, radar, or satellite RF link performance
GRF-3300 RF Training Kits
 RF Training Kits Presenter : Cooper Liu, Engineer Department : Marketing & Service Division Date : Aug. 20, 2008 Educational challenges coped in RF circuits training Short of proper training tools The
INTERFERENCE OF SOUND WAVES
 2011 Interference - 1 INTERFERENCE OF SOUND WAVES The objectives of this experiment are: To measure the wavelength, frequency, and propagation speed of ultrasonic sound waves. To observe interference phenomena
Sampling Theorem Notes. Recall: That a time sampled signal is like taking a snap shot or picture of signal periodically.
 Sampling Theorem We will show that a band limited signal can be reconstructed exactly from its discrete time samples. Recall: That a time sampled signal is like taking a snap shot or picture of signal
RANDOM VIBRATION AN OVERVIEW by Barry Controls, Hopkinton, MA
 RANDOM VIBRATION AN OVERVIEW by Barry Controls, Hopkinton, MA ABSTRACT Random vibration is becoming increasingly recognized as the most realistic method of simulating the dynamic environment of military
NUCLEAR MAGNETIC RESONANCE. Advanced Laboratory, Physics 407, University of Wisconsin Madison, Wisconsin 53706
 (revised 4/21/03) NUCLEAR MAGNETIC RESONANCE Advanced Laboratory, Physics 407, University of Wisconsin Madison, Wisconsin 53706 Abstract This experiment studies the Nuclear Magnetic Resonance of protons
Four Wave Mixing in Closely Spaced DWDM Optical Channels
 544 VOL. 1, NO. 2, AUGUST 2006 Four Wave Mixing in Closely Spaced DWDM Optical Channels Moncef Tayahi *, Sivakumar Lanka, and Banmali Rawat Advanced Photonics Research lab, Department of Electrical Engineering
How To Recognize Voice Over Ip On Pc Or Mac Or Ip On A Pc Or Ip (Ip) On A Microsoft Computer Or Ip Computer On A Mac Or Mac (Ip Or Ip) On An Ip Computer Or Mac Computer On An Mp3
 On A Microsoft Computer Or Ip Computer On A Mac Or Mac (Ip Or Ip) On An Ip Computer Or Mac Computer On An Mp3") Recognizing Voice Over IP: A Robust Front-End for Speech Recognition on the World Wide Web. By C.Moreno, A. Antolin and F.Diaz-de-Maria. Summary By Maheshwar Jayaraman 1 1. Introduction Voice Over IP is
Recognizing Voice Over IP: A Robust Front-End for Speech Recognition on the World Wide Web. By C.Moreno, A. Antolin and F.Diaz-de-Maria. Summary By Maheshwar Jayaraman 1 1. Introduction Voice Over IP is
RECOMMENDATION ITU-R SM.1792. Measuring sideband emissions of T-DAB and DVB-T transmitters for monitoring purposes
 Rec. ITU-R SM.1792 1 RECOMMENDATION ITU-R SM.1792 Measuring sideband emissions of T-DAB and DVB-T transmitters for monitoring purposes (2007) Scope This Recommendation provides guidance to measurement
ARTICLE. Sound in surveillance Adding audio to your IP video solution
 ARTICLE Sound in surveillance Adding audio to your IP video solution Table of contents 1. First things first 4 2. Sound advice 4 3. Get closer 5 4. Back and forth 6 5. Get to it 7 Introduction Using audio
SIGNAL GENERATORS and OSCILLOSCOPE CALIBRATION
 1 SIGNAL GENERATORS and OSCILLOSCOPE CALIBRATION By Lannes S. Purnell FLUKE CORPORATION 2 This paper shows how standard signal generators can be used as leveled sine wave sources for calibrating oscilloscopes.
"Essential Mathematics & Statistics for Science" by Dr G Currell & Dr A A Dowman (John Wiley & Sons) Answers to In-Text Questions
 Answers to In-Text Questions") "Essential Mathematics & Statistics for Science" by Dr G Currell & Dr A A Dowman (John Wiley & Sons) Answers to In-Text Questions 5 Logarithmic & Exponential Functions To navigate, use the Bookmarks in
"Essential Mathematics & Statistics for Science" by Dr G Currell & Dr A A Dowman (John Wiley & Sons) Answers to In-Text Questions 5 Logarithmic & Exponential Functions To navigate, use the Bookmarks in
Using the Impedance Method
 Using the Impedance Method The impedance method allows us to completely eliminate the differential equation approach for the determination of the response of circuits. In fact the impedance method even
Impedance 50 (75 connectors via adapters)
") VECTOR NETWORK ANALYZER PLANAR TR1300/1 DATA SHEET Frequency range: 300 khz to 1.3 GHz Measured parameters: S11, S21 Dynamic range of transmission measurement magnitude: 130 db Measurement time per point:
VECTOR NETWORK ANALYZER PLANAR TR1300/1 DATA SHEET Frequency range: 300 khz to 1.3 GHz Measured parameters: S11, S21 Dynamic range of transmission measurement magnitude: 130 db Measurement time per point:
Figure1. Acoustic feedback in packet based video conferencing system
 Real-Time Howling Detection for Hands-Free Video Conferencing System Mi Suk Lee and Do Young Kim Future Internet Research Department ETRI, Daejeon, Korea {lms, dyk}@etri.re.kr Abstract: This paper presents
Module 13 : Measurements on Fiber Optic Systems
 Module 13 : Measurements on Fiber Optic Systems Lecture : Measurements on Fiber Optic Systems Objectives In this lecture you will learn the following Measurements on Fiber Optic Systems Attenuation (Loss)
Final Year Project Progress Report. Frequency-Domain Adaptive Filtering. Myles Friel. Supervisor: Dr.Edward Jones
 Final Year Project Progress Report Frequency-Domain Adaptive Filtering Myles Friel 01510401 Supervisor: Dr.Edward Jones Abstract The Final Year Project is an important part of the final year of the Electronic
PUMPED Nd:YAG LASER. Last Revision: August 21, 2007
 PUMPED Nd:YAG LASER Last Revision: August 21, 2007 QUESTION TO BE INVESTIGATED: How can an efficient atomic transition laser be constructed and characterized? INTRODUCTION: This lab exercise will allow
Agilent AN 1315 Optimizing RF and Microwave Spectrum Analyzer Dynamic Range. Application Note
 Agilent AN 1315 Optimizing RF and Microwave Spectrum Analyzer Dynamic Range Application Note Table of Contents 3 3 3 4 4 4 5 6 7 7 7 7 9 10 10 11 11 12 12 13 13 14 15 1. Introduction What is dynamic range?
Matlab GUI for WFB spectral analysis
 Matlab GUI for WFB spectral analysis Jan Nováček Department of Radio Engineering K13137, CTU FEE Prague Abstract In the case of the sound signals analysis we usually use logarithmic scale on the frequency
VCO Phase noise. Characterizing Phase Noise
 VCO Phase noise Characterizing Phase Noise The term phase noise is widely used for describing short term random frequency fluctuations of a signal. Frequency stability is a measure of the degree to which
Probability and Random Variables. Generation of random variables (r.v.)
") Probability and Random Variables Method for generating random variables with a specified probability distribution function. Gaussian And Markov Processes Characterization of Stationary Random Process Linearly
Probability and Random Variables Method for generating random variables with a specified probability distribution function. Gaussian And Markov Processes Characterization of Stationary Random Process Linearly
PCM Encoding and Decoding:
 PCM Encoding and Decoding: Aim: Introduction to PCM encoding and decoding. Introduction: PCM Encoding: The input to the PCM ENCODER module is an analog message. This must be constrained to a defined bandwidth
Application Note #4 Measuring Transmitter Power with the Oscilloscope Roger Stenbock W1RMS 4/19/2012
 Application Note #4 Measuring Transmitter Power with the Oscilloscope Roger Stenbock W1RMS 4/19/2012 HF Amplifier Power Measurements: Power is often defined as peak power, carrier power, average power,
AN1200.04. Application Note: FCC Regulations for ISM Band Devices: 902-928 MHz. FCC Regulations for ISM Band Devices: 902-928 MHz
 AN1200.04 Application Note: FCC Regulations for ISM Band Devices: Copyright Semtech 2006 1 of 15 www.semtech.com 1 Table of Contents 1 Table of Contents...2 1.1 Index of Figures...2 1.2 Index of Tables...2
PSM 900 and PSM 1000 Personal Monitor Systems TWO SYSTEMS. INFINITE POSSIBILITIES.
 PSM 900 and PSM 1000 Personal Monitor Systems TWO SYSTEMS. INFINITE POSSIBILITIES. PSM 900 AND PSM 1000 PERSONAL MONITOR SYSTEMS. ONLY FROM SHURE. PSM 900 PSM 1000 PSM 900 and PSM 1000 Personal Monitor
AN-007 APPLICATION NOTE MEASURING MAXIMUM SUBWOOFER OUTPUT ACCORDING ANSI/CEA-2010 STANDARD INTRODUCTION CEA-2010 (ANSI) TEST PROCEDURE
 TEST PROCEDURE") AUDIOMATICA AN-007 APPLICATION NOTE MEASURING MAXIMUM SUBWOOFER OUTPUT ACCORDING ANSI/CEA-2010 STANDARD by Daniele Ponteggia - dp@audiomatica.com INTRODUCTION The Consumer Electronics Association (CEA),
AUDIOMATICA AN-007 APPLICATION NOTE MEASURING MAXIMUM SUBWOOFER OUTPUT ACCORDING ANSI/CEA-2010 STANDARD by Daniele Ponteggia - dp@audiomatica.com INTRODUCTION The Consumer Electronics Association (CEA),
Noise. CIH Review PDC March 2012
 Noise CIH Review PDC March 2012 Learning Objectives Understand the concept of the decibel, decibel determination, decibel addition, and weighting Know the characteristics of frequency that are relevant
Android based Alcohol detection system using Bluetooth technology
 For more Project details visit: http://www.projectsof8051.com/android-based-alcohol-detection-system-usingbluetooth-technology/ Code 1435 Project Title Android based Alcohol detection system using Bluetooth
Optical Fibres. Introduction. Safety precautions. For your safety. For the safety of the apparatus
 Please do not remove this manual from from the lab. It is available at www.cm.ph.bham.ac.uk/y2lab Optics Introduction Optical fibres are widely used for transmitting data at high speeds. In this experiment,
IJMIE Volume 2, Issue 5 ISSN: 2249-0558
 AN OPTIMAL DETECTION TECHNIQUE FOR MOBILE RADIO FREQENCIES M.SUCHARITHA* T.JAHNAVI* N.POORNIMA* P.KRISHNA SILPHA* K MURALI** ABSTRACT: Cellular phone technology is rapidly changing. Features like Bluetooth,
Laboratory #5: RF Filter Design
 EEE 194 RF Laboratory Exercise 5 1 Laboratory #5: RF Filter Design I. OBJECTIVES A. Design a third order low-pass Chebyshev filter with a cutoff frequency of 330 MHz and 3 db ripple with equal terminations
Ultrasound Distance Measurement
 Final Project Report E3390 Electronic Circuits Design Lab Ultrasound Distance Measurement Yiting Feng Izel Niyage Asif Quyyum Submitted in partial fulfillment of the requirements for the Bachelor of Science
Manual Analysis Software AFD 1201
 AFD 1200 - AcoustiTube Manual Analysis Software AFD 1201 Measurement of Transmission loss acc. to Song and Bolton 1 Table of Contents Introduction - Analysis Software AFD 1201... 3 AFD 1200 - AcoustiTube
Cell Phone Vibration Experiment
 Objective Cell Phone Vibration Experiment Most cell phones are designed to vibrate. But at what frequency do they vibrate? With an accelerometer, data acquisition and signal analysis the vibration frequency
TCOM 370 NOTES 99-4 BANDWIDTH, FREQUENCY RESPONSE, AND CAPACITY OF COMMUNICATION LINKS
 TCOM 370 NOTES 99-4 BANDWIDTH, FREQUENCY RESPONSE, AND CAPACITY OF COMMUNICATION LINKS 1. Bandwidth: The bandwidth of a communication link, or in general any system, was loosely defined as the width of
Tutorial about the VQR (Voice Quality Restoration) technology
 technology") Tutorial about the VQR (Voice Quality Restoration) technology Ing Oscar Bonello, Solidyne Fellow Audio Engineering Society, USA INTRODUCTION Telephone communications are the most widespread form of transport
Tutorial about the VQR (Voice Quality Restoration) technology Ing Oscar Bonello, Solidyne Fellow Audio Engineering Society, USA INTRODUCTION Telephone communications are the most widespread form of transport
Measurement of Capacitance
 Measurement of Capacitance Pre-Lab Questions Page Name: Class: Roster Number: Instructor:. A capacitor is used to store. 2. What is the SI unit for capacitance? 3. A capacitor basically consists of two
Basics of Digital Recording
 Basics of Digital Recording CONVERTING SOUND INTO NUMBERS In a digital recording system, sound is stored and manipulated as a stream of discrete numbers, each number representing the air pressure at a
Relationship between Sound Pressure and Sound Power Levels
 Relationship between Sound Pressure and Sound Power Levels 4 W. T. W. CORY Chairman of the Eurovent WG 1 Fans If we wish to know the sound power transmitted through a fan and ducting system, it is preferable
Introduction to Digital Audio
 Introduction to Digital Audio Before the development of high-speed, low-cost digital computers and analog-to-digital conversion circuits, all recording and manipulation of sound was done using analog techniques.
SR2000 FREQUENCY MONITOR
 SR2000 FREQUENCY MONITOR THE FFT SEARCH FUNCTION IN DETAILS FFT Search is a signal search using FFT (Fast Fourier Transform) technology. The FFT search function first appeared with the SR2000 Frequency
Chapter 19 Operational Amplifiers
 Chapter 19 Operational Amplifiers The operational amplifier, or op-amp, is a basic building block of modern electronics. Op-amps date back to the early days of vacuum tubes, but they only became common
S-Parameters and Related Quantities Sam Wetterlin 10/20/09
 S-Parameters and Related Quantities Sam Wetterlin 10/20/09 Basic Concept of S-Parameters S-Parameters are a type of network parameter, based on the concept of scattering. The more familiar network parameters
1. The Slotted Line. ECE 584 Microwave Engineering Laboratory Experiments. Introduction:
 ECE 584 Microwave Engineering Laboratory Experiments 1. The Slotted Line Introduction: In this experiment we will use a waveguide slotted line to study the basic behavior of standing waves and to measure
DIODE CIRCUITS LABORATORY. Fig. 8.1a Fig 8.1b
 DIODE CIRCUITS LABORATORY A solid state diode consists of a junction of either dissimilar semiconductors (pn junction diode) or a metal and a semiconductor (Schottky barrier diode). Regardless of the type,
Cable Analysis and Fault Detection using the Bode 100
 Cable Analysis and Fault Detection using the Bode 100 By Stephan Synkule 2014 by OMICRON Lab V1.3 Visit www.omicron-lab.com for more information. Contact support@omicron-lab.com for technical support.
Jitter Measurements in Serial Data Signals
 Jitter Measurements in Serial Data Signals Michael Schnecker, Product Manager LeCroy Corporation Introduction The increasing speed of serial data transmission systems places greater importance on measuring
Sound absorption and acoustic surface impedance
 Sound absorption and acoustic surface impedance CHRISTER HEED SD2165 Stockholm October 2008 Marcus Wallenberg Laboratoriet för Ljud- och Vibrationsforskning Sound absorption and acoustic surface impedance
MEASUREMENT UNCERTAINTY IN VECTOR NETWORK ANALYZER
 MEASUREMENT UNCERTAINTY IN VECTOR NETWORK ANALYZER W. Li, J. Vandewege Department of Information Technology (INTEC) University of Gent, St.Pietersnieuwstaat 41, B-9000, Gent, Belgium Abstract: Precision
Filter Comparison. Match #1: Analog vs. Digital Filters
 CHAPTER 21 Filter Comparison Decisions, decisions, decisions! With all these filters to choose from, how do you know which to use? This chapter is a head-to-head competition between filters; we'll select
RF System Design and Analysis Software Enhances RF Architectural Planning
 From April 2010 High Frequency Electronics Copyright 2010 Summit Technical Media, LLC RF System Design and Analysis Software Enhances RF Architectural Planning By Dale D. Henkes Applied Computational Sciences
Trend and Seasonal Components
 Chapter 2 Trend and Seasonal Components If the plot of a TS reveals an increase of the seasonal and noise fluctuations with the level of the process then some transformation may be necessary before doing
Developing an Isolated Word Recognition System in MATLAB
 MATLAB Digest Developing an Isolated Word Recognition System in MATLAB By Daryl Ning Speech-recognition technology is embedded in voice-activated routing systems at customer call centres, voice dialling
Public Switched Telephone System
 Public Switched Telephone System Structure of the Telephone System The Local Loop: Modems, ADSL Structure of the Telephone System (a) Fully-interconnected network. (b) Centralized switch. (c) Two-level
RightMark Audio Analyzer 6.0. User s Guide
 RightMark Audio Analyzer 6.0 User s Guide About RMAA RightMark Audio Analyzer is intended for testing the quality of analog and digital sound sections of any audio equipment, be it a sound card, portable
Automotive Ethernet Compliance Testing
 Automotive Ethernet Compliance Testing Dr. Ernst Flemming Product Manager Rohde & Schwarz GmbH & Co. KG Munich, Germany The company group at a glance ı History Established 1933 in Munich, Germany ı Type
The influence of Wi-Fi on the operation of Bluetooth based wireless sensor networks in the Internet of Things
 Faculty of Electrical Engineering, Mathematics & Computer Science The influence of Wi-Fi on the operation of Bluetooth based wireless sensor networks in the Internet of Things Jermain C. Horsman B.Sc.