LESSONS FOR LEARNING FOR THE COMMON CORE STATE STANDARDS IN MATHEMATICS
|
|
|
- Chloe Owens
- 7 years ago
- Views:
Transcription
1 GRADE 8 LESSONS FOR LEARNING FOR THE COMMON CORE STATE STANDARDS IN MATHEMATICS PUBLIC SCHOOLS OF NORTH CAROLINA State Board of Education Department of Public Instruction Word Document versions of the documents available at XXXXXXXXXX

2 STATE BOARD OF EDUCATION The guiding mission of the North Carolina State Board of Education is that every public school student will graduate from high school, globally competitive for work and postsecondary education and prepared for life in the 21st Century. WILLIAM C. HARRISON Chairman :: Fayetteville WAYNE MCDEVITT Vice Chair :: Asheville WALTER DALTON Lieutenant Governor :: Rutherfordton JANET COWELL State Treasurer :: Raleigh Jean W. Woolard Plymouth REGINALD KENAN Rose Hill KEVIN D. HOWELL Raleigh SHIRLEY E. HARRIS Troy CHRISTINE J. GREENE High Point JOHN A. TATE III Charlotte ROBERT TOM SPEED Boone MELISSA E. BARTLETT Roxboro PATRICIA N. WILLOUGHBY Raleigh June St. Clair Atkinson, Ed.D., State Superintendent 301 N. Wilmington Street :: Raleigh, North Carolina In compliance with federal law, NC Public Schools administers all state-operated educational programs, employment activities and admissions without discrimination because of race, religion, national or ethnic origin, color, age, military service, disability, or gender, except where exemption is appropriate and allowed by law. Inquiries or complaints regarding discrimination issues should be directed to: Dr. Rebecca Garland, Chief Academic Officer :: Academic Services and Instructional Support 6368 Mail Service Center, Raleigh, NC :: Telephone: (919) :: Fax: (919) Visit us on the Web :: M0910

3 Eighth Grade Standards 1. Formulating and reasoning about expressions and equations, including modeling an assoc-iation in bivariate data with a linear equation, and solving linear equations and systems of linear equations Students use linear equations and systems of linear equations to represent, analyze, and solve a variety of problems. Students recognize equations for proportions (y/x = m or y = mx) as special linear equations (y = mx + b), understanding that the constant of propor-tionality (m) is the slope, and the graphs are lines through the origin. They understand that the slope (m) of a line is a constant rate of change, so that if the input or x-coordinate changes by an amount A, the output or y-coordinate changes by the amount m A. Students also use a linear equation to describe the association between two quantities in bivariate data (such as arm span vs. height for students in a classroom). At this grade, fitting the model, and assessing its fit to the data are done informally. Interpreting the model in the context of the data requires students to express a relationship between the two quantities in question and to interpret components of the relationship (such as slope and y-intercept) in terms of the situation. Students strategically choose and efficiently implement procedures to solve linear equations in one variable, under-standing that when they use the properties of equality and the concept of logical equivalence, they maintain the solutions of the original equation. Students solve systems of two linear equat-ions in two variables and relate the systems to pairs of lines in the plane; these intersect, are parallel, or are the same line. Students use linear equations, systems of linear equations, linear functions, and their understanding of slope of a line to analyze situations and solve problems. 2. grasping the concept of a function and using functions to describe quantitative relationships Students grasp the concept of a function as a rule that assigns to each input exactly one output. They understand that functions describe situations where one quantity determines another. They can translate among representations and partial representations of functions (noting that tabular and graphical representations may be partial representations), and they describe how aspects of the function are reflected in the different representations. 3. analyzing two- and three-dimensional space and figures using distance, angle, similarity, and congruence, and understanding and applying the Pythagorean Theorem Students use ideas about distance and angles, how they behave under translations, rotations, reflections, and dilations, and ideas about congruence and similarity to describe and analyze twodimensional figures and to solve problems. Students show that the sum of the angles in a triangle is the angle formed by a straight line, and that various configurations of lines give rise to similar triangles because of the angles created when a transversal cuts parallel lines. Students understand the statement of the Pythagorean Theorem and its converse, and can explain why the Pythagorean Theorem holds, for example, by decomposing a square in two different ways. They apply the Pythagorean Theorem to find distances between points on the coordinate plane, to find lengths, and to analyze polygons. Students complete their work on volume by solving problems involving cones, cylinders, and spheres. Mathematical Practices 1. Make sense of problems and persevere in solving them. 2. Reason abstractly and quantitatively. 3. Construct viable arguments and critique the reasoning of others. 4. Model with mathematics. 5. Use appropriate tools strategically. 6. Attend to precision. 7. Look for and make use of structure. 8. Look for and express regularity in repeated reasoning. The Number System Know that there are numbers that are not rational, and approximate them by rational numbers. 8.NS.1 Understand informally that every number has a decimal expansion; the rational numbers are those with decimal expansions that terminate in 0s or eventually repeat. Know that other numbers are called irrational. 8.NS.2 Use rational approximations of irrational numbers to compare the size of irrational numbers, locate them approximately on a number line diagram, and estimate the value of expressions (e.g., p2). For example, by truncating the decimal expansion of 2, show that 2 is between 1 and 2, then between 1.4 and 1.5, and explain how to continue on to get better approximations. EXPRESSIONS AND EQUATIONS Work with radicals and integer exponents. 8.EE.1 Know and apply the properties of integer exponents to generate equivalent numerical expressions. For example, = 3 3 = 1/3 3 = 1/ EE.2 Use square root and cube root symbols to represent solutions to equations of the form x 2 = p and x 3 = p, where p is a positive rational number. Evaluate square roots of small perfect squares and cube roots of small perfect cubes. Know that 2 is irrational. 8.EE.3 Use numbers expressed in the form of a single digit times an integer power of 10 to estimate very large or very small quantities, and to express how many times as much one is than the other. For example, estimate the population of the United States as and the population of the world as , and determine that the world population is more than 20 times larger. 8.EE.4 Perform operations with numbers expressed in scientific notation, including problems where both decimal and scientific notation are used. Use scientific notation and choose units of appropriate size for measurements of very large or very small quantities (e.g., use millimeters per year for seafloor spreading). Interpret scientific notation that has been generated by technology. Understand the connections between proportional relationships, lines, and linear equations. 8.EE.5 Graph proportional relationships, interpreting the unit rate as the slope of the graph. Compare two different proportional relationships represented in different ways. For example, compare a distance-time graph to a distance-time equation to determine which of two moving objects has greater speed. 8.EE.6 Use similar triangles to explain why the slope m is the same between any two distinct points on a non-vertical line in the coordinate plane; derive the equation y = mx for a line through the origin and the equation y = mx + b for a line intercepting the vertical axis at b. Analyze and solve linear equations and pairs of simultaneous linear equations. 8.EE.7 Solve linear equations in one variable. a. Give examples of linear equations in one variable with one solution, infinitely many solutions, or no solutions. Show which of these possibilities is the case by successively transforming the given equation into simpler forms, until an equivalent equation of the form x = a, a = a, or a = b results (where a and b are different numbers). b. Solve linear equations with rational number coefficients, including equations whose solutions require expanding expressions using the distributive property and collecting like terms. 8.EE.8 Analyze and solve pairs of simultaneous linear equations. a. Understand that solutions to a system of two linear equations in two variables correspond to points of intersection of their graphs, because points of intersection satisfy both equations simultaneously. b. Solve systems of two linear equations in two variables algebraically, and estimate solutions by graphing the equations. Solve simple cases by inspection. For example, 3x + 2y = 5 and 3x + 2y = 6 have no solution because 3x + 2y cannot simultaneously be 5 and 6. c. Solve real-world and mathematical problems leading to two linear equations in two variables. For example, given coordinates for two pairs of points, determine whether the line through the first pair of points intersects the line through the second pair.
 as special linear equations (y = mx + b), understanding that the constant of propor-tionality (m) is the slope, and the graphs are")
4 Functions Define, evaluate, and compare functions. 8.F.1 Understand that a function is a rule that assigns to each input exactly one output. The graph of a function is the set of ordered pairs consisting of an input and the corresponding output. (Note: Function notation is not required in Grade 8.) 8.F.2 Compare properties of two functions each represented in a different way (algebraically, graphically, numerically in tables, or by verbal descriptions). For example, given a linear function represented by a table of values and a linear function represented by an algebraic expression, determine which function has the greater rate of change. 8.F.3 Interpret the equation y = mx + b as defining a linear function, whose graph is a straight line; give examples of functions that are not linear. For example, the function A = s 2 giving the area of a square as a function of its side length is not linear because its graph contains the points (1,1), (2,4) and (3,9), which are not on a straight line. Use functions to model relationships between quantities. 8.F.4 Construct a function to model a linear relationship between two quantities. Determine the rate of change and initial value of the function from a description of a relationship or from two (x, y) values, including reading these from a table or from a graph. Interpret the rate of change and initial value of a linear function in terms of the situation it models, and in terms of its graph or a table of values. 8.F.5 Describe qualitatively the functional relationship between two quantities by analyzing a graph (e.g., where the function is increasing or decreasing, linear or nonlinear). Sketch a graph that exhibits the qualitative features of a function that has been described verbally. Geometry Understand congruence and similarity using physical models, transparencies, or geometry software. 8.G.1 Verify experimentally the properties of rotations, reflections, and translations: a. Lines are taken to lines, and line segments to line segments of the same length. b. Angles are taken to angles of the same measure. c. Parallel lines are taken to parallel lines. 8.G.2 Understand that a two-dimensional figure is congruent to another if the second can be obtained from the first by a sequence of rotations, reflections, and translations; given two congruent figures, describe a sequence that exhibits the congruence between them. 8.G.3 Describe the effect of dilations, translations, rotations, and reflections on two-dimensional figures using coordinates. 8.G.4 Understand that a two-dimensional figure is similar to another if the second can be obtained from the first by a sequence of rotations, reflections, translations, and dilations; given two similar twodimensional figures, describe a sequence that exhibits the similarity between them. 8.G.5 Use informal arguments to establish facts about the angle sum and exterior angle of triangles, about the angles created when parallel lines are cut by a transversal, and the angle-angle criterion for similarity of triangles. For example, arrange three copies of the same triangle so that the sum of the three angles appears to form a line, and give an argument in terms of transversals why this is so. Understand and apply the Pythagorean Theorem. 8.G.6 Explain a proof of the Pythagorean Theorem and its converse. 8.G.7 Apply the Pythagorean Theorem to determine unknown side lengths in right triangles in real-world and mathematical problems in two and three dimensions. 8.G.8 Apply the Pythagorean Theorem to find the distance between two points in a coordinate system. Solve real-world and mathematical problems involving volume of cylinders, cones, and spheres. 8.G.9 Know the formulas for the volumes of cones, cylinders, and spheres and use them to solve real-world and mathematical problems. Statistics and Probability Investigate patterns of association in bivariate data. 8.SP.1 Construct and interpret scatter plots for bivariate measurement data to investigate patterns of association between two quantities. Describe patterns such as clustering, outliers, positive or negative association, linear association, and nonlinear association. 8.SP.2 Know that straight lines are widely used to model relationships between two quantitative variables. For scatter plots that suggest a linear association, informally fit a straight line, and informally assess the model fit by judging the closeness of the data points to the line. 8.SP.3 Use the equation of a linear model to solve problems in the context of bivariate measurement data, interpreting the slope and intercept. For example, in a linear model for a biology experiment, interpret a slope of 1.5 cm/hr as meaning that an additional hour of sunlight each day is associated with an additional 1.5 cm in mature plant height. 8.SP.4 Understand that patterns of association can also be seen in bivariate categorical data by displaying frequencies and relative frequencies in a two-way table. Construct and interpret a two-way table summarizing data on two categorical variables collected from the same subjects. Use relative frequencies calculated for rows or columns to describe possible association between the two variables. For example, collect data from students in your class on whether or not they have a curfew on school nights and whether or not they have assigned chores at home. Is there evidence that those who have a curfew also tend to have chores?
.")
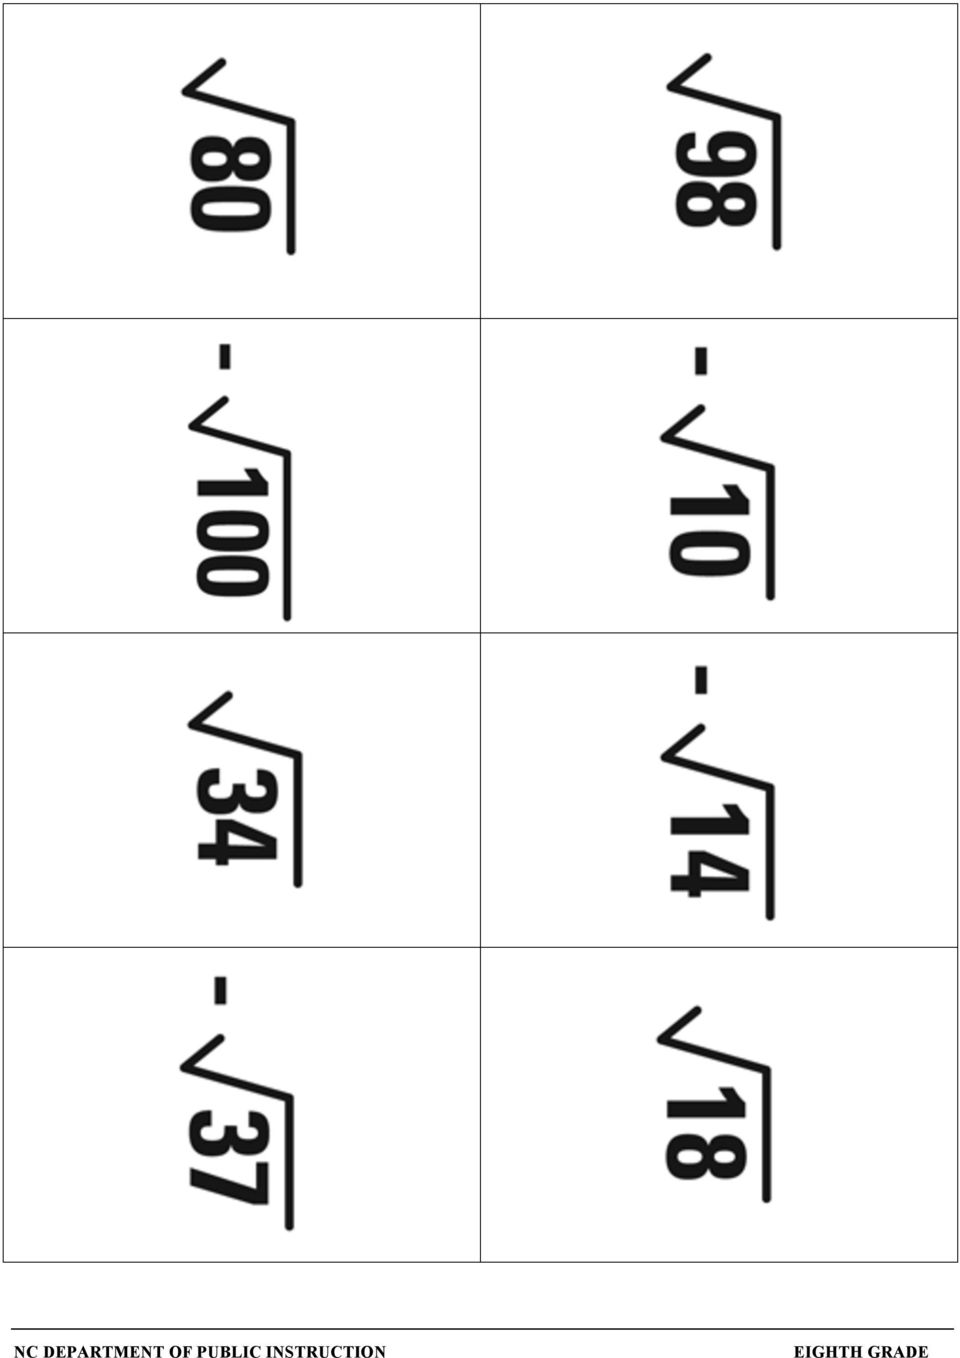
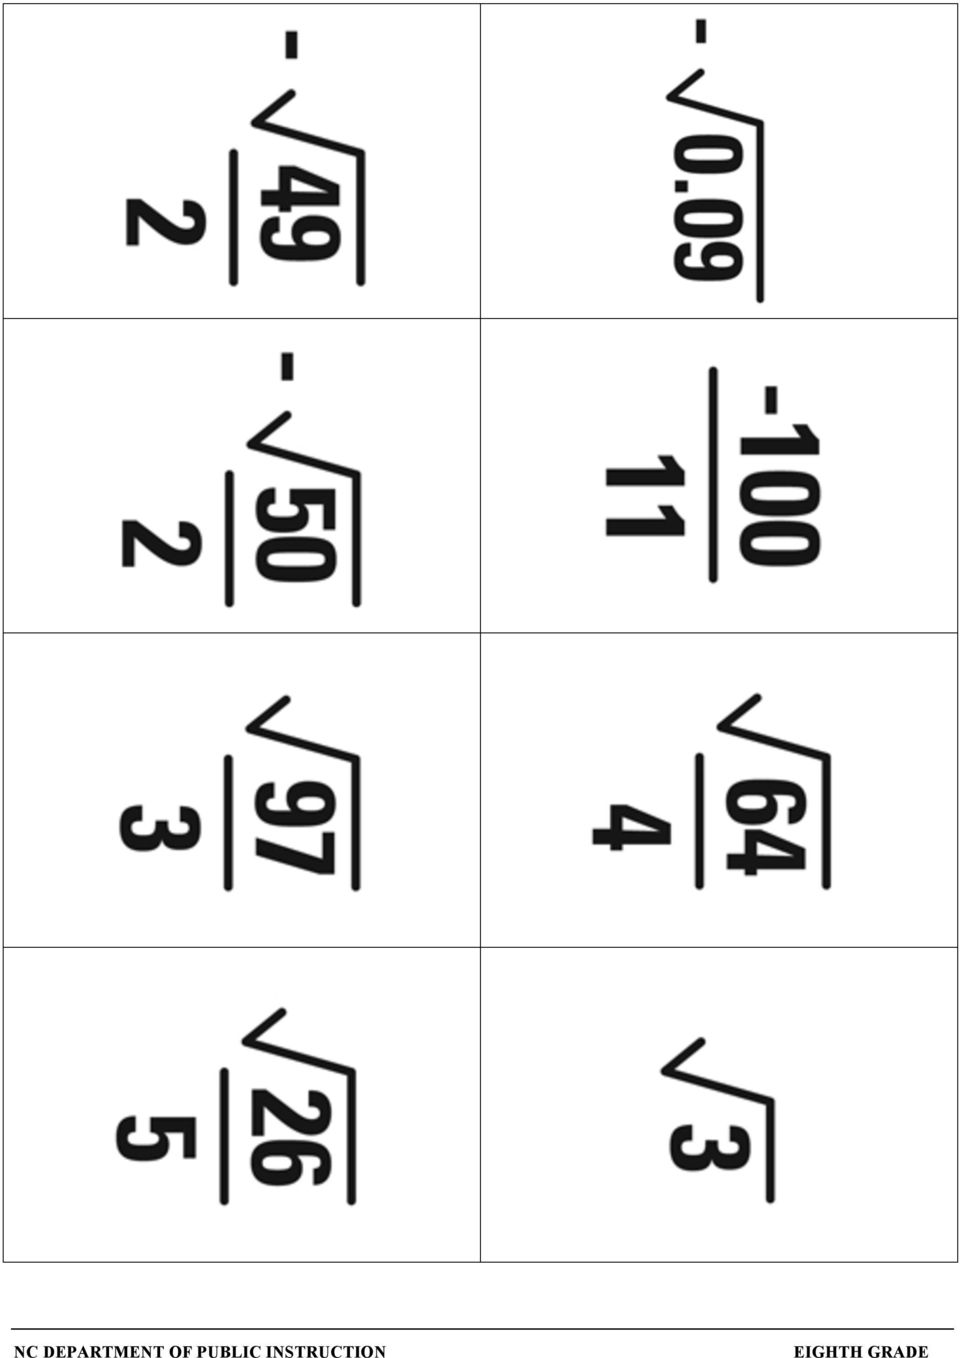
5 Real Number Race Common Core Standard: Know that there are numbers that are not rational, and approximate them by rational numbers. 8.NS.1 Know that numbers that are not rational are called irrational. Understand informally that every number has a decimal expansion; for rational numbers show that the decimal expansion repeats eventually, and convert a decimal expansion which repeats eventually into a rational number. Additional/Supporting Standard(s): 8.NS.2 Standards for Mathematical Practice: 1. Make sense of problems and persevere in solving them 2. Reason abstractly and quantitatively 3. Construct viable arguments and critique the reasoning of others 5. Use appropriate tools strategically 6. Attend to precision Student Outcomes: I can write a decimal approximation for an irrational number to a given decimal place I can convert either repeating or terminal decimals into a fraction I can explain the difference between a rational and an irrational number. Materials: One copy of the real number hexagon per team Spinner or cube Two different colors of pencils for each student Advance Preparation: Make copies of the real number hexagon Prepare the spinner or cube Put together colored pencils of different colors according to the number of students playing together, insuring that each student will use two different colors of pencils Directions: 1. S/he chooses one of their colors for rational and one for irrational 2. On each player s first turn, s/he will spin the spinner and get a real number, irrational number, rational number or lose a turn. 3. S/he colors a number on the hexagon that fits the category that they spun. If S/he spins a real number they can color either rational or irrational. 4. Students take turns with the spinner and marking their numbers. 5. The winner is the first player to get four in a diagonal row of one color. If a player colors an incorrect circle, the opponents should challenge her/him; a wrong move has the penalty of losing a spin and the color should be erased.
: 8.NS.2 Standards for Mathematical Practice: 1. Make sense of problems and persevere in solving them 2. Reason abstractly and quantitatively 3.")
6 Questions to Pose: Before: What are the characteristics of a rational number? What are the characteristics of an irrational number? What is the definition of real numbers? During: Does it matter which color you use for the real number choice? What strategy did you use to determine which number to choose? Are all square roots irrational? After: What strategies did people in your group use to choose their numbers? Were there numbers that you disagreed with each other about their category and why? If you could remodel the task, what would you do to it? Possible Misconceptions/Suggestions: Possible Misconceptions Students assume longer decimals are irrational Students do not recognize Pi as being irrational; the value is 3.14 (terminating) Suggestions Work with rational numbers other than those that are common fractions. Special Notes: This activity can be used with various sized groups. Extension of this can be done by modifying the spinner to include natural numbers, whole numbers, etc. Categories can be put on a cube or students may roll a fair number cube with the following designations: 1 Rational 2 Irrational 3 Irrational 4 Rational 5 Lose a turn 6 Real Solutions: NA

7

8 Spinner for Real Number Race Real Rational Irrational Irrational Rational Lose A Turn

9 The Laundry Problem Common Core Standards: Know that there are numbers that are not rational, and approximate them by rational numbers. 8.NS.2 Use rational approximations of irrational numbers to compare the size of irrational numbers, locate them approximately on a number line diagram, and estimate the value of expressions (e.g., π 2 ). For example, by truncating the decimal expansion of 2, show that 2 is between 1 and 2, then between 1.4 and 1.5, and explain how to continue on to get better approximations. Additional/supporting standards: 8.NS.1 Standards for Mathematical Practice: 1. Make sense of problems and persevere in solving them. 2. Reason abstractly and quantitatively. 3. Construct viable arguments and critique the reasoning of others. 4. Model with mathematics. 5. Use appropriate tools strategically. 6. Attend to precision. Student Outcomes: I can explain the difference in a rational and an irrational number I can place rational and irrational numbers on a number line Materials: White paper Markers, crayons, colored pencils String or clothesline Glue sticks or tape Clothespins Number choices page Advance Preparation: Teacher should copy number choices and cut apart and place in a bag for students to choose from. Teacher should hang the string or clothesline in the front of the classroom and attach the 0 to the center of the clothesline. Depending on the level of ability of the students, the teacher can also add the integers evenly spaced. Students should know the definition of rational and irrational numbers and how to determine which category a number is in

10 Directions: Teacher will introduce the activity with a quick review of rational and irrational numbers. After this, explain to the students that they will be creating special laundry to hang on the clothesline. Rational numbers will be placed on tee shirts and irrational numbers on pants. Each student chooses a number from the bag. Allow students time to create and cut out either a shirt or a pair of pants depending on their number. As students are working, the teacher should circulate around the room ask students to justify their clothing choice. Give students time to decorate their clothing piece and glue the number on the front. Once students have finished, it is time to hang the laundry. Allow students to come and pin their laundry items on the clothesline. As more clothing is added, students may need to move laundry to accurately place theirs on the line. While students are hanging out the laundry, allow student input on the accuracy of the clothesline. When all the laundry has been placed on the clothesline, lead a student discussion on the accuracy of the placement, allowing students to rearrange the clothing if necessary. Questions to Pose: Before: What characteristics make a number rational? What characteristics make a number irrational? How do you determine whether your number is rational or irrational? During: What mathematics is used to make this determination? What do you do if numbers are very close together to determine their placement on the clothesline? What steps do you take to place negative numbers on the clothesline? After: How do you check to see if the laundry is placed correctly? Can you add another shirt or pants to the left or right of the clothesline? Possible Misconceptions/Suggestions: Possible misconceptions Students assume longer decimals are irrational Students reverse the order of negative numbers Students do not recognize Pi as being irrational; the value is 3.14 (terminating) Suggestions Work with rational numbers other than those that are common fractions. Relate greater than and less than to the direction you travel on the number line Special Notes: To speed up the creation of shirts and pants, the teacher could create a template and give each student a handout with both patterns. If the class is large, smaller groups can work on several clotheslines and then check each others. Number sets be adjusted according to the ability of the students. Students need to have an understanding of perfect squares and other roots as well. Calculators may be needed to evaluate radicals. Solutions: NA

11

12

13
14
15

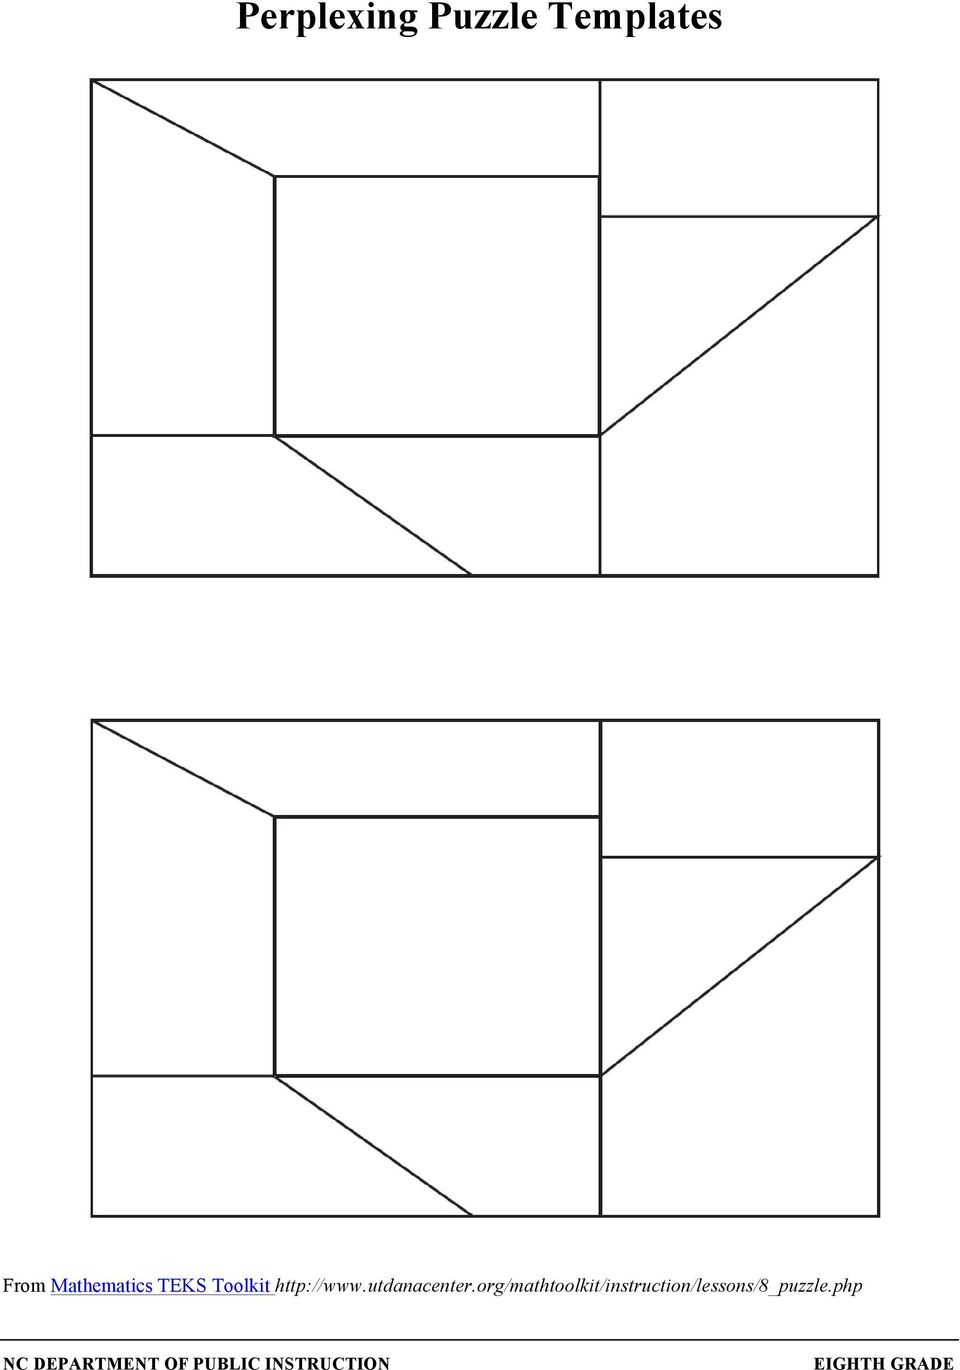
16 Perplexing Puzzle Common Core Standards 8.EE.5 Graph proportional relationships, interpreting the unit rate as the slope of the graph. Compare two different proportional relationships represented in different ways. For example, compare a distance-time graph to a distance-time equation to determine which of two moving objects has greater speed. Student Outcomes: I can dilate figures using a given ratio I can graph proportional relationships I can compare properties of a function represented in different ways I can interpret the equation of a linear function Additional/Supporting Standards: 8.F.1, 8.F.2, 8.F.3, 8.F.4, 8.G.3 Standards for Mathematical Practice: 1. Make sense of problems and persevere in solving them. 3. Construct viable arguments and critique the reasoning of others. 4. Model with mathematics. 6. Attend to precision. 7. Look for and make use of structure. 8. Look for and express regularity in repeated reasoning. Materials: Puzzle (one per group) Activity Guide handout (one per group) Activity 1 & 2 handout (one per student) Colored construction paper (one per group) Advance Preparation: Puzzle pieces must be cut out and placed in envelopes for each group of students. Before doing this task, students should be familiar with the concept of slope. Directions for Activity: Students are going to make a larger puzzle the same shape as the smaller puzzle, so that the edge of a piece that measures 4 cm in the old puzzle will measure 6 cm in the new puzzle. 1. Students work in groups. Each member of the group selects one or more of the pieces of the puzzle. The group works together to arrange the pieces to make a rectangle. 2. The task of each group is to make a puzzle larger than the one in the envelope using this clue: A side measuring 4 cm in the original puzzle must measure 6 cm in the larger puzzle. 3. Each student of the group works independently to enlarge his or her puzzle piece using one of the four colored sheets of construction paper.

17 4. When everyone in the group has completed making his or her enlargement, the group works together again to arrange the larger pieces to complete the puzzle. Students glue the puzzle on the light-colored piece of construction paper. If any pieces of the enlarged puzzle do not fit, students should discuss the strategies used to enlarge each piece. 5. Students will follow the Activity guide to complete the task. Questions to Pose: Before the Task: What do you know about similar figures? How could a ratio be related to similar figures? What is the meaning of scale factor? What strategies and/or tools could you use to find the missing puzzle dimensions? How will you know if your puzzle has been dilated correctly? During the Task: How did you create your enlarged shape? Describe the new shape you created. How do the two shapes compare? What do you notice about the angles in the original shape and the angles in the enlarged shape? How do you know the two shapes are similar? What has to be true for the shapes to be mathematically similar? By examining your process of enlarging the figure, can you develop an equation that can be used to find dimensions of any puzzle piece? What do your variables in the equation represent? What patterns do you notice in the table in Activity 1? What proportional relationship do you notice? After the Task: What is the scale factor used to enlarge the original puzzle? What do you notice about your graph in Activity 2? What does the constant ratio in the graph represent? What is the slope of the line formed when graphing your table on the coordinate plane? If you were to continue the graph, what might you observe? What is the relationship between the constant of proportionality, the slope and the scale factor? Possible Misconceptions/Suggestions: Possible Misconceptions Students are likely to add 2 to 4 to get 6 and likewise add 2 to each measurement to get the larger measurement. Suggestions Students should notice this error when piecing the new puzzle together. Do not allow students to cut off excess of puzzle pieces that do not fit, rather, have the group work together to make a new piece that will fit.

18 Special Notes: What students can learn from this lesson: The given ratio of 6:4 (image : pre-image)simplifies to 3:2 and can also be written as 3/2. The scale factor can be found by dividing the new length of a dilated figure by the original length (image/pre-image). In this task, the scale factor is 6/4 = 1.5. This should be discovered with the function table if not already discovered when making the new puzzle piece(s). Students need to recognize that 3/2 is equivalent to 1.5 and that scale factor is also a ratio even when written in decimal form. If the puzzle has been correctly dilated and the points are plotted correctly, that ratio will always be 3:2 or 3/2 for this task. Thus the function also has a slope of 3/2. Students should note that the plotted point (4, 6) represents the original length of 4 and the corresponding new length of 6.the y value is always 1.5 times larger than the x value. y/x= 6/4 = 1.5. Each correctly plotted point will have that same constant of proportionality. Solutions: Students should discover that the ratio, scale factor, slope, and rate-of-change are all 1.5 or 3/2 while completing the activity. Adapted from Mathematics TEKS Toolkit

19 Perplexing Puzzle Activity Guide We are going to make a larger puzzle the same shape as the smaller puzzle, so that the edge of a piece that measures 4 cm on the old puzzle will measure 6 cm in the new puzzle. Directions: 1. Assign a group leader. The group leader will ensure students stay on task, turn in work, and raise hand to ask questions. 2. Open the envelope containing the puzzle pieces and put it together. When completed, the puzzle will be a rectangle. (Use all the pieces.) 3. Sketch the completed puzzle in the area below. 4. Discuss how your group is going to enlarge each piece so that the edge of a piece that measures 4 cm will now measure 6 cm in the new puzzle. 5. Divide up the puzzle pieces so that each group member has at least one piece. 6. Enlarge your piece(s) independently based on the information given. 7. Once all individual pieces have been enlarged, use those pieces to put the puzzle back together. The puzzle should fit together perfectly, if not, you must make a new piece to replace those you think are incorrect. 8. Glue your enlarged puzzle to a piece of construction paper. 9. Complete Activity 1 as individuals. 10. Discuss Activity 1 and complete Activity 2 with group members. Adapted from Mathematics TEKS Toolkit

20 Perplexing Puzzle Templates From Mathematics TEKS Toolkit
21 ACTIVITY 1 Directions: Complete the table and answer the questions. Original Length Scale Factor New Length x y 1. What is the ratio of new length to original length for each row in the table? What does this ratio represent? 2. If a piece of the original puzzle had a side with length 45 cm, what would be the length of the side of the new puzzle piece? 3. If a piece of the original puzzle had a side with length 22.5 cm, what would be the length of 4. the side of the new puzzle piece? 5. If the new puzzle piece has a length of 22.5 cm, what was the length of the side of the original puzzle piece? Adapted from Mathematics TEKS Toolkit
22 ACTIVITY 2 Directions: Plot the points from the table in Activity 1 on the graph. Next, each group member will place a point on the graph representing the measure of one side of the original length of a puzzle piece as the x-value and the measure of the corresponding side of the new length of a puzzle piece as the y-value (original length, new length). Do this for each puzzle piece so there will be 8 new points on your graph. New Length Original Length 1. Describe the graph. 2. What is the slope of the line? 3. What is the equation of the line written in slope-intercept form? 4. How are the dilation, table, graph, and equation of the line related to each other? 5. Describe similarities among ratio, constant of proportionality, scale factor, slope, and rate-of-change? Adapted from Mathematics TEKS Toolkit
23 Cookie Calorie Conundrum Common Core Standard: Analyze and solve linear equations and pairs of simultaneous linear equations. 8.EE.8 Analyze and solve pairs of simultaneous linear equations. Standards for Mathematical Practice: 1. Make sense of problems and persevere in solving them. 2. Reason abstractly and quantitatively. 4. Model with mathematics. 6. Attend to precision. 7. Look for and make use of structure. Student Outcomes: I can solve systems of two linear equations with a model. I can solve systems of two linear equations algebraically. I can solve real-world problems leading to two linear equations in two variables. Materials: Warm Up Cookie Calorie Conundrum introduction (display for students to see) Cookie Calorie Conundrum Handout (one per student) Chocolate Sandwich Cookies (optional) Advance Preparation: Students must know how to solve multi-step equations. Directions: 1. Begin the task with the warm up. Before beginning the task, discuss strategies used to determine the unknown values. 2. Show students the Cookie Calorie Conundrum Introduction scenario. 3. Have students read the scenario and discuss possible ways to use the given information to solve the problem. Questions to Pose: Before: What strategies were successful or unsuccessful when working on the warm up? What was the key to solving the warm up? Were there particular equations that gave away the answers when used together? During: What do the nutritional facts tell you? How can you make the nutritional facts of the two cookie types easier to compare? How might the nutritional information help your classmate determine the number of calories she consumed?
24 Why is the difference between the two types of cookies important information? What do the variables x and y represent? Can you explain your equations without using the variables? After: If you were given the two equations representing both types of cookie, how would you have approached solving for x and y?: 2x + 2y = 68 and x + 2y = 52 How can visuals help to solve a system of equations? Often times we are too quick to use algebra to solve a system without looking for other representations. What are some ways to represent a system of equations? How does the warm up relate to the task? Possible Misconceptions/Suggestions: Possible Misconceptions The double cookie filling is actually two single fillings Suggestions Compare/contrast the two images used in the warm up and throughout the task. Not making a connection between what the variables represent. The task explicitly tells students what x and y represent but it is important that students relay that information through discussion of the algebra. Special Notes: When solving a system of equations, 8 th grade students are only expected to solve algebraically through substitution. With equations like the two used in this lesson, it is acceptable to introduce elimination because no multiplication is required before adding/subtracting. 2x + 2y = 68 (-) x + 2y = 52 x = 16 Solutions: WARM UP What are the values? = 32 = 16 = 18 HANDOUT See Key
25 Warm Up Directions: The sums of combinations of three different figures are shown in the table below. What is the value of each figure? What are the values? = = =
26 Cookie Calorie Conundrum Introduction Your math teacher wants you to keep a precise record of the number of calories you consume each day. Your classmate has a strange habit of twisting the top wafer off a chocolate sandwich cookie and only eating the white filling and bottom wafer. After throwing away the top wafer, she realized she needs to know how many calories she consumed. In attempt to help your classmate determine the number of calories in only the icing and bottom wafer, you searched the internet but could not find the answer. You did however find the Nutritional Facts for chocolate sandwich cookies and the Nutritional Facts for chocolate sandwich cookies with double the amount of white filling. Chocolate Sandwich Cookie with white filling. Nutrition Facts Serving size 3 cookies Amount Per Serving Calories 156 Chocolate Sandwich Cookie with double the amount of white filling. Nutrition Facts Serving size 2 cookies Amount Per Serving Calories 136 What do the Nutritional Facts tell you? How might this help your classmate figure out how many calories she consumed?
27 Cookie Calorie Conundrum Handout 1. How many calories are in just one of each type of cookie? Calories: Calories: 2. What causes the difference in the amount of calories between the two types of cookies? What is the difference in calories? 3. Write an explanation of how the sums below describe the two types of cookies? = 68 cal. = 52 cal. 4. Let x represent the calories in a single white filling and y represents the calories in a single wafer. Write an equation that models the total amount of calories in each type of cookie. Cookie with double filling equation: Cookie with single filling equation: 5. What are the values? Explain how you got your answers. = = =
28 KEY Cookie Calorie Conundrum Handout 1. How many calories are in just one of each type of cookie? Calories: 52 Calories: What causes the difference in the amount of calories between the two types of cookies? What is the difference in calories? The difference in calories is attributed to the differences in the white filling. The difference in calories is = Write an explanation of how the sums below describe the two types of cookies? Answers will vary = 68 cal. = 52 cal. 4. Let x represent the calories in a single white filling and y represents the calories in a single chocolate wafer. Write an equation that models the total amount of calories in each type of cookie. Cookie with double filling equation: 2x + 2y = 68 Cookie with single filling equation: x + 2y = What are the values of x and y? Explain how you got your answers. x=16 (calories in a single white filling) y=18 (calories in a single chocolate wafer)
29 Bow Wow Barkley Common Core Standards: 8.F.4 XXXX Student Outcomes: I can create a function to model a linear relationship between two quantities. I can determine the rate of change and initial value of a function from a description and by reading ordered pairs from a table or graph. I can describe a functional relationship between two quantities by analyzing tables and graphs. Materials: Bow Wow Barkley Student Handout Pattern Blocks Graphing Calculators (or graph paper and colored pencils) Advance Preparation: Large baggies or containers of pattern blocks can be created ahead of time to ensure that each small group of students has enough pattern blocks to complete the task. Each baggie or container will need a minimum of the following: 8 blue parallelograms, 22 yellow hexagons, 20 red trapezoids, 8 orange squares, 10 tan rhombi. Bookmark the virtual manipulative website on the desktop of classroom computer or Smartboard: Directions for Activity: Teacher will introduce the task by asking students if they have ever noticed how quickly puppies grow, particularly compared to humans. Don t belabor this discussion but use it to provide a segue into the Bow Wow Barkley task. Distribute the Bow Wow Barkley sheets and use the virtual manipulative website with pattern blocks to model how Bow Wow Barkley is growing from week one to week two. Ask students to share the patterns they notice. Each small group should have access to pattern blocks and based on the patterns observed, instruct them to build Bow Wow Barkley at Weeks 2 and 3 and complete the chart on their handout. As groups complete the chart, monitor their progress and instruct them to continue with the task by completing the remainder of the handout. Questions to Pose: What patterns did you notice with each shape as Bow Wow Barkley grew each week? How can you predict how many shapes will be needed to build Barkley at any given week? What relationships exist between each shape and Bow Wow Barkley s age in weeks? Given a verbal description of a function, how can we identify the y-intercept of its graph? Given a verbal description of a function, how can we identify the rate of change of its graph?
30 Possible Misconceptions/Suggestions: Possible Misconceptions Students cannot determine the number of blocks needed in chart for weeks 20 and 30 without using a recursive pattern. Students reverse the rate of change and the intercept when writing the explicit equations in problem #4. Students struggle with describing a change in the graph given only a verbal description (answering the question in Graph Analysis section). Suggestions Help students look for a relationship between the week number and the corresponding number of blocks. Refer students back to question #3 where an explanation of how the equations are derived is provided. Highlight the repeated additive pattern and why it is expressed with multiplication in the equation. Encourage students to graph the original function and then graph the new changed function on the same graph so the changes in graphs can easily be observed. Special Notes: If graphing calculators are not available, the task can be completed without them. The items under section IV can be answered by using the equations created in questions 3 and 4 in section III. Using a different colored pencil for each graph is helpful if students are going to create graphs by hand. Solutions: Answer Key is available at the end of the activity sheets.
31 Bow Wow Barkley Bow Wow Barkley was born the smallest pup of all of his five brothers and four sisters. But Bow Wow Barkley soon became the biggest brown beagle in the litter. Just look at how quickly Bow Wow Barkley grew in a few short weeks. Week 0 Week 1 I. Build Bow Wow Barkley at Weeks 2 & 3 using pattern blocks then draw a picture of Bow Wow Barkley at Weeks 2 & 3. II. Record in the following table the number of total blocks used to create Barkley at various weeks. Then record the number of hexagons used in the pictures, the number of trapezoids and then the number of small, tan rhombi (tail only). Week # Total blocks Hexagons Trapezoids Rhombi III. Table Analysis 1. What was the original number of blocks used to create Bow Wow Barkley? 2. As each week increases, what patterns do you observe with the total number of blocks? 3. An equation can be written to represent the number of total blocks used to create Bow Wow Barkley at any week. y = change x + initial amount y = x +
32 4. Write an equation that represents the different types of blocks used to create Bow Wow Barkley as the weeks increase. Hexagons: y = x + Trapezoids: y = x + Rhombi: y = x + IV. Graphs Input into your calculator the equations that represent the total number of blocks, hexagons, trapezoids and rhombi used to create Bow Wow Barkley as the weeks increase. A. Use the table on the calculator to determine the number of blocks needed to create a picture of Bow Wow Barkley when he is 1 year old. B. How old will Bow Wow Barkley be when his picture contains 75 hexagons? C. How many trapezoids are needed to create Bow Wow Barkley when he is 38 weeks old? D. How old will Bow Wow Barkley be when his picture contains 100 rhombi? V. Graph Analysis 1. If Bow Wow Barkley s picture originally consisted of 6 blocks instead of 10, with his growth rate remaining the same, how would the graph representing the total number of blocks change? 2. If the original picture had 10 blocks but increased by 8 blocks each week versus the current 5 blocks, how would the graph change? 3. If Bow Wow Barkley s original picture consisted of 4 hexagons, with the growth rate remaining the same, how would the graph representing the number of hexagons change? 4. If the original picture of Bow Wow Barkley had 2 trapezoids but it increased by 4 trapezoids each week versus the current 2 trapezoids, keeping all other shapes the same, how would the graph change? 5. Write the equation of a graph that represents the change in Bow Wow Barkley s tail if his tail was originally 3 rhombi long. 6. Compare this equation with that of his original tail. How do the graphs differ? 7. How does the initial value affect the function?
33 8. How does the growth pattern affect the function?
34 Bow Wow Barkley ANWSER KEY Bow Wow Barkley was born the smallest pup of all of his five brothers and four sisters. But Bow Wow Barkley soon became the biggest brown beagle in the litter. Just look at how quickly Bow Wow Barkley grew in a few short weeks. Week 0 Week 1 I. Build Bow Wow Barkley at Weeks 2 & 3 using pattern blocks then draw a picture of Bow Wow Barkley at Weeks 2 & 3. II. Record in the following table the number of total blocks used to create Barkley at various weeks. Then record the number of hexagons used in the pictures, the number of trapezoids and then the number of small, tan rhombi (tail only). Week # Total blocks Hexagons Trapezoids Rhombi III. Table Analysis 1. What was the original number of blocks used to create Bow Wow Barkley? As each week increases, what patterns do you observe with the total number of blocks? Total blocks increase by 5 each week. 3. An equation can be written to represent the number of total blocks used to create Bow Wow Barkley at any week. Blocks = change in blocks per week + initial # of blocks Output = change input + initial amount y = change x + initial amount y = 5x + 10
35 4. Write an equation that represents the different types of blocks used to create Bow Wow Barkley as the weeks increase. Hexagons: y = 2x + 3 Trapezoids: y = 2x + 2 Rhombi: y = 1x + 1 Students may also write y = x + 1 IV. Graphs Input into your calculator the equations that represent the total number of blocks, hexagons, trapezoids and rhombi used to create Bow Wow Barkley as the weeks increase. A. Use the table on the calculator to determine the number of blocks needed to create a picture of Bow Wow Barkley when he is 1 year old. 270 B. How old will Bow Wow Barkley be when his picture contains 75 hexagons? 36 weeks C. How many trapezoids are needed to create Bow Wow Barkley when he is 38 weeks old? 78 D. How old will Bow Wow Barkley be when his picture contains 100 rhombi? 99 weeks V. Graph Analysis 1. If Bow Wow Barkley s picture originally consisted of 6 blocks instead of 10, how would the graph representing the total number of blocks change? The graph would be translated down 4 units. It will now cross the y-axis at 6 instead of If the original picture had 10 blocks but increased by 8 blocks each week versus the current 5 blocks, how would the graph change? The graph would be steeper because the slope increased from 5/1 to 8/1. The y-intercept would not change. 3. If Bow Wow Barkley s original picture consisted of 4 hexagons, how would the graph representing the number of hexagons change? The graph would be translated up 2 units on the y-axis resulting in a y-intercept of 4 instead of 2. The slope of the line would not change. 4. If the original picture of Bow Wow Barkley had 2 trapezoids but it increased by 4 trapezoids each week versus the current 2 trapezoids, how would the graph change? The slope of the line would become steeper with a rate increase from 2 trapezoids per week to a rate of 4 trapezoids per week. The y-intercept of 2 would not change. 5. Write the equation of a graph that represents the change in Bow Wow Barkley s tail if his tail was originally 3 rhombi long. y = 1x Compare this equation with that of his original tail. How do the graphs differ? The y-intercept of the graph would change to 3. Thus the line would have been translated up 2 units. The slope of the line would not change as the rate of increase per week remained constant. 7. How does the initial value affect the function? The initial value determines the y-intercept of the function. In the equation, y = mx + b, the initial value is b. On the graph, it will always be y-coordinate of the point where the line crosses the y- axis. 8. How does the growth pattern affect the function? The additive growth is the rate of change of the function. In the equation, the additive growth pattern is represented as the coefficient of the input (independent) variable. The growth pattern is defined as the slope when looking at the graph of the function.
36 Nonlinear Functions Common Core Standard: Define, evaluate, and compare functions. 8.F.3 Interpret the equation y = mx + b as defining a linear function, whose graph is a straight line; give examples of functions that are not linear. For example, the function A = s 2 giving the area of a square as a function of its side length is not linear because its graph contains the points (1, 1), (2, 4), and (3, 9), which are not on a straight line. Additional/Supporting Standard(s): 8.F.4 Use functions to model relationships between quantities. Standards for Mathematical Practice: 1. Make sense of problems and persevere in solving them. 2. Reason abstractly and quantitatively. 3. Construct viable arguments and critique the reasoning of others. 4. Model with mathematics. 8. Look for and express regularity in repeated reasoning. Student Outcomes: I can determine whether a given pattern represents a linear or non-linear relationship between two quantities. I can recognize that a constant rate of change results in a linear function that creates a straight line graph. I can recognize that a non-constant rate of change results in a non-linear function that creates a graph that is not a straight line. Materials: 1 copy of each function, Pencils, Diamonds, Houses, Growing Rectangles, and Stair Steps Advance Preparation: Make a copy of each of the function blacklines Graph paper Colored pencils Rulers Directions: 1. Allow students to work in small groups or individually. 2. Pass out graph paper, rulers, and colored pencils. 3. Instruct students to create a set of axes along the bottom and left sides of the grid. They should label the axes with scales of Display the Pencil Function to the class. 5. Ask students to construct a T-table for the function that compares the steps in the pattern to the number of toothpicks and graph steps 1 through 3. Encourage students to add a few more values to their T-table based on the pattern they observe and add points to the graph. 6. The T-tables should be constructed on a separate sheet of paper or on the back of their graph paper. Make sure the T-table is labeled with the title of the function.
37 7. Students should then plot the points on their graph in one color. Label the function with its name (Pencils). 8. Facilitate a class discussion by having students share their observations and justify their reasoning. Important points to discuss: The points fall in a straight line. Why? (There is constant growth pattern.) There is a pattern within the values in the table from one step to the next. What is it? (As the x-values increase by 1, the y-values increase by 3.) Predict the y-value when x is 0. (By reversing the pattern of adding 3, students will determine that when x is 0, y will be 3. Students could also extend the line on their graph through the y-intercept and observe that the graph will cross the y-axis at 3, translating to the point (0, 3).) Since this is a linear pattern with a constant additive growth rate, encourage the students to write a function rule that describes the pattern. (y = 3x + 3) Ask the students to connect their rule to the Pencil toothpicks. (One explanation is that the original step would be a triangle and then as each square is connected to it, the pattern increases by 3 each time since there is a shared side.) 9. Next display the Diamonds Function to the class. 10. Repeat steps 5 through 8 above, having the students use a different color pencil to plot their points on the same graph as the Pencil Functions. Students should label their new graph. (Diamonds) and also label their T-Table. 11. Again, facilitate a discussion by having students share their observations. Important points to discuss: The points do not fall in a straight line. Why? (There is not a constant rate of change in the y-values as the x-values increase by 1 each time.) Predict the y-value when x is 0. (This may be a bit more challenging for the students since it is not a constant additive pattern. Several options include using the pattern that the y-value is simply the square of the corresponding x-value, hence an x-value of 0 will result in a y-value of 0. Another observation from the table could be that the 1 st difference among consecutive y-values is not constant but are increasing by odd numbers. However, the 2 nd difference (difference between the 1 st difference values) is constant with an increase of 2 each time. Reversing this pattern will result in a y-value of 0 when the x-value is 0.) Plot the point (0, 0) that has been added to the table and extend the graph to the origin, relating the y-intercept of the graph to the table. Since this graph is non-linear, it is not expected that students write a rule for the function but this can certainly be encouraged. (y = x 2 ) 12. Repeat the above procedures with the last three functions, Houses, Growing Rectangles, and Stair Steps. (see solutions for details) Questions to Pose: Before: How do you construct a T-table? How do you use a T-table to create a graph? During: What patterns do you notice? How does the rule for the function connect to the picture? Do all patterns result in a straight line graph? Explain. Using the observed patterns or rules written for a function, predict the number of toothpicks or diamonds in steps 4, 5 and 10.
with functions, expressions and equations which follow in units 3 and 4.
 Grade 8 Overview View unit yearlong overview here The unit design was created in line with the areas of focus for grade 8 Mathematics as identified by the Common Core State Standards and the PARCC Model
Georgia Standards of Excellence Curriculum Map. Mathematics. GSE 8 th Grade
 Georgia Standards of Excellence Curriculum Map Mathematics GSE 8 th Grade These materials are for nonprofit educational purposes only. Any other use may constitute copyright infringement. GSE Eighth Grade
Pennsylvania System of School Assessment
 Pennsylvania System of School Assessment The Assessment Anchors, as defined by the Eligible Content, are organized into cohesive blueprints, each structured with a common labeling system that can be read
For example, estimate the population of the United States as 3 times 10⁸ and the
 CCSS: Mathematics The Number System CCSS: Grade 8 8.NS.A. Know that there are numbers that are not rational, and approximate them by rational numbers. 8.NS.A.1. Understand informally that every number
Common Core State Standards for Mathematics Accelerated 7th Grade
 A Correlation of 2013 To the to the Introduction This document demonstrates how Mathematics Accelerated Grade 7, 2013, meets the. Correlation references are to the pages within the Student Edition. Meeting
Common Core Unit Summary Grades 6 to 8
 Common Core Unit Summary Grades 6 to 8 Grade 8: Unit 1: Congruence and Similarity- 8G1-8G5 rotations reflections and translations,( RRT=congruence) understand congruence of 2 d figures after RRT Dilations
2027 Mathematics Grade 8
 Instructional Material Bureau Summer 2012 Adoption Review Institute Form F: Publisher Alignment Form & Review Scoring Rubric Publisher information and instructions: Corporation or Publisher: Pearson Education,
Topic: Unit 1-Variables, Expressions, and Integers
 Grade 7th Topic: Unit 1-Variables, Expressions, and Integers Essential Questions/Enduring CC.7.NS.1 Apply and extend previous understandings of operations with fractions to add, subtract, multiply, and
Chapter 111. Texas Essential Knowledge and Skills for Mathematics. Subchapter B. Middle School
 Middle School 111.B. Chapter 111. Texas Essential Knowledge and Skills for Mathematics Subchapter B. Middle School Statutory Authority: The provisions of this Subchapter B issued under the Texas Education
Algebra 1 2008. Academic Content Standards Grade Eight and Grade Nine Ohio. Grade Eight. Number, Number Sense and Operations Standard
 Academic Content Standards Grade Eight and Grade Nine Ohio Algebra 1 2008 Grade Eight STANDARDS Number, Number Sense and Operations Standard Number and Number Systems 1. Use scientific notation to express
Prentice Hall Mathematics Courses 1-3 Common Core Edition 2013
 A Correlation of Prentice Hall Mathematics Courses 1-3 Common Core Edition 2013 to the Topics & Lessons of Pearson A Correlation of Courses 1, 2 and 3, Common Core Introduction This document demonstrates
2027 Mathematics Grade 8
 Instructional Material Bureau Summer 2012 Adoption Review Institute Form F: Publisher Alignment Form & Review Scoring Rubric Publisher information and instructions: Corporation or Publisher: Pearson Education,
Prentice Hall Connected Mathematics 2, 7th Grade Units 2009
 Prentice Hall Connected Mathematics 2, 7th Grade Units 2009 Grade 7 C O R R E L A T E D T O from March 2009 Grade 7 Problem Solving Build new mathematical knowledge through problem solving. Solve problems
Glencoe. correlated to SOUTH CAROLINA MATH CURRICULUM STANDARDS GRADE 6 3-3, 5-8 8-4, 8-7 1-6, 4-9
 Glencoe correlated to SOUTH CAROLINA MATH CURRICULUM STANDARDS GRADE 6 STANDARDS 6-8 Number and Operations (NO) Standard I. Understand numbers, ways of representing numbers, relationships among numbers,
Pre-Algebra 2008. Academic Content Standards Grade Eight Ohio. Number, Number Sense and Operations Standard. Number and Number Systems
 Academic Content Standards Grade Eight Ohio Pre-Algebra 2008 STANDARDS Number, Number Sense and Operations Standard Number and Number Systems 1. Use scientific notation to express large numbers and small
Performance Level Descriptors Grade 6 Mathematics
 Performance Level Descriptors Grade 6 Mathematics Multiplying and Dividing with Fractions 6.NS.1-2 Grade 6 Math : Sub-Claim A The student solves problems involving the Major Content for grade/course with
Current Standard: Mathematical Concepts and Applications Shape, Space, and Measurement- Primary
 Shape, Space, and Measurement- Primary A student shall apply concepts of shape, space, and measurement to solve problems involving two- and three-dimensional shapes by demonstrating an understanding of:
Functional Math II. Information CourseTitle. Types of Instruction
 Functional Math II Course Outcome Summary Riverdale School District Information CourseTitle Functional Math II Credits 0 Contact Hours 135 Instructional Area Middle School Instructional Level 8th Grade
NEW MEXICO Grade 6 MATHEMATICS STANDARDS
 PROCESS STANDARDS To help New Mexico students achieve the Content Standards enumerated below, teachers are encouraged to base instruction on the following Process Standards: Problem Solving Build new mathematical
Standards for Mathematical Practice: Commentary and Elaborations for 6 8
 Standards for Mathematical Practice: Commentary and Elaborations for 6 8 c Illustrative Mathematics 6 May 2014 Suggested citation: Illustrative Mathematics. (2014, May 6). Standards for Mathematical Practice:
Prentice Hall Algebra 2 2011 Correlated to: Colorado P-12 Academic Standards for High School Mathematics, Adopted 12/2009
 Content Area: Mathematics Grade Level Expectations: High School Standard: Number Sense, Properties, and Operations Understand the structure and properties of our number system. At their most basic level
McDougal Littell California:
 McDougal Littell California: Pre-Algebra Algebra 1 correlated to the California Math Content s Grades 7 8 McDougal Littell California Pre-Algebra Components: Pupil Edition (PE), Teacher s Edition (TE),
DRAFT. New York State Testing Program Grade 8 Common Core Mathematics Test. Released Questions with Annotations
 DRAFT New York State Testing Program Grade 8 Common Core Mathematics Test Released Questions with Annotations August 2014 Developed and published under contract with the New York State Education Department
CAMI Education linked to CAPS: Mathematics
 - 1 - TOPIC 1.1 Whole numbers _CAPS curriculum TERM 1 CONTENT Mental calculations Revise: Multiplication of whole numbers to at least 12 12 Ordering and comparing whole numbers Revise prime numbers to
Big Ideas in Mathematics
 Big Ideas in Mathematics which are important to all mathematics learning. (Adapted from the NCTM Curriculum Focal Points, 2006) The Mathematics Big Ideas are organized using the PA Mathematics Standards
Problem of the Month: Cutting a Cube
 Problem of the Month: The Problems of the Month (POM) are used in a variety of ways to promote problem solving and to foster the first standard of mathematical practice from the Common Core State Standards:
In mathematics, there are four attainment targets: using and applying mathematics; number and algebra; shape, space and measures, and handling data.
 MATHEMATICS: THE LEVEL DESCRIPTIONS In mathematics, there are four attainment targets: using and applying mathematics; number and algebra; shape, space and measures, and handling data. Attainment target
Algebra 1 Course Information
 Course Information Course Description: Students will study patterns, relations, and functions, and focus on the use of mathematical models to understand and analyze quantitative relationships. Through
Such As Statements, Kindergarten Grade 8
 Such As Statements, Kindergarten Grade 8 This document contains the such as statements that were included in the review committees final recommendations for revisions to the mathematics Texas Essential
Creating, Solving, and Graphing Systems of Linear Equations and Linear Inequalities
 Algebra 1, Quarter 2, Unit 2.1 Creating, Solving, and Graphing Systems of Linear Equations and Linear Inequalities Overview Number of instructional days: 15 (1 day = 45 60 minutes) Content to be learned
Grade 5 Math Content 1
 Grade 5 Math Content 1 Number and Operations: Whole Numbers Multiplication and Division In Grade 5, students consolidate their understanding of the computational strategies they use for multiplication.
GRADES 7, 8, AND 9 BIG IDEAS
 Table 1: Strand A: BIG IDEAS: MATH: NUMBER Introduce perfect squares, square roots, and all applications Introduce rational numbers (positive and negative) Introduce the meaning of negative exponents for
Overview. Essential Questions. Grade 8 Mathematics, Quarter 4, Unit 4.3 Finding Volume of Cones, Cylinders, and Spheres
 Cylinders, and Spheres Number of instruction days: 6 8 Overview Content to Be Learned Evaluate the cube root of small perfect cubes. Simplify problems using the formulas for the volumes of cones, cylinders,
of surface, 569-571, 576-577, 578-581 of triangle, 548 Associative Property of addition, 12, 331 of multiplication, 18, 433
 Absolute Value and arithmetic, 730-733 defined, 730 Acute angle, 477 Acute triangle, 497 Addend, 12 Addition associative property of, (see Commutative Property) carrying in, 11, 92 commutative property
8th Grade Texas Mathematics: Unpacked Content
 8th Grade Texas Mathematics: Unpacked Content What is the purpose of this document? To increase student achievement by ensuring educators understand specifically what the new standards mean a student must
Assessment Anchors and Eligible Content
 M07.A-N The Number System M07.A-N.1 M07.A-N.1.1 DESCRIPTOR Assessment Anchors and Eligible Content Aligned to the Grade 7 Pennsylvania Core Standards Reporting Category Apply and extend previous understandings
WORK SCHEDULE: MATHEMATICS 2007
 , K WORK SCHEDULE: MATHEMATICS 00 GRADE MODULE TERM... LO NUMBERS, OPERATIONS AND RELATIONSHIPS able to recognise, represent numbers and their relationships, and to count, estimate, calculate and check
North Carolina Math 2
 Standards for Mathematical Practice 1. Make sense of problems and persevere in solving them. 2. Reason abstractly and quantitatively 3. Construct viable arguments and critique the reasoning of others 4.
Biggar High School Mathematics Department. National 5 Learning Intentions & Success Criteria: Assessing My Progress
 Biggar High School Mathematics Department National 5 Learning Intentions & Success Criteria: Assessing My Progress Expressions & Formulae Topic Learning Intention Success Criteria I understand this Approximation
North Carolina. Teacher Working Conditions Standards. North Carolina Professional Teaching Standards Commission
 North Carolina Teacher Working Conditions Standards North Carolina Professional Teaching Standards Commission STATE BOARD OF EDUCATION WILLIAM C. HARRISON Chairman Fayetteville WAYNE MCDEVITT Vice Chair
Mathematics Grade-Level Instructional Materials Evaluation Tool
 Mathematics Grade-Level Instructional Materials Evaluation Tool Quality Review GRADE 8 Textbooks and their digital counterparts are vital classroom tools but also a major expense, and it is worth taking
Basic Understandings
 Activity: TEKS: Exploring Transformations Basic understandings. (5) Tools for geometric thinking. Techniques for working with spatial figures and their properties are essential to understanding underlying
Geometry. Higher Mathematics Courses 69. Geometry
 The fundamental purpose of the course is to formalize and extend students geometric experiences from the middle grades. This course includes standards from the conceptual categories of and Statistics and
Problem of the Month: William s Polygons
 Problem of the Month: William s Polygons The Problems of the Month (POM) are used in a variety of ways to promote problem solving and to foster the first standard of mathematical practice from the Common
Mathematics. Mathematical Practices
 Mathematical Practices 1. Make sense of problems and persevere in solving them. 2. Reason abstractly and quantitatively. 3. Construct viable arguments and critique the reasoning of others. 4. Model with
LESSONS FOR LEARNING FOR THE COMMON CORE STATE STANDARDS IN MATHEMATICS
 GRADE 1 LESSONS FOR LEARNING FOR THE COMMON CORE STATE STANDARDS IN MATHEMATICS PUBLIC SCHOOLS OF NORTH CAROLINA State Board of Education Department of Public Instruction K-12 MATHEMATICS http://www.ncpublicschools.org/curriculum/mathematics/
Number Sense and Operations
 Number Sense and Operations representing as they: 6.N.1 6.N.2 6.N.3 6.N.4 6.N.5 6.N.6 6.N.7 6.N.8 6.N.9 6.N.10 6.N.11 6.N.12 6.N.13. 6.N.14 6.N.15 Demonstrate an understanding of positive integer exponents
NEW YORK STATE TEACHER CERTIFICATION EXAMINATIONS
 NEW YORK STATE TEACHER CERTIFICATION EXAMINATIONS TEST DESIGN AND FRAMEWORK September 2014 Authorized for Distribution by the New York State Education Department This test design and framework document
Math 0980 Chapter Objectives. Chapter 1: Introduction to Algebra: The Integers.
 Math 0980 Chapter Objectives Chapter 1: Introduction to Algebra: The Integers. 1. Identify the place value of a digit. 2. Write a number in words or digits. 3. Write positive and negative numbers used
This unit will lay the groundwork for later units where the students will extend this knowledge to quadratic and exponential functions.
 Algebra I Overview View unit yearlong overview here Many of the concepts presented in Algebra I are progressions of concepts that were introduced in grades 6 through 8. The content presented in this course
LESSONS FOR LEARNING FOR THE COMMON CORE STATE STANDARDS IN MATHEMATICS
 GRADE 6 LESSONS FOR LEARNING FOR THE COMMON CORE STATE STANDARDS IN MATHEMATICS PUBLIC SCHOOLS OF NORTH CAROLINA State Board of Education Department of Public Instruction Word Document versions of the
CORRELATED TO THE SOUTH CAROLINA COLLEGE AND CAREER-READY FOUNDATIONS IN ALGEBRA
 We Can Early Learning Curriculum PreK Grades 8 12 INSIDE ALGEBRA, GRADES 8 12 CORRELATED TO THE SOUTH CAROLINA COLLEGE AND CAREER-READY FOUNDATIONS IN ALGEBRA April 2016 www.voyagersopris.com Mathematical
10 th Grade Math Special Education Course of Study
 10 th Grade Math Special Education Course of Study Findlay City Schools 2006 Table of Contents 1. Findlay City Schools Mission Statement 2. 10 th Grade Math Curriculum Map 3. 10 th Grade Math Indicators
Higher Education Math Placement
 Higher Education Math Placement Placement Assessment Problem Types 1. Whole Numbers, Fractions, and Decimals 1.1 Operations with Whole Numbers Addition with carry Subtraction with borrowing Multiplication
Grade 6 Mathematics Assessment. Eligible Texas Essential Knowledge and Skills
 Grade 6 Mathematics Assessment Eligible Texas Essential Knowledge and Skills STAAR Grade 6 Mathematics Assessment Mathematical Process Standards These student expectations will not be listed under a separate
Tennessee Mathematics Standards 2009-2010 Implementation. Grade Six Mathematics. Standard 1 Mathematical Processes
 Tennessee Mathematics Standards 2009-2010 Implementation Grade Six Mathematics Standard 1 Mathematical Processes GLE 0606.1.1 Use mathematical language, symbols, and definitions while developing mathematical
MATH 60 NOTEBOOK CERTIFICATIONS
 MATH 60 NOTEBOOK CERTIFICATIONS Chapter #1: Integers and Real Numbers 1.1a 1.1b 1.2 1.3 1.4 1.8 Chapter #2: Algebraic Expressions, Linear Equations, and Applications 2.1a 2.1b 2.1c 2.2 2.3a 2.3b 2.4 2.5
Pearson Algebra 1 Common Core 2015
 A Correlation of Pearson Algebra 1 Common Core 2015 To the Common Core State Standards for Mathematics Traditional Pathways, Algebra 1 High School Copyright 2015 Pearson Education, Inc. or its affiliate(s).
Everyday Mathematics CCSS EDITION CCSS EDITION. Content Strand: Number and Numeration
 CCSS EDITION Overview of -6 Grade-Level Goals CCSS EDITION Content Strand: Number and Numeration Program Goal: Understand the Meanings, Uses, and Representations of Numbers Content Thread: Rote Counting
Math at a Glance for April
 Audience: School Leaders, Regional Teams Math at a Glance for April The Math at a Glance tool has been developed to support school leaders and region teams as they look for evidence of alignment to Common
CONNECTING LESSONS NGSS STANDARD
 CONNECTING LESSONS TO NGSS STANDARDS 1 This chart provides an overview of the NGSS Standards that can be met by, or extended to meet, specific STEAM Student Set challenges. Information on how to fulfill
Geometry Enduring Understandings Students will understand 1. that all circles are similar.
 High School - Circles Essential Questions: 1. Why are geometry and geometric figures relevant and important? 2. How can geometric ideas be communicated using a variety of representations? ******(i.e maps,
1. Mathematics Content/Alignment with the Standards Correlation to California Algebra Readiness Standards
 PROGRAM DESCRIPTION The goal of Prentice Hall Connecting to Algebra is to fully prepare students for success in Algebra 1 by thoroughly covering the Algebra Readiness standards outlined by the California
Everyday Mathematics GOALS
 Copyright Wright Group/McGraw-Hill GOALS The following tables list the Grade-Level Goals organized by Content Strand and Program Goal. Content Strand: NUMBER AND NUMERATION Program Goal: Understand the
A Correlation of Pearson Texas Geometry Digital, 2015
 A Correlation of Pearson Texas Geometry Digital, 2015 To the Texas Essential Knowledge and Skills (TEKS) for Geometry, High School, and the Texas English Language Proficiency Standards (ELPS) Correlations
MATH 0110 Developmental Math Skills Review, 1 Credit, 3 hours lab
 MATH 0110 Developmental Math Skills Review, 1 Credit, 3 hours lab MATH 0110 is established to accommodate students desiring non-course based remediation in developmental mathematics. This structure will
Prentice Hall: Middle School Math, Course 1 2002 Correlated to: New York Mathematics Learning Standards (Intermediate)
") New York Mathematics Learning Standards (Intermediate) Mathematical Reasoning Key Idea: Students use MATHEMATICAL REASONING to analyze mathematical situations, make conjectures, gather evidence, and construct
New York Mathematics Learning Standards (Intermediate) Mathematical Reasoning Key Idea: Students use MATHEMATICAL REASONING to analyze mathematical situations, make conjectures, gather evidence, and construct
Middle School Course Acceleration
 Middle School Course Acceleration Some students may choose to take Algebra I in Grade 8 so they can take college-level mathematics in high school. Students who are capable of moving more quickly in their
Measurement with Ratios
 Grade 6 Mathematics, Quarter 2, Unit 2.1 Measurement with Ratios Overview Number of instructional days: 15 (1 day = 45 minutes) Content to be learned Use ratio reasoning to solve real-world and mathematical
Indiana State Core Curriculum Standards updated 2009 Algebra I
 Indiana State Core Curriculum Standards updated 2009 Algebra I Strand Description Boardworks High School Algebra presentations Operations With Real Numbers Linear Equations and A1.1 Students simplify and
Problem of the Month: Perfect Pair
 Problem of the Month: The Problems of the Month (POM) are used in a variety of ways to promote problem solving and to foster the first standard of mathematical practice from the Common Core State Standards:
Senior Phase Grade 9 Today Planning Pack MATHEMATICS
 M780636110304 Senior Phase Grade 9 Today Planning Pack MATHEMATICS Contents: Work Schedule: Page Grade 9 2 Lesson Plans: Grade 9 4 Rubrics: Rubric 1: Recognising, classifying and representing numbers 19
Discovering Math: Exploring Geometry Teacher s Guide
 Teacher s Guide Grade Level: 6 8 Curriculum Focus: Mathematics Lesson Duration: Three class periods Program Description Discovering Math: Exploring Geometry From methods of geometric construction and threedimensional
Lesson #13 Congruence, Symmetry and Transformations: Translations, Reflections, and Rotations
 Math Buddies -Grade 4 13-1 Lesson #13 Congruence, Symmetry and Transformations: Translations, Reflections, and Rotations Goal: Identify congruent and noncongruent figures Recognize the congruence of plane
Volumes of Revolution
 Mathematics Volumes of Revolution About this Lesson This lesson provides students with a physical method to visualize -dimensional solids and a specific procedure to sketch a solid of revolution. Students
Tennessee Department of Education
 Tennessee Department of Education Task: Pool Patio Problem Algebra I A hotel is remodeling their grounds and plans to improve the area around a 20 foot by 40 foot rectangular pool. The owner wants to use
Mathematics Scope and Sequence, K-8
 Standard 1: Number and Operation Goal 1.1: Understands and uses numbers (number sense) Mathematics Scope and Sequence, K-8 Grade Counting Read, Write, Order, Compare Place Value Money Number Theory K Count
Florida Math for College Readiness
 Core Florida Math for College Readiness Florida Math for College Readiness provides a fourth-year math curriculum focused on developing the mastery of skills identified as critical to postsecondary readiness
Solving Systems of Linear Equations Graphing
 Solving Systems of Linear Equations Graphing Outcome (learning objective) Students will accurately solve a system of equations by graphing. Student/Class Goal Students thinking about continuing their academic
Integer Operations. Overview. Grade 7 Mathematics, Quarter 1, Unit 1.1. Number of Instructional Days: 15 (1 day = 45 minutes) Essential Questions
 Essential Questions") Grade 7 Mathematics, Quarter 1, Unit 1.1 Integer Operations Overview Number of Instructional Days: 15 (1 day = 45 minutes) Content to Be Learned Describe situations in which opposites combine to make zero.
Grade 7 Mathematics, Quarter 1, Unit 1.1 Integer Operations Overview Number of Instructional Days: 15 (1 day = 45 minutes) Content to Be Learned Describe situations in which opposites combine to make zero.
MATHS LEVEL DESCRIPTORS
 MATHS LEVEL DESCRIPTORS Number Level 3 Understand the place value of numbers up to thousands. Order numbers up to 9999. Round numbers to the nearest 10 or 100. Understand the number line below zero, and
Algebra 2 Chapter 1 Vocabulary. identity - A statement that equates two equivalent expressions.
 Chapter 1 Vocabulary identity - A statement that equates two equivalent expressions. verbal model- A word equation that represents a real-life problem. algebraic expression - An expression with variables.
How does one make and support a reasonable conclusion regarding a problem? How does what I measure influence how I measure?
 Middletown Public Schools Mathematics Unit Planning Organizer Subject Mathematics Grade/Course Grade 7 Unit 3 Two and Three Dimensional Geometry Duration 23 instructional days (+4 days reteaching/enrichment)
Unit 4: Analyze and Graph Linear Equations, Functions, and Relations
 Unit 4 Table of Contents Unit 4: Analyze and Graph Linear Equations, Functions and Relations Video Overview Learning Objectives 4.2 Media Run Times 4.3 Instructor Notes 4.4 The Mathematics of Analyzing
GAP CLOSING. 2D Measurement GAP CLOSING. Intermeditate / Senior Facilitator s Guide. 2D Measurement
 GAP CLOSING 2D Measurement GAP CLOSING 2D Measurement Intermeditate / Senior Facilitator s Guide 2-D Measurement Diagnostic...4 Administer the diagnostic...4 Using diagnostic results to personalize interventions...4
Geometry 1. Unit 3: Perpendicular and Parallel Lines
 Geometry 1 Unit 3: Perpendicular and Parallel Lines Geometry 1 Unit 3 3.1 Lines and Angles Lines and Angles Parallel Lines Parallel lines are lines that are coplanar and do not intersect. Some examples
Grade 6 Mathematics Performance Level Descriptors
 Limited Grade 6 Mathematics Performance Level Descriptors A student performing at the Limited Level demonstrates a minimal command of Ohio s Learning Standards for Grade 6 Mathematics. A student at this
Open-Ended Problem-Solving Projections
 MATHEMATICS Open-Ended Problem-Solving Projections Organized by TEKS Categories TEKSING TOWARD STAAR 2014 GRADE 7 PROJECTION MASTERS for PROBLEM-SOLVING OVERVIEW The Projection Masters for Problem-Solving
Math 1. Month Essential Questions Concepts/Skills/Standards Content Assessment Areas of Interaction
 Binghamton High School Rev.9/21/05 Math 1 September What is the unknown? Model relationships by using Fundamental skills of 2005 variables as a shorthand way Algebra Why do we use variables? What is a
Mathematics Curriculum Guide Precalculus 2015-16. Page 1 of 12
 Mathematics Curriculum Guide Precalculus 2015-16 Page 1 of 12 Paramount Unified School District High School Math Curriculum Guides 2015 16 In 2015 16, PUSD will continue to implement the Standards by providing
MATH 095, College Prep Mathematics: Unit Coverage Pre-algebra topics (arithmetic skills) offered through BSE (Basic Skills Education)
 offered through BSE (Basic Skills Education)") MATH 095, College Prep Mathematics: Unit Coverage Pre-algebra topics (arithmetic skills) offered through BSE (Basic Skills Education) Accurately add, subtract, multiply, and divide whole numbers, integers,
MATH 095, College Prep Mathematics: Unit Coverage Pre-algebra topics (arithmetic skills) offered through BSE (Basic Skills Education) Accurately add, subtract, multiply, and divide whole numbers, integers,
Georgia Standards of Excellence 2015-2016 Mathematics
 Georgia Standards of Excellence 2015-2016 Mathematics Standards GSE Coordinate Algebra K-12 Mathematics Introduction Georgia Mathematics focuses on actively engaging the student in the development of mathematical
N Q.3 Choose a level of accuracy appropriate to limitations on measurement when reporting quantities.
 Performance Assessment Task Swimming Pool Grade 9 The task challenges a student to demonstrate understanding of the concept of quantities. A student must understand the attributes of trapezoids, how to
EQUATIONS and INEQUALITIES
 EQUATIONS and INEQUALITIES Linear Equations and Slope 1. Slope a. Calculate the slope of a line given two points b. Calculate the slope of a line parallel to a given line. c. Calculate the slope of a line
High School Algebra Reasoning with Equations and Inequalities Solve equations and inequalities in one variable.
 Performance Assessment Task Quadratic (2009) Grade 9 The task challenges a student to demonstrate an understanding of quadratic functions in various forms. A student must make sense of the meaning of relations
Expression. Variable Equation Polynomial Monomial Add. Area. Volume Surface Space Length Width. Probability. Chance Random Likely Possibility Odds
 Isosceles Triangle Congruent Leg Side Expression Equation Polynomial Monomial Radical Square Root Check Times Itself Function Relation One Domain Range Area Volume Surface Space Length Width Quantitative
PERIMETER AND AREA. In this unit, we will develop and apply the formulas for the perimeter and area of various two-dimensional figures.
 PERIMETER AND AREA In this unit, we will develop and apply the formulas for the perimeter and area of various two-dimensional figures. Perimeter Perimeter The perimeter of a polygon, denoted by P, is the
High School Algebra Reasoning with Equations and Inequalities Solve systems of equations.
 Performance Assessment Task Graphs (2006) Grade 9 This task challenges a student to use knowledge of graphs and their significant features to identify the linear equations for various lines. A student
EVERY DAY COUNTS CALENDAR MATH 2005 correlated to
 EVERY DAY COUNTS CALENDAR MATH 2005 correlated to Illinois Mathematics Assessment Framework Grades 3-5 E D U C A T I O N G R O U P A Houghton Mifflin Company YOUR ILLINOIS GREAT SOURCE REPRESENTATIVES:
GRADE 8 MATH: TALK AND TEXT PLANS
 GRADE 8 MATH: TALK AND TEXT PLANS UNIT OVERVIEW This packet contains a curriculum-embedded Common Core standards aligned task and instructional supports. The task is embedded in a three week unit on systems