Joint probability methods to storm surge studies Pat Fitzpatrick Mississippi State University
|
|
|
- Shona Benson
- 7 years ago
- Views:
Transcription
1 Joint probability methods to storm surge studies Pat Fitzpatrick Mississippi State University Motivation Concept frequency analysis Concept joint probability Steps in creating brute force joint probability method (JPM) for surge frequency analysis Optimal Sampling techniques for JPM Methods for synthetic tropical cyclone tracks Example New Orleans post-katrina levees

2 Additional provided material FEMA, 2012: Operating Guidance 8-12 Joint Probability-Optimal Sampling method for tropical storm surge frequency analysis Joint Probability Distributions (class lecture) Jacobsen, R., 2012: Concepts in flood return frequency analysis Toro, G. R., D. T. Resio, D. Divoky, A. W. Niedoroda, and C. Reed, 2010: Efficient joint probability methods for hurricane surge frequency analysis. Ocean Engineering, 37, Niedoroda, A. W., G. R. Toro, D. Divoky, H. S. Das, and C. Reed, 2010: Analysis of the coastal Mississippi storm surge hazard. Ocean Engineering, 37, U.S. Nuclear Regulatory Commission, 2012: Guidance for performing a tsunami, surge, or seiche hazard assessment Toro, G. R., S. C. Hagen, J. Atkinson, and C. Reed, 2011: Production runs for the Big Bend region of Florida. The Florida Watershed Journal, What is a 100-year flood?

3 Motivation Applications for flood or surge frequency analysis: Flood insurance studies. The NFIP requires return period inundation values on Flood Insurance Rate Maps (FIRMS), which determine insurance rates. Flood control studies. An example is the determination of southeast Louisiana s new 100-year levee heights during reconstruction after Katrina Flood mitigation studies. An example is the ongoing reassessment on whether coastal nuclear plants meet 1 in 10,000 year flood protection criteria. Flood impact studies. Determine if return levels change due to urban runoff changes, floodplain restoration, channel modification, etc.

4 Synthetic hurricane track dataset Variations for intensity, speed and size 2D wind and pressure fields Surge model. Coupling with other relevant water level processes (wave, tide, rainfall runoff, riverine flooding, sea level rise, subsidence) Determination of elevation frequency curves at dense points throughout the region (JPM) Application Application examples Flood Insurance Rate Maps (FIRMs) Levee height design Elevation or protection design for nuclear plants
 Levee height design Elevation or protection design for")
5 Concept - Frequency analysis

6


7 Return frequency For example, if daily rainfall has exceeded 6 inches ten times in a thirty year record, the return frequency F R =n/t, or 10/30=0.33, or 33.3% The return period is 1/F R, or 3 years. This is the average interval between the events of a particular magnitude A 1% return frequency is a 100-year return period A 0.2% return frequency is a 500-year return period A 1E-4% return frequency is a 10,000-year return period Does not mean a flood occurs every n years! For example, the probability of a 100-year flood occurring in 30 years (the lifetime of the average home mortgage) is 26.0%. It could even occur multiple times in a century.

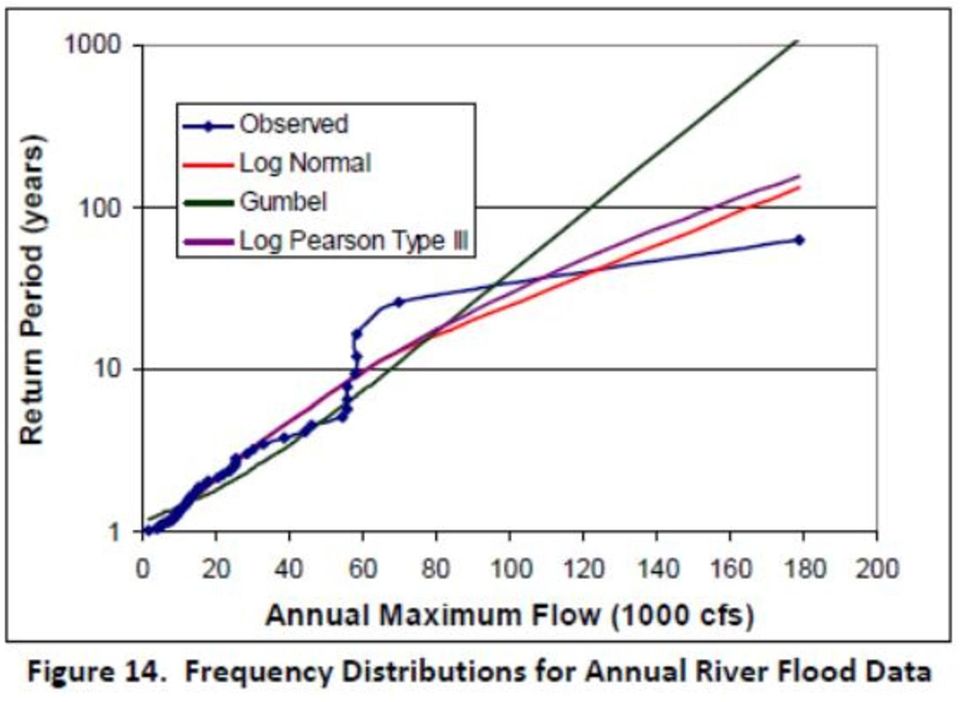
8 Extreme return frequencies Need to use a different probability distribution. Examples are log-normal, log-pearson Type III, and Generalized Extreme Value (GEV). GEV Type I is called a Gumbel distribution, GEV Type II is a Frechet distribution, and GEV Type III is a Weibull distribution.
.")
9
10

11 Concept - Joint probability Joint probability refers to the likelihood of two or more conditions occurring at the same time. The joint probability for two events, A and B, is expressed mathematically as P(A,B). It is calculated by multiplying the probability of event A, expressed as P(A), by the probability of event B, expressed as P(B). The probability of two rolled dice simultaneously being the number five is (1/6)X(1/6)= However, the dependence between the two or more conditions should be non-trivial, i.e. neither independent nor fully dependent. It is a useful statistic to use when two or more observable phenomena can occur simultaneously
X(1/6)=0.")
12

13 JPM usefulness for storm surge Earlier techniques (tide gauge analysis or the Empirical Simulation Technique) are sensitive to sample size in tide or surge simulation datasets, and cannot capture the range of storm possibilities capable of producing, for example, the 1% annual flood event. The JPM approach, however, has the conceptual advantage of considering all possible storms consistent with the local climatology, each weighted by its appropriate rate of occurrence. The most basic JPM approach assumes a parametric storm description involving several hurricane descriptors, such as: Central pressure R max Storm direction Storm speed Appropriate probability distributions are determined for each parameter and discretized All possible parameter combinations (each defining a synthetic storm) are simulated using a storm surge model

14 Math formalism (from Toro paper) Sometimes uncertainty is included through an Ɛ term ƞ m is the model calculated surge height

15

16 10 year 100 year 500 year

17 How 100-year surge event is determined (full JPM) Develop probability distributions for each storm parameter (R max, intensity, etc.) from observations Establish rate of storm occurrence in space and time Subdivide each distribution into a small number of discrete pieces (i.e., 6 values) Construct all possible hypothetical tracks by taking all possible combinations of the storm quantities. For example, with six values for four parameters one constructs 1296 storms. (=6 pressure X 6 R max X 6 direction X 6 speed) Conduct hydrodynamic simulations (surge model, wave coupling, sometimes hydrology) with multiple tracks for each storm type sufficiently spaced for shoreline influence (landfall and bypassing). Track spacing is typically one R max, or about ten tracks per site (12,960 simulations) For each storm, compute highest surge for locations of interest, tag it with rate of occurrence Construct a histogram of rate versus surge height Find the 1% surge elevation for each location
 Conduct hydrodynamic simulations (surge model, wave coupling, sometimes hydrology) with multiple tracks for each storm type sufficiently spaced for")
18 Optimized sampling (OS) JPM fine if only SLOSH is needed, but not for high-resolution runs using ADCIRC JPM-OS techniques seeks to reduce the number of simulations in an intelligent way (fewer combinations, tracks) while maintaining accurate frequency return values JPM-OS are sometimes tested with JPM SLOSH runs to see if the JPM-OS assumptions roughly match on open coast sections One possibility is a Monte Carlo JPM which randomly selects a sample from all possible combinations but enough to hopefully sufficiently capture the proper range of possibilities. However, sample size questions still exist. Two of the established techniques (next two slides) are: Response Function JPM-OS (JPM-OS-RS) Quadrature JPM-OS (JPM-OS-Q)

19 Response Surface Method Restricts parameters based on sensitivity response experiments (i.e. only three pressure values chosen). It is found certain combinations are linear, some responses stronger than others, and smooth Carefully choosing parameters limits combinations, and reduces simulations Typical example of steps: Step 1: Start with ~5 tracks roughly perpendicular to landfall region and a few values of p and R max. Conduct the simulations. Interpolate or extrapolate other surge values in the p-r max plane Step 2: Add a few more oblique angles ( ±45 ), simulate on a reduced p-r max combination (compared to Step 1), interpolate/extrapolate Step 3: Vary by a few storm speed parameters, simulate on a further reduced p-r max combination (compared to Step 2), interpolate/extrapolate Step 4: Interpolate/extrapolate in track space for one p and R max This process can yield over 50,000 storms. Problems are in choosing the proper parameters restrictions (needs expert judgment) which can also be arbitrary; the accuracy of the interpolation; and the use of extrapolation. But results compare well to JPM-OS-Q. An alternate interpolation scheme is known as the sparse grid method.
, simulate on a reduced p-r max combination (compared to Step 1),")
20 Example of interpolation/extrapolation in Step 1 for one track Interpolated/extrapolated surge response function in Δp-R max plane for one track. Δp is central pressure minus environmental pressure. Black dots indicate 9 simulated storms for this track. The magenta dashed polygon indicated where bilinear interpolation is performed. Below 110 mb, and to the right and left of the polygon, the response surface is extrapolated by maintaining a constant Δp-R max gradient from the edge of the polygon. Above 110 mb, the surge response function is extrapolated by maintaining a constant p gradient.

21 Quadrature Method Seeks parameters and annual rates for several hundred runs by minimizing the mean square error of integration This minimization algorithm selects the optimal parameter combinations and assigns representative weights to each of the combinations This turns the multi-dimensional JPM integral into a weighted summation with specific weights for the optimal parameter combinations. Various assumptions are made to simplify integral. Need to test against SLOSH JPM. This also helps determine the optimum number of tracks.
22 Optimal Methods for extremely rare events (1 in 10,000 year) 1) Procedures are similar, but conduct thousands of SLOSH runs to determine optimal combinations for the peak surge events, then refine with several dozen ADCIRC runs. Derive response frequency curves. 2) Then do a check with deterministic ADCIRC runs with realistic but extreme hurricanes and quasi-perpendicular angles, and see if the results roughly match the probabilistic results. If not, there may be an issue with the synthetic tracks or the pdf assumptions.
23 Generation of synthetic storm datasets ickery, P. J., P. F. Skerlj, and L. A. Twisdale, 2000: Simulation of hurricane risk in the U.S. using empirical rack model. J. Structural Engineering, 126, manuel, K., 2006a: A statistical-deterministic approach to hurricane risk assessment. Bull. Amer. Meteor. oc., 87, manuel, K., 2006b: Climate and tropical cyclone activity: A new model downscaling approach. J. Climate, 9, ) Intensity, R max, direction qualitatively based on local climatology; spaced by R max ) Empirical equations based on climatology, and include random error (Vickery et l. 2000) ) Model downscaling a) Climate model b) Beta and Advection Model (BAMS) coupled to a balanced vortex model with 1D ocean coupling (Emanuel 2006a,b). Steering currents (850 and 200 mb) are from a general circulation model. eferences
24 Empirical track generation equations Pressure more common, but wind can be used too Validation examples from Vickery et al. (2000)
25 Example applied to the post-katrina New Orleans levees reconstruction
26

27
28 Example 100-year surge curves for southshore
29 Example 100-year surge curves for southshore
Storm tide is the water level rise during a storm due to the combination of storm surge and the astronomical tide.
 INTRODUCTION TO STORM SURGE Introduction to Storm Surge BOLIVAR PENINSULA IN TEXAS AFTER HURRICANE IKE (2008) What is Storm Surge? Inland Extent Storm surge can penetrate well inland from the coastline.
FLOOD INFORMATION SERVICE EXPLANATORY NOTES
 FLOOD INFORMATION SERVICE EXPLANATORY NOTES Part 1 About the flood maps Limitations of the mapping What the maps don t show Where to find more information Definitions of words used to describe flooding.
Storm tide is the water level rise during a storm due to the combination of storm surge and the astronomical tide.
 INTRODUCTION TO STORM SURGE Introduction to Storm Surge National Hurricane Center Storm Surge Unit BOLIVAR PENINSULA IN TEXAS AFTER HURRICANE IKE (2008) What is Storm Surge? Inland Extent Storm surge can
Climate Change Long Term Trends and their Implications for Emergency Management August 2011
 Climate Change Long Term Trends and their Implications for Emergency Management August 2011 Overview A significant amount of existing research indicates that the world s climate is changing. Emergency
Most Vulnerable US Cities to Storm Surge Flooding. August 2015 2 COPLEY PLACE BOSTON, MA 02116 T: 617.423.2800 F: 617.423.2808
 Most Vulnerable US Cities to Storm Surge Flooding August 2015 2 COPLEY PLACE BOSTON, MA 02116 T: 617.423.2800 F: 617.423.2808 Introduction Hurricane Katrina was a stark reminder that strong winds are only
FLOOD HAZARD IN THE URBAN ENVIRONMENT: IMPLICATIONS FOR DEVELOPERS, DESIGNERS, AND ATTORNEYS
 FLOOD HAZARD IN THE URBAN ENVIRONMENT: IMPLICATIONS FOR DEVELOPERS, DESIGNERS, AND ATTORNEYS PRESENTED BY: CHAD W. COX, P.E. DANIEL C. STAPLETON, P.E. BOSTON, MA JAN. 24, 2014 PRESENTATION Flood Vulnerability
A stochastic storm surge generator as a tool for integrated risk analyses
 A stochastic storm surge generator as a tool for integrated risk analyses Thomas Wahl, Jürgen Jensen and Christoph Mudersbach 16-09-2010 Hamburg, Germany T. Wahl, J. Jensen, C. Mudersbach 1 1 Introduction
New York City Panel on Climate Change 2015 Report Executive Summary
 Ann. N.Y. Acad. Sci. ISSN 0077-8923 ANNALS OF THE NEW YORK ACADEMY OF SCIENCES Issue: Building the Knowledge Base for Climate Resiliency New York City Panel on Climate Change 2015 Report Executive Summary
The AIR Inland Flood Model for the United States In Spring 2011, heavy rainfall and snowmelt produced massive flooding along the Mississippi River,
 The AIR Inland Flood Model for the United States In Spring 2011, heavy rainfall and snowmelt produced massive flooding along the Mississippi River, inundating huge swaths of land across seven states. As
Guidance for Flood Risk Analysis and Mapping. Changes Since Last FIRM
 Guidance for Flood Risk Analysis and Mapping Changes Since Last FIRM May 2014 This guidance document supports effective and efficient implementation of flood risk analysis and mapping standards codified
Created by Neevia docuprinter Pro trial version http://www.neevia.com Created by Neevia docuprinter Pro trial version
 GEOGRAPHIC INFORMATION SYSTEMS AND WATER RESOURCES IV AWRA SPRING SPECIALTY CONFERENCE Houston, Texas May 8-10, 2006 Copyright 2006, AWRA HURRICANE KATRINA AND DISASTER RECOVERY GEOSPATIAL PROCESS FOR
Risk assessment of hurricane storm surge for New York City
 JOURNAL OF GEOPHYSICAL RESEARCH, VOL. 115,, doi:10.1029/2009jd013630, 2010 Risk assessment of hurricane storm surge for New York City N. Lin, 1 K. A. Emanuel, 2 J. A. Smith, 1 and E. Vanmarcke 1 Received
Climate Change in North Carolina
 Climate Change in North Carolina Dr. Chip Konrad Director of the The Southeast Regional Climate Center Associate Professor Department of Geography University of North Carolina at Chapel Hill The Southeast
Use of Joint Probability Methods in Flood Management
 Defra /Environment Agency Flood and Coastal Defence R&D Programme Use of Joint Probability Methods in Flood Management A Guide to Best Practice R&D Technical Report FD2308/TR2 Defra / Environment Agency
Appendix F Benefit-Cost Analysis of Flood Protection Measures
 Appendix F Benefit-Cost Analysis of Flood Protection Measures Acronyms used in Appendix F: AA B AA C AA D BC BFE EAD FEMA NED O&M PV RED USACE Average Annual Benefits Average Annual Cost Average Annual
Mathematical Concepts in the Insurance Industry. Felix Rosenbaum, Risk Management, SCIPP Seminar April 2011
 Mathematical Concepts in the Insurance Industry Felix Rosenbaum, Risk Management, SCIPP Seminar April 2011 Table of Contents / Agenda n Introduction to Swiss Re n Insurance Math n Nat Cat Modelling n Natural
Argonne National Laboratory
 Argonne National Laboratory Using Climate Data to Inform Critical Infrastructure Resilience and Urban Sustainability Decisionmaking National Academy of Sciences Roundtable on Science and Technology for
MIKE 21 FLOW MODEL HINTS AND RECOMMENDATIONS IN APPLICATIONS WITH SIGNIFICANT FLOODING AND DRYING
 1 MIKE 21 FLOW MODEL HINTS AND RECOMMENDATIONS IN APPLICATIONS WITH SIGNIFICANT FLOODING AND DRYING This note is intended as a general guideline to setting up a standard MIKE 21 model for applications
CHAPTER 2 HYDRAULICS OF SEWERS
 CHAPTER 2 HYDRAULICS OF SEWERS SANITARY SEWERS The hydraulic design procedure for sewers requires: 1. Determination of Sewer System Type 2. Determination of Design Flow 3. Selection of Pipe Size 4. Determination
Structural Damage Due to Floods
 Structural Damage Due to Floods By Craig D. Rogers, P.E. The Federal Emergency Management Agency (FEMA) reports that each year approximately 90 percent of all disaster-related property damage results from
Flood Risk Analysis considering 2 types of uncertainty
 US Army Corps of Engineers Institute for Water Resources Hydrologic Engineering Center Flood Risk Analysis considering 2 types of uncertainty Beth Faber, PhD, PE Hydrologic Engineering Center (HEC) US
Low-Probability Flood Risk Modeling for New York City
 Risk Analysis DOI: 10.1111/risa.12008 Low-Probability Flood Risk Modeling for New York City JeroenC.J.H.Aerts, 1 Ning Lin, 2 W. J. Wouter Botzen, 1 Kerry Emanuel, 3 and Hans de Moel 1 The devastating impact
Tokyo, Japan. William L. Carwile, III FEMA Associate Administrator Response and Recovery. Most catastrophic natural disaster in United States in the
 Hurricane Katrina Long term Recovery Expert twork kgroup Meeting Tokyo, Japan May 31, 2011 William L. Carwile, III FEMA Associate Administrator Response and Recovery Hurricane Katrina August 29, 2005 Most
Oregon. Climate Change Adaptation Framework
 Oregon Climate Change Adaptation Framework Oregon Environmental Quality Commission Climate Change Adaptation Framework Presentation at a glance: Purposes of the framework Participating agencies Climate
UNISDR - Global Risk Assessment: Towards a high-performance environment
 1 UNISDR - Global Risk Assessment: Towards a high-performance environment WCDRR, Sendai 15 March, 2015 Sahar Safaie, Julio Serje Global Assessment Report Team United Nations Office for Disaster Risk Reduction
c f'f:..-- Risk Identification Branch
 Federal Emergency Management Agency Washington, D.C. 20472 AUG -1 3)05 MEMORANDUM FOR: FROM: c f'f:..-- Risk Identification Branch SUBJECT: Procedure Memorandum No. 37 Protocol for Atlantic and Gulf Coast
Federal Emergency Management Agency (FEMA) Preliminary Flood Insurance Rate Maps (FIRMs) and Preliminary Flood Insurance Study (FIS) for New York City
 Preliminary Flood Insurance Rate Maps (FIRMs) and Preliminary Flood Insurance Study (FIS) for New York City") March 10, 2014 Submitted electronically via http://www.nyc.gov Mayor s Office of Long Term Planning and Sustainability c/o Flood Map Comments 253 Broadway, 10th Floor New York, NY 10007 Federal Emergency
March 10, 2014 Submitted electronically via http://www.nyc.gov Mayor s Office of Long Term Planning and Sustainability c/o Flood Map Comments 253 Broadway, 10th Floor New York, NY 10007 Federal Emergency
APPENDIX A : 1998 Survey of Proprietary Risk Assessment Systems
 APPENDIX A : 1998 Survey of Proprietary Risk Assessment Systems In its 1997 paper, the working party reported upon a survey of proprietary risk assessment systems designed for use by UK household insurers
1. GENERAL ADVISORY BASE FLOOD ELEVATION (ABFE) QUESTIONS
 QUESTIONS") INTRODUCTION As communities begin to recover from the devastating effects of Hurricane Sandy, it is important to recognize lessons learned and to employ mitigation actions that ensure structures are rebuilt
INTRODUCTION As communities begin to recover from the devastating effects of Hurricane Sandy, it is important to recognize lessons learned and to employ mitigation actions that ensure structures are rebuilt
Climate Extremes Research: Recent Findings and New Direc8ons
 Climate Extremes Research: Recent Findings and New Direc8ons Kenneth Kunkel NOAA Cooperative Institute for Climate and Satellites North Carolina State University and National Climatic Data Center h#p://assessment.globalchange.gov
Hurricane Modification and Adaptation in Miami-Dade County, Florida
 pubs.acs.org/est Hurricane Modification and Adaptation in Miami-Dade County, Florida Kelly Klima,*, Ning Lin, Kerry Emanuel, M. Granger Morgan, and Iris Grossmann Engineering and Public Policy, Carnegie
2D Modeling of Urban Flood Vulnerable Areas
 2D Modeling of Urban Flood Vulnerable Areas Sameer Dhalla, P.Eng. Dilnesaw Chekol, Ph.D. A.D. Latornell Conservation Symposium November 22, 2013 Outline 1. Toronto and Region 2. Evolution of Flood Management
New Coastal Study for Puerto Rico FIRMs. Paul Weberg, FEMA RII Mat Mampara, Dewberry Jeff Gangai, Dewberry Krista Collier, Baker
 New Coastal Study for Puerto Rico FIRMs Paul Weberg, FEMA RII Mat Mampara, Dewberry Jeff Gangai, Dewberry Krista Collier, Baker September 2007 Project Team FEMA Region II Program Manager Collaboration
An Initial Assessment of the Impacts of Sea Level Rise to the California Coast
 An Initial Assessment of the Impacts of Sea Level Rise to the California Coast Photo by D. Revell 2/23/08 California Coastal Records Project Dr. David Revell and Matt Heberger, P.E. Dr. Peter Gleick, Bob
Heavy Rainfall from Hurricane Connie August 1955 By Michael Kozar and Richard Grumm National Weather Service, State College, PA 16803
 Heavy Rainfall from Hurricane Connie August 1955 By Michael Kozar and Richard Grumm National Weather Service, State College, PA 16803 1. Introduction Hurricane Connie became the first hurricane of the
Estimating Potential Reduction Flood Benefits of Restored Wetlands
 Estimating Potential Reduction Flood Benefits of Restored Wetlands Kenneth W. Potter University of Wisconsin Introduction Throughout the summer of 1993 a recurring question was the impact of wetland drainage
Comparison of Local and Basin-Wide Methods for. Risk Assessment of Tropical Cyclone Landfall
 Comparison of Local and Basin-Wide Methods for Risk Assessment of Tropical Cyclone Landfall Timothy M. Hall NASA Goddard Institute for Space Studies, New York, NY Stephen Jewson Risk Management Solutions,
Probabilistic Risk Assessment Studies in Yemen
 Probabilistic Risk Assessment Studies in Yemen The catastrophic risk analysis quantifies the risks of hazard, exposure, vulnerability, and loss, thus providing the decision maker with the necessary information
Changes to Alabama Flood Maps Impacts to Flood Insurance. Presented By: Leslie A. Durham, P.E. ADECA Office of Water Resources
 Changes to Alabama Flood Maps Impacts to Flood Insurance Presented By: Leslie A. Durham, P.E. ADECA Office of Water Resources January 23, 2014 1 Impacts of Flood Events Flooding is not just a coastal concern.
Offshore Wind Farms the Need for Metocean Data
 Offshore Wind Farms the Need for Metocean Data Vagner Jacobsen and Morten Rugbjerg DHI Water & Environment, Agern Allé 5, DK-2970 Hørsholm, Denmark Introduction The wind power community has a long record
A New Coastal Engineering Graduate Program
 Paper ID #12157 A New Coastal Engineering Graduate Program Dr. Robert W. Whalin, Jackson State University Dr. Robert W. Whalin, Professor of Civil and Environmental Engineering, and Director, Coastal Hazards
CRS 610 Ventura County Flood Warning System Website
 CRS 610 Ventura County Flood Warning System Website Purpose This document gives instructions and a description of the information available via the Ventura County Watershed Protection District s (VCWPD)
Impacts of Global Warming on Hurricane-related Flooding in Corpus Christi,Texas
 Impacts of Global Warming on Hurricane-related Flooding in Corpus Christi,Texas Sea-level Rise and Flood Elevation A one-foot rise in flood elevation due to both sea-level rise and hurricane intensification
Chapter 7. Emergency Services
 Chapter 7. Emergency Services Emergency services measures protect people during and after a disaster. A good emergency management program addresses all hazards and involves all City departments. At the
Disaster Risk Assessment:
 Disaster Risk Assessment: Disaster Risk Modeling Dr. Jianping Yan Disaster Risk Assessment Specialist Session Outline Overview of Risk Modeling For insurance For public policy Conceptual Model Modeling
Visualizing of Berkeley Earth, NASA GISS, and Hadley CRU averaging techniques
 Visualizing of Berkeley Earth, NASA GISS, and Hadley CRU averaging techniques Robert Rohde Lead Scientist, Berkeley Earth Surface Temperature 1/15/2013 Abstract This document will provide a simple illustration
4.3.5 - Breakaway Walls
 4.3.5 - Breakaway Walls Elevation of a structure on a properly designed foundation reduces the potential for water damage from flooding. When the space below the lowest elevated floor is maintained free
City of London Climate Change Adaptation Strategy Dealing with Extreme Rainfall Events
 City of London Climate Change Adaptation Strategy Dealing with Extreme Rainfall Events May 29, 2014 Presented by: Berta Krichker M.Eng., FEC, P.Eng. Manager of Stormwater Unit Environmental and Engineering
Association of State Flood Managers Annual Conference Wednesday, June 4, 2014
 Association of State Flood Managers Annual Conference Wednesday, June 4, 2014 Hillsborough County, In the Trenches Local Mitigation Eugene Henry, CFM, AICP Hazard Mitigation Manager Floodplain Administrator
Appendix J Online Questionnaire
 Appendix J Online Questionnaire In accordance with the Paperwork Reduction Act, this questionnaire was approved by the Office of Management and Budget (OMB). The OMB control number and expiration date
Managing sewer flood risk
 Managing sewer flood risk J. Ryu 1 *, D. Butler 2 1 Environmental and Water Resource Engineering, Department of Civil and Environmental Engineering, Imperial College, London, SW7 2AZ, UK 2 Centre for Water
Estimation of Hurricane Wind Speed Probabilities: Application to New York City and Other Coastal Locations
 `t NIST TECHNICAL NOTE 1773 Estimation of Hurricane Wind Speed Probabilities: Application to New York City and Other Coastal Locations DongHun Yeo Ning Lin Emil Simiu NIST TECHNICAL NOTE 1773 Estimation
Standard Operating Procedures for Flood Preparation and Response
 Standard Operating Procedures for Flood Preparation and Response General Discussion Hurricanes, tropical storms and intense thunderstorms support a conclusion that more severe flooding conditions than
Interactive comment on A simple 2-D inundation model for incorporating flood damage in urban drainage planning by A. Pathirana et al.
 Hydrol. Earth Syst. Sci. Discuss., 5, C2756 C2764, 2010 www.hydrol-earth-syst-sci-discuss.net/5/c2756/2010/ Author(s) 2010. This work is distributed under the Creative Commons Attribute 3.0 License. Hydrology
Use of Watermarks for Discerning Hurricane-Induced Flood Levels. Erik L. Nelson, Ph.D., P.E., M. ASCE 1
 Use of Watermarks for Discerning Hurricane-Induced Flood Levels Erik L. Nelson, Ph.D., P.E., M. ASCE 1 1 President & CEO, Nelson Architectural Engineers, Inc., 2740 Dallas Parkway Suite 220, Plano, Texas
Propagation of Discharge Uncertainty in A Flood Damage
 Propagation of Discharge Uncertainty in A Flood Damage Model for the Meuse River Yueping Xu and Martijn J. Booij Water Engineering and Management, Faculty of Engineering, University of Twente, Enschede,
Malcolm L. Spaulding Professor Emeritus, Ocean Engineering University of Rhode Island Narragansett, RI 02881
 Malcolm L. Spaulding Professor Emeritus, Ocean Engineering University of Rhode Island Narragansett, RI 02881 USACE Coastal and Hydraulics Laboratory(CHL) Data Infrastructure Workshop January 23, 2014 Overview
How To Understand And Understand The Flood Risk Of Hoang Long River In Phuon Vietnam
 FLOOD HAZARD AND RISK ASSESSMENT OF HOANG LONG RIVER BASIN, VIETNAM VU Thanh Tu 1, Tawatchai TINGSANCHALI 2 1 Water Resources University, Assistant Professor, 175 Tay Son Street, Dong Da District, Hanoi,
35 YEARS FLOOD INSURANCE CLAIMS
 40 RESOURCES NO. 191 WINTER 2016 A Look at 35 YEARS FLOOD INSURANCE CLAIMS of An analysis of more than one million flood claims under the National Flood Insurance Program reveals insights to help homeowners
Chapter 4. Flood Risk Assessment
 Chapter 4 Flood Risk Assessment Chapter Overview Any floodplain management program must be established on a sound technical and scientific basis in order to be effective, whether for flood loss reduction
New Brunswick s Flood Risk Reduction Strategy. Province of New Brunswick PO 6000, Fredericton NB E3B 5H1. www.gnb.ca
 New Brunswick s Flood Risk Reduction Strategy i New Brunswick s Flood Risk Reduction Strategy Province of New Brunswick PO 6000, Fredericton NB E3B 5H1 2014 www.gnb.ca ISBN 978-1-4605-0533-5 (print edition)
StormSurgeViz: A Visualization and Analysis Application for Distributed ADCIRC-based Coastal Storm Surge, Inundation, and Wave Modeling
 : A Visualization and Analysis Application for Distributed ADCIRC-based Coastal Storm Surge, Inundation, and Wave Modeling Brian Blanton Renaissance Computing Institute University of North Carolina at
DEPARTMENT OF THE ARMY EM 1110-2-1619 U.S. Army Corps of Engineers CECW-EH-Y Washington, DC 20314-1000
 DEPARTMENT OF THE ARMY EM 1110-2-1619 U.S. Army Corps of Engineers CECW-EH-Y Washington, DC 20314-1000 Manual No. 1110-2-1619 1 August 1996 Engineering and Design RISK-BASED ANALYSIS FOR FLOOD DAMAGE REDUCTION
Cumulative Diagrams: An Example
 Cumulative Diagrams: An Example Consider Figure 1 in which the functions (t) and (t) denote, respectively, the demand rate and the service rate (or capacity ) over time at the runway system of an airport
Aachen Summer Simulation Seminar 2014
 Aachen Summer Simulation Seminar 2014 Lecture 07 Input Modelling + Experimentation + Output Analysis Peer-Olaf Siebers pos@cs.nott.ac.uk Motivation 1. Input modelling Improve the understanding about how
Hurricanes Katrina & Rita Using Mitigation to Rebuild a Safer Gulf Coast
 ASSOCIATION OF STATE FLOODPLAIN MANAGERS, INC. 2809 Fish Hatchery Road Madison, Wisconsin 53713 608-274-0123 Fax: 608-274-0696 Website: www.floods.org Email: asfpm@floods.org Chair Pam Pogue, CFM RI Emergency
Chapter 10. The National Flood Insurance Program
 Chapter 10 The National Flood Insurance Program Chapter Overview The National Flood Insurance Program has been mentioned in numerous instances in preceding chapters. Its time has arrived in this course!
Havnepromenade 9, DK-9000 Aalborg, Denmark. Denmark. Sohngaardsholmsvej 57, DK-9000 Aalborg, Denmark
 Urban run-off volumes dependency on rainfall measurement method - Scaling properties of precipitation within a 2x2 km radar pixel L. Pedersen 1 *, N. E. Jensen 2, M. R. Rasmussen 3 and M. G. Nicolajsen
Advice For the multiple-choice questions, completely fill in the circle alongside the appropriate answer(s).
.") SPECIMEN ASSESSMENT MATERIAL GCSE GEOGRAPHY Paper 1 Living with the physical environment Specimen Materials For this paper you must have: a pencil a ruler. Time allowed: 1 hour 30 minutes Instructions
SPECIMEN ASSESSMENT MATERIAL GCSE GEOGRAPHY Paper 1 Living with the physical environment Specimen Materials For this paper you must have: a pencil a ruler. Time allowed: 1 hour 30 minutes Instructions
7) Coastal Storms: Multi-Hazard Analysis for New York City
 Coastal Storms: Multi-Hazard Analysis for New York City") 7) Coastal Storms: Multi-Hazard Analysis for New York City a) Hazard Profile i) Hazard Description Coastal storms, including nor'easters, tropical storms, and hurricanes, can and do affect New York City.
7) Coastal Storms: Multi-Hazard Analysis for New York City a) Hazard Profile i) Hazard Description Coastal storms, including nor'easters, tropical storms, and hurricanes, can and do affect New York City.
32 Contingencies MAR/APR.06
 32 Contingencies MAR/APR.06 New Catastrophe Models for Hard Times B Y P A T R I C I A G R O S S I A N D H O W A R D K U N R E U T H E R Driven by the increasing frequency and severity of natural disasters
Measurement with Ratios
 Grade 6 Mathematics, Quarter 2, Unit 2.1 Measurement with Ratios Overview Number of instructional days: 15 (1 day = 45 minutes) Content to be learned Use ratio reasoning to solve real-world and mathematical
Town of Chatham Department of Community Development
 Town of Chatham Department of Community Development TOWN ANNEX 261 GEORGE RYDER ROAD 02633 CHATHAM, MA TELEPHONE (508) 945-5168 FAX (508) 945-5163 FEMA FLOOD MAP UPDATE & PROPOSED ZONING BYLAW AMENDMENT
Monsoon Variability and Extreme Weather Events
 Monsoon Variability and Extreme Weather Events M Rajeevan National Climate Centre India Meteorological Department Pune 411 005 rajeevan@imdpune.gov.in Outline of the presentation Monsoon rainfall Variability
CHAPTER 7. EMERGENCY SERVICES
 CHAPTER 7. EMERGENCY SERVICES Although better forecasts and warning processes have helped save lives by providing more lead time to evacuate, the tremendous growth of development and human population in
Hydrologic Engineering Techniques for Regional Water Resources Planning
 US Army Corps of Engineers Hydrologic Engineering Center Hydrologic Engineering Techniques for Regional Water Resources Planning October 1969 Approved for Public Release. Distribution Unlimited. TP-17
Current Standard: Mathematical Concepts and Applications Shape, Space, and Measurement- Primary
 Shape, Space, and Measurement- Primary A student shall apply concepts of shape, space, and measurement to solve problems involving two- and three-dimensional shapes by demonstrating an understanding of:
Duty and Responsibility of Civil Engineers Following Natural Disasters. ASCE Ohio Valley Student Conference: Technical Paper.
 Duty and Responsibility of Civil Engineers Following Natural Disasters ASCE Ohio Valley Student Conference: Technical Paper by Jeffie Chang Department of Civil and Environmental Engineering Carnegie Mellon
Flood Risk Management
 Flood Risk Management Value of Flood Risk Management Every year floods sweep through communities across the United States taking lives, destroying property, shutting down businesses, harming the environment
Flood Risk Management
 Flood Risk Management Value of Flood Risk Management Value to Individuals and Communities Every year floods sweep through communities across the United States taking lives, destroying property, shutting
UNFCCC expert meeting on loss and damage 9 11 November, 2012 Barbados pcrafi.sopac.org
 Disaster Risk Assessment Tools and Applications UNFCCC expert meeting on loss and damage 9 11 November, 2012 Barbados pcrafi.sopac.org Main Outputs Pacific disaster risk assessment Probabilistic assessment
Part III. Lecture 3: Probability and Stochastic Processes. Stephen Kinsella (UL) EC4024 February 8, 2011 54 / 149
 EC4024 February 8, 2011 54 / 149") Part III Lecture 3: Probability and Stochastic Processes Stephen Kinsella (UL) EC4024 February 8, 2011 54 / 149 Today Basics of probability Empirical distributions Properties of probability distributions
Part III Lecture 3: Probability and Stochastic Processes Stephen Kinsella (UL) EC4024 February 8, 2011 54 / 149 Today Basics of probability Empirical distributions Properties of probability distributions
Flooding in San Francisco Bay: Risks and Opportunities
 Flooding in San Francisco Bay: Risks and Opportunities Photo Judy Irving Pelican Media Authors Jeffrey Mount, Saracino & Mount LLC Jeremy Lowe, ESA PWA Flooding in San Francisco Bay: Risks and Opportunities
Training session for the. Firm Yield Estimator. Version 1.0. Prepared for the Massachusetts Department of Environmental Protection
 Training session for the Firm Yield Estimator Version 1.0 Prepared for the Massachusetts Department of Environmental Protection June 6, 2000 Firm Yield Estimator - Introduction Software tool for estimating
Chapter Overview. Seasons. Earth s Seasons. Distribution of Solar Energy. Solar Energy on Earth. CHAPTER 6 Air-Sea Interaction
 Chapter Overview CHAPTER 6 Air-Sea Interaction The atmosphere and the ocean are one independent system. Earth has seasons because of the tilt on its axis. There are three major wind belts in each hemisphere.
Lower Raritan Watershed Management Area Stormwater & Flooding Subcommittee Strategy Worksheet LRSW-S3C1
 Strategy Name: Reduce Existing Potential for Flood Damages LRSW-S3C1. Develop and implement a program to: Minimize flood damages through the use of structural measures. Minimize flood damages through the
Protecting Floodplain. While Reducing Flood Losses
 Protecting Floodplain Natural and Beneficial i Functions While Reducing Flood Losses Jon Kusler Association of State Wetland Managers 518 872 1804; jon.kusler@aswm.org Report available at: http://aswm.org/pdf_lib/nbf.pdf
Next Generation Flood Alert in Houston
 Next Generation Flood Alert in Houston Philip B. Bedient Civil and Environmental Eng., Rice University Houston, TX Major Causes of Urban Flooding (Excess Water that Inundates) Highly Developed (urbanized)
Performance Level Descriptors Grade 6 Mathematics
 Performance Level Descriptors Grade 6 Mathematics Multiplying and Dividing with Fractions 6.NS.1-2 Grade 6 Math : Sub-Claim A The student solves problems involving the Major Content for grade/course with
Flood Risk Assessment in the Netherlands: A Case Study for Dike Ring South Holland
 Risk Analysis, Vol. 28, No. 5, 2008 DOI: 10.1111/j.1539-6924.2008.01103.x Flood Risk Assessment in the Netherlands: A Case Study for Dike Ring South Holland Sebastiaan N. Jonkman, 1,2 Matthijs Kok, 1,3
How To Develop A Flood Risk Map
 Recommended Procedures for Flood Velocity Data Development November 2012 Federal Emergency Management Agency Department of Homeland Security 500 C Street, SW Washington, DC 20472 This document was prepared
Seismic Risk Assessment Procedures for a System consisting of Distributed Facilities -Part three- Insurance Portfolio Analysis
 Seismic Risk Assessment Procedures for a System consisting of Distributed Facilities -Part three- Insurance Portfolio Analysis M. Achiwa & M. Sato Yasuda Risk Engineering Co., Ltd., Tokyo, Japan M. Mizutani
HAZUS 2014. 7 th Annual Conference
 HAZUS 2014 7 th Annual Conference HAZUS Comparison of Storm Surge Levels from Different Hurricanes to the Newest SLOSH Models for Berkeley, Charleston, & Dorchester Counties Along the SC Coastline. Charlie
Risk Analysis and Quantification
 Risk Analysis and Quantification 1 What is Risk Analysis? 2. Risk Analysis Methods 3. The Monte Carlo Method 4. Risk Model 5. What steps must be taken for the development of a Risk Model? 1.What is Risk
Flood Emergency Response Planning: How to Protect Your Business from a Natural Disaster RIC005
 Flood Emergency Response Planning: How to Protect Your Business from a Natural Disaster RIC005 Speakers: Tom Chan, CEO, Global Risk Miyamoto Greg Bates, Principal, Global Risk Consultants Learning Objectives
Climate Change. Lauma M. Jurkevics - DWR, Southern Region Senior Environmental Scientist
 Climate Change A n o t h e r F a c t o r i n M a n a g i n g S o u t h e r n C a l i f o r n i a s W a t e r R e s o u r c e s Lauma M. Jurkevics - DWR, Southern Region Senior Environmental Scientist USEPA-Region
Presented by: Michael DePue, PE, CFM Annual Georgia Association of Floodplain Management Conference Lake Lanier Islands, Georgia March 23, 2010
 Flood Types and Characteristics Presented by: Michael DePue, PE, CFM Annual Georgia Association of Floodplain Management Conference Lake Lanier Islands, Georgia March 23, 2010 Agenda Why study flood types?
Flood Damage Mitigation And Insurance Costs
 Flood Damage Mitigation And Insurance Costs Friday, September 25, 2015 at 7:00 PM Saturday, September 26, 2015 at 10:00 AM This presentation was prepared by the Town of South Bethany using Federal Funds
Methods for Determination of Safe Yield and Compensation Water from Storage Reservoirs
 US Army Corps of Engineers Hydrologic Engineering Center Methods for Determination of Safe Yield and Compensation Water from Storage Reservoirs October 1966 Approved for Public Release. Distribution Unlimited.