1.5 NUMERICAL REPRESENTATION OF DATA (Sample Statistics)
|
|
|
- Shon Skinner
- 7 years ago
- Views:
Transcription
1 1.5 NUMERICAL REPRESENTATION OF DATA (Sample Statistics) As well as displaying data graphically we will often wish to summarise it numerically particularly if we wish to compare two or more data sets. There are three fundamental properties of any data set in which we are interested: shape location (or average) spread (or variability) Measures of Location A change in the position of a histogram corresponds to a change in the location or position of the data set (distribution). Histogram to show old and new settings of machine 20 Frequency Old setting New setting Reading (mm) There are a number of measures of location (or average) that are commonly used. These are the mean, the median and the mode. (a) Mean Probably the most common measure of location is the mean of the data set, denoted by X. The mean is obtained by adding together all the values, or observations, and dividing by the number of values. Let X i = ith observation n = number of observations
 There are a number of measures of location (or average) that are commonly used.")
2 Then X = n X i Example Suppose a machine has been set up to cut pieces of steel to a certain length. Ten pieces of steel in succession are removed from the production line, and their lengths measured (mm) as follows: X 1 X 2 X 3 X 4 X 5 X 6 X 7 X 8 X 9 X 10 Calculate the mean length of the steel pieces sampled. Then mean = X = = X n i X + X + X +... X = 10 =141.2 mm One problem with the mean as a measure of location is that it is very sensitive to outlying (extreme) values. In these situations, if the mean is used as a 'typical value' it can give a false impression of the data. For example, a small firm consists of: 1 manager earning 30,000 per year 3 manual workers each earning 6,000 per year.
 values.")
3 If we plot this data on a dotplot it looks like :. : Wages ( ) i.e. we have an extreme value of 30,000. Calculating the mean Xi X = = n 4 = However, this mean salary is not representative since it's double what most people earn. An alternative measure of location which is much less sensitive to extreme values (robust) is the median. (b) Median The median is defined to be the value which divides the data into two equal parts, i.e. the 'middle' value. Half the values are above it and half are below it. To obtain the median (i) (ii) order the data in ascending order. For n items in the data set, the median is the n + 1 th observation. 2
 Median The median is defined to be the value which divides the data into two equal parts, i.e. the 'middle' value. Half the values are above it and half are below it.")
4 Example Consider the data set shown in the previous example. Find the median value. First, order the data X 4 X 9 X 3 X 2 X 6 X 5 X 7 X 10 X 1 X 8 Then, since we have 10 observations (data points) the median value is the th observation = (11/2) = 5.5th observation. 2 Now: 5th observation = 141 (X 6 ) 6th observation = 142 (X 5 ) So 5.5th observation = mean of 5th and 6th observations. i.e. Median =141.5 In this case, the median is very similar to the mean (=141.2) though this will not always be so. (c) Mode The mode of a set of n measurements X 1, X 2,...X n is the value of X that occurs with the greatest frequency. (i.e. the most popular or common value) It is rarely used as a measure of location unless the shape of the distribution is bimodal in which case no single measure of location gives a reasonable description. The three measures of location can be represented diagrammatically as follows:
 though this will not always be so. (c) Mode The mode of a set of n measurements X 1, X 2,.")
5 Measures of Variation Assume that you are a purchasing agent for a large manufacturing firm and that you regularly place orders with two different suppliers. After several months of operation you find that the mean number of days required to fill orders is averaging around 10 days for both suppliers. However, histograms based on historical data are shown below. 0.5 Supplier A Relative frequency No. of working days 0.5 Supplier B Relative frequency No. of working days Which supplier would you prefer to deal with? {Answer: Supplier A, as times are less variable} Although the mean supply time is the same for both suppliers we can see that there is more variation in the Supplier B delivery times. We need to be able to measure this variation so that comparisons can be made. Commonly used measures of variation are: Range Interquartile Range Standard Deviation

6 (a) Range The simplest measure of the spread or variation of a set of data is the range, R, which is defined as the difference between the largest and the smallest value. Consider the data given in a previous example i.e. 10 datum heights (in mm): Then Range = R = Maximum Minimum = = 4 mm If the data are arranged in a histogram, the range corresponds to the width of the base. The following is based on a sample of 30 turbo wheels - datum heights measured in cm. Turbo wheel height (cm) Frequency Relative frequency (139.5) (140.5) (141.5) (142.5) (143.5) (144.5) = The corresponding histogram is then :

7 Histogram of wheel datum heights 10 Frequency RANGE There are TWO problems with the Range as a measure of variation: 1. Although the range is a simple-to-use measure of variation, it only uses the two extremes of the data set (i.e. the maximum and minimum values). Thus, it is significantly affected by extreme (outlying) values within the data. 2. In addition, it measures spread on a scale that is dependent of sample size. (i.e. the range of a sample of 10 is not comparable with the range of a sample of size 100.) A range-based measure which is not so affected by extremes is the: (b) Interquartile Range The quartiles of a set of data are the values which divide the ordered data set into four equal parts. They are denoted by Q 1 = first quartile (or lower quartile) Q 2 = second quartile (or median) Q 3 = third quartile (or upper quartile) For example, suppose we have 11 observations (data points) as shown 11, 6, 4, 10, 1, 8, 5, 9, 2, 3, 7 We first order the data, (i.e. put the values into ascending numerical order) so that we get Q 1 Q 2 Q 3 Then Q 1, Q 2 and Q 3 are such that the data is divided equally into quarters as shown.
 A range-based measure which is not so affected by extremes is the: (b) Interquartile Range The quartiles of a set of data are the values which divide the ordered data set into four equal parts.")
8 In fact, for n observations, Q 1 is the Q 2 is the n + 1 th data point 4 n + 1 th data point 2 n + 1 Q 3 is the 3 th data point 4 Then the Interquartile range (IQR) is defined to be IQR = Q 3 Q 1 It is the range of the middle half of the data. Example The value (in thousands) of the items sold by Cornwood electrical company in each month for 1991 was as follows: Month Jan Feb Mar Apr May June July Aug Sept Oct Nov Dec Value First order the data: Q 1,, the first quartile, is the point taken to be n +1 of the way along the ordered 4 data set. (Remember n represents the number of data points) i.e. Q 1 is the ( n + 1 ) = ( ) = = th data point Thus Q 1 is one quarter (0.25) of the distance between the third largest and the fourth largest observation ie. one quarter of the way between 51 and 53. Hence: Q 1 = ( n + 1) Q 3 is the point taken to be of the way along the ordered data set. 4 3( n + 1) 312 ( + 1) 3 13 Hence: = = = 975. th data point 4 4 4

9 Thus Q 3 is three quarters (0.75) of the distance between the ninth largest and tenth largest observation, (i.e. 61 and 62). Hence: Q 3 = Hence the Interquartile range is: Q3 Q1 = = or 10, 250. The Interquartile range is less affected by the extreme values than the range. However it still only uses the relative position of two of our data points. Quantiles and Percentiles The idea of quartiles (which divide a set into 4 equal parts) can be generalised to statistics which divide the data into any number of equal parts, called quantiles. Of particular importance are the percentiles which divide the data into 100 equal parts. For example: 1 st percentile, p 1, has 1% of values below it, 99% above it 5 th percentile, p 5, has 5% of values below it, 95% above it 50 th percentile, p 50, has 50% of values below it, 50% above it 95 th percentile, p 95, has 95% of values below it, 5% above it 99 th percentile, p 99, has 99% of values below it, 1% above it Percentiles are particularly useful when dealing with probability distributions. (c) Standard Deviation An alternative measure of variation, which uses all the available information (i.e. all of the observations, or data points) is the standard deviation, s. It is based on the idea of measuring how far, on average, the observations are from the centre of the data.

10 To illustrate the principle, consider the following lengths of offcuts (mm) of five rods: The mean length X = 4 mm. Reading (mm) X Deviation from mean ( X X) Squared Deviations 2 ( X X) TOTALS For technical reasons, to average the squared deviations we divide by n 1 rather than n (this gives an unbiased estimate of the equivalent population characteristic). Then ( X X) n = = 5 4 This is called the variance and is denoted s 2. The variance is measured in the square of the units of the original data (s 2 = 5 mm 2 in the above) while all the other summary statistics we have considered are in the same units as the data. Thus a better measure for practical use is the square root of the variance called the standard deviation defined by: s = ( X X) n 1 2 ( = 5 = mm in above) The SD is zero if there is no variation in the data. The larger the SD, the more variation there is. For hand calculations it is more convenient to use the following formula: s = 1 ΣX n 1 2 ( ΣX) n 2 as follows
 while all the other summary statistics we have considered are in the same units as the data.")
11 X = offcut length X Then ΣX = = 20 ΣX 2 = = 100 and s = = 2 { 100 ( 20) / 5} = 5 = Thus the 5 offcut measurements have a mean of 4mm and a standard deviation of 2.236mm. Using a Calculator Most calculators have a facility to calculate means and standard deviations automatically. The exact procedure depends on the model but generally it involves (i) (ii) (iii) (iv) Get into SD or STAT mode. SD will appear on the display Clear memories by pressing INV or SHIFT then AC. Enter data. Enter each value followed by the DATA key. (M+ on some calculators.) Push X button for mean and σ n - 1 or s button for the standard deviation. (See section comment on this) Repeat the offcut example using your calculator facilities.
 (ii) (iii) (iv) Get into SD or STAT mode. SD will appear on the display Clear memories by pressing INV or SHIFT then AC.")
12 Comparison of range and standard deviation Example The examples below illustrate how the range and standard deviation compare for various samples. MEAN X RANGE R S.D. S Data Set x Data Set Data Set Data Set Data Set Data Set Note: 1 The Range does not reflect any difference in the level of variation for data sets 3, 4 and 5. Thus, it is rather crude. 2 Comparing data sets 2 and 6, we see that just shifting the data 'along the scale' (all values increased by 4 in this case) has no effect on the S.D. This is useful, for example, if required to calculate the mean and standard deviation of: What is the easiest approach? Since is the smallest number, let this be equivalent to zero.
 has no effect on the S.D.")
13 Then = = i.e. Data set is equivalent to for the purposes of calculating the SD. Then ΣX = = 15 ΣX 2 = = 67 and s = 1 ( ) = { 67 45} 4 1 = ( ) 4 22 = 55. = 2.345mm
 4 67 15 5 2 1 = { 67 45} 4 1 = ( ) 4 22 = 55. = 2.")
14 1.5.3 Choice of Measures To summarise a set of data we require one measure of location and one measure of variation. The mean and SD are the preferred measures because they use all the available data. However, they are affected by extreme values. Thus, for descriptive purposes, use as follows: An important exception to the above pairings is used in Statistical Process Control (SPC) procedures for monitoring some quality characteristic. Here, the mean and range are often used (in the familiar X R charts) because they are easiest to calculate and interpret. Finally, note that additional summary statistics are often produced by computer packages. The Excel spreadsheet, for example, also gives measure of skewness and measures of kurtosis (or flatness), but these are rarely used in practice.
 because they are easiest to calculate and interpret.")
15 1.5.4 Parameters and Statistics Distinctions between populations and samples should also be made when dealing with descriptive measures. Quantities describing features of samples (such as Xands) are called sample statistics. Quantities describing features of populations are called population parameters. Important examples of parameters are the true population mean, denoted µ, and the true population standard deviation, denoted σ. Then, for example, Xand s can be used to estimate the usually unknown µ and σ. Population parameters are FIXED constants. Sample statistics VARY from sample to sample. We are only interested in sample statistics in terms of what they tell us about the unknown population parameters. (Final Note: Many calculators, including Casio, use confused notation. The mean and SD buttons are marked Xandσ. This is simply wrong and should be avoided).

16 1.6. STRATIFICATION The scope and power of diagrams can be increased using the idea of stratification. If the data come from different known sources (e.g. machines, departments, individuals), this involves plotting for each source separately. Similarly, summary statistics can be calculated for each source separately. Example 1 Consider data available on the flange thickness of a machined part. This is continuous data. Then the Dot plot (overall) is:. : : : :......: : : :. : : Thickness (cm) Suppose that the flanges are actually formed on two different vices. If we separate the information into 2 sets of data, one for each vice, i.e. Data is stratified by vice. Then the Dot plot (stratified by vice) is: Vice A : : : Vice B... : : : : Interpretation: Thickness (cm) Both vices produce flanges with approximately the same 'average' or middle value (i.e cm). However, there is more 'variation' or 'spread' in the flanges produced by Vice A (i.e. flanges vary from to 0.454cm). Vice B is the better of the two.
 Suppose that the flanges are actually formed on two different vices. If we separate the information into 2 sets of data, one for each vice, i.e. Data is stratified by vice.")
17 Example 2 A component has two critical dimensions which should be related (if one dimension is relatively large then so should the other one be). A scatter plot of a sample of components suggests there is a problem here. (This is example 2, section ) 13 Overall Plot Dimension 2 (mm) Dimension 1 (mm) However, these components come from two suppliers and the scatter plot stratified by supplier suggests that the problem really only lies with supplier B. Plot Stratified by Supplier Dimension 2 (mm) Supplier A Supplier B Dimension 1 (mm)

18 1.7 COMPARISON OF DATA SETS We have previously shown how various measures of location (typical values) and variation (spread) can be calculated for a particular data set. Whilst these are useful for a single set of data, it is more usual to use the measures for comparing two or more data sets. For a full comparison we need to compare shape location spread and to identify if there are any outliers (odd extreme values) present. If there are any, find the reason for their 'extremeness' and remove them from the data set Guidelines for comparison (i) Draw a suitable diagram to illustrate the data. NB. In making comparisons between different data sets, we must be sure that we compare 'like with like'. Thus, if two (or more) sets contain very different numbers of observations, comparing actual numbers in classes will be inappropriate - relative frequencies must then be used. (ii) (iii) (iv) (v) Choose a suitable measure of location (this will show where the data is concentrated) and choose a suitable measure of variation (this will show the spread). Calculate (or use a statistical package to obtain) the measures. Summarise the measures, for example, as a table. Draw conclusions from the summary.
 Draw a suitable diagram to illustrate the data. NB.")
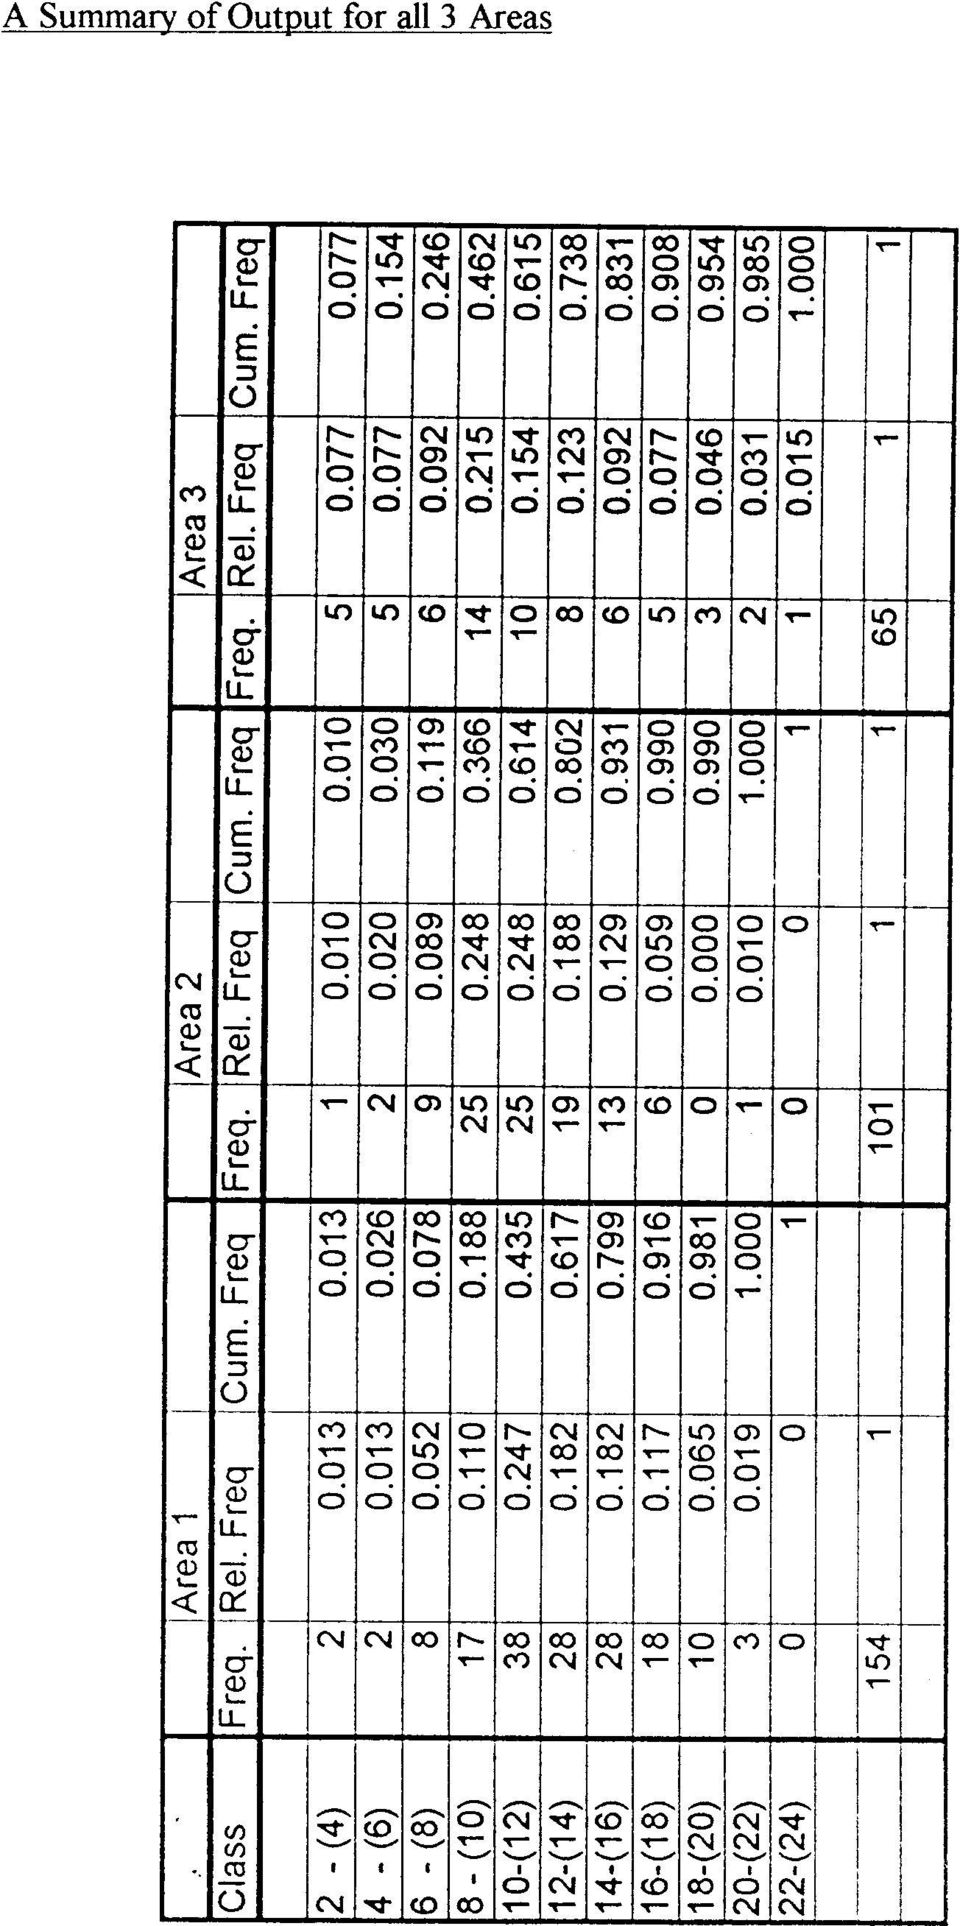
19 Example A car manufacturer has a limited range of small cars that have proved very successful. They would like to add a new edition to the range and in order to launch this in the most potentially profitable area they record the daily sales of all the other models (in total) over a three month period for a number of garages in an area of each of Devon, Cornwall and Somerset. The tabulated results of their recordings are as follows: Daily Sales Area 1 Area 2 Area 3 ('0000's) 2 - (4) (6) (8) (10) (12) (14) (16) (18) (20) (22) (24) Total By comparison of the sales in the three areas, make a recommendation to the sales manager as to the best area in which to make the initial launch of the new edition. Solution 1. PLOT Since there are different numbers of observations in each area, we must use the relative frequencies.
 2 - (4) 2 1 5 4 - (6) 2 2 5 6 - (8) 8 9 6 8 - (10) 17 25 14 10 - (12) 38 25 10 12 - (14) 28 19 8")
20
21 A suitable diagram requires the relative frequencies for each data set. NOTE:These diagrams are placed one above the other for ease of comparison. However, it is acceptable to draw all three distributions on the same set of axes provided each is shaded or coloured differently. In this case, frequency polygons are preferred to histograms.
22 2.CHOOSE MEASURES From the relative frequency polygons we can see that each is reasonably symmetric; area 3 is located to the left of the areas 1 and 2; all three have similar spreads. We choose the mean and standard deviation as the measures of location and variation respectively. 3 & 4. CALCULATE AND SUMMARISE Area 1 Area 2 Area 3 Sample size Mean Standard Deviation INTERPRET From the summary above, we can see that the standard deviations (spread) are indeed very similar, although area 2 is slightly less spread out than areas 1 or 3. Area 1 has the highest mean sales, 128,641, which is 14% higher than area 2, the next highest. If sales are the only factor to be considered in this situation, then we can recommend to the sales manager that Area 1 be chosen for the launch of the new car Boxplots A graph for summarising the features of a set of data that is particularly useful when comparing data sets is a boxplot. This is based on a 'five-number' summary of the data: Minimum value Lower quartile (Q 1 ) Median (Q 2 ) Upper quartile (Q 3 ) Maximum value These are represented as: MIN Q1 Median Q3 MAX IQR Range The width of the central box is arbitrary. Many packages (including Minitab) indicate extreme outlying values as dots or crosses as in the following examples.
23 Example 1 Comparison of camshaft lengths from 2 suppliers Length (mm) Supplier Interpretation The plots clearly show that the average (median) lengths are approximately the same for both suppliers but that there is much greater variation in length of camshafts coming from supplier 2. It can also be seen that both distributions of length are symmetrical. The single outlier flagged from supplier 1 may need further investigation but it doesn t seem to be that far away from the rest of the data. Example 2 Boxplots are particularly useful when comparing many data sets as in the following : Comparison of performance of 10 machines Daily Output Machine
24 1.8 REVIEW This section has been concerned with summarising the information contained in a sample. Data can be either Quantitative (discrete/continuous) Qualitative (categorical/attribute) Quantitative (numerical) data can be summarised by Tables (especially frequency distributions) Diagrams (especially histograms) Statistics (especially mean and SD/median and IQR) Frequency distributions and histograms describe the shape observed in the sample and suggest what the corresponding probability distributions are in the population. The mean and SD ( X and s), calculated from a sample, define more precisely certain features of the data; X measures location (or 'average'), s measures variation or spread. They estimate the corresponding 'true' values, i.e. the population parameters µ and σ. We have also considered the use of stratification to 'break down' a set of data for more meaningful comparisons.
Center: Finding the Median. Median. Spread: Home on the Range. Center: Finding the Median (cont.)
") Center: Finding the Median When we think of a typical value, we usually look for the center of the distribution. For a unimodal, symmetric distribution, it s easy to find the center it s just the center
Center: Finding the Median When we think of a typical value, we usually look for the center of the distribution. For a unimodal, symmetric distribution, it s easy to find the center it s just the center
STATS8: Introduction to Biostatistics. Data Exploration. Babak Shahbaba Department of Statistics, UCI
 STATS8: Introduction to Biostatistics Data Exploration Babak Shahbaba Department of Statistics, UCI Introduction After clearly defining the scientific problem, selecting a set of representative members
Exploratory data analysis (Chapter 2) Fall 2011
 Fall 2011") Exploratory data analysis (Chapter 2) Fall 2011 Data Examples Example 1: Survey Data 1 Data collected from a Stat 371 class in Fall 2005 2 They answered questions about their: gender, major, year in school,
Exploratory data analysis (Chapter 2) Fall 2011 Data Examples Example 1: Survey Data 1 Data collected from a Stat 371 class in Fall 2005 2 They answered questions about their: gender, major, year in school,
Biostatistics: DESCRIPTIVE STATISTICS: 2, VARIABILITY
 Biostatistics: DESCRIPTIVE STATISTICS: 2, VARIABILITY 1. Introduction Besides arriving at an appropriate expression of an average or consensus value for observations of a population, it is important to
Descriptive Statistics
 Y520 Robert S Michael Goal: Learn to calculate indicators and construct graphs that summarize and describe a large quantity of values. Using the textbook readings and other resources listed on the web
The right edge of the box is the third quartile, Q 3, which is the median of the data values above the median. Maximum Median
 CONDENSED LESSON 2.1 Box Plots In this lesson you will create and interpret box plots for sets of data use the interquartile range (IQR) to identify potential outliers and graph them on a modified box
Variables. Exploratory Data Analysis
 Exploratory Data Analysis Exploratory Data Analysis involves both graphical displays of data and numerical summaries of data. A common situation is for a data set to be represented as a matrix. There is
AP * Statistics Review. Descriptive Statistics
 AP * Statistics Review Descriptive Statistics Teacher Packet Advanced Placement and AP are registered trademark of the College Entrance Examination Board. The College Board was not involved in the production
Descriptive Statistics
 Descriptive Statistics Suppose following data have been collected (heights of 99 five-year-old boys) 117.9 11.2 112.9 115.9 18. 14.6 17.1 117.9 111.8 16.3 111. 1.4 112.1 19.2 11. 15.4 99.4 11.1 13.3 16.9
Introduction to Statistics for Psychology. Quantitative Methods for Human Sciences
 Introduction to Statistics for Psychology and Quantitative Methods for Human Sciences Jonathan Marchini Course Information There is website devoted to the course at http://www.stats.ox.ac.uk/ marchini/phs.html
Descriptive Statistics. Purpose of descriptive statistics Frequency distributions Measures of central tendency Measures of dispersion
 Descriptive Statistics Purpose of descriptive statistics Frequency distributions Measures of central tendency Measures of dispersion Statistics as a Tool for LIS Research Importance of statistics in research
Means, standard deviations and. and standard errors
 CHAPTER 4 Means, standard deviations and standard errors 4.1 Introduction Change of units 4.2 Mean, median and mode Coefficient of variation 4.3 Measures of variation 4.4 Calculating the mean and standard
Descriptive statistics Statistical inference statistical inference, statistical induction and inferential statistics
 Descriptive statistics is the discipline of quantitatively describing the main features of a collection of data. Descriptive statistics are distinguished from inferential statistics (or inductive statistics),
Exercise 1.12 (Pg. 22-23)
") Individuals: The objects that are described by a set of data. They may be people, animals, things, etc. (Also referred to as Cases or Records) Variables: The characteristics recorded about each individual.
Individuals: The objects that are described by a set of data. They may be people, animals, things, etc. (Also referred to as Cases or Records) Variables: The characteristics recorded about each individual.
Summary of Formulas and Concepts. Descriptive Statistics (Ch. 1-4)
") Summary of Formulas and Concepts Descriptive Statistics (Ch. 1-4) Definitions Population: The complete set of numerical information on a particular quantity in which an investigator is interested. We assume
Summary of Formulas and Concepts Descriptive Statistics (Ch. 1-4) Definitions Population: The complete set of numerical information on a particular quantity in which an investigator is interested. We assume
Week 1. Exploratory Data Analysis
 Week 1 Exploratory Data Analysis Practicalities This course ST903 has students from both the MSc in Financial Mathematics and the MSc in Statistics. Two lectures and one seminar/tutorial per week. Exam
3: Summary Statistics
 3: Summary Statistics Notation Let s start by introducing some notation. Consider the following small data set: 4 5 30 50 8 7 4 5 The symbol n represents the sample size (n = 0). The capital letter X denotes
STAT355 - Probability & Statistics
 STAT355 - Probability & Statistics Instructor: Kofi Placid Adragni Fall 2011 Chap 1 - Overview and Descriptive Statistics 1.1 Populations, Samples, and Processes 1.2 Pictorial and Tabular Methods in Descriptive
1.3 Measuring Center & Spread, The Five Number Summary & Boxplots. Describing Quantitative Data with Numbers
 1.3 Measuring Center & Spread, The Five Number Summary & Boxplots Describing Quantitative Data with Numbers 1.3 I can n Calculate and interpret measures of center (mean, median) in context. n Calculate
Northumberland Knowledge
 Northumberland Knowledge Know Guide How to Analyse Data - November 2012 - This page has been left blank 2 About this guide The Know Guides are a suite of documents that provide useful information about
Exploratory Data Analysis. Psychology 3256
 Exploratory Data Analysis Psychology 3256 1 Introduction If you are going to find out anything about a data set you must first understand the data Basically getting a feel for you numbers Easier to find
Chapter 1: Looking at Data Section 1.1: Displaying Distributions with Graphs
 Types of Variables Chapter 1: Looking at Data Section 1.1: Displaying Distributions with Graphs Quantitative (numerical)variables: take numerical values for which arithmetic operations make sense (addition/averaging)
a. mean b. interquartile range c. range d. median
 3. Since 4. The HOMEWORK 3 Due: Feb.3 1. A set of data are put in numerical order, and a statistic is calculated that divides the data set into two equal parts with one part below it and the other part
2 Describing, Exploring, and
 2 Describing, Exploring, and Comparing Data This chapter introduces the graphical plotting and summary statistics capabilities of the TI- 83 Plus. First row keys like \ R (67$73/276 are used to obtain
MBA 611 STATISTICS AND QUANTITATIVE METHODS
 MBA 611 STATISTICS AND QUANTITATIVE METHODS Part I. Review of Basic Statistics (Chapters 1-11) A. Introduction (Chapter 1) Uncertainty: Decisions are often based on incomplete information from uncertain
Lesson 4 Measures of Central Tendency
 Outline Measures of a distribution s shape -modality and skewness -the normal distribution Measures of central tendency -mean, median, and mode Skewness and Central Tendency Lesson 4 Measures of Central
Data Exploration Data Visualization
 Data Exploration Data Visualization What is data exploration? A preliminary exploration of the data to better understand its characteristics. Key motivations of data exploration include Helping to select
Exploratory Data Analysis
 Exploratory Data Analysis Johannes Schauer johannes.schauer@tugraz.at Institute of Statistics Graz University of Technology Steyrergasse 17/IV, 8010 Graz www.statistics.tugraz.at February 12, 2008 Introduction
Box Plots. Objectives To create, read, and interpret box plots; and to find the interquartile range of a data set. Family Letters
 Bo Plots Objectives To create, read, and interpret bo plots; and to find the interquartile range of a data set. www.everydaymathonline.com epresentations etoolkit Algorithms Practice EM Facts Workshop
DESCRIPTIVE STATISTICS. The purpose of statistics is to condense raw data to make it easier to answer specific questions; test hypotheses.
 DESCRIPTIVE STATISTICS The purpose of statistics is to condense raw data to make it easier to answer specific questions; test hypotheses. DESCRIPTIVE VS. INFERENTIAL STATISTICS Descriptive To organize,
Lecture 1: Review and Exploratory Data Analysis (EDA)
") Lecture 1: Review and Exploratory Data Analysis (EDA) Sandy Eckel seckel@jhsph.edu Department of Biostatistics, The Johns Hopkins University, Baltimore USA 21 April 2008 1 / 40 Course Information I Course
Lecture 1: Review and Exploratory Data Analysis (EDA) Sandy Eckel seckel@jhsph.edu Department of Biostatistics, The Johns Hopkins University, Baltimore USA 21 April 2008 1 / 40 Course Information I Course
Students summarize a data set using box plots, the median, and the interquartile range. Students use box plots to compare two data distributions.
 Student Outcomes Students summarize a data set using box plots, the median, and the interquartile range. Students use box plots to compare two data distributions. Lesson Notes The activities in this lesson
Describing, Exploring, and Comparing Data
 24 Chapter 2. Describing, Exploring, and Comparing Data Chapter 2. Describing, Exploring, and Comparing Data There are many tools used in Statistics to visualize, summarize, and describe data. This chapter
Lecture 2. Summarizing the Sample
 Lecture 2 Summarizing the Sample WARNING: Today s lecture may bore some of you It s (sort of) not my fault I m required to teach you about what we re going to cover today. I ll try to make it as exciting
consider the number of math classes taken by math 150 students. how can we represent the results in one number?
 ch 3: numerically summarizing data - center, spread, shape 3.1 measure of central tendency or, give me one number that represents all the data consider the number of math classes taken by math 150 students.
Data Analysis Tools. Tools for Summarizing Data
 Data Analysis Tools This section of the notes is meant to introduce you to many of the tools that are provided by Excel under the Tools/Data Analysis menu item. If your computer does not have that tool
Pie Charts. proportion of ice-cream flavors sold annually by a given brand. AMS-5: Statistics. Cherry. Cherry. Blueberry. Blueberry. Apple.
 Graphical Representations of Data, Mean, Median and Standard Deviation In this class we will consider graphical representations of the distribution of a set of data. The goal is to identify the range of
2. Filling Data Gaps, Data validation & Descriptive Statistics
 2. Filling Data Gaps, Data validation & Descriptive Statistics Dr. Prasad Modak Background Data collected from field may suffer from these problems Data may contain gaps ( = no readings during this period)
CA200 Quantitative Analysis for Business Decisions. File name: CA200_Section_04A_StatisticsIntroduction
 CA200 Quantitative Analysis for Business Decisions File name: CA200_Section_04A_StatisticsIntroduction Table of Contents 4. Introduction to Statistics... 1 4.1 Overview... 3 4.2 Discrete or continuous
6.4 Normal Distribution
 Contents 6.4 Normal Distribution....................... 381 6.4.1 Characteristics of the Normal Distribution....... 381 6.4.2 The Standardized Normal Distribution......... 385 6.4.3 Meaning of Areas under
How To Write A Data Analysis
 Mathematics Probability and Statistics Curriculum Guide Revised 2010 This page is intentionally left blank. Introduction The Mathematics Curriculum Guide serves as a guide for teachers when planning instruction
Introduction to Environmental Statistics. The Big Picture. Populations and Samples. Sample Data. Examples of sample data
 A Few Sources for Data Examples Used Introduction to Environmental Statistics Professor Jessica Utts University of California, Irvine jutts@uci.edu 1. Statistical Methods in Water Resources by D.R. Helsel
Foundation of Quantitative Data Analysis
 Foundation of Quantitative Data Analysis Part 1: Data manipulation and descriptive statistics with SPSS/Excel HSRS #10 - October 17, 2013 Reference : A. Aczel, Complete Business Statistics. Chapters 1
Common Tools for Displaying and Communicating Data for Process Improvement
 Common Tools for Displaying and Communicating Data for Process Improvement Packet includes: Tool Use Page # Box and Whisker Plot Check Sheet Control Chart Histogram Pareto Diagram Run Chart Scatter Plot
Geostatistics Exploratory Analysis
 Instituto Superior de Estatística e Gestão de Informação Universidade Nova de Lisboa Master of Science in Geospatial Technologies Geostatistics Exploratory Analysis Carlos Alberto Felgueiras cfelgueiras@isegi.unl.pt
CHAPTER THREE COMMON DESCRIPTIVE STATISTICS COMMON DESCRIPTIVE STATISTICS / 13
 COMMON DESCRIPTIVE STATISTICS / 13 CHAPTER THREE COMMON DESCRIPTIVE STATISTICS The analysis of data begins with descriptive statistics such as the mean, median, mode, range, standard deviation, variance,
Mind on Statistics. Chapter 2
 Mind on Statistics Chapter 2 Sections 2.1 2.3 1. Tallies and cross-tabulations are used to summarize which of these variable types? A. Quantitative B. Mathematical C. Continuous D. Categorical 2. The table
Good luck! BUSINESS STATISTICS FINAL EXAM INSTRUCTIONS. Name:
 Glo bal Leadership M BA BUSINESS STATISTICS FINAL EXAM Name: INSTRUCTIONS 1. Do not open this exam until instructed to do so. 2. Be sure to fill in your name before starting the exam. 3. You have two hours
Data! Data! Data! I can t make bricks without clay. Sherlock Holmes, The Copper Beeches, 1892.
 1. Data: exploratory data analysis Content 1.1 Introduction 1.2 Tables and diagrams 1.3 Describing univariate numerical data Ref: Pagano and Gauvreau, Chapters 2 and 3. Data! Data! Data! I can t make bricks
Describing and presenting data
 Describing and presenting data All epidemiological studies involve the collection of data on the exposures and outcomes of interest. In a well planned study, the raw observations that constitute the data
CALCULATIONS & STATISTICS
 CALCULATIONS & STATISTICS CALCULATION OF SCORES Conversion of 1-5 scale to 0-100 scores When you look at your report, you will notice that the scores are reported on a 0-100 scale, even though respondents
Summarizing and Displaying Categorical Data
 Summarizing and Displaying Categorical Data Categorical data can be summarized in a frequency distribution which counts the number of cases, or frequency, that fall into each category, or a relative frequency
Lecture 2: Descriptive Statistics and Exploratory Data Analysis
 Lecture 2: Descriptive Statistics and Exploratory Data Analysis Further Thoughts on Experimental Design 16 Individuals (8 each from two populations) with replicates Pop 1 Pop 2 Randomly sample 4 individuals
 T O P I C 1 2 Techniques and tools for data analysis Preview Introduction In chapter 3 of Statistics In A Day different combinations of numbers and types of variables are presented. We go through these
Algebra I Vocabulary Cards
 Algebra I Vocabulary Cards Table of Contents Expressions and Operations Natural Numbers Whole Numbers Integers Rational Numbers Irrational Numbers Real Numbers Absolute Value Order of Operations Expression
Engineering Problem Solving and Excel. EGN 1006 Introduction to Engineering
 Engineering Problem Solving and Excel EGN 1006 Introduction to Engineering Mathematical Solution Procedures Commonly Used in Engineering Analysis Data Analysis Techniques (Statistics) Curve Fitting techniques
Measures of Central Tendency and Variability: Summarizing your Data for Others
 Measures of Central Tendency and Variability: Summarizing your Data for Others 1 I. Measures of Central Tendency: -Allow us to summarize an entire data set with a single value (the midpoint). 1. Mode :
Session 7 Bivariate Data and Analysis
 Session 7 Bivariate Data and Analysis Key Terms for This Session Previously Introduced mean standard deviation New in This Session association bivariate analysis contingency table co-variation least squares
THE BINOMIAL DISTRIBUTION & PROBABILITY
 REVISION SHEET STATISTICS 1 (MEI) THE BINOMIAL DISTRIBUTION & PROBABILITY The main ideas in this chapter are Probabilities based on selecting or arranging objects Probabilities based on the binomial distribution
Projects Involving Statistics (& SPSS)
") Projects Involving Statistics (& SPSS) Academic Skills Advice Starting a project which involves using statistics can feel confusing as there seems to be many different things you can do (charts, graphs,
Projects Involving Statistics (& SPSS) Academic Skills Advice Starting a project which involves using statistics can feel confusing as there seems to be many different things you can do (charts, graphs,
Probability and Statistics Vocabulary List (Definitions for Middle School Teachers)
") Probability and Statistics Vocabulary List (Definitions for Middle School Teachers) B Bar graph a diagram representing the frequency distribution for nominal or discrete data. It consists of a sequence
Probability and Statistics Vocabulary List (Definitions for Middle School Teachers) B Bar graph a diagram representing the frequency distribution for nominal or discrete data. It consists of a sequence
A Correlation of. to the. South Carolina Data Analysis and Probability Standards
 A Correlation of to the South Carolina Data Analysis and Probability Standards INTRODUCTION This document demonstrates how Stats in Your World 2012 meets the indicators of the South Carolina Academic Standards
2. Here is a small part of a data set that describes the fuel economy (in miles per gallon) of 2006 model motor vehicles.
 of 2006 model motor vehicles.") Math 1530-017 Exam 1 February 19, 2009 Name Student Number E There are five possible responses to each of the following multiple choice questions. There is only on BEST answer. Be sure to read all possible
Math 1530-017 Exam 1 February 19, 2009 Name Student Number E There are five possible responses to each of the following multiple choice questions. There is only on BEST answer. Be sure to read all possible
MEASURES OF VARIATION
 NORMAL DISTRIBTIONS MEASURES OF VARIATION In statistics, it is important to measure the spread of data. A simple way to measure spread is to find the range. But statisticians want to know if the data are
Final Exam Practice Problem Answers
 Final Exam Practice Problem Answers The following data set consists of data gathered from 77 popular breakfast cereals. The variables in the data set are as follows: Brand: The brand name of the cereal
BASIC STATISTICAL METHODS FOR GENOMIC DATA ANALYSIS
 BASIC STATISTICAL METHODS FOR GENOMIC DATA ANALYSIS SEEMA JAGGI Indian Agricultural Statistics Research Institute Library Avenue, New Delhi-110 012 seema@iasri.res.in Genomics A genome is an organism s
Bar Graphs and Dot Plots
 CONDENSED L E S S O N 1.1 Bar Graphs and Dot Plots In this lesson you will interpret and create a variety of graphs find some summary values for a data set draw conclusions about a data set based on graphs
The Big Picture. Describing Data: Categorical and Quantitative Variables Population. Descriptive Statistics. Community Coalitions (n = 175)
") Describing Data: Categorical and Quantitative Variables Population The Big Picture Sampling Statistical Inference Sample Exploratory Data Analysis Descriptive Statistics In order to make sense of data,
Describing Data: Categorical and Quantitative Variables Population The Big Picture Sampling Statistical Inference Sample Exploratory Data Analysis Descriptive Statistics In order to make sense of data,
BNG 202 Biomechanics Lab. Descriptive statistics and probability distributions I
 BNG 202 Biomechanics Lab Descriptive statistics and probability distributions I Overview The overall goal of this short course in statistics is to provide an introduction to descriptive and inferential
EXAM #1 (Example) Instructor: Ela Jackiewicz. Relax and good luck!
 Instructor: Ela Jackiewicz. Relax and good luck!") STP 231 EXAM #1 (Example) Instructor: Ela Jackiewicz Honor Statement: I have neither given nor received information regarding this exam, and I will not do so until all exams have been graded and returned.
STP 231 EXAM #1 (Example) Instructor: Ela Jackiewicz Honor Statement: I have neither given nor received information regarding this exam, and I will not do so until all exams have been graded and returned.
This unit will lay the groundwork for later units where the students will extend this knowledge to quadratic and exponential functions.
 Algebra I Overview View unit yearlong overview here Many of the concepts presented in Algebra I are progressions of concepts that were introduced in grades 6 through 8. The content presented in this course
Descriptive Statistics and Measurement Scales
 Descriptive Statistics 1 Descriptive Statistics and Measurement Scales Descriptive statistics are used to describe the basic features of the data in a study. They provide simple summaries about the sample
Box-and-Whisker Plots
 Mathematics Box-and-Whisker Plots About this Lesson This is a foundational lesson for box-and-whisker plots (boxplots), a graphical tool used throughout statistics for displaying data. During the lesson,
Descriptive Statistics
 Descriptive Statistics Descriptive statistics consist of methods for organizing and summarizing data. It includes the construction of graphs, charts and tables, as well various descriptive measures such
How To Check For Differences In The One Way Anova
 MINITAB ASSISTANT WHITE PAPER This paper explains the research conducted by Minitab statisticians to develop the methods and data checks used in the Assistant in Minitab 17 Statistical Software. One-Way
AP Statistics Solutions to Packet 2
 AP Statistics Solutions to Packet 2 The Normal Distributions Density Curves and the Normal Distribution Standard Normal Calculations HW #9 1, 2, 4, 6-8 2.1 DENSITY CURVES (a) Sketch a density curve that
Confidence Intervals for One Standard Deviation Using Standard Deviation
 Chapter 640 Confidence Intervals for One Standard Deviation Using Standard Deviation Introduction This routine calculates the sample size necessary to achieve a specified interval width or distance from
Module 3: Correlation and Covariance
 Using Statistical Data to Make Decisions Module 3: Correlation and Covariance Tom Ilvento Dr. Mugdim Pašiƒ University of Delaware Sarajevo Graduate School of Business O ften our interest in data analysis
Box-and-Whisker Plots
 Learning Standards HSS-ID.A. HSS-ID.A.3 3 9 23 62 3 COMMON CORE.2 Numbers of First Cousins 0 3 9 3 45 24 8 0 3 3 6 8 32 8 0 5 4 Box-and-Whisker Plots Essential Question How can you use a box-and-whisker
Probability Distributions
 CHAPTER 5 Probability Distributions CHAPTER OUTLINE 5.1 Probability Distribution of a Discrete Random Variable 5.2 Mean and Standard Deviation of a Probability Distribution 5.3 The Binomial Distribution
HISTOGRAMS, CUMULATIVE FREQUENCY AND BOX PLOTS
 Mathematics Revision Guides Histograms, Cumulative Frequency and Box Plots Page 1 of 25 M.K. HOME TUITION Mathematics Revision Guides Level: GCSE Higher Tier HISTOGRAMS, CUMULATIVE FREQUENCY AND BOX PLOTS
Statistical Process Control (SPC) Training Guide
 Training Guide") Statistical Process Control (SPC) Training Guide Rev X05, 09/2013 What is data? Data is factual information (as measurements or statistics) used as a basic for reasoning, discussion or calculation. (Merriam-Webster
Statistical Process Control (SPC) Training Guide Rev X05, 09/2013 What is data? Data is factual information (as measurements or statistics) used as a basic for reasoning, discussion or calculation. (Merriam-Webster
Dongfeng Li. Autumn 2010
 Autumn 2010 Chapter Contents Some statistics background; ; Comparing means and proportions; variance. Students should master the basic concepts, descriptive statistics measures and graphs, basic hypothesis
Sampling and Descriptive Statistics
 Sampling and Descriptive Statistics Berlin Chen Department of Computer Science & Information Engineering National Taiwan Normal University Reference: 1. W. Navidi. Statistics for Engineering and Scientists.
DATA INTERPRETATION AND STATISTICS
 PholC60 September 001 DATA INTERPRETATION AND STATISTICS Books A easy and systematic introductory text is Essentials of Medical Statistics by Betty Kirkwood, published by Blackwell at about 14. DESCRIPTIVE
Diagrams and Graphs of Statistical Data
 Diagrams and Graphs of Statistical Data One of the most effective and interesting alternative way in which a statistical data may be presented is through diagrams and graphs. There are several ways in
Measurement with Ratios
 Grade 6 Mathematics, Quarter 2, Unit 2.1 Measurement with Ratios Overview Number of instructional days: 15 (1 day = 45 minutes) Content to be learned Use ratio reasoning to solve real-world and mathematical
Chapter 10. Key Ideas Correlation, Correlation Coefficient (r),
,") Chapter 0 Key Ideas Correlation, Correlation Coefficient (r), Section 0-: Overview We have already explored the basics of describing single variable data sets. However, when two quantitative variables
Chapter 0 Key Ideas Correlation, Correlation Coefficient (r), Section 0-: Overview We have already explored the basics of describing single variable data sets. However, when two quantitative variables
The Dummy s Guide to Data Analysis Using SPSS
 The Dummy s Guide to Data Analysis Using SPSS Mathematics 57 Scripps College Amy Gamble April, 2001 Amy Gamble 4/30/01 All Rights Rerserved TABLE OF CONTENTS PAGE Helpful Hints for All Tests...1 Tests
Data Mining: Exploring Data. Lecture Notes for Chapter 3. Introduction to Data Mining
 Data Mining: Exploring Data Lecture Notes for Chapter 3 Introduction to Data Mining by Tan, Steinbach, Kumar What is data exploration? A preliminary exploration of the data to better understand its characteristics.
Opgaven Onderzoeksmethoden, Onderdeel Statistiek
 Opgaven Onderzoeksmethoden, Onderdeel Statistiek 1. What is the measurement scale of the following variables? a Shoe size b Religion c Car brand d Score in a tennis game e Number of work hours per week
Section 3: Examining Center, Spread, and Shape with Box Plots
 Section 3: Examining Center, Spread, and Shape with Box Plots Q32. So far with my examination of the data, most of the data seems to be skewed. Expenditure per student and revenue per student are both
Chapter 3. The Normal Distribution
 Chapter 3. The Normal Distribution Topics covered in this chapter: Z-scores Normal Probabilities Normal Percentiles Z-scores Example 3.6: The standard normal table The Problem: What proportion of observations
99.37, 99.38, 99.38, 99.39, 99.39, 99.39, 99.39, 99.40, 99.41, 99.42 cm
 Error Analysis and the Gaussian Distribution In experimental science theory lives or dies based on the results of experimental evidence and thus the analysis of this evidence is a critical part of the
Week 4: Standard Error and Confidence Intervals
 Health Sciences M.Sc. Programme Applied Biostatistics Week 4: Standard Error and Confidence Intervals Sampling Most research data come from subjects we think of as samples drawn from a larger population.
Week 3&4: Z tables and the Sampling Distribution of X
 Week 3&4: Z tables and the Sampling Distribution of X 2 / 36 The Standard Normal Distribution, or Z Distribution, is the distribution of a random variable, Z N(0, 1 2 ). The distribution of any other normal
Module 4: Data Exploration
 Module 4: Data Exploration Now that you have your data downloaded from the Streams Project database, the detective work can begin! Before computing any advanced statistics, we will first use descriptive
4. Continuous Random Variables, the Pareto and Normal Distributions
 4. Continuous Random Variables, the Pareto and Normal Distributions A continuous random variable X can take any value in a given range (e.g. height, weight, age). The distribution of a continuous random
SPSS Manual for Introductory Applied Statistics: A Variable Approach
 SPSS Manual for Introductory Applied Statistics: A Variable Approach John Gabrosek Department of Statistics Grand Valley State University Allendale, MI USA August 2013 2 Copyright 2013 John Gabrosek. All