The sceptical optimist: Mike Schussler Economists.co.za. 1
|
|
|
- Eleanore Cooper
- 7 years ago
- Views:
Transcription

1 The sceptical optimist: Mike Schussler Economists.co.za 1

2 A short History and context. The employee losses in the current platinum strike. Entry level Average Other losses from the strike. Economic losses from a few recent strikes. An economic forecast. Tax losses. A forecast on strikes in SA.

3 The recent history of strikes in SA shows an upward trend which I do not believe was expected by most. 3

4 Millions Work days lost. Five year smoothed average in Workdays lost The data is from Andrew Levy(via J Visser review for pre 1990 data). The 2013 data is my estimate based on Andrew levy for first three quarters and 2014 is so far via own calculations up to April. Andrew Levy data differ from Department of Labour data but show similar trends. The Trend is a simple five year moving average to show trends in work days lost due to strikes. Five year moving averages is what many consider to be a better indicator in strike trends as data can differ widely from year to year. There is a clear upward trend at present

5 UK SA SA public sector strike Winter of Discontent Mineworkers strike along with others against closures of mines SA Public sector strike

6 Iceland Spain Greece Canada South Africa Turkey Korea Italy Finland Denmark Australia Ireland New Zealand France Norway Sweden United Kingdom United States Poland Portugal Belgium Netherlands Germany Luxembourg Austria Japan Switzerland Some countries including SA; Japan and others until Data for SA from: A racially divided class: Strikes in South Africa, Wessel Visser of Stellenbosch. The rest from OECD table D

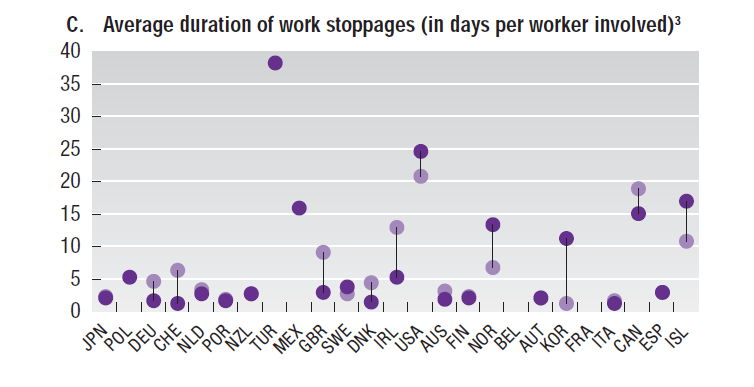
7 Japan Thailand Phillipines Hungary Sweden Poland NZ USA UK Malta Australia Italy Ireland Korea Spain Finland Sri Lanka Denmark Canada South Africa Sources: Society at a glance and EU Industrial relations report. This is a five year average from 2005 to In some cases it may be that the data is for the five years to


8 8
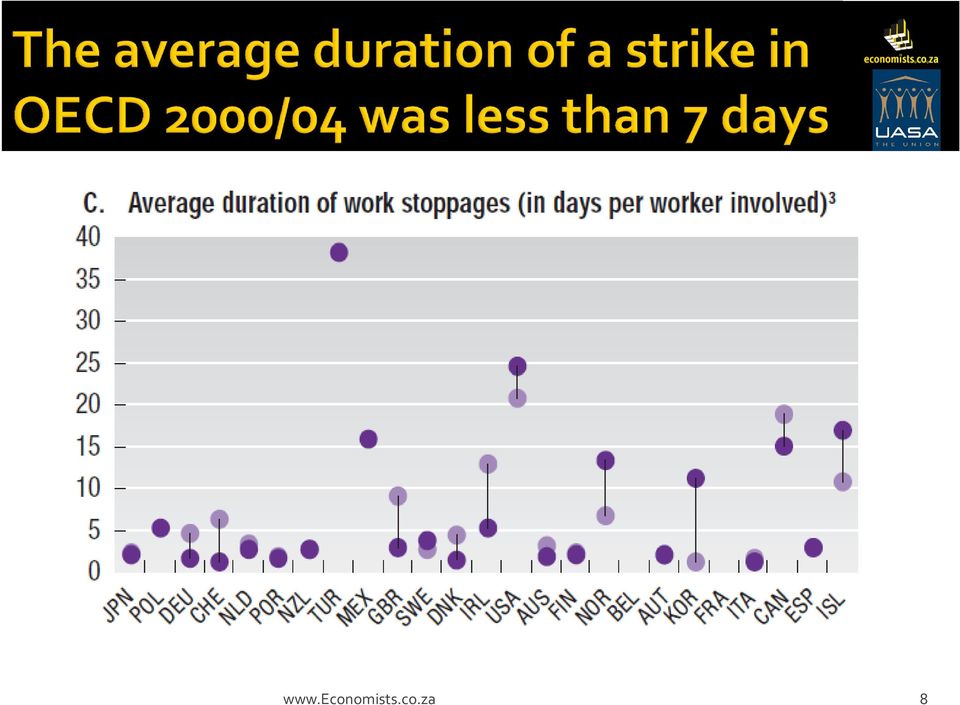
9 Differ from country to country and time period. Not much data around but the average strike lasted less than 7 days according to OECD data for the five years to The typical strike was just about 3 days in OECD countries. This is less than the typical 5 days in the early 1980s. Also strikers are paid at least partly from union strike funds in most of these countries. But in France in 1968 there was a very long general strike that lasted weeks. The longest strike was by 130 hotel workers that officially lasted ten years but 40 workers left the strike in first few days. In the end there were no original employees on strike anymore. 9

10 Platinum strikes the biggest since Very close to surpassing what is believed to be the biggest private sector strike ever. Total workdays lost in platinum over last two years now exceeds 8 million workdays. This means more than 40 days per worker has been lost in platinum industry. This is probably the biggest financial loss as well as the biggest workday losses ever in private sector. 10

11 4 out of 10 adults work (6 out of ten world average). 2,5 in the formal non farm sector (similar to non farm payrolls in USA and also 98% of PIT tax payers in this sector). 1,5 work in informal, domestic or farm and subsistence sector. Formal employment outside of government sector constrained. QES data suggest that private sector still under 2006 level. SA workers median wage is R3100 compared to Around R660 for world median. (LFS type surveys via ILO) 11


12 Probably the biggest loser but remember no one wins here. 12

13 Employees On Strike Number of People Affected by Strike Employees whose Salaries/Wages are directly affected by strike in the platinum strikes (Including Contractors) Contractors on the Platinum Mines that are not being paid Non striking workers effected directly Workforce Affected in Direct Mining Industry 13

14 Actual Money lost per entry level employee since strike began Rand Lonmin Implats Amplats Average Main Companies Involved 14

15 Wage Benefits 5016 Overtime/ production bonus Gross work income lost (total) Non work losses average household debt level 3414 Gross losses from work and nonwork The wages used are the average wages of the three companies said entry level wages of last year with 8% added on as that was the offer as strike started. The overtime is typical and estimated as 40% on top of the actual cash wages. Debt is calculated at 75% of gross income. Prime plus 8% is used for calculation. All data is linked to the number of days lost. 15

16 Wage Benefits 9697 Overtime/ production bonus Gross work income lost (total) Non work losses average household debt level 6089 Gross losses from work and nonwork The wages used are the average wages of the three companies said average wages of last year with 8% added on as that was the offer as strike started. The overtime is typical and estimated as 40% on top of the actual cash wages. Debt is calculated at 75% of gross income. Prime plus 8% is used for calculation. All data is linked to the number of days lost. 16

17 The average non-striking employee has lost about R in overtime and production bonuses so far. That is about R5 000 per month and is about a quarter of their income. This too is hurting as many have commitments and our last survey showed that average discretionary spending is only about R2 000 pm or less than 17% of their income. They too will give up paying something and therefore incur debt and penalties although no fault of their own. 17

18 While income lower than mine employees they still have major losses. While they are less than 20% of the people affected on the mines (+/ vs ) They earn just slightly less than employees and probably they have lost about R1 billion in income at present. They only earn when they work so they have lost a lot and they often do not have any security of employment. 18

19 45.0% 40.0% 35.0% 30.0% 25.0% 20.0% 15.0% 10.0% 5.0% % of After Tax (Net) Yearly Income lost for Average Employee including benefits Increase needed to make up income loss in one year after taxes and taking account of debt first. If debt takes longer to repay or new debt is incurred, the gross increase needed will increase. 26.6% 21.1% 22.8% 42.8% 0.0% Time Strike alone % Net Loss from strike after tax % Net loss including debt % gross increase needed to make up for losses. 19


20 40% 35% Losses / Raise needed as percentage of annual income after taxes (Net) Raise needed to make up income loss in one year after taxes and taking account of debt first. If debt takes longer to repay or new loans are made then gross increase will have to be higher. 37.0% 30% 25% 22.8% 25.7% 24.7% 20% 15% % Net Loss from Strike alone % Net Loss with debt interest added % Net Loss with overtime plus interest as per household debt average Gross increase needed 20

21 Even if increase given to their total cash payments to R12521 by July a 61% increase. Inflation is at 6% would make the overall real increase only about 35% in todays money. While entry level workers will need a 37% increase needed over time with interest on debt etc. It is unlikely that they make up current losses at all. Even assuming debt paid off immediately with the 37% increase. Average employees who needed a 47% increase by Tuesday will need even longer and will never make up the money lost. Also since 2012 about 8% of all jobs in the platinum industry have gone. It is very likely that 30% of all jobs could go in the next four years before the final increase. 21

22 22
23 Many of the above employees have lost bonuses which can make up another 50% or so of the basic wage. It can make up to around 30 to 40% of take home pay. (about people) Many who have high debt levels have been forced to sell things such as cars etc. Almost all contractors have lost all of their income for the period of the strike. (About ) These people usually get less than miners and many had to sell nearly everything from kitchen appliances to TV s and of course the car. 23
24 No production bonus in the next while as mines will take a few months to get back to levels where production bonuses can be earned. Many have been forced to take leave and some future leave in next few years has also been taken. Many are unlikely to have leave for a while. Confidence in industry is also waning so some are looking elsewhere for employment. 24
25 It is impossible to estimate the total number of others affected outside of the industry. It is clear however that many thousands of others are affected and it is unlikely to be less than another More likely to be in the region of to adults who either lost jobs or are working short time or giving up bonuses and the like. Includes engineers; clothing suppliers; manufacturers of mining equipment; retailers; service providers in many areas as miners and mines themselves buy much less. 25
26 The number of workers, self employed etc. affected is therefore estimated to be in the region of to people. This will grow over time. As many firms close their doors, others will find difficulty in staying open who are even further removed from the mining industry. Remember that some miners are now competing with say hairdressers or shop keepers to stay alive. Also even schools and municipalities are affected by these strikes as the length makes help ever less likely. 26

27 Municipalities (Rustenburg) have reported a drop of 27% in service payments. About 60% of the city economy is related to mining. Many businesses are being forced to close. This is expected to increase as even unrelated businesses are under pressure and more people will not be able to pay municipal bills. Other towns such as Brits; Pretoria West; Thabazimbi also feel the effects. More businesses are at risk. Areas where miners come from and send money too are also feeling the effect. 27
28 The property market could (like with Marikana) see less sales (about a 30% drop for two to three months). We also expect at least some building activity in the broader area to be affected. Repossessions will happen with cars probably first in line but will spill over to housing market. Defaulting on loans and the inability to get normal loans will drive up the cost of borrowing for almost all involved. 28

29 Major losses this year and probably some form of capital needed to power up to full production levels. Switch to more mechanisation and to the easier reef UG2 which allows for firms employing fewer people. Slow decline in number of shafts in the Hans Merensky reef in Rustenburg and Brits areas. The employees in the industry could drop to under within a few years. 29

30 Using two recent examples of long strikes in South Africa -in the Motor Industry and the Platinum Industry. 30
31 Median monthly earnings of employees by industry (2013) Data from StatsSA LFS. Include informal sector; and in surveys many forget the pension; medical; taxes and other things that is taken off their salary before it is drawn from the bank. SA median is currently R3033 compared to International median of R660. Often people only look at basic pay and not things like housing allowances, bonuses; etc. Includes public sector 31
32 32
33 33
34 34
35 Mining production will show decline this year! Manufacturing should be positive for the year but negative for the first quarter. Retail sales growth will be below 2% for a period probably from March to June. Electricity usage will also be lower. Eskom will not reach target as smelters use a lot of power and they are switched off in some cases. The Current Account will again be under pressure. 35
36 36
37 Year GDP Growth Consensus (Last year budget time forecasts) 2012 (actual) (actual) (2.71) (3.53) (3.84) (3.53) (3.59)

38 The cost of the strike is now well over R15 billion and as it is a primary industry almost all can be taken away from GDP as well as Exports. This means that GDP will be 0,4% lower directly but more likely about 0,6% lower than would otherwise be the case. Many sectors will lose from domestic tourism to manufacturing and retail sales. I do not think there has been a strike of this magnitude ever in SA. (Earlier data is not compatible) The fact that the platinum price did not rise when the biggest producers in the world shut down is also of concern. 38
39 Government losses out too and that means our deficit is likely to be higher too. 39
40 40.0% 30.0% Since the last quarter of 2002 personal tax has increased with 167,3% until the last quarter 2012mostly due to bracket creep. Over the same period inflation increased with 55,4% and average salaries around 85%. About 40% of the increase in personal taxes is due to the fact that tax breaks in the whole are well below the rate of inflation and certainly below wage inflation. 20.0% % change in Personal Income tax collected. 10.0% 0.0% Strikes -10.0% Jan-03 Jun-03 Nov-03 Apr-04 Sep-04 Feb-05 Jul-05 Dec-05 May-06 Oct-06 Mar-07 Aug-07 Jan-08 Jun-08 Nov-08 Apr-09 Sep-09 Feb-10 Jul-10 Dec-10 May-11 Oct-11 Mar-12 Aug-12 The Great Recession -20.0% 40
41 Personal Income tax average salary equal R872 million If employees entry level -only R309 million. (includes some overtime) Vat estimate R375 million (employees only) Corporate Income tax Difficult but we estimate a loss over the next three years of about R300 million. Other taxes about another R100 million Total over R1,5 billion 41
42 We mean contractors, suppliers and retailers etc. We think that the knock-on effect will be about half the direct effect on taxes. We do not have a hard number but guesstimate about a further R750 million. Combined we think that over the next while the tax losses will be in excess of R2,3 billion 42
43 43
44 44
45 We will not see another strike of this magnitude in the next two decades I do not think we will see another platinum strike for quite a while! Unions with a more moderate view will come to the fore in the industry. Thousands of job losses anyway. AMCU will not be majority union in a year. 45
46 Strikes will play a lesser role in SA within the next few years as workers will refuse to give up gains already made. Long strikes are going to become rarer. Government will side more on the side of industry as economic losses are not helping create jobs - our biggest problem. Expect a rethink by government on the way strikes are conducted. 46

47 47
// BRIEF STATISTICS 2014
 // BRIEF STATISTICS 2014 // TAXATION IN FINLAND Finland s taxation is subject to decisions by the Finnish Parliament, the European Union and the municipalities of Finland. It is governed by tax legislation,
relating to household s disposable income. A Gini Coefficient of zero indicates
 Gini Coefficient The Gini Coefficient is a measure of income inequality which is based on data relating to household s disposable income. A Gini Coefficient of zero indicates perfect income equality, whereas
What Is the Total Public Spending on Education?
 What Is the Total Public Spending on Education? Indicator On average, OECD countries devote 12.9% of total public expenditure to, but values for individual countries range from less than 10% in the Czech
Dividends Tax: Summary of withholding tax rates per South African Double Taxation Agreements currently in force Version: 2 Updated: 2012-05-22
 Dividends Tax: Summary of withholding tax rates per South African Double Taxation Agreements currently in force Version: 2 Updated: 2012-05-22 Note: A summary of the rates and the relevant provisions relating
A Comparison of the Tax Burden on Labor in the OECD By Kyle Pomerleau
 FISCAL FACT Jun. 2014 No. 434 A Comparison of the Tax Burden on Labor in the OECD By Kyle Pomerleau Economist Key Findings Average wage earners in the United States face two major taxes: the individual
ANNUAL HOURS WORKED. Belgium:
 ANNUAL HOURS WORKED The series on annual hours actually worked per person in total employment presented in this table for 34 OECD countries are, in principle, consistent with the series retained for the
Working Holiday Maker visa programme report
 Working Holiday Maker visa programme report 30 June 2015 This page is left blank intentionally. Table of Contents About this report 1 Enquiries 1 Definition of terms 2 Background to the Working Holiday
Health Care in Crisis
 Health Care in Crisis The Economic Imperative for Health Care Reform James Kvaal and Ben Furnas February 19, 2009 1 Center for American Progress Health Care in Crisis U.S. spends twice as much per capita
Social security: Iceland
 Social security: Iceland Abstract The ageing of many societies around the world, both among the rich and the poor, challenges governments to design social security programs that do not break the bank.
Working Holiday Maker visa programme report. 31 December 2014
 Working Holiday Maker visa programme report 31 December 2014 Contents Page About this report 1 Enquiries 1 Definition of terms 2 Background to the Working Holiday Maker programme 3 Recent developments
Foreign Taxes Paid and Foreign Source Income INTECH Global Income Managed Volatility Fund
 Income INTECH Global Income Managed Volatility Fund Australia 0.0066 0.0375 Austria 0.0045 0.0014 Belgium 0.0461 0.0138 Bermuda 0.0000 0.0059 Canada 0.0919 0.0275 Cayman Islands 0.0000 0.0044 China 0.0000
PUBLIC VS. PRIVATE HEALTH CARE IN CANADA. Norma Kozhaya, Ph.D Economist, Montreal economic Institute CPBI, Winnipeg June 15, 2007
 PUBLIC VS. PRIVATE HEALTH CARE IN CANADA Norma Kozhaya, Ph.D Economist, Montreal economic Institute CPBI, Winnipeg June 15, 2007 Possible private contribution Possible private contribution in the health
TOWARDS PUBLIC PROCUREMENT KEY PERFORMANCE INDICATORS. Paulo Magina Public Sector Integrity Division
 TOWARDS PUBLIC PROCUREMENT KEY PERFORMANCE INDICATORS Paulo Magina Public Sector Integrity Division 10 th Public Procurement Knowledge Exchange Platform Istanbul, May 2014 The Organization for Economic
PUBLIC & PRIVATE HEALTH CARE IN CANADA
 PUBLIC & PRIVATE HEALTH CARE IN CANADA by Norma Kozhaya, Ph.D. Economist, Montreal Economic Institute before the Canadian Pension & Benefits Institute Winnipeg - June 15, 2007 Possible private contribution
Ageing OECD Societies
 ISBN 978-92-64-04661-0 Trends Shaping Education OECD 2008 Chapter 1 Ageing OECD Societies FEWER CHILDREN LIVING LONGER CHANGING AGE STRUCTURES The notion of ageing societies covers a major set of trends
Turkish Arab Economic Forum June 29, 2012. Mehmet Şimşek. Minister of Finance
 Turkish Arab Economic Forum June 29, 2012 Mehmet Şimşek Minister of Finance 1 Outline Turkey: Short Term Outlook Managing a Soft Landing Fallout from the Euro Crisis Turkey & MENA REBALANCING Growing ON
Development aid stable in 2014 but flows to poorest countries still falling. Detailed summary
 OECD - Paris, 8 April 2015 Development aid stable in 2014 but flows to poorest countries still falling Key aid totals in 2014 Detailed summary In 2014, net official development assistance (ODA) flows from
41 T Korea, Rep. 52.3. 42 T Netherlands 51.4. 43 T Japan 51.1. 44 E Bulgaria 51.1. 45 T Argentina 50.8. 46 T Czech Republic 50.4. 47 T Greece 50.
 Overall Results Climate Change Performance Index 2012 Table 1 Rank Country Score** Partial Score Tendency Trend Level Policy 1* Rank Country Score** Partial Score Tendency Trend Level Policy 21 - Egypt***
NATIONAL UNIVERSITY OF LIFE AND ENVIRONMENTAL SCIENCES OF UKRAINE
 NATIONAL UNIVERSITY OF LIFE AND ENVIRONMENTAL SCIENCES OF UKRAINE Ukrainian agricultural products competitiveness on European market in time of financial challenges Sergey Grygoryev Contents: Part 1. Trade
What Proportion of National Wealth Is Spent on Education?
 Indicator What Proportion of National Wealth Is Spent on Education? In 2008, OECD countries spent 6.1% of their collective GDP on al institutions and this proportion exceeds 7.0% in Chile, Denmark, Iceland,
Taxation trends in the European Union EU27 tax ratio fell to 39.3% of GDP in 2008 Steady decline in top corporate income tax rate since 2000
 DG TAXUD 95/2010-28 June 2010 Taxation trends in the European Union EU27 tax ratio fell to 39.3% of GDP in 2008 Steady decline in top corporate income tax rate since 2000 The overall tax-to-gdp ratio 1
INTERNATIONAL COMPARISONS OF PART-TIME WORK
 OECD Economic Studies No. 29, 1997/II INTERNATIONAL COMPARISONS OF PART-TIME WORK Georges Lemaitre, Pascal Marianna and Alois van Bastelaer TABLE OF CONTENTS Introduction... 140 International definitions
Working Holiday Maker visa programme report
 0 Working Holiday Maker visa programme report 31 December 2015 This page is left intentiolly blank. Table of Contents Page About this report 1 Enquiries 1 Definition of terms 2 Background to the Working
Recent U.S. Economic Growth In Charts MAY 2012
 Recent U.S. Economic Growth In Charts MAY 212 GROWTH SINCE 29 The Growth Story Since 29 Despite the worst financial crisis since the Great Depression and a series of shocks in its aftermath, the economy
Working Holiday Maker visa program report 30 June 2011
 30/06/07 Working Holiday Maker visa program report 30 June 2011 Contents Page About this report 1 Enquiries 1 Definition of terms 2 Background to the Working Holiday Maker program 3 Recent developments
PERMANENT AND TEMPORARY WORKERS
 PERMANENT AND TEMPORARY WORKERS Australia Permanent worker: Permanent workers are employees with paid leave entitlements in jobs or work contracts of unlimited duration, including regular workers whose
Norway Country Profile
 Norway Country Profile Produced by Oslo Revisjon AS P.O. Box 123 Skoyen, N - 0212 Oslo, Norway Phone: +47 22 50 24 50 Fax : +47 22 50 36 80 Email: firmapost@oslorevisjon.no The intention of this profile
How To Calculate Tax Burden In European Union
 The Tax Burden of Typical Workers in the EU 28 2015 James Rogers Cécile Philippe Institut Économique Molinari, Paris Bruxelles TABLE OF CONTENTS Abstract 2 Background 2 Main Results 3 On average, a respite
On What Resources and Services Is Education Funding Spent?
 Indicator On What Resources and Services Is Education Funding Spent? In primary, secondary and post-secondary non-tertiary education combined, current accounts for an average of 92% of total spending in
A Comparison of the Tax Burden on Labor in the OECD
 FISCAL FACT July 2015 No. 475 A Comparison of the Tax Burden on Labor in the OECD By Sam Jordan & Kyle Pomerleau Research Assistant Economist Key Findings Average wage earners in the United States face
International comparisons of obesity prevalence
 International comparisons of obesity prevalence June 2009 International Comparisons of Obesity Prevalence Executive Summary Obesity prevalence among adults and children has been increasing in most developed
Exercise 39. The Euro. At the end of this exercise you will:
 Exercise 39 The Euro At the end of this exercise you will: Know how the Euro was named Know the countries using the Euro Be able to name all the Euro notes Be able to name all the Euro coins Be able to
Hong Kong s Health Spending 1989 to 2033
 Hong Kong s Health Spending 1989 to 2033 Gabriel M Leung School of Public Health The University of Hong Kong What are Domestic Health Accounts? Methodology used to determine a territory s health expenditure
Early Childhood Education and Care
 Early Childhood Education and Care Participation in education by three- and four-year-olds tends now to be high, though coverage is a third or less of the age group in several OECD countries. Early childhood
Development aid in 2015 continues to grow despite costs for in-donor refugees
 OECD Paris, 13 April 2016 Development aid in 2015 continues to grow despite costs for in-donor refugees 2015 Preliminary ODA Figures In 2015, net official development assistance (ODA) flows from member
First estimate for 2014 Euro area international trade in goods surplus 194.8 bn 24.2 bn surplus for EU28
 30/2015-16 February 2015 First estimate for 2014 Euro area international trade in goods surplus 194.8 bn 24.2 bn surplus for EU28 The first estimate for the euro area 1 (EA18) trade in goods balance with
The Path Forward. International Women s Day 2012 Global Research Results
 The Path Forward International Women s Day 2012 Global Research Results Research objectives Accenture conducted its global research study, The Path Forward for release on International Women s Day to gain
STATISTICS FOR THE FURNITURE INDUSTRY AND TRADE
 STATISTICS FOR THE FURNITURE INDUSTRY AND TRADE Möbel Zahlen Daten STATISTICS FOR THE FURNITURE INDUSTRY AND TRADE 01/36 Economical growth in the regions of the world-economy Changes of the gross domestic
Size and Development of the Shadow Economy of 31 European and 5 other OECD Countries from 2003 to 2015: Different Developments
 January 20, 2015 ShadEcEurope31_January2015.doc Size and Development of the Shadow Economy of 31 European and 5 other OECD Countries from 2003 to 2015: Different Developments by Friedrich Schneider *)
EXTERNAL DEBT AND LIABILITIES OF INDUSTRIAL COUNTRIES. Mark Rider. Research Discussion Paper 9405. November 1994. Economic Research Department
 EXTERNAL DEBT AND LIABILITIES OF INDUSTRIAL COUNTRIES Mark Rider Research Discussion Paper 9405 November 1994 Economic Research Department Reserve Bank of Australia I would like to thank Sally Banguis
THE TAX BURDEN OF TYPICAL WORKERS IN THE EU 27
 THE TAX BURDEN OF TYPICAL WORKERS IN THE EU 27 May 2011 James Rogers Cécile Philippe Published by New Direction The Foundation for European Reform Rue d'arlon 40 1000 Brussels Belgium Telephone: +32-2
How many students study abroad and where do they go?
 From: Education at a Glance 2012 Highlights Access the complete publication at: http://dx.doi.org/10.1787/eag_highlights-2012-en How many students study abroad and where do they go? Please cite this chapter
International investment continues to struggle
 FDI IN FIGURES December 2014 International investment continues to struggle Figures for the first half of 2014 point to stalled FDI flows Findings FDI fell in the first quarter of 2014 before rebounding
Delegation in human resource management
 From: Government at a Glance 2009 Access the complete publication at: http://dx.doi.org/10.1787/9789264075061-en Delegation in human resource management Please cite this chapter as: OECD (2009), Delegation
LMF1.2: Maternal employment rates
 LMF1.2: Maternal employment rates Definitions and methodology Data on maternal employment rates are presented both by age of youngest child and by the number of dependent children under age 15. Employment
With data up to: May 2016. Monthly Electricity Statistics
 With data up to: 216 Monthly Electricity Statistics Date of publication: 12 ust 216 Monthly Electricity Statistics TABLE OF CONTENTS Page # HIGHLIGHTS i ORGANISATIONAL AND REGIONAL TABLES OECD Total 1
PF2.3: Additional leave entitlements for working parents
 OECD Social Policy Division Directorate of Employment, Labour and Social Affairs Definitions and methodology PF2.3: Additional leave entitlements for working parents In addition to leave entitlements around
International aspects of taxation in the Netherlands
 International aspects of taxation in the Netherlands Individuals resident in the Netherlands are subject to income tax on their worldwide income. Companies established in the Netherlands are subject to
Eliminating Double Taxation through Corporate Integration
 FISCAL FACT Feb. 2015 No. 453 Eliminating Double Taxation through Corporate Integration By Kyle Pomerleau Economist Key Findings The United States tax code places a double-tax on corporate income with
Central Government Budget Bill for 2014
 Central Government Budget Bill for 2014 September 30th 2013 1 Spain Macroeconomic Scenario Year on year % change 2012 2013 2014 Real GDP -1,6-1,3 0,7 Nominal GDP -1,7-0,3 2,1 Private Consumption -2,8-2,6
UPDATE ON CURRENT MACRO ENVIRONMENT
 1 Oct 213 Macro & Strategy Equity Credit Commodities 13 13 #1 Global Strategy #1 Multi Asset Research #3 Global Economics #2 Equity Quant #2 Index Analysis #3 SRI Research 12 sector teams in the Top 1
How Does Educational Attainment Affect Participation in the Labour Market?
 Indicator How Does Educational Attainment Affect Participation in the Labour Market? In all countries, individuals with a tertiary-level degree have a greater chance of being employed than those without
International Women's Day PwC Women in Work Index
 www.pwc.co.uk International Women's Day Women in Work Index Women in Work Index UK rises four places to 14 th position within the OECD, returning to its position in 2000. The third annual update of the
The Tax Burden of Typical Workers in the EU 28 2014 Edition. James Rogers & Cécile Philippe May 2014. (Cover page) Data provided by
 Data provided by") (Cover page) The Tax Burden of Typical Workers in the EU 28 2014 Edition NEW DIRECTION Page 1 of 17 James Rogers & Cécile Philippe May 2014 New Direction aims to help shift the EU onto a different course
(Cover page) The Tax Burden of Typical Workers in the EU 28 2014 Edition NEW DIRECTION Page 1 of 17 James Rogers & Cécile Philippe May 2014 New Direction aims to help shift the EU onto a different course
The big pay turnaround: Eurozone recovering, emerging markets falter in 2015
 The big pay turnaround: Eurozone recovering, emerging markets falter in 2015 Global salary rises up compared to last year But workers in key emerging markets will experience real wage cuts Increase in
Global Economic Briefing: Global Inflation
 Global Economic Briefing: Global Inflation August 7, Dr. Edward Yardeni -97-7 eyardeni@ Debbie Johnson -- djohnson@ Mali Quintana -- aquintana@ Please visit our sites at www. blog. thinking outside the
THE PETROL TAX DEBATE
 THE PETROL TAX DEBATE Zoë Smith THE INSTITUTE FOR FISCAL STUDIES Briefing Note No. 8 Published by The Institute for Fiscal Studies 7 Ridgmount Street London WC1E 7AE Tel 2 7291 48 Fax 2 7323 478 mailbox@ifs.org.uk
Trends in Digitally-Enabled Trade in Services. by Maria Borga and Jennifer Koncz-Bruner
 Trends in Digitally-Enabled Trade in Services by Maria Borga and Jennifer Koncz-Bruner Digitally-enabled are those for which digital information and communications technologies (ICT) play an important
Country note China. More than 255 million people in OECD and G20 countries have now attained tertiary education (Table A1.3a).
.") Education at a Glance 2011 OECD Indicators DOI: http://dx.doi.org/10.1787/eag-2011-en OECD 2011 Under embargo until 13 September, at 11:00 Paris time Education at a Glance 2011 Country note China Questions
Education at a Glance 2011 OECD Indicators DOI: http://dx.doi.org/10.1787/eag-2011-en OECD 2011 Under embargo until 13 September, at 11:00 Paris time Education at a Glance 2011 Country note China Questions
Reporting practices for domestic and total debt securities
 Last updated: 4 September 2015 Reporting practices for domestic and total debt securities While the BIS debt securities statistics are in principle harmonised with the recommendations in the Handbook on
HAS BRAZIL REALLY TAKEN OFF? BRAZIL LONG-RUN ECONOMIC GROWTH AND CONVERGENCE
 HAS BRAZIL REALLY TAKEN OFF? BRAZIL LONG-RUN ECONOMIC GROWTH AND CONVERGENCE COUNTRY PROFILE: A COUNTRY IN TRANSFORMATION POLICY RECOMENDATIONS COUNTRY PROFILE Brazilian Equivalent Population in The World
The Tax Burden of Typical Workers in the EU 27
 The Tax Burden of Typical Workers in the EU 27 James Rogers Cécile Philippe Institut Économique Molinari, Paris-Bruxelles TABLE OF CONTENTS Objective of the Study 2 Study Interest 2 Main Results 3 Definitions
Q3 FDI flows are up, but 2013 is heading towards a second annual decline
 USD billions FDI IN FIGURES February 214 International investment struggles Q3 FDI flows are up, but 213 is heading towards a second annual decline Key findings Despite strong performance in Q3, global
Doing Business in Poland
 Doing Business in Poland Warsaw December 14, 2011 Dr. Marcin Piątkowski Senior Economist, the World Bank Assistant Professor, TIGER, Kozminski University, Outline Results of the World Bank s Doing Business
Why Has Japan Been Hit So Hard by the Global Recession?
 IMF STAFF POSITION NOTE March 18, 9 SPN/9/5 Why Has Been Hit So Hard by the Global Recession? Martin Sommer I N T E R N A T I O N A L M O N E T A R Y F U N D INTERNATIONAL MONETARY FUND Why Has Been Hit
AT&T Global Network Client for Windows Product Support Matrix January 29, 2015
 AT&T Global Network Client for Windows Product Support Matrix January 29, 2015 Product Support Matrix Following is the Product Support Matrix for the AT&T Global Network Client. See the AT&T Global Network
How Much Time Do Teachers Spend Teaching?
 How Much Time Do Teachers Spend Teaching? The number of teaching hours in public schools averages 779 hours per year in primary, 71 in lower secondary and 656 in upper secondary. The average teaching time
187/2014-5 December 2014. EU28, euro area and United States GDP growth rates % change over the previous quarter
 187/2014-5 December 2014 This News Release has been revised following an error in the data for Gross Fixed Capital Formation. This affects both the growth of GFCF and its contribution to GDP growth. All
Social Security. A Guide to Child Benefit. The Treasury Yn Tashtey
 Social Security A Guide to Child Benefit The Treasury Yn Tashtey CH2 Notes May 2015 About this leaflet This leaflet gives customers information about Child Benefit. It is for general guidance only and
Consumer prices and the money supply
 Consumer prices and the money supply Annual rise. Per cent. -year moving average Money supply Consumer prices - - 9 9 9 96 98 Sources: Statistics Norway and Norges Bank JB Terra Kapitalmarkedsdager, Gardermoen.
Mapping Global Value Chains
 Mapping Global Value Chains Koen De Backer Sébastien Miroudot OECD Final WIOD Conference: Causes and Consequences of Globalization Groningen, The Netherlands, April 24-26, 2012. Why focusing on GVCs? A
Expenditure and Outputs in the Irish Health System: A Cross Country Comparison
 Expenditure and Outputs in the Irish Health System: A Cross Country Comparison Paul Redmond Overview This document analyzes expenditure and outputs in the Irish health system and compares Ireland to other
BLUM Attorneys at Law
 BLUM Attorneys at Law CORPORATE TAXATION SYSTEM IN SWITZERLAND Outline of Swiss Corporate Tax System Levels of Taxation in Switzerland Resident companies are subject to: federal corporate income tax, and
Key Highlights on Italian Economy
 Key Highlights on Italian Economy Incontro con l Ambasciatore Reinhard Schäfers e il prof. Roland Berger Franco Bassanini 25 Marzo 2014 Cassa depositi e prestiti Italian economy / Key highlights GDP is
99/2015-9 June 2015. EU28, euro area and United States GDP growth rates % change over the previous quarter
 2005Q1 2005Q2 2005Q3 2005Q4 2006Q1 2006Q2 2006Q3 2006Q4 2007Q1 2007Q2 2007Q3 2007Q4 2008Q1 2008Q2 2008Q3 2008Q4 2009Q1 2009Q2 2009Q3 2009Q4 2010Q1 2010Q2 2010Q3 2010Q4 2011Q1 2011Q2 2011Q3 2011Q4 2012Q1
SWECARE FOUNDATION. Uniting the Swedish health care sector for increased international competitiveness
 SWECARE FOUNDATION Uniting the Swedish health care sector for increased international competitiveness SWEDEN IN BRIEF Population: approx. 9 800 000 (2015) GDP/capita: approx. EUR 43 300 (2015) Unemployment
GfK PURCHASING POWER INTERNATIONAL
 GfK PURCHASING POWER INTERNATIONAL 1 Agenda 1. Europe 3 2. Americas 45 3. Asia & Near East 54 4. Afrika 66 5. Australia 68 6. Overview of countries and available levels 70 2 2 EUROPE 4 GfK
168/2014-4 November 2014. At risk of poverty or social exclusion 2 rate in the EU28, 2008-2013 (% of total population)
") 168/2014-4 November 2014 At risk of poverty or social exclusion in the EU28 More than 120 million persons at risk of poverty or social exclusion in 2013 Almost 1 out of every 4 persons in the EU in this
168/2014-4 November 2014 At risk of poverty or social exclusion in the EU28 More than 120 million persons at risk of poverty or social exclusion in 2013 Almost 1 out of every 4 persons in the EU in this
PLAN PRICE GUIDE 74.99. Allowance 50GB Data, unlimited minutes, unlimited texts, inclusive Roaming in selected countries 1,2, 200 084
 PLAN PRICE GUIDE Pay Monthly For new and upgrading customers from 27th April 2016 EE Complete 24 month plans 74.99 79.99 84.99 Allowance 50GB Data, unlimited minutes, unlimited texts, inclusive Roaming
THE LOW INTEREST RATE ENVIRONMENT AND ITS IMPACT ON INSURANCE MARKETS. Mamiko Yokoi-Arai
 THE LOW INTEREST RATE ENVIRONMENT AND ITS IMPACT ON INSURANCE MARKETS Mamiko Yokoi-Arai Current macro economic environment is of Low interest rate Low inflation and nominal wage growth Slow growth Demographic
Pan-European opinion poll on occupational safety and health
 PRESS KIT Pan-European opinion poll on occupational safety and health Results across 36 European countries Press kit Conducted by Ipsos MORI Social Research Institute at the request of the European Agency
Consumer Credit Worldwide at year end 2012
 Consumer Credit Worldwide at year end 2012 Introduction For the fifth consecutive year, Crédit Agricole Consumer Finance has published the Consumer Credit Overview, its yearly report on the international
The Norwegian economy
 The Norwegian economy Slower speed ahead, but still growth Strong mechanisms support mainland economy Wriggle room to smooth business cycles Rune Bjerke CEO Just how bad is it? Slower speed ahead but still
BUDGETING AND BUDGETARY CONTROL
 ASA2.19_ASA2.19.qxd 03/07/2012 11:57 Page 362 19 BUDGETING AND BUDGETARY CONTROL Budgeting is used by businesses as a method of financial planning for the future. Budgets are prepared for main areas of
Internet address: http://www.bls.gov/fls USDL: 04-2343
 Internet address: http://www.bls.gov/fls USDL: 04-2343 Technical information: (202) 691-5654 For Release: 10:00 A.M. EST Media contact: (202) 691-5902 Thursday, November 18, 2004 INTERNATIONAL COMPARISONS
NERI Quarterly Economic Facts Summer 2012. 4 Distribution of Income and Wealth
 4 Distribution of Income and Wealth 53 54 Indicator 4.1 Income per capita in the EU Indicator defined National income (GDP) in per capita (per head of population) terms expressed in Euro and adjusted for
SMEs access to finance survey 2014
 EUROPEAN COMMISSION MEMO Brussels, 12 November 2014 SMEs access to finance survey 2014 This memo outlines the results of a survey undertaken by the European Commission to provide policy makers with evidence
Updated development of global greenhouse gas emissions 2013
 Updated development of global greenhouse gas emissions 2013 Hans-Joachim Ziesing Low Carbon Markets and the Legacy of Nuclear Power 19 th REFORM Group Meeting, Schloss Leopoldskron, Salzburg September
Trends in the European Investment Fund Industry. in the First Quarter of 2016
 Quarterly Statistical Release May 2016, N 65 This release and other statistical releases are available on Efama s website (www.efama.org) Trends in the European Investment Fund Industry in the First Quarter
Employee eligibility to work in the UK
 Employee eligibility to work in the UK This document details legal requirements that apply to ALL new members of staff All employers in the UK are legally bound to comply with the Asylum and Immigration
COMMUNICATION FROM THE COMMISSION
 EUROPEAN COMMISSION Brussels, 17.9.2014 C(2014) 6767 final COMMUNICATION FROM THE COMMISSION Updating of data used to calculate lump sum and penalty payments to be proposed by the Commission to the Court
Preventing fraud and corruption in public procurement
 Preventing fraud and corruption in public procurement CRIM, European Parliament 24 September 2012 Brussels János Bertók Head of division Public Sector Integrity OECD Data on trends in procurement Size
The AGENCY WORK INDUSTRY. around the WORLD. Economic Report. 2013 Edition (based on figures available in 2011) 2013 Economic Report / Ciett / 1
 2013 Economic Report / Ciett / 1") The AGENCY WORK INDUSTRY around the WORLD Economic Report 2013 Edition (based on figures available in 2011) 2013 Economic Report / Ciett / 1 Ciett Tour & Taxis building Avenue du Port 86c - Box 302 B 1000
The AGENCY WORK INDUSTRY around the WORLD Economic Report 2013 Edition (based on figures available in 2011) 2013 Economic Report / Ciett / 1 Ciett Tour & Taxis building Avenue du Port 86c - Box 302 B 1000
How To Tax On Pension Income For Older People In European Countries
 Austria Belgium Czech Republic Tax credit of EUR 400 for low pension income up to EUR 17,000; the tax credit is fully phased out once pension income equals EUR 25,000. pension income of maximum EUR 1,901.19.
The Role of Banks in Global Mergers and Acquisitions by James R. Barth, Triphon Phumiwasana, and Keven Yost *
 The Role of Banks in Global Mergers and Acquisitions by James R. Barth, Triphon Phumiwasana, and Keven Yost * There has been substantial consolidation among firms in many industries in countries around
U.S. Trade Overview, 2013
 U.S. Trade Overview, 213 Stephanie Han & Natalie Soroka Trade and Economic Analysis Industry and Analysis Department of Commerce International Trade Administration October 214 Trade: A Vital Part of the
MARKET NEWSLETTER No 102 February 2016
 TRENDS IN WORLD OLIVE OIL CONSUMPTION World consumption of olive oil increased 1.8 fold in volume between 1990/00 and 2015/16. As can be seen from Chart 1, this upward movement has been located primarily
WICARE - Surveying wages and working conditions in the Social Services
 WICARE - Surveying wages and working conditions in the Social Services Social Services Workshop, EPSU Brussels, Belgium 17 December 2013 Kea Tijdens and Maarten van Klaveren (AIAS-UVA) Introduction Why
Euler Hermes the world leader in credit insurance RISK ASSESSMENT CREDIT INSURANCE DEBT COLLECTION
 Euler Hermes the world leader in credit insurance RISK ASSESSMENT CREDIT INSURANCE DEBT COLLECTION Agenda 1 The Euler Hermes group 2 Our business 3 Our products and solutions 4 Our added value 2 The Euler
193/2014-15 December 2014. Hourly labour costs in the EU28 Member States, 2012 (in )
") 193/2014-15 December 2014 Labour Cost Survey 2012 in the EU28 Labour costs highest in the financial and insurance sector Three times higher than in the accommodation and food sector In 2012, average hourly
193/2014-15 December 2014 Labour Cost Survey 2012 in the EU28 Labour costs highest in the financial and insurance sector Three times higher than in the accommodation and food sector In 2012, average hourly