Investor Relations. Supplementary information Second Quarter 2014
|
|
|
- Owen Welch
- 7 years ago
- Views:
Transcription
1 Investor Relations Supplementary information Second Quarter

2 SpareBank 1 SMN 7467 Trondheim Chief Executive, CEO Finn Haugan For further information, please contact Kjell Fordal, Executive Director Finance Division tel kjell.fordal@smn.no Switchboard tel Address SpareBank 1 SMN, Postboks 4796 Sluppen, 7467 Trondheim Visiting address: Søndre gate 4, 7011 Trondheim Information on the Internet SpareBank 1 SMN s home page Hugin-Online ECC information in general Financial Calendar 2 nd quarter 13 August 3 rd quarter 30 October - 1 -

3 Contents 1. SpareBank 1 SMN overview Financial highlights Business description Credit ratings Equity capital certificate (MING) Financial results Main figures Net interest income Commission income Operating expenses Loans to customers Distribution of loans by industry Risk profile and write-downs Capital Adequacy Funding Financial results Segment information Extract from income statement Retail Market SME Corporate Markets Subsidiaries Development last ten years

4 1. SpareBank 1 SMN overview 1.1. Financial highlights First half (Consolidated figures. Figures in parentheses refer to the same period of unless otherwise stated). Profit before tax and inv. held for sale: NOK 1,165m (782m) Net profit: NOK 963m (606m) Return on equity: 16.8 per cent (11.9 per cent) 12-month growth in lending: 5.1 per cent (8.4 per cent) 12-month growth in deposits: 7.4 per cent (7.3 per cent) Loan losses: NOK 32m (38m) Common equity tier 1 ratio: 11.4 per cent (10.3 per cent) Earnings per EC: NOK 4.77 (2.99) Second quarter Profit before tax and inv. held for sale: NOK 568m (391m) Net profit: NOK 464m (285m) Return on equity: 16.0 per cent (11.1 per cent) Loan losses: NOK 15m (21m) Earnings per EC: NOK 2.29 (1.43) - 3 -
 Second quarter Profit before tax and inv. held for sale: NOK 568m (391m) Net profit: NOK 464m (285m) Return on equity: 16.0 per cent (11.")

5 1.2. Business description SpareBank 1 SMN is Mid-Norway s largest bank with assets totalling NOK billion at the end of June. Head office is in Trondheim and the Group employs 1,167 FTEs. SpareBank 1 SMN is organized in four business areas: Overall organization - 4 -


6 SpareBank 1 SMN: Subsidiaries SpareBank 1 Group The SpareBank 1 banks operate an alliance and develop product companies through the jointly owned holding company SpareBank 1 Gruppen. The paramount objective of the SpareBank 1 Alliance is to assure the individual bank s independence and regional identity through strong competitiveness, profitability and financial soundness. The Alliance is among the largest providers of financial services in Norway and a full-fledged alternative to traditional financial groups. SpareBank 1 Alliance Structure *) LO: The Norwegian Confederation of Trade Unions - 5 -

7 1.3. Credit ratings Moody's Todays Year end rating Outlook Negative Stable Rating(s) under review Stable Stable Negative Issuer Rating A2 A2 A2 A1 A1 A1 Bank Deposits A2/P-1 A2/P-1 A2/P-1 A1/P-1 A1/P-1 A1/P-1 Bank Financial Strenght C- C- C- C- C- C- Senior Unsecured A2 A2 A2 A1 A1 A1 Subordinate Baa2 Baa3 Baa3 A2 A2 A2 Fitch Year end Todays rating Outlook Stable Stable Stable Stable Negative Negative Long-term IDR A- A- A- A- A A Short-term IDR F2 F2 F2 F2 F1 F1 Support rating Individual rating B/C B/C B/C B/C B/C B/C - 6 -

8 1.4. Equity capital certificate (MING) The key figures are corrected for issues. 30 June the price of the Bank s ECC was NOK (NOK 46.50). Earnings per ECC were NOK 4.77 (NOK 2.99). Book value per ECC was NOK (NOK 51.66) as of end second quarter. Key figures 1Q 4Q 3Q 30 Jun. (in NOK million) 2012 ECC price Number of certificates issued, millions Booked equity capital per ECC (incl. dividend) Adjusted profit per ECC P/E per ECC P/B equity capital Stock price compared with OSEBX and OSEEX 1 Jul 2012 to 30 Jun Jul 12 Sep 12 Nov 12 Jan 13 Mar 13 May 13 Jul 13 Sep 13 Nov 13 Jan 14 Mar 14 May 14 SMN OSEBX OSEEX OSEBX = Oslo Stock Exchange Benchmark Index (rebased) OSEEX = Oslo Stock Exchange ECC Index (rebased) Trading statistics 1) 1 Jul 2012 to 30 Jun 12,000 10,000 8,000 6,000 4,000 2,000 0 Jul 12 Sep 12 Nov 12 Jan 13 Mar 13May 13 Jul 13 Sep 13 Nov 13 Jan 14 Mar 14May 14 1) Total number of ECs traded (1,000) - 7 -

9 Market value and profit per ECC Q 4Q 1Q Market value, NOK bill. Adjusted profit per ECC Equity certificates ratio (parent bank) 30 Jun. 31 Mar. 31 Dec. 30 Sept. 30 Jun. 31 Dec. (in NOK million) 2012 ECC capital 2,597 2,597 2,597 2,597 2,597 2,597 Dividend equalisation reserve 2,496 2,496 2,496 1,889 1,889 1,889 Premium reserve Unrealised gains reserve A. The equity certificate owner's capital 6,114 6,114 6,114 5,449 5,449 5,449 Saving bank reserve 3,276 3,276 3,276 2,944 2,944 2,944 Unrealised gains reserve B. The saving bank reserve 3,345 3,345 3,345 2,982 2,982 2,982 Provision for gifts Recommended dividends Equity ex. profit 9,459 9,459 9,811 8,431 8,431 8,431 Equity certificates ratio A/(A+B) % % % % % % - 8 -
 2012 ECC capital 2,597 2,597 2,597 2,597 2,597 2,597 Dividend equalisation reserve 2,496 2,496 2,496 1,889 1,889 1,889 Premium reserve 895 895 895 895 895 895 Unrealised gains")
10 20 largest ECC holders Owner Verdipapirfond Odin Norge Sparebankstiftelsen SpareBank 1 SMN Verdipapirfondet DNB Norge (IV) Verdipapirfond Pareto Aksje Norge Verdipapirfondet Nordea Norge Verdi Verdipapirfond Odin Norden State Street Bank and Trust CO (nominee) Vind LV AS Wimoh Invest AS MP Pensjon PK Verdipapirfondet Danske Invest Norske Aksjer Inst. II The Bank of New York Mellon (nominee) Verdipapirfondet Fondsfinans Spar Forsvarets Personellservice Verdipapirfond Pareto Aktiv DNB Livsforsikring ASA Verdipapirfondet Nordea Kapital Verdipapirfondet Danske Invest Norske Aksjer Instit. I Aksjefondet Handelsbanken Norge The Bank of New York Mellon (nominee) Total 20 largest shareholders Others Total Number 4,042,430 3,965,391 3,576,856 3,462,308 2,899,724 2,854,979 2,757,847 2,736,435 2,359,388 2,058,415 1,913,767 1,887,323 1,500,000 1,491,146 1,413,900 1,314,507 1,161,289 1,124,723 1,100,000 1,077,331 44,697,759 85,138, ,836,443 Ownership in % 3.11 % 3.05 % 2.75 % 2.67 % 2.23 % 2.20 % 2.12 % 2.11 % 1.82 % 1.59 % 1.47 % 1.45 % 1.16 % 1.15 % 1.09 % 1.01 % 0.89 % 0.87 % 0.85 % 0.83 % % % % ECC capital history Year Change 1991 Placing 1992 Placing 2000 Employee placing 2001 Employee placing 2002 Employee placing 2004 Bonus Issue 2005 Placing 2005 Employee placing 2005 Split 2005 Bonus Issue 2007 Dividend Issue 2007 Employee placing 2008 Dividend Issue 2008 Employee placing 2009 Bonus Issue 2010 Placing 2010 Employee placing 2011 Issue 2012 Placing 2012 Employee placing Change in ECC capital 2012 Private placement , , ,373 1 Total ECC capital ,009 1,262 1,447 1,736 2,373 2,468 2,484 40,391,268 50,489,085 53,752,203 1,349 53,976,003 1,440 2,597 No. of ECC's ,250, ,009 6,000,000 6,053,099 6,099,432 6,148,060 7,685,075 9,859,317 10,097,817 57,603,748 57,861,806 69,434,167 94,397,474 94,905,286 94,930, ,407, ,218, ,836,

11 2. Financial results Accounting principles SpareBank 1 SMN prepares and presents its quarterly accounts in compliance with the Stock Exchange Regulations, Stock Exchange Rules and International Financial Reporting Standards (IFRS), including IAS 34, Interim Financial Reporting. As from 2007 the company accounts are also prepared and presented under IFRS. This entails that investments in associates and subsidiaries are recognised using the cost method. For this reason results recorded by associates and subsidiaries are not included in the parent bank's accounts. Further, the Group has in this quarterly report mainly used the same accounting principles and calculation methods as in the latest annual report and accounts [Exceptions, see Note 1 Accounting Principles in the Quarterly Report]. The quarterly accounts do not include all the information required in a complete set of annual financial statements and should be read in conjunction with the annual accounts for Main figures 1Q 4Q 3Q 30 Jun. (in NOK million) 2012 Net interest ,616 1,477 Commission income and other income ,463 1,139 Net return on financial investments Total income 1,026 1, ,081 1,670 3,580 3,067 Total operating expenses ,722 1,654 Result before losses , ,859 1,414 Loss on loans, guarantees etc Result before tax , ,758 1,355 Tax charge Results investments held for sale, after tax Net profit ,400 1,077 Balance sheet - condensed 30 Jun. 31 Mar. 31 Dec. 30 Sept. 30 Jun. 31 Dec. Balance (in NOK million) 2012 Total assets 118, , , , , ,919 Average total assets (quarterly) 115, , , , , ,372 Gross loans to customers * 114, , , , , ,909 Deposits from customers 59,408 54,736 56,074 53,423 55,294 52,252 Total equity capital 11,780 11,389 11,242 10,863 10,439 10,082 * Loans to customers includes SpareBank 1 Boligkreditt and SpareBank 1 Næringskreditt Key figures 1Q 4Q 3Q 30 Jun Return on equity 16.0 % 17.7 % 13.1 % 16.3 % 11.1 % 16.8 % 11.9 % 13.3 % 11.7 % Common Equity Tier 1 ratio 11.4 % 11.1 % 11.1 % 10.7 % 10.3 % 11.4 % 10.3 % 11.1 % 10.0 % Cost/income ratio group 43 % 42 % 48 % 43 % 51 % 42 % 51 % 48 % 54 % Growth in loans incl Boligkreditt and Næringskreditt last 12 months 5.1 % 4.4 % 6.8 % 6.7 % 8.4 % 5.1 % 8.4 % 6.8 % 10.2 % Growth in deposits last 12 months 7.4 % 4.1 % 7.3 % 5.1 % 7.3 % 7.4 % 7.3 % 7.3 % 9.2 % Deposits-to-loan ratio 70 % 69 % 70 % 67 % 70 % 70 % 70 % 70 % 70 % Impairment losses ratio 0.05 % 0.06 % 0.12 % 0.11 % 0.08 % 0.06 % 0.07 % 0.09 % 0.06 % Non-performing commitm. as % of gross loans 0.29 % 0.24 % 0.34 % 0.35 % 0.38 % 0.29 % 0.38 % 0.34 % 0.36 % ECC price Booked equity capital per ECC (incl. dividend) Adjusted profit per ECC

12 2.2. Net interest income *) Net interest income 1Q 4Q 3Q 30 Jun. (in NOK million) 2012 Interest income 1,055 1,027 1,059 1,068 1,036 2,082 1,990 4,118 3,928 Interest expences ,239 1,244 2,502 2,451 Net interest income ,616 1,477 As percentage of total income 42 % 39 % 45 % 46 % 48 % 40 % 45 % 45 % 48 % Development in net interest income % 50.0 % 48.0 % % 44.0 % % 42.0 % 40.0 % % 36.0 % % 32.0 % % 13 3Q13 4Q13 1Q14 14 Net interest income, NOK mill As percentage of total income Changes in interest income from lending and deposits, last 12 months (in NOK million) Volume Margin Total Lending Deposits Total *) Margins on loans sold to Sparebank 1 Boligkreditt and Sparebank 1 Næringskreditt are recorded as commision income. See 2.3. Commision Income

13 Changes in net interest income 30 Jun. (in NOK million) Change Net interest income Equity capital 12 Lending volume 47 Fees on lending 13 Deposit margin -31 SMN Finans 4 Deposit volume -7 Lending margin 62 Funding and liquidity buffer -4 Change Net interest income 13 Lending margin Lending volume Fees on lending Equity capital SMN Finans Funding and liquidity buffer Deposit volume Deposit margin Net interest income

14 Margin development Definition margin: Average customer interest minus 3 months average nibor Jun. 30 Sept. 31 Dec. 31 Mar. 30 Jun. Lending margin Deposits margin Volume development 140 Volume in NOK bn Jun. 30 Sept. 31 Dec. 31 Mar. 30 Jun. Lending volume Deposits volume

15 2.3. Commission income Total commission and other income 1Q 4Q 3Q 30 Jun. (in NOK million) 2012 Guarantees SpareBank 1 Boligkreditt SpareBank 1 Næringskreditt Commission of savings products Real estate agency Insurance Payments transmission Other Total commissions income , Operating- and sales income real estate Accounting services Other operating income Total other operating income Commission expenses Total commissions and other income ,463 1,139 As percentage of total income 38 % 37 % 39 % 39 % 47 % 37 % 43 % 41 % 37 % Distribution of commission income Payments transmission 24 % Insurance 10 % Other 3 % Real estate agency 17 % Guarantees 6 % Commission of savings products 4 % SpareBank 1 Næringskreditt 1 % SpareBank 1 Boligkreditt 35 %

16 Change in commission and other income 30 Jun. (in NOK million) Change 2012 Total Real estate agency -14 Other operating income -4 Operating- and sales income real estate -5 Accounting services 27 Insurance 6 Commission of savings products -1 Commission expenses -11 Other 2 Payments transmission 17 Guarantees 6 SpareBank 1 Boligkreditt 42 SpareBank 1 Næringskreditt 2 Net return on financial investments, incl results from investments held for sale 1Q 4Q 3Q 30 Jun. (in NOK million) 2012 Income from investment in related companies incl inv held for sale of which SpareBank 1 Gruppen AS BN Bank ASA SpareBank 1 Boligkreditt AS SpareBank 1 Næringskreditt AS SpareBank 1 Markets Other 1) Capital gains/dividens, shares and ECCs 2) of which dividends capital gains on shares capital gains on ECCs Capital gains, bonds and derivatives Net gain on trading and derivatives Markets Net return on financial investments As percentage of total income 20 % 24 % 16 % 17 % 5 % 22 % 13 % 15 % 15 % 1) These companies were essentially established to handle corporate exposures taken over from other entities. 2) Including net gain/losses from SpareBank 1 SMN Invest AS, which manages parts of the Bank's share portfolio Change in net return on financial investments 30 Jun. (in NOK million) Change Total Capital gains from bonds and derivatives -8 Capital gain, SMN Markets -8 Capital gains/dividends on shares and ECC's 188 Income from investment in related companies, incl inv held for sale

17 2.4. Operating expenses Operating expenses 1Q 4Q 3Q 30 Jun. (in NOK million) 2012 Salary Pension costs (defined benefit plan) Employer's insurance contributions Other personnel expenses Total personnel expenses EDP and telecommunication expenses Postage and transportation services Marketing Operating exp. on properties and premises Other external services Other operating expenses Depr./write-downs of fixed & intangible assets Other expenses Total operating expenses ,722 1,654 Cost/income ratio Cost/income ratio ex financial inv month cost growth* 4.0 % 6.5 % 4.1 % 3.3 % 6.9 % 4.0 % 6.9 % 4.1 % 11.6 % * Year to date. Change in operating expenses 30 Jun. (in NOK million) Change Total Total personnel expenses 22 Depr./write-downs of fixed & intangible assets - 2 EDP and telecommunication expenses 16 Other operating expenses - 11 Operating exp. on properties and premises - 4 Other external services 1 Marketing 14 Postage and transportation services - 1 Cost/income ratio NOK mill. 1,200 1, % ,055 1, % 50 % % % 46 % 44 % % Q13 4Q13 1Q14 14 Income Expenses Cost/income ratio * * Total operating expences as a percentage of total operating income 40 %

18 Developement of employees Employees in employment Retail market Corporate market SpareBank 1 SMN Markets Business operations and development Management and staff Parent bank EiendomsMegler 1 Midt-Norge AS Allegro Finans AS SpareBank 1 Finans Midt-Norge AS SpareBank 1 Regnskapshuset SMN AS SpareBank 1 Kvartalet and other Total 1,167 1,159 1,135 1,098 1,035 The bank is reorganised as from 1 January. Further adjustments are made in. Figures for person-years worked in and are therefore not comparable with historical figures. Employees in employment Parent bank EiendomsMegler 1 Midt-Norge AS SpareBank 1 Regnskapshuset SMN AS SpareBank 1 Finans Midt-Norge AS Other


19 3. Loans to customers 3.1. Distribution of loans by industry Distribution of loans by industry 30 Jun. 31 Mar. 31 Dec. 30 Sept. 30 Jun. 31 Dec. (in NOK million) 2012 Agriculture/forestry/fisheries/hunting 6,552 6,351 6,359 6,210 6,025 6,129 Fish farming 1,497 1,621 2,463 2,479 2,175 2,447 Manufacturing and mining 2,056 2,030 2,142 2,145 2,435 2,349 Construction, power and water supply 3,201 3,105 3,207 3,525 3,571 3,504 Retail trade, hotels and restaurants 2,473 2,375 2,442 2,464 2,694 2,804 Maritime sector 4,961 5,099 5,402 5,347 5,561 5,739 Comercial Real Estate 12,622 12,016 12,118 11,978 12,052 11,710 Business services 3,954 3,889 3,867 3,636 3,687 3,258 Transport and other services provision 2,701 2,685 2,706 2,899 2,737 2,364 Public administration Other sectors 3,075 2,566 2,395 1,952 1,989 1,801 Gross loans in corporate market 43,312 42,030 43,523 42,887 43,123 42,322 Retail customers 71,249 69,530 68,515 67,350 65,846 62,587 Gross loans incl. Boligkr. and Næringskr. 114, , , , , ,909 - Adv. of this Boligkreditt 28,128 30,961 30,514 29,502 29,382 29,348 - Adv. of this Næringskreditt 1,227 1,233 1, Gross loans in balance sheet 85,206 79,366 80,303 79,842 78,976 74,943 Share of loans, corporate market 38 % 38 % 39 % 39 % 40 % 40 % Share of loans, retail market 62 % 62 % 61 % 61 % 60 % 60 % Distribution of loans by industry Retail customers 62 % Agriculture/forestry /fisheries/hunting 6 % Fish farming 1 % Other sectors 3 % Transport and other services provision 2 % Comercial Real Estate 11 % Business services 3 % Maritime sector 4 % Manufacturing and mining 2 % Construction, power and water supply 3 % Retail trade, hotels and restaurants 2 %

20 3.2. Risk profile and write-downs Actual risk profil, Exposure At Default NOK billion A B C D E F G H I J K Risk classification in SpareBank 1 SMN Risk class Low High A AAA - A3 B Baa1 - Baa2 C Baa3 D Ba1 E Ba2 F G Ba2 - B1 H B1 - B2 I B3 - caa3 J Default K Written down Risk class A represents the lowest risk and class K the highest risk. * Probability of default PD* in percent Corresponding ratingclass at Moody's Write-downs on loans and guarantees 1Q 4Q 3Q 30 Jun. (in NOK million) 2012 Increase in and new individual write-downs Reassessments and recoveries Total individual write-downs Change in group write-downs on loans Write-downs on loans and guarantees As % of gross loans incl. Boligkreditt 0.05 % 0.06 % 0.12 % 0.11 % 0.08 % 0.06 % 0.07 % 0.09 % 0.06 %

21 Loss on loans by segment 1Q 4Q 3Q 30 Jun. (in NOK million) Retail SME * Corporate SMN Finans and other Collective write downs Total loss on loans * As from 1 January the bank's SME portfolio is split up and assigned to Retail Banking and Corporate Banking respectively Q13 4Q13 1Q14 14 Retail SME Corporate SMN Finans and other
22 Individual and collective write-downs 1Q 4Q 3Q (in NOK million) 2012 Individual write-downs to cover loss on loans, guarantees at start of period Write downs of loans previously subject to individual write down Reversal of previous years' write downs Increase in write downs of commitments not previously subject to individual write down Jun. Confirmed losses in the period on loans, guarantees etc., prev. subject to ind. write down Individual write downs to cover loss Collective write downs to cover loss on loans, guarantees at start of period Period s collective write down to cover loss on loans, guarantees etc Collective write downs to cover loss on loans, guarantees Loans and guarantees by industry Total Very low risk Wage earners 76,480 60,199 10,425 3, Public administration 1,029 1, Agriculture and forestry 7,603 3,986 1,824 1, Sea farming industries 2, , Manufacturing 2, , Construction, power and water supply 4,979 1,179 1,168 2, Retail trade, hotels and restaurants 3, ,233 1, Maritime sector Property management 13,784 4,784 4,067 3, Business services 5,458 1,396 1,433 2, Transport and other services provision 9,413 5,128 2,501 1, Finance Other sectors 2,231 1, ,244 81,214 25,660 17,525 3,335 1, ,767 77,571 26,590 16,143 3,834 2, ,010 71,896 24,459 17,174 4,374 1, Low risk Medium risk High risk Very high risk Default and written down Write-down ratio 30 Jun. 31 Mar. 31 Dec. 30 Sept. 30 Jun. 31 Dec. (in NOK million) 2012 Non-performing commitments (gross) Impaired commitments (gross) Gross non-performing and impaired commitments Individual write-downs Collective write-downs Write-down ratio (%) 87.2 % 94.6 % 86.0 % 77.2 % 80.1 % 84.9 %
23 Default in excess of 90 days NOK million Q 4Q 1Q Retail* > 90 d *As from 1 January the bank's SME portfolio is split up, and sole proprietorships, agricultural customers and associations etc are assigned to Retail Banking Default in excess of 90 days NOK million Q 4Q 1Q SME > 90 d Corporates* > 90 d * As from 1 January the bank's SME portfolio is split up and SME limited companies are assigned to Corporate Banking
24 Net non-performing and impaired commitments NOK million % % % % 0.47 % 0.5 % Q13 4Q13 1Q14 14 Gross non-perf. and impaired comm. Individual and collective write-downs Gross non-perf. and impaired comm. as % of net lending 0.0 %
25 4. Capital Adequacy SpareBank 1 SMN has used IRB (Internal Rating Approach Foundation) to calculate charges for credit risk since January Using IRB imposes wide-ranging requirements on the bank s organisation, competence, risk models and risk management systems. In June the bank applied for permission to switch to Advanced IRB for enterprise portfolios currently reported using the foundation approach. The effect of the risk weights under IRB is limited due to transitional rules set out in regulations issued by Finanstilsynet. As from Q2 the measurement method for operational risk was changed from the basic approach to the standardised approach at the parent bank. At the group level, subsidiaries are still measured using the basic approach. As from 1 July new buffer requirements have been introduced; see the Financial Institutions Act section 2-9e. As of 30 June the capital conservation buffer requirement is 2.5 per cent and the systemic risk buffer requirement is 2 per cent. These requirements are in addition to the requirement that own funds should constitute at least 4.5 per cent common equity tier 1 (CET1) capital, bringing the overall minimum CET1 requirement to 9 per cent. The systemic risk buffer requirement will increase by a further 1 percentage point, bringing the overall CET1 requirement as of 1 July to 10 per cent. As of 30 June 2015, a countercyclical buffer requirement of 1 percentage point will be applicable. BN Bank received approval for the use of the advanced IRB approach for its corporate portfolio in April. This brought a reduction of NOK 134m in the capital requirement on BN Bank over the course of the quarter, mainly due reduced risk weights in BN Bank's corporate portfolio. Hybrid capital denotes bonds with a nominal interest rate, but the bank is not obliged to pay interest in a period where dividends are not paid, and neither is the investor subsequently entitled to interest that has not been paid, i.e. interest does not accumulate. Hybrid capital characterized by moderate repayment incentives is approved as an element of tier 1 capital up to limit of 15 per cent of aggregate tier 1 capital. If, on the other hand, hybrid capital has no fixed term to maturity and has no repayment incentives, it may be included as an element of core capital up to limit of 35 per cent of aggregate core capital. Finanstilsynet (Norway s FSA) can require hybrid capital to be written down in proportion with equity capital should the bank s tier 1 capital adequacy fall below 5 per cent or total capital adequacy falls below 8 per cent. Written-down amounts on hybrid capital must be written up before dividends can be paid to shareholders or before equity capital is written up. Hybrid capital is recognised as other long-term debt at amortised cost. In connection with change requirements regarding the conditions for hybrid capital, hybrid capital that does not satisfy the new requirements over time will not be eligible for inclusion in other core capital. Such hybrid capital will be reduced by 20 per cent in and 10 per cent thereafter. As of 30 June, SpareBank 1 SMN held NOK 450m in hybrid capital which will be subject to reduction. Subordinated debt ranks behind all other liabilities. Dated subordinated loans cannot constitute more than 50 per cent of tier 1 capital for capital adequacy purposes, while perpetual subordinated loans cannot constitute more than 100 per cent of tier 1 capital. Subordinated loans are classified as a liability in the balance sheet and are measured at amortised cost in the same way as other long-term loans
26 Capital Adequacy 30 Jun. 31 Mar. 31 Dec. 30 Sept. 30 Jun. 31 Dec. (in NOK million) 2012 Equity certificates capital 2,597 2,597 2,597 2,597 2,597 2,597 - Own equity certificates capital Premium reserve Equalisation reserve 2,496 2,496 2,496 1,889 1,889 1,889 Savings bank's reserve 3,276 3,276 3,276 2,944 2,944 2,944 Recommended dividends Provision for gifts Reserve for unrealised gains Other equity and minority interest 1,347 1,419 1,421 1,377 1,386 1,370 Net profit , Total book equity 11,780 11,389 11,242 10,863 10,439 10,042 Deferred tax, goodwill and other intangible assets Share of reserve for unrealised gains in associates Deduction for allocated dividends % deduction for subordinated capital in other financial institutions % deduction for expected losses on IRB, net of write-downs % capital adequacy reserve Share of non-performing, non-amortizsed estimate deviations Net profit , Year-to-date profit included in core capital (50%) Total common equity Tier one 9,945 9,655 9,374 9,089 8,882 8,254 Fund bonds, hybrid capital 1,690 1,647 1,615 1,619 1,625 1,103 Total core capital 11,635 11,303 10,989 10,707 10,508 9,357 Supplementary capital in excess of core capital Fund bonds, hybrid capital in excess of 15 % Perpetual subordinated capital Dated subordinated capital 2,254 2,230 1,950 1,866 1,861 2, % deduction for subordinated capital in other financial institutions % deduction for expected losses on IRB, net of write-downs % capital adequacy reserve Total supplementary capital 1,529 1,591 1,428 1,346 1,386 1,586 Net subordinated capital 13,164 12,893 12,417 12,053 11,894 10,943 Minimum requirements subordinated capital 30 Jun. 31 Mar. 31 Dec. 30 Sept. 30 Jun. 31 Dec. (in NOK million) 2012 Involvement with spesialised enterprises 1,863 1,508 1,573 1,592 1,672 1,654 Other corporations exposure 1,472 1,381 1,479 1,443 1,504 1,470 SME exposure Retail morgage exposure 1,170 1, Other retail exposure Equity investments Total credit risk IRB 4,722 4,229 3,787 3,736 3,895 3,756 Debt risk Equity risk Currency risk Operational risk Exposures calculated using the standardised approach 1,682 2,186 2,151 2,135 2,106 2,074 Deductions Transitional arrangements Minimum requirements subordinated capital 6,998 6,989 6,767 6,802 6,886 6,596 Risk Weighted Assets (RWA) 87,477 87,361 84,591 85,019 86,079 82,446 Common equity Tier % 11.1 % 11.1 % 10.7 % 10.3 % 10.0 % Core capital ratio 13.3 % 12.9 % 13.0 % 12.6 % 12.2 % 11.3 % Capital adequacy ratio 15.0 % 14.8 % 14.7 % 14.2 % 13.8 % 13.3 %
27 Capital Adequacy 13.8 % 12.2 % 10.3 % 14.2 % 12.6 % 10.7 % 14.7 % 14.8 % 13.0 % 12.9 % 11.1 % 11.1 % 15.0 % 13.3 % 11.4 % 30 Jun. 30 Sept. 31 Dec. 31 Mar. 30 Jun. Capital adequacy ratio Core capital ratio Common equity Tier 1 Capital Adequacy 1.6 % 1.9 % 10.3 % 1.6 % 1.9 % 10.7 % 1.7 % 1.8 % 1.9 % 1.9 % 11.1 % 11.1 % 1.7 % 1.9 % 11.4 % 30 Jun. 30 Sept. 31 Dec. 31 Mar. 30 Jun. Common Equity Tier 1 (ren kjernekapital) Fund bonds, hybrid capital Supplementary capital in excess of core capital
28 5. Funding Funding maturity dates NOK bill > 2019 Funding maturity dates over the next eight quarters NOK bill Q3 14 Q4 14 Q1 15 Q2 15 Q3 15 Q4 15 Q1 16 Q

29 Capital markets funding 30 Jun. 31 Mar. 31 Dec. 30 Sept. 30 Jun. 31 Dec. (in NOK million) 2012 NOK Bonds 18,753 19,403 18,953 19,686 21,336 22,858 Curr Bonds 12,403 8,022 11,451 9,832 9,550 6,944 NOK CD's 775 2,750 2, Interbank 6,777 5,565 5,159 5,615 6,372 5,137 Gov. Swap arrangement - 1,143 1,220 2,273 2,273 2,273 Perp. Sub. Loan capital Hybrid equity 1,400 1,433 1,431 1,431 1, Subordinated loan capital 1,600 1,576 1,569 1,602 1,598 1,810 Other liabilities 7,754 6,942 5,830 7,952 5,846 5,938 Total 49,769 47,137 48,667 48,812 48,830 46,110 Curr Bonds 25 % NOK CD's 2 % Interbank 14 % Perp. Sub. Loan capital 1 % Hybrid equity 3 % Subordinated loan capital 3 % Other liabilities 16 % NOK Bonds 38 %
30 6. Financial results Financial results 1Q 4Q 3Q 30 Jun. (in NOK million) 2012 Interest income 1,055 1,027 1,059 1,068 1,036 2,082 1,990 4,118 3,928 Interest expenses ,239 1,244 2,502 2,451 Net interest ,616 1,477 Commission income , Commission expenses Other operating income Commission income and other income ,463 1,139 Dividends Income from investment in related companies Net return on financial investments Net return on financial investments Total income 1,026 1, ,081 1,670 3,580 3,067 Staff costs Administration costs Other operating expenses Total operating expenses ,722 1,654 Result before losses , ,859 1,414 Loss on loans, guarantees etc Result before tax , ,758 1,355 Tax charge Results investments held for sale, after tax Net profit ,400 1,077 Majority share ,390 1,068 Minority interest
31 Balance sheet 30 Jun. 31 Mar. 31 Dec. 30 Sept. 30 Jun. 31 Dec. (in NOK million) 2012 Cash and receivables from central banks 2,940 1,196 4, ,333 1,079 Deposits with and loans to credit institutions 1,088 1,086 1, ,140 3,012 Gross loans to customers before write-down 85,206 79,366 80,303 79,842 78,976 74,943 - Specified write-downs Write-downs by loan category Net loans to and receivables from customers 84,735 78,898 79,836 79,379 78,528 74,504 Fixed-income CDs and bonds at fair value 15,743 17,623 16,887 19,192 19,402 17,164 Derivatives 4,366 3,205 3,050 2,609 2,784 3,100 Shares, units and other equity interests 1,138 1,108 1, Investment in related companies 4,783 4,787 4,624 4,440 4,294 4,573 Investments held for sale Goodwill Other assets 3,380 3,122 3,344 3,593 3,090 2,798 Assets 118, , , , , ,975 Deposits from credit institutions 6,774 6,710 6,379 7,888 8,644 7,410 Deposits from and debt to customers 59,408 54,736 56,074 53,423 55,294 52,252 Debt created by issue of securities 31,667 29,914 33,762 29,592 30,936 30,259 Derivatives 3,569 2,516 2,295 1,975 2,288 2,790 Other liabilities 2,222 3,036 2,303 4,862 2,210 2,070 Investments held for sale Subordinated loan capital 3,338 3,308 3,304 3,341 3,345 3,040 Total liabilities 106, , , , ,750 97,892 Equity capital certificate 2,597 2,597 2,597 2,597 2,597 2,597 Own holding of ECCs Premium fund Dividend equalisation fund 2,496 2,496 2,496 1,889 1,889 1,889 Recommended dividends Provision for gifts Savings bank s reserve 3,276 3,276 3,276 2,944 2,944 2,944 Unrealised gains reserve Other equity capital 1,280 1,357 1,354 1,312 1,323 1,343 Result of the period , Minority interests Total equity capital 11,780 11,389 11,242 10,863 10,439 10,082 Total liabilities and equity 118, , , , , ,
32 Key figures 1Q 4Q 3Q 30 Jun Return on equity 16.0 % 17.7 % 13.1 % 16.3 % 11.1 % 16.8 % 11.9 % 13.3 % 11.7 % Cost/income ratio group 43 % 42 % 48 % 43 % 51 % 42 % 51 % 48 % 54 % Cost/income ratio group, ex. financial inv. 54 % 55 % 57 % 51 % 54 % 55 % 58 % 56 % 63 % 12-month cost growth 4.0 % 6.5 % 4.1 % 3.3 % 6.9 % 4.0 % 6.9 % 4.1 % 11.6 % Gross loans to customers* 114, , , , , , , , ,909 Growth in loans last 12 months* 5.1 % 4.4 % 6.8 % 6.7 % 8.4 % 5.1 % 8.4 % 6.8 % 10.2 % Growth in loans this period* 2.7 % -0.4 % 1.6 % 1.2 % 2.0 % 2.3 % 3.9 % 6.8 % 10.2 % Deposits from customers 59,408 54,736 56,074 53,423 55,294 59,408 55,294 56,074 52,252 Growth in deposits last 12 months 7.4 % 4.1 % 7.3 % 5.1 % 7.3 % 7.4 % 7.3 % 7.3 % 9.2 % Growth in deposits this period 8.5 % -2.4 % 5.0 % -3.3 % 5.1 % 5.9 % 5.8 % 7.3 % 9.2 % Ordinary lending financed by ordinary deposits 70 % 69 % 70 % 67 % 70 % 70 % 70 % 70 % 70 % Total assets 118, , , , , , , , ,919 Average total assets (quarterly) 115, , , , , , , , ,372 Employees in employment group 1,167 1,157 1,159 1,165 1,164 1,167 1,164 1,159 1,135 Employees in employment parent bank Employees in employment subsidiares Number of branches Lending margin Deposit margin (0.55) (0.59) (0.56) (0.53) (0.50) (0.57) (0.46) (0.51) (0.05) Net other operating income of total income 38 % 37 % 39 % 39 % 47 % 37 % 43 % 41 % 37 % Common Equity Tier 1 ratio 11.4 % 11.1 % 11.1 % 10.7 % 10.3 % 11.4 % 10.3 % 11.1 % 10.0 % Capital adequacy ratio 15.0 % 14.8 % 14.7 % 14.2 % 13.8 % 15.0 % 13.8 % 14.7 % 13.3 % Core capital ratio 13.3 % 12.9 % 13.0 % 12.6 % 12.2 % 13.3 % 12.2 % 13.0 % 11.3 % Total core capital 11,635 11,303 10,989 10,707 10,508 11,635 10,508 10,989 9,357 Net subordinated capital 13,164 12,893 12,417 12,053 11,894 13,164 11,894 12,417 10,943 Impairment losses ratio 0.05 % 0.06 % 0.12 % 0.11 % 0.08 % 0.06 % 0.07 % 0.09 % 0.06 % Non-performing commitm. as % of gross loans 0.29 % 0.24 % 0.34 % 0.35 % 0.38 % 0.29 % 0.38 % 0.34 % 0.36 % Other doubtfull commitm. as % of gross loans 0.18 % 0.21 % 0.14 % 0.19 % 0.13 % 0.18 % 0.13 % 0.14 % 0.14 % ECC price Number of certificates issued, millions Booked equity capital per ECC (incl. dividend) Adjusted profit per ECC P/E per ECC P/B equity capital * Gross loans to customers includes Sparebank1 Boligkreditt and Sparebank 1 Næringskreditt

33 7. Segment information As of 1 January the bank's SME portfolio was split up and assigned to Retail Banking and Corporate Banking respectively. Limited companies are transferred to Corporate Banking. Sole proprietorships, agricultural customers and associations etc are transferred to Retail Banking. Historical data have not been reworked owing to the difficulty of reconstructing such data at a sufficiently precise level. In the segment information, historical data for Retail customers are exclusive sole proprietorships, agricultural customers and associations. Historical data for Corporate customers are the former Large Corporates. The SME portfolio is treated as a separate business line in figures for. For the subsidiaries, the figures refer to the respective company accounts, while for joint ventures incorporated by the equity method the Group s profit share is stated, after tax, as well as book value of the investment at group level Extract from income statement Group (in NOK million) Retail Corporate Market Market SpareBank 1 SMN Markets Eiendoms Megler 1 Midt- Norge SpareBank 1 Finans Midt-Norge AS SpareBank 1 Regnskapsh uset SMN AS SpareBank 1 Gruppen BN Bank Uncollated Total Net interest Allocated Total interest income Commission income and other income Net profit on financial investments Total income ,081 Total operating expenses Ordinary operating profit ,197 Loss on loans, guarantees etc Result before tax incl investments held for sale ,165 Post-tax return on equity 39.3 % 18.0 % 16.8 % Balance sheet Loans and advances to customers 75,490 34, , ,561 adv. of this to Boligkreditt and Næringskreditt -28,208-1, ,355 Individual allowance for impairment on loan Group allowance for impairment on loan Other assets ,228 1,164 30,851 34,023 Total assets 47,403 33, , ,228 1,164 31, ,758 Deposits to customers 32,150 25, ,386 59,408 Other liabilities and equity 15,253 7, , ,228 1,164 30,367 59,351 Total liabilites 47,403 33, , ,228 1,164 31, ,758 Income specified by segment, excluding financial investments SpareBank 1 SMN Markets 2 % EiendomsMegler 1 Midt- Norge 10 % Corporate Market 31 % SpareBank 1 Finans Midt- Norge AS 4 % SpareBank 1 Regnskapshuset SMN AS 6 % Retail Market 47 %
34 As from 1 January the bank's SME portfolio is split up and assigned to Retail Banking and Corporate Banking respectively. Limited companies are transferred to Corporate Banking. Sole proprietorships, agricultural customers and associations etc are transferred to Retail Banking. Figures for are therefore not directly comparable with historical figures. Interest income, Retail Market, Corporate Market and SME 1Q 4Q 3Q 30 Jun. (in NOK million) Retail Corporate SME Net interest income ,608 Developement in margin, Retail Market and Corporate Market 1Q 4Q 3Q 30 Jun. Lending (in percentage) Retail Corporate Total Q 4Q 3Q 30 Jun. Deposits (in percentage) Retail Corporate Total *Definition margin: Average customer interest minus 3 months average nibor Development in volume, Retail Market, Corporate Market and SME 1Q 4Q 3Q 30 Jun. Lending* (in NOK million) Retail 75,490 73,735 63,518 62,233 60,832 75,490 60,832 63,518 Corporate 34,656 33,436 31,920 31,775 32,420 34,656 32,420 31,920 SME 9,055 9,124 8,827 8,827 9,055 Total 110, , , , , , , ,492 * Gross loans to customers includes SpareBank 1 Boligkreditt and SpareBank 1 Næringskreditt 1Q 4Q 3Q 30 Jun. Deposits (in NOK million) Retail 32,150 29,432 24,185 23,880 24,186 32,150 24,186 24,185 Corporate 25,872 24,740 21,544 19,330 20,601 25,872 20,601 21,544 SME 8,734 8,641 8,640 8,640 8,734 Total 58,022 54,171 54,463 51,852 53,427 58,022 53,427 54,463 Developement in commision income, Retail Market, Corporate Market and SME 1Q 4Q 3Q 30 Jun. (in NOK million) Retail Corporate SME Total
35 7.2. Retail Market The Retail Market is responsible for all activity directed at the region s retail customers. The Retail Market provides personal financial advice. The Retail Market aims to attract and retain customers by developing a strong product range, first class advisers, unique accessibility and excellent customer handling. As from 1 January sole proprietorships, agricultural customers and associations are assigned to Retail Banking. Figures for are therefore not directly comparable with historical figures. Business description 30 Jun. Facts about the business area Lending volume 75,490 Deposits volume 32,150 No. of active customers 198,106 FTEs 385 Financial performance 1Q 4Q 3Q 30 Jun. (in NOK million) Net interest income lending Net interest income deposits Net interest income allocated capital Total interest income Net guarantee commision, incl. Boligkreditt Net commision of savings products Net commision insurance services Net commision payment trans. services Other commision income Net fee and commission income Net profit on financial investments Total income ,346 Total operating expences* Results Loss on loans, guarantees etc Results before tax *) Includes both direct and distributed expences Post-tax return on equity (annualized) 39.3 % 31.9 % 38.7 % Development in margin Definition margin: Average customer interest minus 3 months average nibor Q 4Q 1Q Lending margin Retail Deposits margin Retail
36 Development in lending volume Figures for incl. sole proprietorships, agricultural customers and associations NOK bill Q 4Q 1Q Development in deposits volume Figures for incl. sole proprietorships, agricultural customers and associations NOK bill Q 4Q 1Q
37 7.3. SME The SME segment consists of costumers with an exposure size of +/- NOK 8m. As from 1 January the bank's SME portfolio is split up and assigned to Retail Banking and Corporate Banking respectively. This table shows historical data for the SME segment in. Financial performance 4Q 3Q 1Q 1q (in NOK million) Net interest income lending Net interest income deposits Net interest income allocated capital Total interest income Net guarantee commision, incl. Boligkreditt Net commision of savings products Net commision insurance services Net commision payment trans. services Net fee and commission income Net profit on financial investments Total income Total operating expences* Results Loss on loans, guarantees etc Results before tax *) Includes both direct and distributed expences Post-tax return on equity (annualized) 29,4 % Development in margin Definition margin: Average customer interest minus 3 months average nibor 3,23 3,41 3,48 3,46-0,20-0,24-0,32-0,36 1Q 3Q 4Q Lending margin SME Deposits margin SME
38 Development in lending volume 8,6 8,8 9,1 9,1 NOK bill. 10,0 8,0 6,0 4,0 2,0,0 1Q 3Q 4Q Development in deposits volume NOK bill. 12,0 8,8 8,6 8,6 8,7 8,0 4,0,0 1Q 3Q 4Q
39 7.4. Corporate The Corporate segment is responsible for activity regarding the banks's corporate customers. As from 1 January the bank's SME portfolio is split up, and limited companies are transferred to the Corporate Market (former Large Corporates). Figures for are the former Large Corporates. Business description 30 Jun. Facts about the business area Lending volume 34,656 Deposits volume 25,872 No. of active customers 6,618 FTEs 123 Financial performance 1Q 4Q 3Q 30 Jun. (in NOK million) Net interest income lending Net interest income deposits Net interest income allocated capital Total interest income Net guarantee commision, incl. Boligkreditt Net commision of savings products Net commision insurance services Net commision payment trans. services Other commision income Net fee and commission income Net profit on financial investments Total income Total operating expences* Results Loss on loans, guarantees etc Results before tax *) Includes both direct and distributed expences Post-tax return on equity (annualized) 18.0 % 10.0 % 12.8 % Development in margin Definition margin: Average customer interest minus 3 months average nibor. Figures for incl SME Ltd. Figures for are Large Corporates Q 4Q 1Q Lending margin Corporates Deposit margin Corporates
40 Development in lending volume Figures for incl SME Ltd NOK bill Q 4Q 1Q Lending volume Development in deposits volume Figures for incl SME Ltd NOK bill Q 4Q 1Q Deposits volume
41 7.6. Markets SpareBank 1 SMN Markets is considered as a separate business line within the Group. It comprises two income generating units: Fixed income/foreign exchange and Securities along with Back Office and Mid Office. As from the fourth quarter, SpareBank 1 SMN s corporate business was transferred to SpareBank 1 Markets. SpareBank 1 SMN Markets Financial performance 1Q 4Q 3Q 30 Jun. (in NOK million) Net interest income Net interest income allocated capital Total interest income Net fee and commission income Capital gain/agio Securities Total income Total operating expences Results Loss on loans, guarantees etc Results before tax Cost and income (NOK mill.) 40 Result before tax (NOK mill.) Q 4Q 1Q Total operating expences Total income Results before tax Merger and ownership changes in SpareBank 1 Markets SpareBank 1 SMN Markets in Trondheim will be fully integrated in SpareBank 1 Markets as a result of a merger. SpareBank 1 SMN will integrate its markets operation into SpareBank 1 Markets. The settlement will be in SpareBank 1 Markets shares. Consequently, SpareBank 1 SMN will become the principal shareholder in the combined company. Following the merger and a planned equity issue of MNOK 65 in September, the ownership structure in SpareBank 1 Markets will be as follows:
42 SpareBank 1 SMN: 73.3 % (previously 27.0 %) SpareBank 1 Nord-Norge: 10.0 % (27.0 %) SamSpar: 10.0 % (27.0 %) Sparebanken Hedmark: 6.1 % (16.6 %) Other shareholders: 0.6 % (2.2%) The operations of the two companies will primarily continue as-is, with 70 employees in Oslo and 40 employees in Trondheim. The merged company will be led by Stein Husby. The business area 'Foreign Exchange and Derivatives', as well as certain supporting functions, will be located in Trondheim. Finn Haugan, CEO of SpareBank 1 SMN, will be appointed Chairman of the Board in SpareBank 1 Markets. In September, an equity issue of MNOK 65 in SpareBank 1 Markets will be completed. The issue is a part of an already planned recapitalisation of the company, independent of the merger. SpareBank 1 Markets recorded a loss of MNOK 69 as of 14. Restructuring costs constitute MNOK 40 of the loss, whilst trading losses constitute MNOK 17. The transaction is expected to be completed within 4(th) quarter of, subject to regulatory approval and final Board approvals
43 7.7. Subsidiaries EiendomsMegler 1 Midt-Norge AS EiendomsMegler 1 Midt-Norge has a solid market-leader position in Nord-Trøndelag and Sør- Trøndelag as well as Møre and Romsdal. The company is owned by SpareBank 1 SMN (87 per cent), SpareBank 1 Nordvest (7.6 per cent) and SpareBank 1 Søre Sunnmøre (5.4 per cent). Financial performance 1Q 4Q 3Q 30 Jun. (in NOK million) Net interest Commission income and other income Total income Total operating expenses Result before tax Cost and income (NOK mill.) Result before tax (NOK mill.) Q 4Q 1Q Total operating expenses Total income Result before tax
44 SpareBank 1 Finans Midt-Norge AS SpareBank 1 Finans Midt-Norge is the region s leading finance company and an active partner for businesses. SpareBank 1 Finans Midt-Norge emphasises local competence, and works for greater value creation in Trøndelag and Nordvestlandet. The company services the market through its own sales operation and through the Bank s offices and suppliers. The company is owned by SpareBank 1 SMN (90.9 per cent), SpareBank 1 Nordvest and SpareBank 1 Søre Sunnmøre (9.9 per cent). Financial performance 1Q 4Q 3Q 30 Jun. (in NOK million) Total interest income Commission income and other income Total income Total operating expenses Ordinary operating profit Loss on loans, guarantees etc Total costs incl. loss on loans Result before tax Cost and income (NOK mill.) Result before tax (NOK mill.) Q 4Q 1Q Total costs incl. loss on loans Total income Result before tax
45 SpareBank 1 Regnskapshuset SMN AS SpareBank 1 Regnskapshuset SMN is a wholly-owned subsidiary of SpareBank 1 SMN. In collaboration with other SpareBank 1 banks, SpareBank 1 Regnskapshuset SMN has launched a nationwide drive in the accounting business through SpareBank 1 Regnskapshuset. SpareBank 1 Regnskapshuset intends to be one of Norway s leading actors in the accounting industry by building up a national accounting enterprise based on regional ownership, strong links to the owner banks and closeness to the market. SpareBank 1 Regnskapshuset SMN took over six accounting firms in. Four further accounting firms were acquired in the first half of. The strategy of growth through acquisitions represents a consolidation of a fragmented accounting industry. Financial performance 1Q 4Q 3Q 30 Jun. (in NOK million) Total interest income Commission income and other income Total income Total operating expenses Result before tax Cost and income (NOK mill.) Result before tax (NOK mill.) Q 4Q 1Q Total operating expenses Total income Result before tax

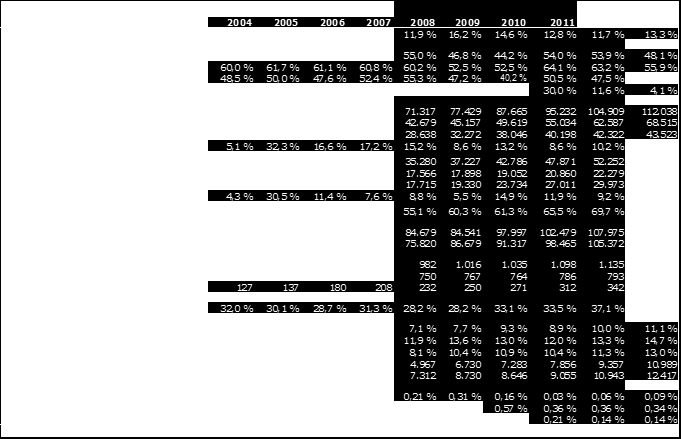
46 8. Development last ten years
47 - 46 -
48 - 47 -
49 - 48 -

50 *) The strong growth in 2005 in lending and deposits is related to the acquisition of 100 per cent of Romsdals Fellesbank
Investor Relations. Supplementary information First Quarter 2014
 Investor Relations Supplementary information First Quarter 2014 SpareBank 1 SMN 7467 Trondheim Chief Executive, CEO Finn Haugan For further information, please contact Kjell Fordal, Executive Director
Investor Relations. Supplementary information Fourth Quarter 2013
 Investor Relations Supplementary information Fourth Quarter SpareBank 1 SMN 7467 Trondheim Chief Executive, CEO Finn Haugan For further information, please contact Kjell Fordal, Executive Director Finance
Notes. Contents. 1st Quarter 2014
 Notes Contents Note 1 - Accounting principles... 2 Note 2 - Critical estimates and assessment concerning the use of accounting principles... 3 Note 3 - Account by business line... 4 Note 4 - Operating
Investor Relations. Supplementary information Second Quarter 2011
 Investor Relations Supplementary information Second Quarter SpareBank 1 SMN 7467 Trondheim Chief Executive, CEO Finn Haugan For further information, please contact Kjell Fordal, Executive Director Finance
Investor Relations. Supplementary information First Quarter 2011
 Investor Relations Supplementary information First Quarter 211 SpareBank 1 SMN 7467 Trondheim Chief Executive, CEO Finn Haugan For further information, please contact Kjell Fordal, Executive Director Finance
Q2 2014. August 13th 2014 Q2 2014
 August 13th 2014 Good result in 1st half 2014 A good first half-year, and an excellent 2nd quarter in isolation Implementation of capital plan with focus on profitability and management of risk weighted
Investor Relations. Supplementary information 3rd Quarter 2011
 Investor Relations Supplementary information 3rd Quarter 2011 SpareBank 1 Nord-Norge 9298 Tromsø Chief Executive Officer, CEO Hans Olav Karde For further information, please contact Rolf Eigil Bygdnes,
Investor Relations. Supplementary information First half and second quarter report 2012
 Investor Relations Supplementary information First half and second quarter report SpareBank 1 SMN 7467 Trondheim Chief Executive, CEO Finn Haugan For further information, please contact Kjell Fordal, Executive
Q4 2013. Preliminary annual accounts 2013. February 5th 2014 Q4 2013
 Preliminary annual accounts 2013 February 5th 2014 2013 profit performance is the best in the bank s history An excellent year the bank is delivering on its stated goals and plans Strong focus on profitability,
Investor Relations. Supplementary information First Quarter 2012
 Investor Relations Supplementary information First Quarter 212 SpareBank 1 SMN 7467 Trondheim Chief Executive, CEO Finn Haugan For further information, please contact Kjell Fordal, Executive Director Finance
Q3 2014. October 31th 2014 Q3 2014
 October 31th 2014 ECONOMIC BAROMETER 2014 Moderate exposure to the consequences of reduced shelf activity North Trøndelag Deceleration in sight GDP Development South Trøndelag Better placed than neighbouring
Investor Relations. Supplementary information First Quarter 2009
 Investor Relations Supplementary information First Quarter 2009 SpareBank 1 SMN 7467 Trondheim Chief Executive, CEO Finn Haugan For further information, please contact Kjell Fordal, Executive Director
Report of the Board of Directors
 Report of the Board of Directors First quarter (Consolidated figures. Figures in parentheses refer to the same period of 2013 unless otherwise stated) Pre-tax profit: NOK 597m (390m) First quarter net
SpareBank 1 Nord-Norge Preliminary annual accounts 2010 Group
 SpareBank 1 Nord-Norge Preliminary annual accounts 2010 Group Very good results for the 4 th quarter and 2010 overall. The Bank s financial strength remains strong. Highlights (figures in brackets refer
Contents. 1st Quarter 2015
 Contents Main figures... 3 Report of the Board of Directors... 4 Income statement... 16 Balance sheet... 18 Cash flow statement... 19 Change in equity... 20 Equity capital certificate ratio... 23 Results
Sparebanken Hedmark Financial result Third quarter 2015
 Sparebanken Hedmark Financial result Third quarter 2015 Sparebanken Hedmark Third quarter 2015 Stable development and falling unemployment rate in Hedmark - Hedmark and Oppland are two of the country`s
DNB Group FACT BOOK (PRELIMINARY AND UNAUDITED)
") 1 DNB Group FACT BOOK First quarter 2013 (PRELIMINARY AND UNAUDITED) Group Chief Executive Rune Bjerke For further information, please contact Bjørn Erik Næss, Chief Financial Officer bjorn.erik.naess@dnb.no
1 DNB Group FACT BOOK First quarter 2013 (PRELIMINARY AND UNAUDITED) Group Chief Executive Rune Bjerke For further information, please contact Bjørn Erik Næss, Chief Financial Officer bjorn.erik.naess@dnb.no
Sparebanken Hedmark. Presentation of financial results for 2014
 Sparebanken Hedmark Presentation of financial results for 214 About Sparebanken Hedmark Sparebanken Hedmark Norway s largest selfowned savings bank Hedmark is the leading provider of financial products
Chief Executive, CEO. Arne Austreid. For further information, please contact
 Chief Executive, CEO Arne Austreid For further information, please contact Inge Reinertsen, Chief Financial Officer inge.reinertsen@sr-bank.no +47 909 95 033 Stian Helgøy, VP Investor Relations stian.helgoy@sr-bank.no
Preliminary Accounts 2012
 Q4 Preliminary Accounts Presentation of results from SpareBank 1 Gruppen Kirsten Idebøen, CEO 14 February 2013 The pre-tax profit for was more than doubled compared with 2011 Pre-tax profit Group (MNOK)
INTERIM REPORT INTERIM REPORT Q1 2016 NOTES TO THE ACCOUNTS
 INTERIM REPORT INTERIM REPORT Q1 2016 NOTES TO THE ACCOUNTS 1 Main figures Contents 3 Main figures 4 7 Interim report 8 Income statement 9 Balance sheet 10 Changes in equity capital 12 Cash flow statement
First quarter 2012. Positive volume and spread development during the past 12 months. Negative mark-to-market adjustment of basis swaps
 1 First quarter 2012 Positive volume and spread development during the past 12 months Negative mark-to-market adjustment of basis swaps Improved results in the Baltics Strengthened deposit-to-loan ratio
SpareBank 1 Nord-Norge First quarter report 2010 the Group
 SpareBank 1 Nord-Norge First quarter report 2010 the Group Very satisfactory result for Q1 2010. The bank has sustained its high level of solidity. Main features (figures in brackets refer to the same
1 st Quarter 2013. Presentation of results from SpareBank 1 Gruppen. Kirsten Idebøen, CEO
 1 st Quarter 2013 Presentation of results from SpareBank 1 Gruppen Kirsten Idebøen, CEO 25 April 2013 Best result in SpareBank 1 Gruppen's history Pre-tax profit in last 5 years (MNOK) 360 Pre-tax profit:
Interim Report 2 nd quarter 2014 Nordea Eiendomskreditt AS
 Interim Report 2 nd quarter 2014 Nordea Eiendomskreditt AS Nordea Eiendomskreditt AS is part of the Nordea group. Nordea s vision is to be a Great European bank, acknowledged for its people, creating superior
Financial Stability 2/12. Charts
 Financial Stability /1 Charts Chart 1.1 Vulnerabilities in the Norwegian banking sector and external sources of risk to the banking sector 1) Vulnerability in banking sector External sources of risk to
Interim report. Storebrand Boligkreditt AS
 Interim report Storebrand Boligkreditt AS 1 st quarter 2014 1 Storebrand Boligkreditt AS - Kvartalsberetning interim report for the for 1. 1st kvartal quarter 2014 of 2014 (Result (Tall i parentes figures
Quarter 2011. Presentation of results from SpareBank 1 Gruppen. Kirsten Idebøen, CEO
 3rd Q Quarter Presentation of results from SpareBank 1 Gruppen Kirsten Idebøen, CEO 28 October Profits down due to market turmoil and high claims ratio Q1 Q2 Group pre-tax profit* (MNOK), quarterly 374
Company Update Share Price: NOK 54 14 August 2014 Target Price: NOK 70 (68) Building the capital base
 Building the capital base") SpareBank 1 SMN BUY Company Update Share Price: NOK 54 14 August 2014 Target Price: NOK 70 (68) Building the capital base Share data 14.08.2014 Sector Banks Bloomberg MING NO Risk rating Low Outst. shares
SpareBank 1 SMN BUY Company Update Share Price: NOK 54 14 August 2014 Target Price: NOK 70 (68) Building the capital base Share data 14.08.2014 Sector Banks Bloomberg MING NO Risk rating Low Outst. shares
1 st half and 2 nd quarter 2010
 1 st half and 2 nd quarter Presentation of results SpareBank 1 Gruppen Kirsten Idebøen, CEO 11 August Highlights SpareBank 1 Gruppen reports good results for the 1 st half-year, despite challenging financial
BN Bank ASA INTERIM REPORT 4TH QUARTER 2014
 BN Bank ASA INTERIM REPORT 4TH QUARTER 2014 Content Financial Ratios... 3 Report from the Board of Directors... 4 GROUP Income Statement... 8 Balance Sheet... 9 Change in Equity...10 Cash Flow Analysis...11
Annual report 2015. General information
 General information 1 of 8 This is SpareBank 1 SMN SpareBank 1 SMN is the region s leading financial services group and one of six owners of the SpareBank 1 Alliance. The head office is in Trondheim and
Sparebanken Sør. 1 st quarter 2015
 Sparebanken Sør 1 st quarter 2015 Information The merger between Sparebanken Pluss and Sparebanken Sør complies with the rules set out in IFRS 3 and has been executed as a transaction. Sparebanken Sør
Presentation Q3 2014 SpareBank 1 Gruppen. 22. October 2014 - Kirsten Idebøen, CEO
 Presentation SpareBank 1 Gruppen 22. October - Kirsten Idebøen, CEO Best 3rd quarter result ever Pre tax profit for the quarter (MNOK) Pre tax profit year to date (MNOK) 745 1 753 529 1 216 320 707 (8)
SpareBank 1 Nord-Norge
 SpareBank 1 Nord-Norge Interim report for Q2 2012 Group (Figures in brackets are for the same period in 2011) Satisfactory result for Q2 2012. Main features: Profit before tax NOK 392 million (NOK 573
Interim report for the 3rd quarter of 2008. Glitnir Bank ASA
 Interim report for the 3rd quarter of 2008 Glitnir Bank ASA contents Report of the Directors...3 Consolidated Income Statement...5 Consolidated Balance Sheet...6 Consolidated Statement of Changes in Equity...7
Third quarter report and accounts 2007: A very good result for SpareBank 1 Nord-Norge
 PRESS RELEASE Third quarter report and accounts 2007: A very good result for SpareBank 1 Nord-Norge Main features (amounts and percentages in brackets refer to 2006): A very good result o Pre-tax operating
Presentation of results. Kirsten Idebøen, CEO
 Q2 1st half-year and 2nd quarter 2012 Presentation of results from SpareBank 1 Gruppen Kirsten Idebøen, CEO 9 August 2012 Year-to-date profit in line with last year Pre-tax profit Group quarterly (MNOK)
Sparebanken Sør. 3 rd quarter 2015
 Sparebanken Sør 3 rd quarter 2015 Information The merger between Sparebanken Pluss and Sparebanken Sør complies with the rules set out in IFRS 3 and has been executed as a transaction. Sparebanken Sør
SpareBank 1 Gruppen. Presentation 1st Half 2013
 SpareBank 1 Gruppen Presentation 1st Half 14 August - Kirsten Idebøen, Idebøen CEO Performance in the 1 st half of Substantial improvement in pre-tax profit MNOK 531 (296) Premium growth and good result
SpareBank 1 Boligkreditt AS
 SpareBank 1 Boligkreditt AS 3rd quarter 28 Stavanger 22 October 28 SPAREBANK 1 BOLIGKREDITT AS 28 As of 3 September 28 Accounts 3q 28 Income statement 3.9.28 3.9.27 27 NOK 1 Interest income 1 331 498 225
Sparebanken Pluss Quarterly Report Q1 2013
 Sparebanken Pluss Quarterly Report Q1 2013 KEY FIGURES* As at. 31.03.13 31.12.12 30.09.12 30.06.12 31.03.12 Total income (NOK mill.) 153 675 508 326 186 Total operating expenses (NOK mill.) 68 251 185
Sparebanken Hedmark. Tier 2 bond issue. Presentation, May 2013
 Sparebanken Hedmark Tier 2 bond issue Presentation, May 2013 Summary Tier 2 issue: NOK 500 millions Background: Acquisition of shares in Bank 1 Oslo Akershus AS, increasing ownership from 12 % to 40,5
Preliminary accounts for 2011
 Preliminary accounts for Q4 Presentation of results from SpareBank 1 Gruppen Kirsten Idebøen, CEO 15 February 2012 Volatile securities market, combined with damage due to natural perils and large claims,
Chief Executive, CEO. Arne Austreid. For further information, please contact
 Chief Executive, CEO Arne Austreid For further information, please contact Inge Reinertsen, Chief Financial Officer inge.reinertsen@sr-bank.no +47 909 95 033 Vidar Torsøe, VP Investor Relations vidar.torsoe@sr-bank.no
1st Quarter 2012. 26 April 2012. Presentation of results from SpareBank 1 Gruppen. Kirsten Idebøen, CEO
 1st Quarter 2012 Presentation of results from SpareBank 1 Gruppen Kirsten Idebøen, CEO 26 April 2012 Good development in results for the group - Best result in the past five years Pre-tax profit for the
BN Bank ASA INTERIM REPORT 2ND QUARTER 2013
 BN Bank ASA INTERIM REPORT 2ND QUARTER 2013 Content Financial Ratios... 3 Report of the Directors... 4 Parent Bannk Income Statement... 8 Balance Sheet... 9 Statement of Changes in Equity...10 Statement
Solid operating profit in Q1 2016 28 April 2016
 Investor Presentation Solid operating profit in Q1 2016 28 April 2016 Árni Ellefsen, CEO Disclaimer This presentation contains statements regarding future results, which are subject to risks and uncertainties.
Sparebanken Sør. 4 th quarter 2015
 Sparebanken Sør 4 th quarter 2015 Information The merger between Sparebanken Pluss and Sparebanken Sør complies with the rules set out in IFRS 3 and has been executed as a transaction. Sparebanken Sør
Half-year report Results for first half of 2011
 First half-year 2011 Half-year report Results for first half of 2011 Norwegian and international economy Debt problems in several European countries have affected the international credit marked in the
1st half-year and 2nd quarter 2011
 1st half-year and 2nd quarter Q2 Presentation of results From SpareBank 1 Gruppen Kirsten Idebøen, CEO August 10th Good underlying earnings improvement marred by weak equity markets and flood damage Group
Chief Executive, CEO. Arne Austreid. For further information, please contact
 Chief Executive, CEO Arne Austreid For further information, please contact Inge Reinertsen, Chief Financial Officer inge.reinertsen@sr-bank.no +47 909 95 033 Vidar Torsøe, VP Investor Relations vidar.torsoe@sr-bank.no
Sparebanken Pluss. Quarterly Report Q2 2013 (This translation from Norwegian has been made for information purpose only)
") Sparebanken Pluss Quarterly Report Q2 2013 (This translation from Norwegian has been made for information purpose only) KEY FIGURES* As at. 30.06.13 31.03.13 31.12.12 30.09.12 30.06.12 Total income (NOK
Sparebanken Pluss Quarterly Report Q2 2013 (This translation from Norwegian has been made for information purpose only) KEY FIGURES* As at. 30.06.13 31.03.13 31.12.12 30.09.12 30.06.12 Total income (NOK
Sparebanken Sør. 2 nd quarter 2015
 Sparebanken Sør 2 nd quarter 2015 Information The merger between Sparebanken Pluss and Sparebanken Sør complies with the rules set out in IFRS 3 and has been executed as a transaction. Sparebanken Sør
Quarter 2011. Presentation of results from SpareBank 1 Gruppen. Kirsten Idebøen, CEO
 1st Q Quarter 2011 Presentation of results from SpareBank 1 Gruppen Kirsten Idebøen, CEO 29 April 2011 Highlights SPAREBANK 1 GRUPPEN Significantly improved profit for Good return on equity of 12.4 (8.8)
billion, or 63.8 %, with an increase of 1.1 percentage point over the past 12 months.
 0 Helgeland Sparebank, 1st Quarter 2008 The Highlights (comparative figures for Q1 2007) Pre-tax profit NOK 41 (83) million Net interest income 2.24 % (2.30 %) Return on equity 8.5 % (13.5 %) Result per
Closing of Sparebanken Hedmark s acquisition of Bank 1 Oslo Akershus AS. Investor information, 29 June 2016
 Closing of Sparebanken Hedmark s acquisition of Bank 1 Oslo Akershus AS Investor information, 29 June 2016 Background Since 2013, Sparebanken Hedmark has owned 40.5 per cent of Bank 1 Oslo Akershus AS
PRELIMINARY ACCOUNTS FOR 2009 SPAREBANK 1 SR-BANK GROUP. Page 1
 PRELIMINARY ACCOUNTS FOR 2009 SPAREBANK 1 SR-BANK GROUP Page 1 SpareBank 1 SR-Bank achieved a very good result for the 2009 financial year as a consequence of sound underlying banking operations and the
Interim report 1st quarter 2016
 Interim report 1st quarter 2016 About Komplett Bank ASA Komplett Bank ASA started banking operations on 21 March 2014 when the company received its banking licence from the Norwegian authorities. Komplett
D R A F T P R E S S R E L E A S E
 D R A F T P R E S S R E L E A S E SpareBank 1 SR-Bank the leading bank in the region for 25 years Group profit before tax of NOK 308 million The result is marked by the development in the stock markets
Result after tax 1 062 1.78 % 692 1.22 % 966 1.27 %
 Index Key figures group...... 1 Quarterly report... 2 Statement of income.... 11 Statement of financial position 12 Changes in equity.. 13 ECC ratio overall... 13 Statement of cash flows...... 14 Result
PARETO BANK. Financial Results Third Quarter 2014 SIDE 1
 PARETO BANK Financial Results Third Quarter 2014 SIDE 1 SIDE 2 1 FINANCIAL STATEMENT 2 LENDING AND CREDIT RISK 3 FUNDING AND LIQUIDITY THIRD QUARTER 2014 Profit after write-downs and tax MNOK 47.2 (MNOK
INTERIM REPORT Q1 2016
 INTERIM REPORT Q1 2016 First quarter 2016 Pre-tax profit: NOK 322 million (NOK 407 million) Weaker performance by financial instruments: NOK -35 million (NOK 50 million) Higher nominal net interest: NOK
Note 8 - Loans and advances to customers
 Note 8 - Loans and advances to customers 2013 2014 (NOK million) 2014 2013 Loans specified by type - - Financial lease 1,937 1,877 11,547 12,523 Bank overdraft and operating credit 12,523 11,547 3,277
Interim report Q1 2013 KLP Banken AS Group
 Interim report Q1 2013 KLP Banken AS Group Contents Interim financial statement 1/2013 3-4 Income statement 5 Financial position statement 6 Statement of owners equity 7 Statement of cash flows 8 Notes
Interim report. Storebrand Boligkreditt AS. 4 th quarter 2013 (unaudited)
") Interim report Storebrand Boligkreditt AS 4 th quarter 2013 (unaudited) 1 Storebrand Boligkreditt AS - Quarterly report for the 4th quarter (Profit (Tall i parentes figures for gjelder the corresponding
Interim report Storebrand Boligkreditt AS 4 th quarter 2013 (unaudited) 1 Storebrand Boligkreditt AS - Quarterly report for the 4th quarter (Profit (Tall i parentes figures for gjelder the corresponding
BN Boligkreditt AS interim report 2nd quarter
 BN Boligkreditt AS interim report 2nd quarter 2010 Content Report of the Directors...3 Financial Ratios...5 Income Statement... 6 Balance Sheet...7 Change in Equity... 8 Cash Flow Statement... 9 Notes...10
OP MORTGAGE BANK Stock exchange release 27 April 2016 Interim Report. OP Mortgage Bank Interim Report for January March 2016
 OP MORTGAGE BANK Stock exchange release 27 April 2016 Interim Report OP Mortgage Bank Interim Report for January March 2016 OP Mortgage Bank (OP MB) is part of OP Financial Group and its role is to raise,
Interim report Q1 2016
 Interim report Q1 2016 CONTENTS Introduction Financial development Income Expenses Loan impairment charge and loans in default Deposits, loans and balance sheet Summary and future prospects Tables 2 SPAREBANKEN
4th Quarter 2010. Risk management. General information
 4th Quarter 2010 Sør Boligkreditt AS 2 4th Quarter 2010 General information Sør Boligkreditt AS was established in the autumn of 2008 and is a wholly owned subsidiary of Sparebanken Sør. The company is
KLP BOLIGKREDITT AS Interim report Q4 2014
 KLP BOLIGKREDITT AS Interim report Q4 2014 INCOME STATEMENT BALANCE SHEET NOTES Contents Interim Financial Statements 4/2014 3 Income Statement 4 Balance Sheet 5 Statement of owners' equity 6 Statement
Words from the President and CEO 3 Financial highlights 4 Highlights 5 Export lending 5 Local government lending 6 Funding 6 Results 6 Balance sheet
 Words from the President and CEO 3 Financial highlights 4 Highlights 5 Export lending 5 Local government lending 6 Funding 6 Results 6 Balance sheet 7 Events after the balance sheet date 8 Income statement
Sparebanken Sør. 4 th quarter 2014
 Sparebanken Sør 4 th quarter 2014 Information reminder Sparebanken Pluss and Sparebanken Sør merged with effect from January 1 st 2014. Sparebanken Pluss was the acquiring bank in the merger and was renamed
How To Understand The Financial State Of Klp Boligkreditt
 KLP BOLIGKREDITT AS Interim report Q1 2015 INCOME STATEMENT BALANCE SHEET NOTES Contents Interim Financial Statements 1/2015 3 Income Statement 4 Balance Sheet 5 Statement of owners' equity 6 Statement
KLP BOLIGKREDITT AS Interim report Q4 2015
 KLP BOLIGKREDITT AS Interim report Q4 2015 INCOME STATEMENT BALANCE SHEET NOTES Contents KLP Boligkreditt AS Report from the Board of directors 3 Income statement 4 Balance sheet 5 Statement of changes
Quarterly Report as of 30 June 2001
 Quarterly Report as of 30 June 2001 SpareBank 1 SR-Bank focus on investment pays off Group profit of NOK 244 million before tax Substantial growth in net new sales of Odin funds 44,000 customers save in
Equity per share (NOK) 147 123 131 Equity ratio 39 % 38 % 36 % Non-current net asset value per share (NOK) (EPRA NNNAV) 2) 184 152 165
 147 123 131 Equity ratio 39 % 38 % 36 % Non-current net asset value per share (NOK) (EPRA NNNAV) 2) 184 152 165") REPORT FOR Q2 AND THE FIRST 6 MONTHS OF 2015 KEY FIGURES Amounts in NOK million Q2 2015 Q2 2014 30.06.15 30.06.14 2014 Net rental income 501 450 1 005 904 1 883 Fair value adjustments in investment properties
REPORT FOR Q2 AND THE FIRST 6 MONTHS OF 2015 KEY FIGURES Amounts in NOK million Q2 2015 Q2 2014 30.06.15 30.06.14 2014 Net rental income 501 450 1 005 904 1 883 Fair value adjustments in investment properties
First half-year report 2013 2
 Financial highlights... 3 Comments from the president and CEO 4 Report from the board of directors. 4 Results 4 Balance sheet. 6 Export lending... 6 Local government lending... 6 Securities.. 6 Funding....
INTERIM REPORT. Q1 2015 (unaudited)
") INTERIM REPORT Q1 2015 (unaudited) Key figures FIGURES IN NOK 000s INCOME STATEMENT Profit/loss after taxation 29 446 32 079 112 243 Net interest margin 1,53 % 1,81 % 1,64 % Profit/loss after tax as a
INTERIM REPORT Q1 2015 (unaudited) Key figures FIGURES IN NOK 000s INCOME STATEMENT Profit/loss after taxation 29 446 32 079 112 243 Net interest margin 1,53 % 1,81 % 1,64 % Profit/loss after tax as a
Equity per share (NOK) 135 123 131 Equity ratio 37 % 39 % 36 % Non-current net asset value per share (NOK) (EPRA NNNAV) 2) 170 153 165
 135 123 131 Equity ratio 37 % 39 % 36 % Non-current net asset value per share (NOK) (EPRA NNNAV) 2) 170 153 165") REPORT Q1/2015 KEY FIGURES Amounts in NOK million Q1 2015 Q1 2014 31.12.14 Net rental income 503 454 1 883 Fair value adjustments in investment properties and interest rate derivatives 1 294-9 281 Profit
REPORT Q1/2015 KEY FIGURES Amounts in NOK million Q1 2015 Q1 2014 31.12.14 Net rental income 503 454 1 883 Fair value adjustments in investment properties and interest rate derivatives 1 294-9 281 Profit
Interim Report Q2 2011
 Interim Report Q2 2011 Income statement, Financial position statement and Notes -760906 KLP KOMMUNEKREDITT AS INTERIM FINANCIAL STATEMENT 2/2011 PURPOSE AND OWNERSHIP. The Company's purpose is long-term
DNB The Norwegian bank
 DNB The Norwegian bank New York, Deutsche Bank 22 May 2012 CFO Bjørn Erik Næss Agenda DNB - Q1 results DNB drivers for successful banking 2 Agenda Q1 results DNB drivers for successful banking 3 Profit
Cover photo: Sturlason
 Financial highlights 03 Report from the board of directors 04 Results 04 Balance sheet 05 Lending 05 Securities 05 Liquidity 06 Prospects for the second half-year of 2016 07 Events after the balance sheet
IBM Finans Norge AS. Condensed Interim Financial Statements. 30 September 2014
 Condensed Interim Financial Statements Condensed Interim Financial Statements For the Quarter Ended Contents Page Condensed Interim Statement of Comprehensive Income 2 Condensed Interim Statement of Financial
About Komplett Bank ASA. Outlook. Developments to date
 Interim report 4th quarter 2015 About Komplett Bank ASA Komplett Bank ASA started banking operations on 21 March 2014 when the company received its banking licence from the Norwegian authorities. Komplett
How To Understand And Understand Dnb Nor Group
 Chief Executive Officer Rune Bjerke For further information, please contact Tom Grøndahl, Chief Financial Officer tom.grondahl@dnbnor.no +47 2248 2922 Halfdan Bakøy, Head of Group Financial Reporting halfdan.bakoy@dnbnor.no
Q2 2012. First half 2012
 Q2 2012 Profit before tax: NOK 405 million (NOK 416 million) Profit after tax: NOK 303 million (NOK 305 million) Return on equity after tax: 11.8 % (12.6 %) Profit per share: NOK 1.19 (NOK 1.51) Net interest
18,343 18,308 3 Accumulated other comprehensive income (and other reserves)
") The information in this report is prepared quarterly based on the ADI financial records. The financial records are not audited for the Quarters ended 30 September, 31 December and 31 March. The report
The information in this report is prepared quarterly based on the ADI financial records. The financial records are not audited for the Quarters ended 30 September, 31 December and 31 March. The report
Investor Relations. Supplementary Information for Investors and Analysts 2007 Third Quarter Results. (Unaudited)
") Investor Relations Supplementary Information for Investors and Analysts 2007 Third Quarter Results (Unaudited) Group Chief Executive Rune Bjerke For further information, please contact Tom Grøndahl, Deputy
Investor Relations Supplementary Information for Investors and Analysts 2007 Third Quarter Results (Unaudited) Group Chief Executive Rune Bjerke For further information, please contact Tom Grøndahl, Deputy
Overview Q1 2009 YTD 09 YTD 08 -35 37. Core income in DKK million. Cost and expenses in DKK million 399 343
 Q1 29 Satisfactory growth in earnings before impairment - impairment of loans and advances and contributions to sectortargeted solutions slice pre-tax profits to DKK 49 million 29 April 29 Overview Q1
Q1 2012. Net commission and other income Net commission and other income were NOK 302 million (NOK 281 million) for Q1 2012.
 for Q1 2012.") Page 1 Q1 2012 Profit before tax: NOK 393 million (NOK 336 million) Profit after tax: NOK 316 million (NOK 265 million) Return on equity after tax: 12.9% (11.2%) Profit per share: NOK 1.58 (NOK 1.32) Net
Page 1 Q1 2012 Profit before tax: NOK 393 million (NOK 336 million) Profit after tax: NOK 316 million (NOK 265 million) Return on equity after tax: 12.9% (11.2%) Profit per share: NOK 1.58 (NOK 1.32) Net
When the going get tough...
 When the going get tough... Fondsfinans Research Sparebank 1 SR Bank 2Q15 Update Recommendation: BUY Target NOK 62 13 August 2015 Prepared by Analyst: Geir Kristiansen, Fondsfinans AS, tel: 23 11 30 11,
sparebanken SØR Growth Net interest Commission income Costs RESULTS Reduced losses Q4 AND PRELIMINARY 2012
 sparebanken SØR @ Growth Net interest Commission income RESULTS Q4 AND PRELIMINARY 2012 % Costs Reduced losses 1 Sparebanken SØR 1825 Sparebanken Sør hasits origin from 1825, when Arendal Sparebank was
Norwegian Finans Holding ASA. Third quarter 2014 results
 Norwegian Finans Holding ASA Third quarter 2014 results Third quarter 2014 earnings were 94.1 MNOK, compared with 82.1 MNOK in the second quarter Norwegian Finans Holding Group MNOK Q3 2014 Q2 2014 Change
SpareBank 1 Nord-Norge
 SpareBank 1 Nord-Norge Presentation of 3rd Quarter Report 2011 Oslo, 26 October 2011 1 1 SpareBank 1 Nord-Norge Group Headoffice: Organization: Regional branches: Tromsø 5 regions Hammerfest Tromsø Harstad
INTERIM REPORT Q3 2015
 INTERIM REPORT Q3 2015 Key figures FIGURES IN NOK 000s INCOME STATEMENT Profit/loss after taxation 75 343 85 221 112 243 Net interest margin 1,37 % 1,68 % 1,64 % Profit/loss after tax as a % of average
SpareBank 1 Boligkreditt AS Preliminary Annual Accounts, 2015 Contents
 Preliminary Annual Accounts, 2015 Contents Income Statement Statment of Comprehensive Income Balance Sheet Change in Equity Cash Flow Statement Quarterly Development Preliminary statement Income statement
Second quarter report 2008
 Second quarter report 2008 ya Bank og Forsikring Development in results and financial position ya Bank ya Bank received 17,600 new applications for various banking products during the second quarter 2008.
Quarterly Report. Financial statement Q1 2015. www.snn.no
 Quarterly Report Financial statement Q1 2015 www.snn.no Interim report for the first quarter of 2015 Group (Figures in brackets are for the same period in 2014) Highlights: Profit before tax: NOK 356 million
Annual Report 2010. SpareBank 1 Gruppen
 1 Annual Report 2010 SpareBank 1 Gruppen 2 SpareBank 1 Gruppen Content Board of Directors' Report for 2010 3 Income statement 18 Statement of comprehensive income 19 Consolidated balance sheet 20 Consolidated