Laserscanning experiments and experiences in Norway. Håvard Tveite NOF & UMB Jan R. Lien UiB
|
|
|
- Anissa Cross
- 7 years ago
- Views:
Transcription


1 Laserscanning experiments and experiences in Norway Håvard Tveite NOF & UMB Jan R. Lien UiB 1

2 Experiences WOC 2010, Trondheim Special purpose laser scanning by Terratec Contours only 1.25 meter contour interval optimised smoothing NOF Map meeting, Bergen 2008 Tests in cooperation with Blom Raw laser data from a GEOVEKST project Testing of contour interval (1m, 1.25m and 5m) Testing of other products (vegetation height, reflection intensity, shaded relief, ortophoto) 2
 Testing of other products (vegetation height, reflection intensity, shaded")
3 Orienteering basemaps in Norway Special purpose photogrammetry dominant since the early 1960ies A number of very competent companies/persons Source of imagery: From archives or by paying for an air photo mission Costs: Reasonable, considering the savings in field work 2000-: Transition to digital photogrammetry 3

4 Public mapping in Norway Norge Digitalt Sharing of geographical information within the public sector (including some utility companies) GEOVEKST - Cooperation on mapping Coordination of projects among several governmental agencies and local government to maximise the amount of mapping 4

5 Laser scanning in Norway Most new mapping projects (public and private) apply laser scanning Two Norwegian companies do laser scanning (data capture and processing) Blom Terratec 5
 Blom")
6 How can orienteering benefit? Become a member of Norge Digitalt Participate in GEOVEKST projects Get access to standard products Influence projects Specify standard products for orienteering basemaps Buy/get raw data or standard datasets from Norge Digitalt 6

7 WOC 2010 Laserscanning data used for contours only 1.25 meter contour interval - Terratac Contours: extremely accurate - forest or not Contours: help identify ditches and cliffs Digital photogrammetry for the rest Boundaries, paths, buildings, water features, etc. Challenge for the mapper: Avoid excessive use of form lines!! Redraw (smooth and adjust) all contours 7

8 Bergen 2008 Test more «products» from laser scanning Cooperation with Blom (data processing) Data from a traditional mapping project Norwegian west coast terrain Contours Contour interval, smoothing Other products derivable from raw data Usefulness for orienteering mapping 8

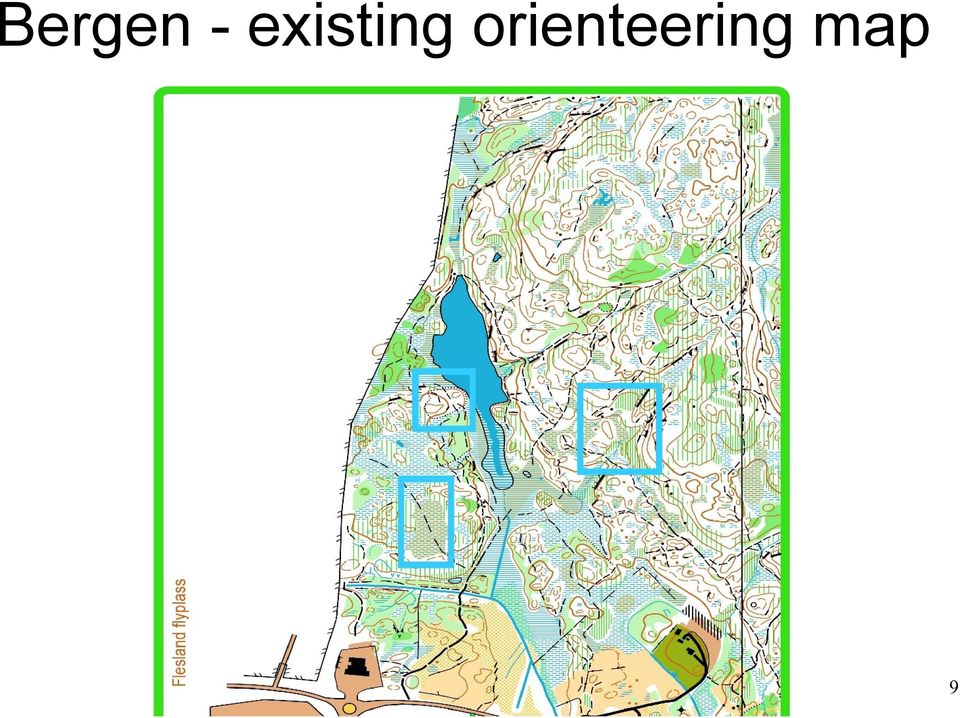
9 Bergen - existing orienteering map 9
10 The Bergen experiment Contours 1 meter 1.25 meter Standard product in Norway (FKB) Could be suitable for orienteering maps 5 meter Standard product for rural areas of Norway (FKB) Some more smoothing? 10
 Some more")
11 The Bergen experiment Ortophoto Colour raster image (geo-referenced) 0.1 meter resolution 11
 0.")
12 «Raw data» from laser scanning The LAS format Points X, Y and Elevation Intensity of the return signal Return number: 1, 2,... up to 5 (version 1.2) Number of returns for this pulse Classification (unclassified, ground, water, building, low vegetation,...)... Open Source library available (liblas) 12
.")
13 The Bergen experiment Vegetation height The difference between the first and last reflection is an indication of vegetation height A raster map was produced pixel size 0.5 meters Grayscale - White: 0 meters; Black: >= 10 meters A mistake was made in the data processing, so areas of 0 meter height were coded as black! - Fixed later 13

 Pine")

14 Vegetation height - examples Spruce (quite dense) Pine (scattered) White: No vegetation Lightest gray: very low Black: >=10 m 14

15 Vegetation height Partly wooded marsh Direction of photography The birch trees on the marsh do not seem to be properly reproduced

16 The Bergen Experiment Intensity The raw data from laser scanning contains reflected intensity values A raster map of intensity was made Grayscale White: Low intensity Black: High intensity Pixel size 0.5 meter 16

.")
17 Intensity - examples Intensity (near infrared): Light surfaces have higher reflectance (white paint high, ashpalt low). Sensitive to orientation (water - angle, waves). Black: No reflection data from the ground Darkest gray: very low White: very high 17

18 Shaded relief Intuitive visualisation of terrain models Simulation of shadow from "the sun" "Sun" (light source) traditionally in the north-west (top left) Raster Black to white The more exposed to the "sun" - the lighter the pixel The more in the "shadows" - the darker the pixel 18

19 The Bergen Experiment Shaded relief Raster map of shaded relief Grayscale Pixel size 0.5 meter Uneven ground in this terrain Paths did not show up Ditches showed up Some small structures could be detected Of questionable utility? 19


20 Shaded relief - examples Light source - NE 20

21 Usefulness of derived products in the forest When using paper/plastic in the forest Not very useful the base map gets too dark Need very large scale base map to get details Could be used for reference (separate) When using a computer in the forest Background could be switched quickly Zooming is possible (to see details) Intensity/transparency could be adjusted All sources of information could be valuable! 21
22 Terrain model - Vegetation artifacts Willow thicket (Salix) Small knoll? The low willow thicket appears as a small knoll
23 The white area in the circle is covered by junipers which do not show up in the vegetation map Vegetation artifacts Juniper nor in the relief map Juniper 23
24 How does tall spruce influence the laser contours? Picture taken from the north showing a spruce grove Direction of photography terrace The terrace is clearly reproduced
25 Contours - open pine forest Direction of photography The 2 m high knoll in an area with minimal ground vegetation is well reproduced 25
26 Software and formats Coordinates were UTM 32 / Euref89 Blom delivered contours as layered DXF imagery as geotiff OCAD was used to integrate the material start with contours and imagery (same coord.sys.) fit the scanned version of the old map 26
27 To do Investigate smoothing levels for contours (considering sampling frequency?) Vegetation boundaries from the raw data? Features from the raw data 27
High Resolution RF Analysis: The Benefits of Lidar Terrain & Clutter Datasets
 0 High Resolution RF Analysis: The Benefits of Lidar Terrain & Clutter Datasets January 15, 2014 Martin Rais 1 High Resolution Terrain & Clutter Datasets: Why Lidar? There are myriad methods, techniques
Creating Slope-Enhanced Shaded-Relief Using Global Mapper
 Creating Slope-Enhanced Shaded-Relief Using Global Mapper Kent D. Brown Utah Geological Survey Introduction The purpose of this document is to demonstrate that slope-enhanced hillshade, or shaded-relief
Image Analysis CHAPTER 16 16.1 ANALYSIS PROCEDURES
 CHAPTER 16 Image Analysis 16.1 ANALYSIS PROCEDURES Studies for various disciplines require different technical approaches, but there is a generalized pattern for geology, soils, range, wetlands, archeology,
Data source, type, and file naming convention
 Exercise 1: Basic visualization of LiDAR Digital Elevation Models using ArcGIS Introduction This exercise covers activities associated with basic visualization of LiDAR Digital Elevation Models using ArcGIS.
Files Used in this Tutorial
 Generate Point Clouds Tutorial This tutorial shows how to generate point clouds from IKONOS satellite stereo imagery. You will view the point clouds in the ENVI LiDAR Viewer. The estimated time to complete
Create a folder on your network drive called DEM. This is where data for the first part of this lesson will be stored.
 In this lesson you will create a Digital Elevation Model (DEM). A DEM is a gridded array of elevations. In its raw form it is an ASCII, or text, file. First, you will interpolate elevations on a topographic
Institute of Natural Resources Departament of General Geology and Land use planning Work with a MAPS
 Institute of Natural Resources Departament of General Geology and Land use planning Work with a MAPS Lecturers: Berchuk V.Y. Gutareva N.Y. Contents: 1. Qgis; 2. General information; 3. Qgis desktop; 4.
Converting GIS Datasets into CAD Format
 Ball State University Libraries GIS Research and Map Collection Converting GIS Datasets into CAD Format Author: Angela Gibson, 6/13/2014 Overview: One of the most common requests from students is for GIS
International Specification for Ski Orienteering Maps ISSkiOM
 International Specification for Ski Orienteering Maps ISSkiOM Rev 12 February 2015 corrected mistake (PMS 345-> PMS 354), page 3 2014 Approved by IOF Ski Orienteering Commission, October 2014 Approved
Automatic orienteering map generation: Using Karttapullautin for Norwegian map data. Jan Kocbach
 Automatic orienteering map generation: Using Karttapullautin for Norwegian map data Jan Kocbach Motivation (1) Identify areas for making new orienteering maps Karttapullautin maps are good enough for realistic
NEW DIGITAL TERRAIN MODELING (DTM) TOOLS FOR CABLE ROUTE PLANNING by Dr. Jose M. Andres Makai Ocean Engineering Inc.
 TOOLS FOR CABLE ROUTE PLANNING by Dr. Jose M. Andres Makai Ocean Engineering Inc.") NEW DIGITAL TERRAIN MODELING (DTM) TOOLS FOR CABLE ROUTE PLANNING by Dr. Jose M. Andres Makai Ocean Engineering Inc. EXISTING CABLE ROUTE PLANNING TOOLS In recent years, methods used for submarine cable
NEW DIGITAL TERRAIN MODELING (DTM) TOOLS FOR CABLE ROUTE PLANNING by Dr. Jose M. Andres Makai Ocean Engineering Inc. EXISTING CABLE ROUTE PLANNING TOOLS In recent years, methods used for submarine cable
Introduction to Imagery and Raster Data in ArcGIS
 Esri International User Conference San Diego, California Technical Workshops July 25, 2012 Introduction to Imagery and Raster Data in ArcGIS Simon Woo slides Cody Benkelman - demos Overview of Presentation
The Production of Orienteering Maps in Austria
 The Production of Orienteering Maps in Austria Ditz Robert Institute for Military Geography, Federal Ministry of Defence and Sports, Austria Abstract. Due to changing technologies in collecting data, the
Investigation 6: What happens when plates collide?
 Tectonics Investigation 6: Teacher Guide Investigation 6: What happens when plates collide? In this activity, students will use the distribution of earthquakes and volcanoes in a Web GIS to learn about
MASKS & CHANNELS WORKING WITH MASKS AND CHANNELS
 MASKS & CHANNELS WORKING WITH MASKS AND CHANNELS Masks let you isolate and protect parts of an image. When you create a mask from a selection, the area not selected is masked or protected from editing.
Coastal Engineering Indices to Inform Regional Management
 Coastal Engineering Indices to Inform Regional Management Lauren Dunkin FSBPA 14 February 2013 Outline Program overview Standard products Coastal Engineering Index Conclusion and future work US Army Corps
Advanced Image Management using the Mosaic Dataset
 Esri International User Conference San Diego, California Technical Workshops July 25, 2012 Advanced Image Management using the Mosaic Dataset Vinay Viswambharan, Mike Muller Agenda ArcGIS Image Management
GEOGRAPHIC INFORMATION SYSTEMS CERTIFICATION
 GEOGRAPHIC INFORMATION SYSTEMS CERTIFICATION GIS Syllabus - Version 1.2 January 2007 Copyright AICA-CEPIS 2009 1 Version 1 January 2007 GIS Certification Programme 1. Target The GIS certification is aimed
LIDAR and Digital Elevation Data
 LIDAR and Digital Elevation Data Light Detection and Ranging (LIDAR) is being used by the North Carolina Floodplain Mapping Program to generate digital elevation data. These highly accurate topographic
Kotylo (2002) specifies the possible data basis for an orienteering map with the pros and the cons as follows:
 specifies the possible data basis for an orienteering map with the pros and the cons as follows:") APPLYING LASER SCANNING AS A BASIS FOR DERIVING ORIENTEERING MAPS OF VIENNA Ditz Robert, Gartner Georg Institute of Military Geography, Ministry of Defence, Austria Institute of Geoinformation and Cartography,
APPLYING LASER SCANNING AS A BASIS FOR DERIVING ORIENTEERING MAPS OF VIENNA Ditz Robert, Gartner Georg Institute of Military Geography, Ministry of Defence, Austria Institute of Geoinformation and Cartography,
Inventory Enhancements
 Inventory Enhancements Chapter 6 - Vegetation Inventory Standards and Data Model Documents Resource Information Management Branch, Table of Contents 1. DETECTION OF CONIFEROUS UNDERSTOREY UNDER DECIDUOUS
Image Draping & navigation within Virtual GIS
 Image Draping & navigation within Virtual GIS Draping of Geo Corrected data such as aerial imagery or map data enables virtual 3D field tours to be conducted in an area of interest. This document covers
Adaptation of High Resolution Ikonos Images to Googleearth for Zonguldak Test Field
 Adaptation of High Resolution Ikonos Images to Googleearth for Zonguldak Test Field Umut G. SEFERCIK, Murat ORUC and Mehmet ALKAN, Turkey Key words: Image Processing, Information Content, Image Understanding,
Photogrammetric Point Clouds
 Photogrammetric Point Clouds Origins of digital point clouds: Basics have been around since the 1980s. Images had to be referenced to one another. The user had to specify either where the camera was in
Raster Tutorial. Copyright 1995-2010 Esri All rights reserved.
 Copyright 1995-2010 Esri All rights reserved. Table of Contents Introduction to the ArcGIS raster tutorial......................... 3 Exercise 1: Creating a mosaic dataset.......................... 4 Exercise
Key words: Laser Scanning, LIDAR, Surveying and Mapping, Point Cloud, Geospatial software
 Volume 5, Issue 5, May 2015 ISSN: 2277 128X International Journal of Advanced Research in Computer Science and Software Engineering Research Paper Available online at: www.ijarcsse.com Comparative Study
Understanding Raster Data
 Introduction The following document is intended to provide a basic understanding of raster data. Raster data layers (commonly referred to as grids) are the essential data layers used in all tools developed
Investigating World Development with a GIS
 Investigating World Development with a GIS Economic and human development is not consistent across the world. Some countries have developed more quickly than others and we call these countries MEDCs (More
Digital Orthophoto Production In the Desktop Environment 1
 Digital Orthophoto Production In the Desktop Environment 1 By Dr. Roy A. Welch and Thomas R. Jordan Digital orthophotos are proving suitable for a variety of mapping, GIS and environmental monitoring tasks.
FOREST PARAMETER ESTIMATION BY LIDAR DATA PROCESSING
 P.-F. Mursa Forest parameter estimation by LIDAR data processing FOREST PARAMETER ESTIMATION BY LIDAR DATA PROCESSING Paula-Florina MURSA, Master Student Military Technical Academy, paula.mursa@gmail.com
The Application of Land Use/ Land Cover (Clutter) Data to Wireless Communication System Design
 Data to Wireless Communication System Design") Technology White Paper The Application of Land Use/ Land Cover (Clutter) Data to Wireless Communication System Design The Power of Planning 1 Harry Anderson, Ted Hicks, Jody Kirtner EDX Wireless, LLC Eugene,
Technology White Paper The Application of Land Use/ Land Cover (Clutter) Data to Wireless Communication System Design The Power of Planning 1 Harry Anderson, Ted Hicks, Jody Kirtner EDX Wireless, LLC Eugene,
Stanfords For Business. Price List. Stanfords For Business Price List - 1 -
 - 1 - Stanfords For Business Price List Stanfords Digital 29 Corn Street, BS1 1HT CONTENTS - Stanfords For Business Price List - 2 - OS Master Map in dxf/ dwg/ shp format 3 Planning Application Maps 4
ArcGIS. Image Server tutorial
 ArcGIS 9 ArcGIS Image Server tutorial Copyright 2006, 2007, and 2008 Zanja Technologies, Inc. All rights reserved. The information contained in this work is the property of Zanja Technologies, Inc., under
Remote Sensing Method in Implementing REDD+
 Remote Sensing Method in Implementing REDD+ FRIM-FFPRI Research on Development of Carbon Monitoring Methodology for REDD+ in Malaysia Remote Sensing Component Mohd Azahari Faidi, Hamdan Omar, Khali Aziz
GEOENGINE MSc in Geomatics Engineering (Master Thesis) Anamelechi, Falasy Ebere
 Anamelechi, Falasy Ebere") Master s Thesis: ANAMELECHI, FALASY EBERE Analysis of a Raster DEM Creation for a Farm Management Information System based on GNSS and Total Station Coordinates Duration of the Thesis: 6 Months Completion
Master s Thesis: ANAMELECHI, FALASY EBERE Analysis of a Raster DEM Creation for a Farm Management Information System based on GNSS and Total Station Coordinates Duration of the Thesis: 6 Months Completion
Design document Goal Technology Description
 Design document Goal OpenOrienteering Mapper is a program to draw orienteering maps. It helps both in the surveying and the following final drawing task. Support for course setting is not a priority because
Review for Introduction to Remote Sensing: Science Concepts and Technology
 Review for Introduction to Remote Sensing: Science Concepts and Technology Ann Johnson Associate Director ann@baremt.com Funded by National Science Foundation Advanced Technological Education program [DUE
MULTIPURPOSE USE OF ORTHOPHOTO MAPS FORMING BASIS TO DIGITAL CADASTRE DATA AND THE VISION OF THE GENERAL DIRECTORATE OF LAND REGISTRY AND CADASTRE
 MULTIPURPOSE USE OF ORTHOPHOTO MAPS FORMING BASIS TO DIGITAL CADASTRE DATA AND THE VISION OF THE GENERAL DIRECTORATE OF LAND REGISTRY AND CADASTRE E.ÖZER, H.TUNA, F.Ç.ACAR, B.ERKEK, S.BAKICI General Directorate
3 hours One paper 70 Marks. Areas of Learning Theory
 GRAPHIC DESIGN CODE NO. 071 Class XII DESIGN OF THE QUESTION PAPER 3 hours One paper 70 Marks Section-wise Weightage of the Theory Areas of Learning Theory Section A (Reader) Section B Application of Design
3D Model of the City Using LiDAR and Visualization of Flood in Three-Dimension
 3D Model of the City Using LiDAR and Visualization of Flood in Three-Dimension R.Queen Suraajini, Department of Civil Engineering, College of Engineering Guindy, Anna University, India, suraa12@gmail.com
MAP ANIMATIONS FOR VISUALIZING ORIENTEERING COMPETITIONS
 CO-010 MAP ANIMATIONS FOR VISUALIZING ORIENTEERING COMPETITIONS MIDTBø T., HAVERSTAD S.J. Norwegian University of Science and Technology, TRONDHEIM, NORWAY ABSTRACT This paper gives an overview over methods
GIS DATA CAPTURE APPLICATIONS MANDLI COMMUNICATIONS http://www.mandli.com
 GIS DATA CAPTURE APPLICATIONS MANDLI COMMUNICATIONS http://www.mandli.com Mandli Communications is a leader in specialized digital imaging equipment. Since 1983, the company has produced a range of imaging,
Using Optech LMS to Calibrate Survey Data Without Ground Control Points
 Challenge An Optech client conducted an airborne lidar survey over a sparsely developed river valley. The data processors were finding that the data acquired in this survey was particularly difficult to
Opportunities for the generation of high resolution digital elevation models based on small format aerial photography
 Opportunities for the generation of high resolution digital elevation models based on small format aerial photography Boudewijn van Leeuwen 1, József Szatmári 1, Zalán Tobak 1, Csaba Németh 1, Gábor Hauberger
LiDAR Point Cloud Processing with
 LiDAR Research Group, Uni Innsbruck LiDAR Point Cloud Processing with SAGA Volker Wichmann Wichmann, V.; Conrad, O.; Jochem, A.: GIS. In: Hamburger Beiträge zur Physischen Geographie und Landschaftsökologie
Digital Classification and Mapping of Urban Tree Cover: City of Minneapolis
 Digital Classification and Mapping of Urban Tree Cover: City of Minneapolis FINAL REPORT April 12, 2011 Marvin Bauer, Donald Kilberg, Molly Martin and Zecharya Tagar Remote Sensing and Geospatial Analysis
AERIAL PHOTOGRAPHS. For a map of this information, in paper or digital format, contact the Tompkins County Planning Department.
 AERIAL PHOTOGRAPHS What are Aerial Photographs? Aerial photographs are images of the land taken from an airplane and printed on 9 x9 photographic paper. Why are Aerial Photographs Important? Aerial photographs
How To Make An Orthophoto
 ISSUE 2 SEPTEMBER 2014 TSA Endorsed by: CLIENT GUIDE TO DIGITAL ORTHO- PHOTOGRAPHY The Survey Association s Client Guides are primarily aimed at other professionals such as engineers, architects, planners
Introduction to GIS (Basics, Data, Analysis) & Case Studies. 13 th May 2004. Content. What is GIS?
 & Case Studies. 13 th May 2004. Content. What is GIS?") Introduction to GIS (Basics, Data, Analysis) & Case Studies 13 th May 2004 Content Introduction to GIS Data concepts Data input Analysis Applications selected examples What is GIS? Geographic Information
Introduction to GIS (Basics, Data, Analysis) & Case Studies 13 th May 2004 Content Introduction to GIS Data concepts Data input Analysis Applications selected examples What is GIS? Geographic Information
3D VISUALIZATION OF GEOTHERMAL WELLS DIRECTIONAL SURVEYS AND INTEGRATION WITH DIGITAL ELEVATION MODEL (DEM)
") Presented at Short Course VII on Exploration for Geothermal Resources, organized by UNU-GTP, GDC and KenGen, at Lake Bogoria and Lake Naivasha, Kenya, Oct. 27 Nov. 18, 2012. GEOTHERMAL TRAINING PROGRAMME
Presented at Short Course VII on Exploration for Geothermal Resources, organized by UNU-GTP, GDC and KenGen, at Lake Bogoria and Lake Naivasha, Kenya, Oct. 27 Nov. 18, 2012. GEOTHERMAL TRAINING PROGRAMME
OCAD more than just only a o-mapping software
 OCAD more than just only a o-mapping software IOF ITC Open Meeting, WOC 2014, Lavarone Positioning of OCAD. Import and Export of Geodata Geodata Capture (GPS) Course Setting Desktop Publishing (DTP) Specific
Future Landscapes. Research report CONTENTS. June 2005
 Future Landscapes Research report June 2005 CONTENTS 1. Introduction 2. Original ideas for the project 3. The Future Landscapes prototype 4. Early usability trials 5. Reflections on first phases of development
Forest Service Southern Region Jess Clark & Kevin Megown USFS Remote Sensing Applications Center (RSAC)
") Hurricane Katrina Damage Assessment on Lands Managed by the Desoto National Forest using Multi-Temporal Landsat TM Imagery and High Resolution Aerial Photography Renee Jacokes-Mancini Forest Service Southern
Hurricane Katrina Damage Assessment on Lands Managed by the Desoto National Forest using Multi-Temporal Landsat TM Imagery and High Resolution Aerial Photography Renee Jacokes-Mancini Forest Service Southern
Digital Terrain Model Grid Width 10 m DGM10
 Digital Terrain Model Grid Width 10 m Status of documentation: 23.02.2015 Seite 1 Contents page 1 Overview of dataset 3 2 Description of the dataset contents 4 3 Data volume 4 4 Description of the data
RESOLUTION MERGE OF 1:35.000 SCALE AERIAL PHOTOGRAPHS WITH LANDSAT 7 ETM IMAGERY
 RESOLUTION MERGE OF 1:35.000 SCALE AERIAL PHOTOGRAPHS WITH LANDSAT 7 ETM IMAGERY M. Erdogan, H.H. Maras, A. Yilmaz, Ö.T. Özerbil General Command of Mapping 06100 Dikimevi, Ankara, TURKEY - (mustafa.erdogan;
Computer Vision: Machine Vision Filters. Computer Vision. Optical Filters. 25 August 2014
 Computer Vision Optical Filters 25 August 2014 Copyright 2001 2014 by NHL Hogeschool, Van de Loosdrecht Machine Vision BV and Klaas Dijkstra All rights reserved j.van.de.loosdrecht@nhl.nl, jaap@vdlmv.nl,
AN INVESTIGATION OF THE GROWTH TYPES OF VEGETATION IN THE BÜKK MOUNTAINS BY THE COMPARISON OF DIGITAL SURFACE MODELS Z. ZBORAY AND E.
 ACTA CLIMATOLOGICA ET CHOROLOGICA Universitatis Szegediensis, Tom. 38-39, 2005, 163-169. AN INVESTIGATION OF THE GROWTH TYPES OF VEGETATION IN THE BÜKK MOUNTAINS BY THE COMPARISON OF DIGITAL SURFACE MODELS
Point Clouds: Big Data, Simple Solutions. Mike Lane
 Point Clouds: Big Data, Simple Solutions Mike Lane Light Detection and Ranging Point Cloud is the Third Type of Data Vector Point Measurements and Contours Sparse, highly irregularly spaced X,Y,Z values
INSTRUCTIONS FOR MAKING 3D,.DWG CONTOUR LINES
 INSTRUCTIONS FOR MAKING 3D,.DWG CONTOUR LINES A TUTORIAL FROM SPATIAL AND NUMERIC DATA SERVICES NICOLE SCHOLTZ AND GEOFF IVERSON Overview... 2 A. Get a Digital Elevation Model (DEM)... 3 B. Open ArcMap,
Nature Values Screening Using Object-Based Image Analysis of Very High Resolution Remote Sensing Data
 Nature Values Screening Using Object-Based Image Analysis of Very High Resolution Remote Sensing Data Aleksi Räsänen*, Anssi Lensu, Markku Kuitunen Environmental Science and Technology Dept. of Biological
LIDAR Data visualization and the Silviculture of PervasION Data
 FUSING LIDAR DATA, PHOTOGRAPHS, AND OTHER DATA USING 2D AND 3D VISUALIZATION TECHNIQUES Robert J. McGaughey, Research Forester Ward W. Carson, Research Engineer USDA Forest Service Pacific Northwest Research
TUTORIAL - Locations & Mapping. Using the ESdat Environmental Database System. For use with ESDAT version 5
 TUTORIAL - Locations & Mapping Using the ESdat Environmental Database System For use with ESDAT version 5 (version 5 software updates available from ) Function Tutorial - Locations and Mapping Table of
STATE OF NEVADA Department of Administration Division of Human Resource Management CLASS SPECIFICATION
 STATE OF NEVADA Department of Administration Division of Human Resource Management CLASS SPECIFICATION TITLE PHOTOGRAMMETRIST/CARTOGRAPHER V 39 6.102 PHOTOGRAMMETRIST/CARTOGRAPHER II 33 6.110 PHOTOGRAMMETRIST/CARTOGRAPHER
XTC400. Recommended Smartphone App. Action Connect. Scan To download for IOS and Android
 XTC400 Recommended Smartphone App Action Connect Scan To download for IOS and Android Table of Contents Download and Install.... 3 Tutorial.... 4 Connecting... 5 Shoot.... 6 Video Mode... 6 Photo Mode....
EcoInformatics International Inc.
 1 von 10 03.08.2010 14:25 EcoInformatics International Inc. Home Services - solutions Projects Concepts Tools Links Contact EXPLORING BEAVER HABITAT AND DISTRIBUTION WITH GOOGLE EARTH: THE LONGEST BEAVER
APPLICATION OF GOOGLE EARTH FOR THE DEVELOPMENT OF BASE MAP IN THE CASE OF GISH ABBAY SEKELA, AMHARA STATE, ETHIOPIA
 APPLICATION OF GOOGLE EARTH FOR THE DEVELOPMENT OF BASE MAP IN THE CASE OF GISH ABBAY SEKELA, AMHARA STATE, ETHIOPIA Abineh Tilahun Department of Geography and environmental studies, Adigrat University,
Remote sensing is the collection of data without directly measuring the object it relies on the
 Chapter 8 Remote Sensing Chapter Overview Remote sensing is the collection of data without directly measuring the object it relies on the reflectance of natural or emitted electromagnetic radiation (EMR).
Imagery. 1:50,000 Basemap Generation From Satellite. 1 Introduction. 2 Input Data
 1:50,000 Basemap Generation From Satellite Imagery Lisbeth Heuse, Product Engineer, Image Applications Dave Hawkins, Product Manager, Image Applications MacDonald Dettwiler, 3751 Shell Road, Richmond B.C.
Questions and Answers
 AutoCAD Raster Design 2012 Questions and Answers Make the most of rasterized scanned drawings, maps, aerial photos, satellite imagery, and digital elevation models. Get more out of your raster data and
Eight Tips for Optimal Machine Vision Lighting
 Eight Tips for Optimal Machine Vision Lighting Tips for Choosing the Right Lighting for Machine Vision Applications Eight Tips for Optimal Lighting This white paper provides tips for choosing the optimal
Application of airborne remote sensing for forest data collection
 Application of airborne remote sensing for forest data collection Gatis Erins, Foran Baltic The Foran SingleTree method based on a laser system developed by the Swedish Defense Research Agency is the first
Klaus Goelker. GIMP 2.8 for Photographers. Image Editing with Open Source Software. rocky
 Klaus Goelker GIMP 2.8 for Photographers Image Editing with Open Source Software rocky Table of Contents Chapter 1 Basics 3 1.1 Preface....4 1.2 Introduction 5 1.2.1 Using GIMP 2.8 About This Book 5 1.2.2
Request for Proposals for Topographic Mapping. Issued by: Teton County GIS and Teton County Engineering Teton County, Wyoming
 Request for Proposals for Topographic Mapping Issued by: Teton County GIS and Teton County Engineering Teton County, Wyoming Proposals due: 2:00PM MDT July 1, 2015 Proposals may be delivered to: Teton
WHAT IS GIS - AN INRODUCTION
 WHAT IS GIS - AN INRODUCTION GIS DEFINITION GIS is an acronym for: Geographic Information Systems Geographic This term is used because GIS tend to deal primarily with geographic or spatial features. Information
The YellowScan system: A test on the oppida of Nages/Roque de Viou (Languedoc, France) Tristan Allouis, PhD Research and Development, L'Avion Jaune
 Tristan Allouis, PhD Research and Development, L'Avion Jaune") The YellowScan system: A test on the oppida of Nages/Roque de Viou (Languedoc, France) Tristan Allouis, PhD Research and Development, L'Avion Jaune L'Avion Jaune : Earth observation data provider UAVs
The YellowScan system: A test on the oppida of Nages/Roque de Viou (Languedoc, France) Tristan Allouis, PhD Research and Development, L'Avion Jaune L'Avion Jaune : Earth observation data provider UAVs
Organizing a class orienteering event
 Organizing a class orienteering event Orienteering is a wonderful teaching tool. It allows the teacher to illustrate many abstract ideas in concrete terms. The sport also appeals to students operating
Map World Forum Hyderabad, India Introduction: High and very high resolution space images: GIS Development
 Very high resolution satellite images - competition to aerial images Dr. Karsten Jacobsen Leibniz University Hannover, Germany jacobsen@ipi.uni-hannover.de Introduction: Very high resolution images taken
REGISTRATION OF LASER SCANNING POINT CLOUDS AND AERIAL IMAGES USING EITHER ARTIFICIAL OR NATURAL TIE FEATURES
 REGISTRATION OF LASER SCANNING POINT CLOUDS AND AERIAL IMAGES USING EITHER ARTIFICIAL OR NATURAL TIE FEATURES P. Rönnholm a, *, H. Haggrén a a Aalto University School of Engineering, Department of Real
TerraColor White Paper
 TerraColor White Paper TerraColor is a simulated true color digital earth imagery product developed by Earthstar Geographics LLC. This product was built from imagery captured by the US Landsat 7 (ETM+)
BASIC EXPOSURE APERTURES, SHUTTER SPEEDS AND PHOTO TERMINOLOGY
 BASIC EXPOSURE APERTURES, SHUTTER SPEEDS AND PHOTO TERMINOLOGY EXPOSURE Exposure is the response of a photographic emulsion to light. The emulsion is made of a material (silver) that is sensitive to light.
CARBON BALANCE IN BIOMASS OF MAIN FOREST TREE SPECIES IN POLAND
 CARBON BALANCE IN BIOMASS OF MAIN FOREST TREE SPECIES IN POLAND PAWEŁ STRZELIŃSKI Department of Forest Management Poznan University of Life Science TOMASZ ZAWIŁA-NIEDŹWIECKI Forest Research Institute in
Effects of Florida Under a 10 Meter Sea Level Rise
 Effects of Florida Under a 10 Meter Sea Level Rise Chance B. Murray Dec. 7 2009 I. Goal Assess the effects a 10 meter sea level rise would have on Florida. Mission: Determine the length of Florida s coastline
Tutorial 3 - Map Symbology in ArcGIS
 Tutorial 3 - Map Symbology in ArcGIS Introduction ArcGIS provides many ways to display and analyze map features. Although not specifically a map-making or cartographic program, ArcGIS does feature a wide
Lidar Remote Sensing for Forestry Applications
 Lidar Remote Sensing for Forestry Applications Ralph O. Dubayah* and Jason B. Drake** Department of Geography, University of Maryland, College Park, MD 0 *rdubayah@geog.umd.edu **jasdrak@geog.umd.edu 1
THREE-DIMENSIONAL MOUNTAIN MAP
 THREE-DIMENSIONAL MOUNTAIN MAP M.Sc.Dusan Petrovic Geodetic Institute of Slovenia Jamova 2 1000 Ljubljana Slovenia fax: +386 1 425 06 77 email: dusan.petrovic@geod-is.si ABSTRACT Development of computer
Water Flow in. Alex Vlachos, Valve July 28, 2010
 Water Flow in Alex Vlachos, Valve July 28, 2010 Outline Goals & Technical Constraints How Artists Create Flow Maps Flowing Normal Maps in Left 4 Dead 2 Flowing Color Maps in Portal 2 Left 4 Dead 2 Goals
The following was presented at DMT 14 (June 1-4, 2014, Newark, DE).
.") DMT 2014 The following was presented at DMT 14 (June 1-4, 2014, Newark, DE). The contents are provisional and will be superseded by a paper in the DMT 14 Proceedings. See also presentations and Proceedings
DMT 2014 The following was presented at DMT 14 (June 1-4, 2014, Newark, DE). The contents are provisional and will be superseded by a paper in the DMT 14 Proceedings. See also presentations and Proceedings
Notable near-global DEMs include
 Visualisation Developing a very high resolution DEM of South Africa by Adriaan van Niekerk, Stellenbosch University DEMs are used in many applications, including hydrology [1, 2], terrain analysis [3],
IMPERVIOUS SURFACE MAPPING UTILIZING HIGH RESOLUTION IMAGERIES. Authors: B. Acharya, K. Pomper, B. Gyawali, K. Bhattarai, T.
 IMPERVIOUS SURFACE MAPPING UTILIZING HIGH RESOLUTION IMAGERIES Authors: B. Acharya, K. Pomper, B. Gyawali, K. Bhattarai, T. Tsegaye ABSTRACT Accurate mapping of artificial or natural impervious surfaces
SHADOW Calculation of Flickering from WTGs
 Function Calculation and documentation of flickering effects in terms of hours per year during which a neighbor or an area would be exposed to flickering from nearby WTG rotors. Also maximum minutes per
Activity: Using ArcGIS Explorer
 Activity: Using ArcGIS Explorer Requirements You must have ArcGIS Explorer for this activity. Preparation: Download ArcGIS Explorer. The link below will bring you to the ESRI ArcGIS Explorer download page.
Publishing Hosted 3D Feature Layers. An Esri White Paper September 2015
 An Esri White Paper September 2015 Copyright 2015 Esri All rights reserved. Printed in the United States of America. The information contained in this document is the exclusive property of Esri. This work
Environmental Remote Sensing GEOG 2021
 Environmental Remote Sensing GEOG 2021 Lecture 4 Image classification 2 Purpose categorising data data abstraction / simplification data interpretation mapping for land cover mapping use land cover class
DELPH v3.0. seabed mapping software suite
 DELPH v3.0 seabed mapping software suite DELPH seabed mapping software suite DELPH SEISMIC, DELPH SONAR and DELPH MAG are complete software packages with dedicated acquisition, processing and interpretation
Managing Lidar (and other point cloud) Data. Lindsay Weitz Cody Benkelman
 Data. Lindsay Weitz Cody Benkelman") (and other point cloud) Data Lindsay Weitz Cody Benkelman Presentation Context What is lidar, and how does it work? Not this presentation! What can you do with lidar in ArcGIS? What does Esri recommend
(and other point cloud) Data Lindsay Weitz Cody Benkelman Presentation Context What is lidar, and how does it work? Not this presentation! What can you do with lidar in ArcGIS? What does Esri recommend
Geospatial Information for disaster risk reduction and natural resources management. Rolando Ocampo Alcántar
 Geospatial Information for disaster risk reduction and natural resources management Rolando Ocampo Alcántar Content Background Geospatial Information for Disaster Management Risk Atlas Information Exchange
How to georectify an image in ArcMap 10
 How to georectify an image in ArcMap 10 The University Library has a large collection of historical aerial photos for some North Carolina Counties ( http://www.lib.unc.edu/reference/gis/usda/index.html
Using Google Earth for Environmental Science Research
 Using Google Earth for Environmental Science Research This document is up-to-date as of August 2013. If you have any questions or additions to this material please email dan.friess@nus.edu.sg. Note: this
CITY OF SUFFOLK, VIRGINIA GIS DATA DISTRIBUTION AND PRICING POLICY
 CITY OF SUFFOLK, VIRGINIA GIS DATA DISTRIBUTION AND PRICING POLICY 1 The City of Suffolk has invested a large amount of effort into the development of a Citywide Geographic Information System (GIS). The
Objectives. Raster Data Discrete Classes. Spatial Information in Natural Resources FANR 3800. Review the raster data model
 Spatial Information in Natural Resources FANR 3800 Raster Analysis Objectives Review the raster data model Understand how raster analysis fundamentally differs from vector analysis Become familiar with