Visit Finland Visitor Survey 2014
|
|
|
- Tobias Kennedy
- 7 years ago
- Views:
Transcription

1


2 2 Visit Finland Visitor Survey 2014 Visit Finland Studies 1 Finpro, Visit Finland Helsinki 2015

3 3 Table of Contents Abstract... 5 Introduction... 6 Trips to Finland... 8 Day visitors, tourists staying overnight and transit passengers... 9 Duration of the trip Types of accommodation Purpose of the trip In Finland for the first time At least three times a year in Finland Expenditures before the trip and during the trip Expenditures per traveller per day Traveller spending breakdown on the average The primary travel destination in Finland Helsinki area Rest of Southern Finland Rest of Finland Other countries visited during the trip Visited other countries besides Finland during their trip Nordic countries Baltic countries Russia Other European countries Other, non-european countries... 28

4 4 The next travel destination Activities performed during the trip Shopping Restaurants Sightseeing Cultural sites The booking channel of the trip The tour operator's websites, on-line travel agency or other online booking sites Travel agency Hotel or the transportation company Area of residence in Russia Area of residence in China Area of residence in Japan Breakdown of gross annual income of the families of the travellers Age and gender distribution... 43

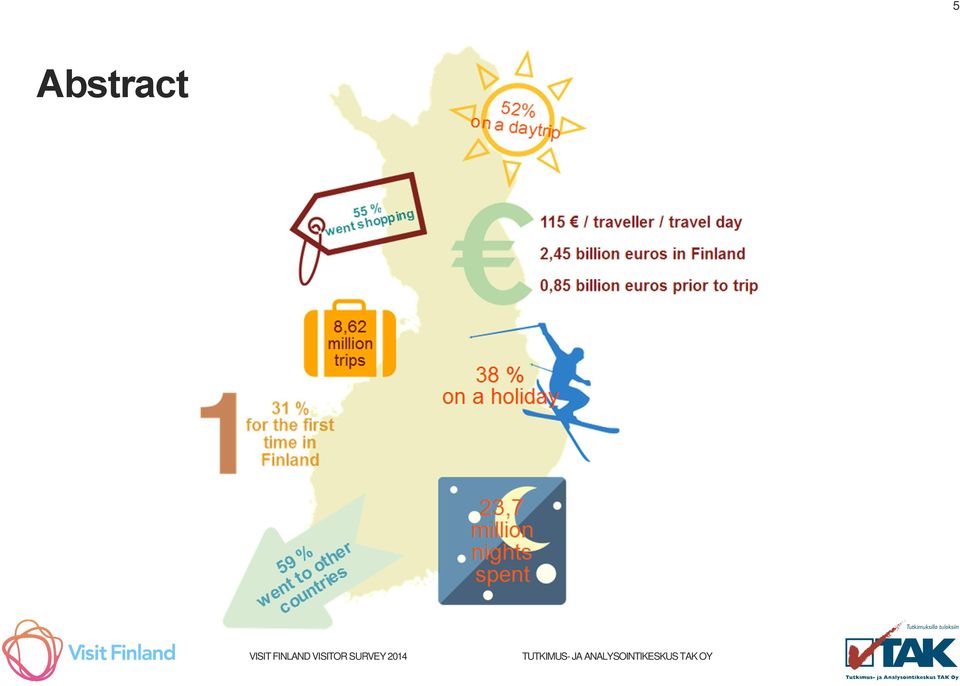
5 5 Abstract
6 6 Introduction PURPOSE OF THE SURVEY The TAK Border Survey, of which Visit Finland Visitor Survey is part of, is a continued research that started in 1997, the purpose of which is to provide information on non-resident visitors to Finland. The survey will help to identify the annual number of tourists to Finland and the amount of money left by them in Finland. In addition, the study provides information on the profiles of incoming tourists from different countries: how long do people stay in Finland, where do they stay, why do they come to Finland, how often do they come to Finland, what do they do during the trip, where do they go during the journey, what do they do in Finland, etc. CONDUCT OF THE SURVEY The survey is carried out by interviewing tourists that are more than 14-years-old, residing abroad and exiting Finland at the border stations at various days and times. The interviewees were picked by equally spaced sampling, e.g., by selecting every fifth passenger. Interview dates were selected at random. Interviews were done in Helsinki and Turku ports, at the Helsinki, Turku, Tampere, Rovaniemi and Kittilä airports, as well as at the eastern border in Vaalimaa, Nuijamaa, Vainikkala, Imatra and Niirala. At the eastern border, the heavy traffic is not taken into account, and at the ports of Helsinki, international cruise ships are ignored. Helsinki airport transit traffic is, however, included in the results. In the report, the number of trips corresponds to the number of foreign tourists who left Finland in 2014 via border stations. However, when counting the trips on the eastern border in the year 2014 and for the present, Russian citizens residing in Finland have been included. In 2014, a total of tourists exiting Finland were approached. Of these, 61% lived in Finland. Out of non-residents, 2.4% were under 15 years old, and 12.7% refused to answer, did not have time to answer or were not interviewed due to some other reason. The number of completed interviews conducted during the year was a total of Tutkimus- ja Analysointikeskus TAK Oy is responsible for practical implementation of the survey.

7 7 RELIABILITY OF THE RESULTS The results are weighted to match the actual number of passengers at airports, ports and the eastern border. As regards the Helsinki airport, the passenger volume is weighted according to the travel destination (country). In addition, the data on the eastern border has been weighted to reflect the real distributions of passenger cars, buses and minibuses (7-16 passengers). The travellers who are working in Finland or were on a work/study trip that lasted for more than three months or those who have visited Finland more than 50 times a year have been removed from the results. The countries, of which the number of residents which were interviewed during the year was less than 100, have been placed under the point other countries. The error margin of the survey results for the percentage of the entire material is up to ± 0.8 percentage points and the error margin for country-specific percentage depending on the country is up to ± percentage points. COMPARABILITY OF THE RESULTS Tilastokeskus (Statistics Finland) and Matkailun edistämiskeskus (Visit Finland) conducted Border Survey from 1998 until In the year 2013 the research was not accomplished. TAK Border Research was started in 1997, but during the first years it focused on Russians traveling in Finland. In 2014 TAK Border Research was extended to cover all nationalities. When comparing 2014 results to 2012 results, it is necessary to take into account a number of points. In 2012 Tilastokeskus also interviewed at Tornio and Karigasniemi border stations, where as in 2014 interviews were not conducted at these border stations, because of the small number of travellers. Instead, interviews were done at Imatra border station, where Tilastokeskus didn t conduct them. Almost fifth of the Russian tourists visiting Finland travel via Imatra border station. Unlike earlier, in 2014, also transit passengers were interviewed at Helsinki airport. The share of transit passengers within East Asians is large, because of Finnair s vast Asian connections. This can be seen in the results i.e. as a larger number of Japanese, Chinese and Korean tourists.

8 8 Trips to Finland thousand trips In 2014, foreign residents made a total of 8.62 million trips in Finland. The trips do not include the persons working in Finland, the persons on work/study trips lasting for more than three months and the persons who visit Finland more than 50 times during the year. Such trips amounted to a total of 1.73 million during the year.

9 9 Day visitors, tourists staying overnight and transit passengers Overnight Day Visitors Transit passengers Tuhannet thousand trips Transit passengers are day visitors who were leaving Finland through the Helsinki Airport and who reported having been in Finland only for passing through the country. Many transit passengers from Sweden and Estonia arrive in Helsinki by boat.

10 10 Duration of the trip days on average ,0 2,7 3,8 4,2 6,5 4,6 3,5 4,3 5,6 5,5 2,3 8,7 4,7 4,8 2,9 4,6 3,0 4,9 4,1 6,9 3,0 5,1 5,9 5,0 3,1 7,6 0 In 2014, non-resident tourists stayed in Finland for a total of about 23.7 million nights, of which 9.3 million nights were spent in hotels, motels (or adjacent cabins), hostels or paid campgrounds. The rest of the nights were spent at friends and relatives places as well as in apartments and cabins rented or owned by the traveller / belonging to the employer. About one in five people living in Spain spent more than a week in Finland while the trips to Finland lasting on average for over a week were made by less than every tenth tourist residing abroad.

11 11 Types of accommodation % 11% 7% 4% 23% 4% 22% 23% 6% 2% 1% 5% 9% 2% 17% 11% 3% 8% 13% 18% 18% 12% 3% 4% 2% 5% 14% 4% 6% 2% 4% 7% 3% 2% 7% 13% 5% 13% 21% 5% 6% 7% 7% 2% 7% 17% 3% 5% 8% 6% 7% 9% 22% 9% 12% 4% 1% 2% 3% 8% 7% 12% 1% 5% 2% 2% 4% 19% 22% 8% 2% 4% 4% 29% 4% 5% 1% 5% 1% 3% 4% 54% 5% 5% 3% 3% 45% 49%44% 36% 35% 33% 38%36% 44% 44% 6% 6% 38%33% 1% 4% 5% 32% 1% 26% 2% 23% 5% 25% 19% 27% 13% 13% 11% Other (incl., apartment or cabin, apartment or cabin belonging to the employer, etc.) Friends or relatives Rental cottage or apartment (from a private person, from an intermediary, through a reservation center) Youth hostel or paid campsite (tent, camper, caravan, cabin) Hotel, motel (or an adjacent cabin) Residents of the Netherlands, Denmark, Belgium and Latvia, are more often than anyone else in Finland on a business trip. Passengers arriving from these countries are also using hotel accommodation clearly more than the average.
 Friends or relatives Rental cottage or apartment (from a private person, from an intermediary, through a reservation center) Youth hostel or paid campsite (tent, camper, caravan, cabin) Hotel,")
12 12 Purpose of the trip % 8% 11% 12% 8% 6% 8% 5% 3% 4% 6% 5% 8% 5% 9% 7% 8% 5% 14% 14% 13% 13% 11% 17% 16% 22% 27% 23% 15% 26%14% 31% 18% 24% 24% 15% 45% 34% 23% 17% 13% 39% 2% 23% 17% 25% 16% 14% 19% 15% 17% 19% 68% 14% 21% 19% 24% 5% 4% 9% 41% 3% 25% 21% 5% 33% 18% 4% 32% 23% 28% 37% 27% 34% 38% 32% 38% 37% 48% 36% 24%16%47% 51% 37% 3% 35% 37% 27% 29% 31% 23%21%22% 22%18% 18% 23% 25% 22% 16% 12% 14% 9% 12% 4% 3% 5% 5% Other Transit A visit to friends or relatives Holiday trip Business trip or a trip to the congress, fair or seminar Other trips include shopping and study trips. In regard to residents of Russia, other trips comprise predominantly shopping trips.

13 13 In Finland for the first time % 75% 48% 57% 62% 88% 69% 65% 54% 28% 62% 29% 59% 45% 65% 29% 65% 58% 43% 76% 59% 14% 5% Out of the first-time visitors in Finland in 2014, three out of four (77%) live outside of the Scandinavian and the Baltic countries and outside of Russia. More than a third (38%) of these visitors from faraway countries had been in Finland earlier.

14 14 At least three times a year in Finland % 67% 45% 19% 14% 9% 22% 23% 4% 12% 3% 19% 39% 16% 28% 12% 27% 18% 38% 7% 9% 17% 7% 17% More than three-quarters of Russians visiting Finland and more than two-thirds of Estonians visited our country at least three times during the year. Also out of those living in Sweden, almost half visited Finland at least three times during A quarter of the visitors residing in Great Britain, France and Belgium visited Finland at least three times in the year.

15 15 Expenditures before the trip and during the trip M M 900 M Money spent in Finland Prior costs 800 M 700 M 600 M M 400 M 300 M 200 M M 0 M In 2014, non-resident tourists spent EUR 2.45 billion in Finland. In addition, they paid EUR 0.85 billion in advance for Finnish travel packages, accommodations, car rentals, etc. Part of this amount, however, remains with foreign travel agencies and intermediaries of travel services. Two-fifths of all the money used by foreigners in Finland was spent by passengers living in Russia.

16 16 Expenditures per traveller per day Services Shopping Travellers arriving in Finland from Russia spend EUR 119 per day on shopping. The travellers arriving from China also use a large sum - EUR 100 per day - for shopping while the travellers coming from elsewhere spend up to EUR 40 per day on shopping during their trip to Finland. The weight of shopping in the travel budget is also high in case of the travellers arriving from Estonia, Japan and South Korea, as they use half of their daily budget for shopping. The share of shopping of the tourists coming from other countries amounts up to one-third of the total spending.

17 17 Traveller spending breakdown on the average Transport 10 % Services 4 % Other 6 % Accommodation 22 % Restaurants and cafes 19 % Shopping and groceries 39 % On average, about one-fifth of the travel budget of the travellers who visited Finland in 2014, was spent on accommodation, one fifth was spent on meals, two-fifths on purchases and the remainder for transportation and other services.

18 18 The primary travel destination in Finland The picture shows the main destinations of the residents of Russia and other countries who visited Finland in The main destinations of the residents of Russia differ from those of the other passengers significantly due to the geographical location of Russia. While Russians head mainly to the eastern side of the Helsinki-Joensuu axle, other tourists mostly travel to the Helsinki-Turku-Tampere region. The northern road border stations were not included in the survey. However, interviews were conducted at Kittilä and Rovaniemi airports.

19 19 Helsinki area 10 9 Main destination the Helsinki Metropolitan Area % 71% 6 68% 59% 68% 64% 73% 55% 68% 73% 68% 67% 73% 63% 63% 75% 59% 7 81% 69% 62% 69% 65% 25% For residents of Russia, the Helsinki area was the primary destination in every fourth case, whereas for visitors arriving from other countries it was the main destination in well over half the cases.

20 20 Rest of Southern Finland 10 9 Main destination the rest of Southern Finland % 5% 6% 8% 1% 2% 5% 4% 5% 1% 4% 4% 7% 3% 5% 7% 8% 3% 3% 4% 2% 2% 2% 2% 4% With the exception of Russian residents, the rest of Southern Finland was the primary destination for less than one in ten travellers.

21 21 Rest of Finland 10 9 Main destination the rest of Finland % 18% 13% 24% 27% 24% 3% 24% 18% 25% 25% 16% 26% 18% 25% 13% 19% 16% 11% 23% 28% With the exception of South Korean residents, one to three out of ten tourists, depending on their country of residence, headed outside of Southern Finland.
22 22 Other countries visited during the trip In 2014, 59% of the tourists residing abroad and visiting Finland also visited some other country (other than their own country of residence) during their visit to Finland. A little less than a fifth of them travelled to Sweden and Estonia, a little less than one in ten travelled to Norway and Denmark, and about one in twenty travelled to Latvia and Russia. Almost one in four travelled to other European countries, and one in eight travelled outside of Europe.
23 23 Visited other countries besides Finland during their trip % 49% 63% 67% 97% 86% 67% 83% 9 97% 86% 94% 65% 61% 7 76% 67% 81% 8 81% 95% 87% 95% 96% 83% Travellers residing in China, South Korea, Singapore, Canada, Lithuania, Australia and the United States were most likely to visit another country besides Finland during their trip. From among them, at least nine out of ten visited another country during their trip. The least likely ones to visit another country during their trip to Finland were the travellers residing in Russia, Sweden, Denmark and Estonia.
24 24 Nordic countries 10 9 Visited another Nordic country besides Finland during their trip % 13% 28% 53% 22% 17% 32% 49% 25% 39% 8% 7% 13% 16% 26% 23% 6% 19% 34% 57% 46% 32% At least every second passenger residing in India, China and the US visited another Nordic country besides Finland during their trip.
25 25 Baltic countries 10 9 Visited the Baltic countries besides Finland during their trip % 6% 2% 32% 17% 21% 34% 37% 56% 44% 34% 11% 45% 13% 27% 43% 28% 42% 67% 11% 44% 41% At least every second tourist residing in Canada, Spain and the United States visited the Baltic countries during their trip.
26 26 Russia 10 9 Visited Russia besides Finland during their trip % 6% 5% 6% 3% 5% 6% 31% 5% 8% 19% 8% 1% 5% 2% 4% 1% 2% 15% 6% 4% 4% 15% The tourists living in the United States, Australia and Canada were most likely to visit Russia in connection with their trip to Finland.
27 27 Other European countries 10 9 Visited other European countries (other than the Nordic or the Baltic countries or Russia) besides Finland during their trip % 6% 35% 6% 43% 49% 8% 33% 69% 11% 66% 7% 11% 11% 14% 9% 18% 27% 36% 23% 61% 27% Other European countries were most frequently visited by the tourists residing in South Korea, Australia, Singapore, Canada, Japan and China.
28 28 Other, non-european countries 10 9 Visited a non-european country besides Finland during their trip % 31% 21% 15% 5% 19% 25% 8% 18% 27% 19% 41% 11% 34% 23% 21% 42% 25% 19% 13% 7% 13% Tourists residing in Lithuania, Poland, Denmark, Norway and Sweden were most likely to head outside Europe.
29 29 The next travel destination Russia was the next destination for two out of five travellers in Finland. The next common destinations were Estonia, Sweden, Germany and Spain. Stopover destination has been marked as the next destination for travellers who didn t have a non-stop flight.
30 30 Activities performed during the trip % 49% 32% 17% 8% 8% 7% 5% 4% 3% 3% 3% 3% 3% 3% 3% 21% The most preferred activities practiced during the trip in Finland include making purchases, visits to restaurants (food, bars and night clubs), viewing places of interest (e.g., tours, significant buildings, monuments and historical sites) and visiting cultural attractions (e.g., museums, concerts, theatre and art exhibitions).
31 31 Shopping 10 9 Went shopping during their trip % 34% 44% 38% 41% 37% 44% 36% 46% 52% 35% 33% 44% 39% 46% 36% 42% 25% 55% 42% 27% 43% 52% Russian tourists are the most enthusiastic ones to do shopping in Finland. Also, every second visitor coming from Canada, Australia, China and Japan went shopping during their trip to Finland.
32 32 Restaurants 10 9 Went to a restaurant during their trip % 49% 43% 53% 46% 41% 63% 55% 61% 26% 59% 56% 61% 54% 6 56% 57% 65% 48% 57% 71% 51% 43% 59% 58% * Restaurant = dining restaurant, bar, or nightclub Residents of the neighbouring countries, as well as tourists from the Far East, use restaurant services less frequently than travellers on average.
33 33 Sightseeing 10 9 Went sightseeing during their trip % 21% 28% 53% 64% 51% 47% 44% 63% 66% 72% 47% 25% 44% 24% 54% 48% 37% 36% 69% 56% 28% 67% 57% *Sightseeing = tours, significant buildings, monuments and historical sites, etc. Residents of the Nordic and Baltic countries are less likely to go sightseeing in Finland than tourists arriving from other countries.
34 34 Cultural sites 10 9 Visited cultural sites during their trip % 12% 26% 21% 26% 23% 32% 36% 13% 31% 34% 32% 17% 41% 11% 24% 31% 16% 6% 22% 16% 15% 32% * Cultural sites = museums, concerts, theatre and art shows, etc. Cultural sites in Finland do not seem to be particularly attractive for the tourists coming from the Nordic and Baltic countries. Likewise, the residents of South Korea or Singapore are not frequent visitors to the Finnish cultural sites.
35 The booking channel of the trip % Channels used for obtaining accommodation or travel tickets 11% 7% 23% 1% 2% 12% Accommodation and travel tickets are most often acquired through a tour operator's website, an online travel agency or other online booking sites. Over a quarter (27%) of the passengers book their trip/accommodation directly through the hotel or transport company. Travel agencies (excl. webpages) are used by a fifth of the tourists. 35 The tour operator's website or an online travel agency or other online booking site I went to tour operator s or travel agent s service point Call or to the tour operator or travel agency Hotel or transport company's own website On-site in the hotel or at the transport company's service desk Call or to the hotel or transport company Other channel (eg. the employer reserved the trip) None of these
36 36 The tour operator's websites, on-line travel agency or other online booking sites 10 9 Obtained accommodation or travel tickets online % 36% 46% 37% 24% 39% 43% 44% 33% 38% 45% 42% 48% 38% 42% 35% 34% 32% 31% 45% 26% 42% 39%
37 37 Travel agency 10 9 Obtained accommodation or travel tickets from a travel agency (excluding the website) % 21% 14% 19% 32% 46% 17% 14% 16% 18% 19% 39% 22% 16% 15% 15% 16% 14% 12% 32% 22% 17% 34% 8% 24% If not to take into account the websites of travel agencies, tourists residing in Japan, Australia, Lithuania, Latvia and China are the ones who book the majority of trips to Finland or accommodation in Finland via travel agencies.
38 38 Hotel or the transportation company 10 9 Obtained accommodation or travel tickets directly from the hotel or the transportation company % 33% 24% 25% 25% 29% 28% 19% 18% 23% 27% 35% 31% 32% 26% 16% 23% 16% 33% 22%
39 39 Area of residence in Russia Two thirds of the travellers, who visited Finland and reside in Russia, live in St. Petersburg and every tenth in the Leningrad Region. About every twentieth lives in Moscow.
40 40 Area of residence in China Tourists, who visited Finland and reside in China, 29 % live in Hong Kong, 16 % in Beijing, 13 % in Shanghai and 11 % in Chongqing. Finnair has non-stop flights to these cities from Helsinki.
41 41 Area of residence in Japan Tourists, who visited Finland and reside in Japan, about half live in Kantō, where Tokyo and Yokohama are located. Almost a quarter lives in Kansai, where Osaka and Kyoto are located, and fifth lives in Chūbu, where Nagano is located.
42 42 Breakdown of gross annual income of the families of the travellers 18% 16% 14% 12% 8% 6% 4% 2% About half (48%) of the families of the tourists living abroad who visited Finland in 2014 earn a maximum of EUR per year. Four-fifths of the families earn up to EUR
43 43 Age and gender distribution % 45% 26% 25% 11% 2% 6% Male Female Under Over 64 55% of the foreign resident tourists who visited Finland in 2014 were men, and 45% were women. Most travellers who visited Finland were 25 to 44 years of age.
44 44 Finpro, Visit Finland Porkkalankatu 1, PL 358 FI Helsinki ISBN (Electronic publication) ISSN (Electronic publication)
Norwegian Foreign Visitor Survey 2011
 Summary: Norwegian Foreign Visitor Survey 2011 TØI Report 1166/2011 Author(s): Eivind Farstad, Arne Rideng and Iratxe Landa Mata Oslo 2011, 67 pages Norwegian language In 2011 a total of 5.0 million foreign
Finns' travel to Central Europe increased in 2013
 Transport and Tourism 2014 Finnish Travel 2013 Finns' travel to Central Europe increased in 2013 According to Statistics Finland's survey, Finns made 7.8 million different leisure trips abroad in 2013.
Travelers between Finland and Russia: Translation needs IMU-project
 Travelers between Finland and Russia: Translation needs Tutkimus- ja Analysointikeskus TAK Oy :: GSM +358 45 137 5099 :: info@tak.fi :: www.tak.fi TABLE OF CONTENTS Summary... 1 Introduction... 2 Structure
Ports of Stockholm. Importance of ferry passengers for the Stockholm region
 Ports of Stockholm Importance of ferry passengers for the Stockholm region Contents Ports of Stockholm Ferry Survey 2013 Summary 3 The survey 4 The passengers 9 The journey 14 The visit 19 Consumer spending
Finns travelled in Finland as well as to Central Europe in the cool summer of 2015
 Transport and Tourism 015 Finnish Travel 015, Summer (1 May to 1 Aug 015) Finns travelled in Finland as well as to Central Europe in the cool summer of 015 According to Statistics Finland's preliminary
Key facts on tourism
 Key facts on tourism 2008 edition Economic impact of tourism in France in 2007 Foreign trade Expenditure by foreign visitors in France: EUR 39.6 billion (+7.2%*) Expenditure by French residents abroad:
Norwegian Foreign Visitor Survey 2010
 Summary: TØI Report 1135/2011 Author(s): Eivind Farstad, Arne Rideng, and Iratxe Landa Mata Oslo 2010, 66 pages Norwegian Foreign Visitor Survey 2010 In 2010 a total of 4.8 million foreign guests stayed
Tourism in Tallinn 2011
 Tourism in Tallinn 211 In 211 altogether 2.73 million tourists stayed in Estonian accommodation enterprises, more than half of them (55%) stayed in Tallinn. Tourists in Tallinn: 1 498 5 (+16%) 1 Bednights
UKONNIEMI Imatra Spa Resort
 UKONNIEMI Imatra Spa Resort Locating for Success UKONNIEMI Imatra Spa Resort Ukonniemi is the developing tourism location in South-East Finland close to the Finnish-Russian border. Its beating heart is
Facts About Stockholm s Tourism Industry Statistics for 2013
 Facts About Stockholm s Tourism Industry Statistics for 2013 Content Stockholm s international position Where visitors come from How visitors travel to Stockholm Where visitors stay Why people travel to
Accommodation statistics
 Transport and Tourism 2012 Accommodation statistics 2012, July Nights spent by resident tourists decreased by 4 per cent in July 2012 The number of recorded nights spent by resident tourists at Finnish
Audiences London Cultural Tourism Resources
 Audiences London Cultural Tourism Resources Factsheet 1: Definitions of Cultural Tourism Factsheet 2: Key facts and figures Factsheet 3: Segmenting Cultural Tourists Factsheet 4: How Visit London can help
Inbound Tourism Statistics
 Inbound Tourism Statistics 4.July.2011 Japan Tourism Agency Consumption Trend Survey for Foreigners Visiting Japan -2-1 Major official statistics on tourism Inbound Number of inbound tourists Announced
GOLD COAST VISITOR PROFILE AND SATISFACTION REPORT. Summary of results NOVEMBER 2013
 GOLD COAST VISITOR PROFILE AND SATISFACTION REPORT Summary of results NOVEMBER 2013 3 GOLD COAST VISITOR PROFILE AND SATISFACTION REPORT: SUMMARY OF RESULTS Visitors to the Gold Coast that participated
The Path Forward. International Women s Day 2012 Global Research Results
 The Path Forward International Women s Day 2012 Global Research Results Research objectives Accenture conducted its global research study, The Path Forward for release on International Women s Day to gain
Sitka Charter Fishing Visitor Profile and Impact Analysis Alaska Travelers Survey
 Sitka Charter Fishing Visitor Profile and Impact Analysis Alaska Travelers Survey PREPARED FOR: Sitka Charter Boat Operators Association January 2005 Sitka Charter Fishing Visitor Profile and Impact Analysis
Survey of young person s perception and ideas on Baltic Sea Region tourism products
 Survey of young person s perception and ideas on Baltic Sea Region tourism products Lise Lyck 1 Survey of young person s perception and ideas on Baltic Sea Region tourism products Copenhagen Business School
Tourism and Travel. Overseas trips to Ireland increased by 0.2% in 2012. 21 March 2013. The main results for 2012 are as follows:
 An Phríomh-Oifig Staidrimh Central Statistics Office 21 March 2013 Number of trips by reason for journey - 2012 000's 4000 3500 3000 2500 2000 1500 1000 500 0 Business VFR HLR Other 2012 Trips to Ireland
Finnish foreign trade 2014 Figures and diagrams. 27.2.2015 FINNISH CUSTOMS Statistics 1
 Finnish foreign trade 214 Figures and diagrams 27.2.215 FINNISH CUSTOMS Statistics 1 IMPORTS, EXPORTS AND TRADE BALANCE 199-214 7 billion e 6 5 4 3 2 1-1 9 91 92 93 94 95 96 97 98 99 1 2 3 4 5 6 7 8 9
THIS IS THE CHINESE TRAVELER TO COPENHAGEN
 THIS IS THE CHINESE TRAVELER TO COPENHAGEN RESULTS FROM EXIT SURVEY IN CPH AIRPORT BY WONDERFUL COPENHAGEN Signe Jungersted, Director of New Markets, Wonderful Copenhagen Mille Marcussen, Senior Advisor,
The Economic Impact of Major Exhibitions at The Metropolitan Museum of Art The Museum of Modern Art The Solomon R.
 The Economic Impact of Major Exhibitions at The Metropolitan Museum of Art The Museum of Modern Art The Solomon R. Guggenheim Museum Overview In the fall and winter of 1992-93, Metropolitan Museum of Art,
Indicator. Measurement. What should the measurement tell us?
 Indicator 14 Volume of tourism. 14.1 Overnight stays in tourist accommodation. Measurement What should the measurement tell us? At its most elemental, tourism is about numbers numbers of visitors, numbers
International Education in the Comox Valley: Current and Potential Economic Impacts
 International Education in the Comox Valley: Current and Potential Economic Impacts FINAL REPORT March 2012 Prepared by: Vann Struth Consulting Group Inc. Vancouver, BC www.vannstruth.com Prepared for:
TOURISM IN THE CAPITAL CITY OF WARSAW IN 2015
 STATISTICAL OFFICE IN WARSAW 1 Sierpnia 21, 02-134 Warsaw Brief information Prepared on 24.05.2016 r. Contact: e-mail: sekretariatuswaw@stat.gov.pl tel. 22 464 23 15, 22 464 23 12 fax 22 846 76 67 http://warszawa.stat.gov.pl
In the Armpit of Russia - What Proximity of the Russian Border Means to South- East Finland?
 In the Armpit of Russia - What Proximity of the Russian Border Means to South- East Finland? Pasi Nurkka pasi.nurkka@tak.fi 040-5055 903 1 GDP per capita (current US$) 1989-2010 Index (1989=100) 400 350
Tourism trends in Europe and in Mediterranean Partner Countries, 2000-2006
 Industry, trade and services Author: Ulrich SPÖREL, Volker TÄUBE Statistics in focus 95/28 Tourism trends in Europe and in Mediterranean Partner Countries, 2-26 Tourism is a growth industry in Europe and
The Impact of The European Crisis on Travel To and From Europe and China & Asia-Pacific
 The Impact of The European Crisis on Travel To and From Europe and China & Asia-Pacific A Report by Research For Travel Ltd July 2012 Research For Travel Ltd The Impact of The European Crisis on Travel
Inbound Tourism: December 2014
 30 January 2015 1100 hrs 021/2015 Total inbound tourist trips for December 2014 were estimated at 66,619, an increase of 1.4 per cent when compared to the corresponding month of 2013. Excluding the passengers
Facts about Stockholm s tourism industry
 Facts about Stockholm s tourism industry Statistics for 2012 1 PHOTO: OLA ERICSSON Content 3 A city of events 4 Stockholm The Capital of Scandinavia 5 About Stockholm Visitors Board STOCKHOLM IN PERSPECTIVE
Internationalization and higher education policy: Recent developments in Finland
 Internationalization and higher education policy: Recent developments in Finland Seminar on Cooperation between Russian and Finnish Institutions of Higher Education St Petersburg 5.-7.2.2008. Rector Anneli
Latvia Hotel Market Overview
 Research & Forecast Report Latvia 2016 Latvia Hotel Market Overview Annual Review Accelerating success. Hotel Market General Overview > > During the first three quarters of 2015, the number of visitors
T R A V E L A N D A C C O M M O D A T I O N E X P E N S E S 2 0 1 4
 13/01/2015 www.bdo.lu T R A V E L A N D A C C O M M O D A T I O N E X P E N S E S 2 0 1 4 In Luxembourg the travel expenses for business trips are reimbursed either based on actual expenses or based on
TRAVEL BY AUSTRALIANS
 TRAVEL BY AUSTRALIANS Quarterly results of the National Visitor Survey JUNE 2013 TRAVEL BY AUSTRALIANS Travel by Australians June 2013 Quarterly Results of the National Visitor Survey Image: Sailing,
Visit Finland Road Show 2013. Northern China & Chongqing Shanghai Hong Kong & South China Japan USA
 Visit Finland Road Show 2013 Northern China & Chongqing Shanghai Hong Kong & South China Japan USA Marketing Update Northern China & Chongqing Danye LIU / Sep 30, 2013 Market Info & Review, Beijing I Northern
What Proportion of National Wealth Is Spent on Education?
 Indicator What Proportion of National Wealth Is Spent on Education? In 2008, OECD countries spent 6.1% of their collective GDP on al institutions and this proportion exceeds 7.0% in Chile, Denmark, Iceland,
Pan-European opinion poll on occupational safety and health
 PRESS KIT Pan-European opinion poll on occupational safety and health Results across 36 European countries Press kit Conducted by Ipsos MORI Social Research Institute at the request of the European Agency
Tourism in figures 2012
 Tourism in figures 2012 the Belgian market in Flanders July 2013 toerisme vlaanderen TABLE OF CONTENT A. THE BELGIAN MARKET IN FLANDERS 5 1. Key figures 5 2. Distribution within Flanders 5 3. Trends 8
Comparative tables. CPSS Red Book statistical update 427
 CPSS Red Book statistical update 427 January 2013 Table 1 Basic statistical data GDP (USD billions) 1 Population (millions, yearly average) Australia 952 1,050 999 1,246 1,500 21.1 21.4 21.8 22.1 22.4
Australia s inbound tourism statistics
 What is inbound tourism? Scope of inbound tourism: Short-term visitor arrivals are defined as overseas visitors who intend to stay in Australia for less than 12 months Statistics relate to the number of
EUROPEAN. Geographic Trend Report for GMAT Examinees
 2011 EUROPEAN Geographic Trend Report for GMAT Examinees EUROPEAN Geographic Trend Report for GMAT Examinees The European Geographic Trend Report for GMAT Examinees identifies mobility trends among GMAT
July 2012 Decoding Global Investment Attitudes
 July 2012 Decoding Global Investment Attitudes Investment decisions and matters of personal wealth vary by gender, age and geographic region Globally, men are 36% more active than women with investments
Adult Education Survey 2006, European comparison
 Education 2009 Adult Education Survey 2006, European comparison Adults in the Nordic countries actively participate in education and training Persons aged 25 to 64 who live in the Nordic countries (Finland,
OPPORTUNITIES IN RUSSIAN ON-LINE MARKET AND LOGISTICS SOLUTIONS FOR DELIVERIES
 OPPORTUNITIES IN RUSSIAN ON-LINE MARKET AND LOGISTICS SOLUTIONS FOR DELIVERIES CISLog Oy 30.03.2014 1 Introduction This report has been conducted based on an assignment of Hamina/Kotka regional development
Capacity and Turnover in Public Accommodation Establishments in Hungary
 Capacity and Turnover in Public Accommodation Establishments in Hungary According to Act I of 1978 on domestic trade, in Hungary all establishments operated as a business for overnight accommodation and
Riga Facts & Figures. Riga Facts &
 Riga Facts & Figures 1 Riga Facts & Figures 2015 2 Riga Facts & Figures TABLE OF CONTENTS 1. General Information...1 2. Economics...4 3. Territory...12 Riga Facts & Figures 2015 Riga Facts & Figures 1
ECONOMIC MIGRATIONS OF THE POLES. Report by Work Service S.A.
 ECONOMIC MIGRATIONS OF THE POLES Report by Work Service S.A. TABLE OF CONTENTS INTRODUCTION 3 THE REPORT IN NUMBERS 4 PREFERRED COUNTRIES OF EMIGRATION 5 THOSE CONSIDERING ECONOMIC EMIGRATION 6 REASONS
Going local and engaging with the world. Finnair. Maarit Keränen
 Going local and engaging with the world Finnair Maarit Keränen Finnair Who we are More than 8.7 million passengers and 2.4 billion EUR in revenue in 2012 Modern, fuel efficient and streamlined fleet Member
Annual report 2014. Finnish Tourist Board
 Annual report Finnish Tourist Board CONTENT 3... Management review 4... Marketing 5... Research and development activities 6... International co-operation 6... Quality 1000 7... Organisation 2 MANAGEMENT
RETAIL FINANCIAL SERVICES
 Special Eurobarometer 373 RETAIL FINANCIAL SERVICES REPORT Fieldwork: September 211 Publication: April 212 This survey has been requested by the European Commission, Directorate-General Internal Market
Table 1: TSQM Version 1.4 Available Translations
 Quintiles, Inc. 1 Tables 1, 2, & 3 below list the existing and available translations for the TSQM v1.4, TSQM vii, TSQM v9. If Quintiles does not have a translation that your Company needs, the Company
Country note China. More than 255 million people in OECD and G20 countries have now attained tertiary education (Table A1.3a).
.") Education at a Glance 2011 OECD Indicators DOI: http://dx.doi.org/10.1787/eag-2011-en OECD 2011 Under embargo until 13 September, at 11:00 Paris time Education at a Glance 2011 Country note China Questions
Education at a Glance 2011 OECD Indicators DOI: http://dx.doi.org/10.1787/eag-2011-en OECD 2011 Under embargo until 13 September, at 11:00 Paris time Education at a Glance 2011 Country note China Questions
Challengesin Berlin Tourism
 July, 31th 2015 Challengesin Berlin Tourism Prof. Dr. Frank Schaal EBC Hochschule Berlin Berlin Boomingin Tourism! Berlin: Highscore year 2012 11,4 % morenightsthanin 2011 Source: VisitBerlin 2013 Berlin
The Barents Tourism Project 2014 Travel industry collaboration between Northern Norway and Northwest Russia
 The Barents Tourism Project 2014 Travel industry collaboration between Northern Norway and Northwest Russia Recommendations for the cross-border tourism development between Northern Norway and Northwest
Supplier expense guidelines and standard expense tables
 Supplier expense guidelines and standard expense tables Definitions and introduction Term Agreement: Client: Supplier: Supplier Personnel: Definition means the agreement between the Client and the Supplier
WORLD. Geographic Trend Report for GMAT Examinees
 2011 WORLD Geographic Trend Report for GMAT Examinees WORLD Geographic Trend Report for GMAT Examinees The World Geographic Trend Report for GMAT Examinees identifies mobility trends among GMAT examinees
Driving in Great Britain (GB) as a visitor or a new resident
 as a visitor or a new resident") INF38 Driving in Great Britain (GB) as a visitor or a new resident For more information go to www.direct.gov.uk/driving 11/08 Contents 1 European Community/European Economic Area (EC/EEA licences) 3 2
INF38 Driving in Great Britain (GB) as a visitor or a new resident For more information go to www.direct.gov.uk/driving 11/08 Contents 1 European Community/European Economic Area (EC/EEA licences) 3 2
ECONOMIC EFFECT OF THE SALZBURG FESTIVAL
 SALZBURG FESTIVAL 2011 ECONOMIC EFFECT OF THE SALZBURG FESTIVAL Study 2011 of the Zentrum für Zukunftsstudien Fachhochschule Salzburg / Dkfm. Bernd Gaubinger Power of the Salzburg Festival as Economic
TOURISM IN THE AMSTERDAM METROPOLITAN AREA: NIGHTS, ACCOMMODATIONS AND JOBS IN THE TOURISM SECTOR 2014-2015
 TOURISM IN THE AMSTERDAM METROPOLITAN AREA: NIGHTS, ACCOMMODATIONS AND JOBS IN THE TOURISM SECTOR 21-21 Research, Information and Statistics (OIS), February 21 Europe is the world's most popular holiday
WORKFORCE ENGAGEMENT IN SAUDI ARABIA WHAT S WORKING FOR SAUDI NATIONALS AND WHAT EMPLOYERS NEED TO KNOW
 WORKFORCE ENGAGEMENT IN SAUDI ARABIA WHAT S WORKING FOR SAUDI NATIONALS AND WHAT EMPLOYERS NEED TO KNOW Forget the old cliché of a comfortable secure job with a corner desk in a government office. Saudi
How To Calculate Tertiary Type A Graduation Rate
 Indicator How Many Students Finish Tertiary Education? Based on current patterns of graduation, it is estimated that an average of 46% of today s women and 31% of today s men in OECD countries will complete
VAT Refunds Irrecoverable Tax A Country by Country Detailed Guide
 VAT Refunds Irrecoverable Tax A Country by Country Detailed Guide EC VAT refunds Irrecoverable Tax VAT incurred in other EC Member States may be recovered in certain circumstances. However, some claims
Flash Eurobarometer 355 SPACE ACTIVITIES REPORT
 Flash Eurobarometer SPACE ACTIVITIES REPORT Fieldwork: July 2012 Publication: September 2012 This survey has been requested by the European Commission, Directorate-General Enterprise and Industry and co-ordinated
The Nordic Tourism Investment Index 2012
 The Conclusions The Nordic Tourism Index 212 The Nordic Investment Index 212 Nights spent in the Nordic countries The total number of guest nights in the Nordic countries included in the 212 Nordic Investment
Tourism in Eastern Scotland 2009 Edinburgh & Lothians, Angus & Dundee, Perthshire and the Kingdom of Fife
 Tourism in Eastern 2009 Edinburgh & Lothians, Angus & Dundee, Perthshire and the Kingdom of Fife Edinburgh & Lothians Summary It is estimated that in 2009, UK residents made 2.46m trips to Edinburgh and
Visitors to Ireland and Northern Ireland 2014:
 Visitors to Ireland and 2014: A Statistical Profile of Tourism A Joint Publication Material jointly compiled, edited and presented by the Central Statistics Office, Ireland and Statistics & Research Agency.
A Study of Chinese Tourists in Finland - Winter 2003
 A Study of Chinese Tourists in Finland - Winter 2003 Tong Tuominen TABLE OF CONTENTS 1. INTRODUCTION 3 1.1 The purpose of the research 3 1.2 Data collection 3 2. DATA 5 2.1 The profile of the respondents
Incoming Tourism to Germany
 EDITION 2004 Incoming Tourism to Germany FACTS AND FIGURES 2003 www.germany-tourism.de German National Tourist Board CONTENTS INTRODUCTION 1. 2. 3. 4. 5. 6. 7. 8. 9. 10. 11. 12. 13. 14. 15. 16. 17. 18.
RETAIL FINANCIAL SERVICES
 Special Eurobarometer 373 RETAIL FINANCIAL SERVICES REPORT Fieldwork: September 211 Publication: March 212 This survey has been requested by Directorate-General Internal Market and Services and co-ordinated
THE ELECTRONIC CUSTOMS IMPLEMENTATION IN THE EU
 Flash Eurobarometer THE ELECTRONIC CUSTOMS IMPLEMENTATION IN THE EU REPORT Fieldwork: April-May 214 Publication: October 214 This survey has been requested by the European Commission, Directorate-General
Tourism Streams and Mobility in Uusimaa Region in Southern Finland
 Tourism Streams and Mobility in Uusimaa Region in Southern Finland Jarmo Ritalahti a and Annika Konttinen b a HAAGA-HELIA University of Applied Sciences, Finland jarmo.ritalahti@haaga-helia.fi b HAAGA-HELIA
Facts about Stockholm s tourism industry. Statistics for 2011
 Facts about Stockholm s tourism industry Statistics for 211 Contents A hot spot in Europe... 3 Stockholm The Capital of Scandinavia... 4 About Stockholm Visitors Board... 5 Stockholm in perspective...7
Observers Local Government Association VisitBritain VisitEngland
 The Tourism Alliance is the Voice of the Tourism Industry, comprising 50 Tourism Industry Organisations that together represent some 200,000 businesses of all sizes throughout the UK. The purpose of the
A new Eurobarometer Survey on young people reveals decreasing involvement in out-of-school activities
 EUROPEAN COMMISSION MEMO Brussels, 23 April 2015 A new Eurobarometer Survey on young people reveals decreasing involvement in out-of-school activities Over 13.000 young people between 15 and 30 were interviewed
The Cost of Movie Piracy. An analysis prepared by LEK for the Motion Picture Association
 An analysis prepared by LEK for the Motion Picture Association Contents Overview Major Findings MPA Member Company* Losses Piracy Rates by Country Dollar Losses by Country Worldwide Motion Picture Industry
Health and welfare Humanities and arts Social sciences, bussiness and law. Ireland. Portugal. Denmark. Spain. New Zealand. Argentina 1.
 Indicator to Which fields of education are students attracted? Women represent the majority of students and graduates in almost all OECD countries and largely dominate in the fields of education, health
Tourism in Denmark. Creating growth and jobs in Denmark
 Tourism in Denmark Creating growth and jobs in Denmark Denmark is the most popular holiday destination in the Nordic Region among foreign tourists. In fact, we have more foreign bednights than Norway and
FRAX Release Notes. 07.03.16 Release (FRAX v3.10)
") FRAX Release Notes 07.03.16 Release (FRAX v3.10) Now models available for 58 countries (63 models) o New country added Kuwait Now available in 32 languages o New languages added since v3.9 Bengali and
FRAX Release Notes 07.03.16 Release (FRAX v3.10) Now models available for 58 countries (63 models) o New country added Kuwait Now available in 32 languages o New languages added since v3.9 Bengali and
What Is the Total Public Spending on Education?
 What Is the Total Public Spending on Education? Indicator On average, OECD countries devote 12.9% of total public expenditure to, but values for individual countries range from less than 10% in the Czech
GLOBAL TOURISM - Geography Explained Fact Sheet
 Billion (US$) GLOBAL TOURISM - Geography Explained Fact Sheet Introduction With almost all the leading tourist destination countries having reported their international tourism receipts for 2006, the WTO
Ageing OECD Societies
 ISBN 978-92-64-04661-0 Trends Shaping Education OECD 2008 Chapter 1 Ageing OECD Societies FEWER CHILDREN LIVING LONGER CHANGING AGE STRUCTURES The notion of ageing societies covers a major set of trends
Finnair Q1 result info
 Finnair Q1 result info 7 May 2014 CEO Pekka Vauramo CFO Erno Hildén 1 Updated mission and strategic targets 2 Our Mission Offer the smoothest connections in the northern hemisphere via Helsinki, and the
Overview of the Airbnb Community in Norway
 Overview of the Airbnb Community in Norway Overview of Airbnb Community in Norway / 1 Airbnb Community Profile / 2 Tourism: A Case Study of Oslo / 3 Definitions / 4 Overview of Airbnb Community in Norway
Tourist Destination Questionnaire
 Tourist Destination Questionnaire Dear Sir or Madam! Good morning/afternoon and welcome to our tourist destination. We are pleased that you decided to stay here. If you have spent at least one night at
Immigrant artists in the Finnish support system for the arts
 Immigrant artists in the Finnish support system for the arts Summary Research objectives and material This research on the position of immigrant artists as applicants and recipients of grants is based
User language preferences online. Analytical report
 Flash Eurobarometer 313 The Gallup Organization Flash Eurobarometer European Commission User language preferences online Analytical report Fieldwork: January 2011 Publication: May 2011 This survey was
Welcome to the ITB Academy Webinar. The Germans on holiday Trends from the study Reiseanalyse 2015
 Welcome to the ITB Academy Webinar The Germans on holiday Trends from the study Reiseanalyse 2015 A warm welcome from Kiel! 2 Today is about Volume of holiday demand Holiday destinations: Demand and interest
CONTENTS: bul BULGARIAN LABOUR MIGRATION, DESK RESEARCH, 2015
 215 2 CONTENTS: 1. METHODOLOGY... 3 a. Survey characteristics... 3 b. Purpose of the study... 3 c. Methodological notes... 3 2. DESK RESEARCH... 4 A. Bulgarian emigration tendencies and destinations...
41 T Korea, Rep. 52.3. 42 T Netherlands 51.4. 43 T Japan 51.1. 44 E Bulgaria 51.1. 45 T Argentina 50.8. 46 T Czech Republic 50.4. 47 T Greece 50.
 Overall Results Climate Change Performance Index 2012 Table 1 Rank Country Score** Partial Score Tendency Trend Level Policy 1* Rank Country Score** Partial Score Tendency Trend Level Policy 21 - Egypt***
Consumer Credit Worldwide at year end 2012
 Consumer Credit Worldwide at year end 2012 Introduction For the fifth consecutive year, Crédit Agricole Consumer Finance has published the Consumer Credit Overview, its yearly report on the international
Population Aging in Developed Countries: Emerging Trends and Dynamics Wan He, Ph.D. Population Division U.S. Census Bureau
 Population Aging in Developed Countries: Emerging Trends and Dynamics Wan He, Ph.D. Population Division U.S. Census Bureau This presentation is released to inform interested parties of population aging
International investment continues to struggle
 FDI IN FIGURES December 2014 International investment continues to struggle Figures for the first half of 2014 point to stalled FDI flows Findings FDI fell in the first quarter of 2014 before rebounding
- 2 - Chart 2. Annual percent change in hourly compensation costs in manufacturing and exchange rates, 2010-2011
 For release 10:00 a.m. (EST) Wednesday, December 19, 2012 USDL-12-2460 Technical Information: (202) 691-5654 ilchelp@bls.gov www.bls.gov/ilc Media Contact: (202) 691-5902 PressOffice@bls.gov INTERNATIONAL
ROBERT WALTERS WHITEPAPER UNDERSTANDING EMPLOYEE BENEFITS IN THE MIDDLE EAST
 ROBERT WALTERS WHITEPAPER UNDERSTANDING EMPLOYEE BENEFITS IN THE MIDDLE EAST INTRODUCTION A key attraction of working in the Middle East has always been the employee benefits packages on offer but how
Defining Success 2013 Global Research Results
 International Women s Day 2013 Defining Success 2013 Global Research Results Copyright 2013 Accenture All rights reserved. 1 Research objectives Accenture conducted its global research study, Defining
International Market Profile: Thailand Year ending December 2015
 International Market Profile: Thailand Year ending December 2015 This fact sheet provides a summary of the latest tourism data for visitors from Thailand to Victoria. Information includes: visitor numbers,
INFORMATION FOR VISITING STUDENTS
 Studying at TeaK INFORMATION FOR VISITING STUDENTS The University of the Arts Helsinki (in Finnish Taideyliopisto, in Swedish Konstuniversitetet) was launched on January 1st 2013 with the merger of the
APPROVED EDEXCEL BTEC CENTRE
 GET A REALLY DEMANDED PROFESSION! The tourism and hospitality industry is a rising star of the world economy. It is estimated that in 2020 it will employ every 11th person on the planet! After studying
Australia s outbound tourism statistics
 What is outbound tourism? Scope of outbound tourism: Short-term visitor departures who travel overseas for less than 12 months Statistics relate to the number of movements of travellers rather than the
PREFERENCES OF EUROPEANS TOWARDS TOURISM
 Eurobarometer PREFERENCES OF EUROPEANS TOWARDS TOURISM REPORT Fieldwork: January 2014 Publication: February 2014 This survey has been requested by the European Commission, Directorate-General for Enterprise
FINLAND 2014 LAND ROVER NORDIC EXPERIENCE
 FINLAND 2014 LAND ROVER NORDIC EXPERIENCE Unforgettable experiences in the world s most capable vehicles. Land Rover Nordic Experience A balanced mix of comfortable luxury and challenging driving over