Graphing Piecewise Functions
|
|
|
- Brendan Berry
- 7 years ago
- Views:
Transcription
1 Graphing Piecewise Functions Course: Algebra II, Advanced Functions and Modeling Materials: student computers with Geometer s Sketchpad, Smart Board, worksheets (p. -7 of this document), colored pencils Strategies: technolog eploration Objectives: The student will be able to graph functions using Geometer s Sketchpad. The student will be able to select an appropriate straightedge option and use the displa options to highlight particular sections of a function graph based on a given domain. The student will be able to appl these skills to graph piecewise functions with Geometer s Sketchpad. Introduction: The teacher will review the steps for graphing functions in Geometer s Sketchpad b graphing each function in Part A of the worksheet. Net the teacher will introduce the term domain, and help students appl this to identif the portion of each graph that matches the given domain. The teacher will initiall use the markers to highlight the specified sections, but once students understand the term domain, she will show them how to use the straightedge tools to highlight these portions of the graph using Geometer s Sketchpad. The students will model this on their computers and use colored pencils to create similar graphs on their worksheets. domain the -values of a function Geometer s Sketchpad Steps:. In the Graph menu, select Show Grid.. Graph the given function (Graph, Plot New Function).. Use the point option to place points on the function at the boundaries of the domain. Remember that when the point is eactl on the line, the line will change color.. Select a straightedge option and using a thicker line, highlight the portion of the function that matches the domain. (Hint: If the function eists between two values, use the segment option. If the function continues to ±, use the ra option.) 5. You ma opt to hide the original function b clicking on a portion of the function outside the domain and choosing Hide Function Plot from the Displa menu. This will show onl the darkened section based on the domain. Lesson Development: The teacher will introduce the concept of piecewise functions and show students how the problems in Part A of the worksheet can be combined to form a piecewise function (Part B #). A GSP document (Graphing Piecewise Functions.gsp) will be prepared ahead of time that has all three functions graphed on the same coordinate plane with the appropriate portions highlighted. The teacher will show students what the graph looks like with the functions hidden so onl the portions related to the domain of the piecewise function are visible. This will give students a good opportunit to see that piecewise functions ma have disconnected portions and often appear to have distinct sections. The open or closed endpoints will be drawn on the graph using the Smart Board markers. Guided Practice: Each student will complete Part B of the worksheet with a partner. When the teacher observes that most people have completed a particular problem, she will ask student to stop working for a few minutes to allow a student pair to present the graph on the Smart Board. This will allow students to check their work throughout the activit so the can catch an mistakes earl in the practice activit.

2 Assessment: Informal assessment will be done throughout the class period. The teacher will determine whether or not students have met the stated objectives through their work and presentations during the guided practice section. Formal assessment will be based on the homework practice worksheet.

3 Piecewise Functions Geometer s Sketchpad Hints To show the coordinate plane:. Choose the Graph menu.. Select Show Grid. To graph a function:. Choose the Graph menu.. Select Plot New Function.. Tpe in the function ou would like to graph. You do not need the portion of the equation. * To tpe an absolute value function, select the Functions button and choose abs. Whatever appears inside the parentheses behind abs will be included inside the absolute value bars for the graph. To darken a particular section of a function:. Select the point option on the left side of the screen.. Place points on the function at the domain boundaries. When the point is eactl on the line, the line will change color. You can also use Plot Points in the Graph menu to be more eact. If ou are darkening a section of an absolute value graph that includes the verte ou will need points at the boundaries and an additional point at the verte.. Select a straightedge option on the left side of the screen. If ou want to darken an area of the graph between two values, ou should use the segment option and click on each of the points at the boundaries. If ou want to darken an area that etends to ±, ou should use the ra option and click on the boundar point then another point in the domain specified.. If ou would like to hide the remainder of the function, highlight the original function (and not the darkened section). From the Displa menu, select Hide Function Plot. Part A: Using Geometer s Sketchpad, graph each function and darken the region associated with the domain. On the graph square given with the problem, sketch the function lightl with pencil and use a colored pencil to darken the region associated with the domain.. domain:

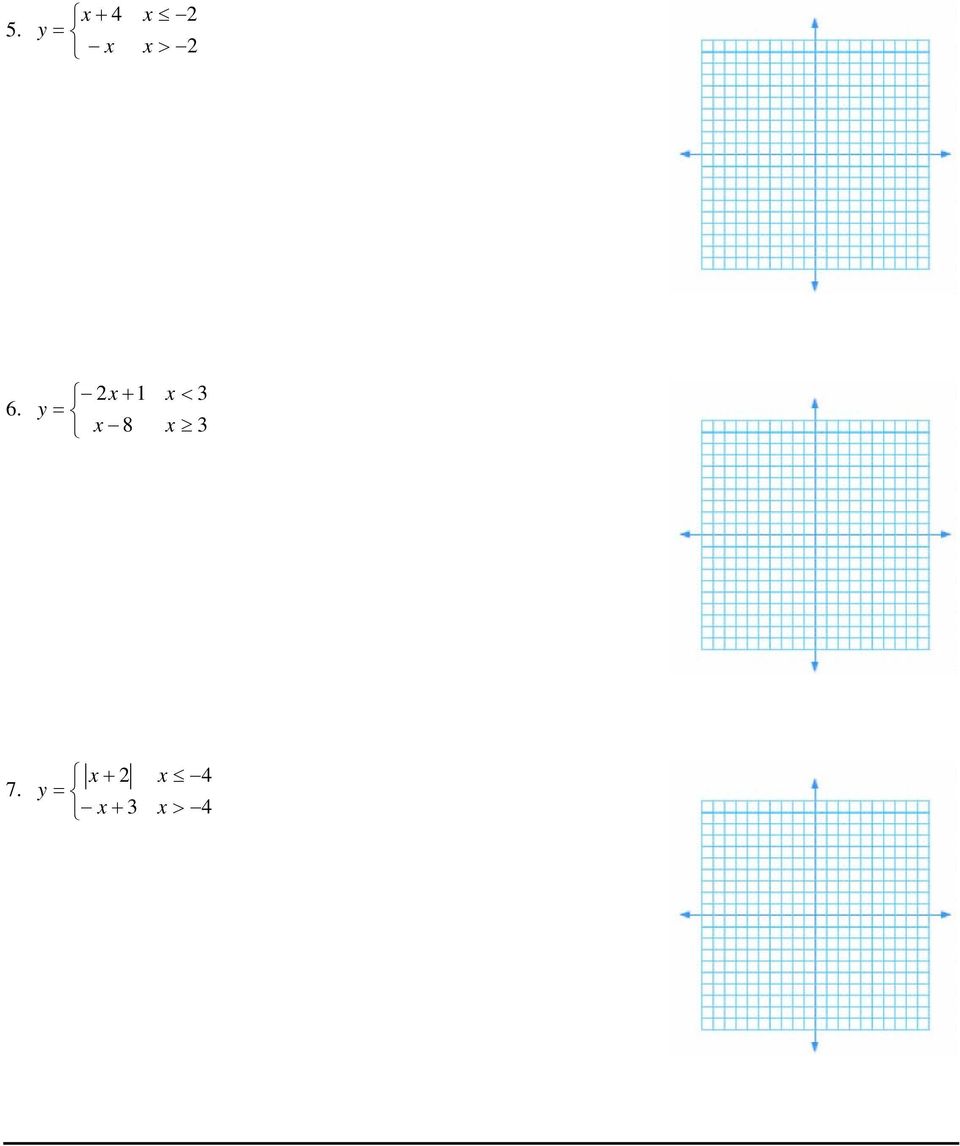
4 . domain:. domain: > Part B: Using Geometer s Sketchpad, graph each function, and darken the region associated with the domain. On the graph square given with the problem, sketch the function lightl with pencil and use a colored pencil to darken the region associated with the domain.. >

5 5. > >
6 Piecewise Functions Practice Graph each piecewise function. You ma use our calculator or Geometer s Sketchpad to graph the individual functions, but the are all functions that ou should be able to graph without a calculator... >

7

To Be or Not To Be a Linear Equation: That Is the Question
 To Be or Not To Be a Linear Equation: That Is the Question Linear Equation in Two Variables A linear equation in two variables is an equation that can be written in the form A + B C where A and B are not
15.1. Exact Differential Equations. Exact First-Order Equations. Exact Differential Equations Integrating Factors
 SECTION 5. Eact First-Order Equations 09 SECTION 5. Eact First-Order Equations Eact Differential Equations Integrating Factors Eact Differential Equations In Section 5.6, ou studied applications of differential
I think that starting
 . Graphs of Functions 69. GRAPHS OF FUNCTIONS One can envisage that mathematical theor will go on being elaborated and etended indefinitel. How strange that the results of just the first few centuries
INVESTIGATIONS AND FUNCTIONS 1.1.1 1.1.4. Example 1
 Chapter 1 INVESTIGATIONS AND FUNCTIONS 1.1.1 1.1.4 This opening section introduces the students to man of the big ideas of Algebra 2, as well as different was of thinking and various problem solving strategies.
Shake, Rattle and Roll
 00 College Board. All rights reserved. 00 College Board. All rights reserved. SUGGESTED LEARNING STRATEGIES: Shared Reading, Marking the Tet, Visualization, Interactive Word Wall Roller coasters are scar
5.3 Graphing Cubic Functions
 Name Class Date 5.3 Graphing Cubic Functions Essential Question: How are the graphs of f () = a ( - h) 3 + k and f () = ( 1_ related to the graph of f () = 3? b ( - h) 3 ) + k Resource Locker Eplore 1
We are going to investigate what happens when we draw the three angle bisectors of a triangle using Geometer s Sketchpad.
 Krystin Wright Geometer s Sketchpad Assignment Name Date We are going to investigate what happens when we draw the three angle bisectors of a triangle using Geometer s Sketchpad. First, open up Geometer
C3: Functions. Learning objectives
 CHAPTER C3: Functions Learning objectives After studing this chapter ou should: be familiar with the terms one-one and man-one mappings understand the terms domain and range for a mapping understand the
6. The given function is only drawn for x > 0. Complete the function for x < 0 with the following conditions:
 Precalculus Worksheet 1. Da 1 1. The relation described b the set of points {(-, 5 ),( 0, 5 ),(,8 ),(, 9) } is NOT a function. Eplain wh. For questions - 4, use the graph at the right.. Eplain wh the graph
More Equations and Inequalities
 Section. Sets of Numbers and Interval Notation 9 More Equations and Inequalities 9 9. Compound Inequalities 9. Polnomial and Rational Inequalities 9. Absolute Value Equations 9. Absolute Value Inequalities
ax 2 by 2 cxy dx ey f 0 The Distance Formula The distance d between two points (x 1, y 1 ) and (x 2, y 2 ) is given by d (x 2 x 1 )
 and (x 2, y 2 ) is given by d (x 2 x 1 )") SECTION 1. The Circle 1. OBJECTIVES The second conic section we look at is the circle. The circle can be described b using the standard form for a conic section, 1. Identif the graph of an equation as
SECTION 1. The Circle 1. OBJECTIVES The second conic section we look at is the circle. The circle can be described b using the standard form for a conic section, 1. Identif the graph of an equation as
Quickstart for Desktop Version
 Quickstart for Desktop Version What is GeoGebra? Dynamic Mathematics Software in one easy-to-use package For learning and teaching at all levels of education Joins interactive 2D and 3D geometry, algebra,
The Distance Formula and the Circle
 10.2 The Distance Formula and the Circle 10.2 OBJECTIVES 1. Given a center and radius, find the equation of a circle 2. Given an equation for a circle, find the center and radius 3. Given an equation,
x y The matrix form, the vector form, and the augmented matrix form, respectively, for the system of equations are
 Solving Sstems of Linear Equations in Matri Form with rref Learning Goals Determine the solution of a sstem of equations from the augmented matri Determine the reduced row echelon form of the augmented
(Least Squares Investigation)
") (Least Squares Investigation) o Open a new sketch. Select Preferences under the Edit menu. Select the Text Tab at the top. Uncheck both boxes under the title Show Labels Automatically o Create two points
(Least Squares Investigation) o Open a new sketch. Select Preferences under the Edit menu. Select the Text Tab at the top. Uncheck both boxes under the title Show Labels Automatically o Create two points
D.2. The Cartesian Plane. The Cartesian Plane The Distance and Midpoint Formulas Equations of Circles. D10 APPENDIX D Precalculus Review
 D0 APPENDIX D Precalculus Review SECTION D. The Cartesian Plane The Cartesian Plane The Distance and Midpoint Formulas Equations of Circles The Cartesian Plane An ordered pair, of real numbers has as its
Mathematics 31 Pre-calculus and Limits
 Mathematics 31 Pre-calculus and Limits Overview After completing this section, students will be epected to have acquired reliability and fluency in the algebraic skills of factoring, operations with radicals
7.4A/7.4B STUDENT ACTIVITY #1
 7.4A/7.4B STUDENT ACTIVITY #1 Write a formula that could be used to find the radius of a circle, r, given the circumference of the circle, C. The formula in the Grade 7 Mathematics Chart that relates the
Mathematical goals. Starting points. Materials required. Time needed
 Level A7 of challenge: C A7 Interpreting functions, graphs and tables tables Mathematical goals Starting points Materials required Time needed To enable learners to understand: the relationship between
1.6. Piecewise Functions. LEARN ABOUT the Math. Representing the problem using a graphical model
 1. Piecewise Functions YOU WILL NEED graph paper graphing calculator GOAL Understand, interpret, and graph situations that are described b piecewise functions. LEARN ABOUT the Math A cit parking lot uses
Zeros of Polynomial Functions. The Fundamental Theorem of Algebra. The Fundamental Theorem of Algebra. zero in the complex number system.
 _.qd /7/ 9:6 AM Page 69 Section. Zeros of Polnomial Functions 69. Zeros of Polnomial Functions What ou should learn Use the Fundamental Theorem of Algebra to determine the number of zeros of polnomial
Graphic Designing with Transformed Functions
 Name Class The teacher will display the completed example to the right as an example to re-create. Work to make the image of the letter M on your handheld. Transformations of parabolas, domain restrictions,
Graphing Quadratic Equations
 .4 Graphing Quadratic Equations.4 OBJECTIVE. Graph a quadratic equation b plotting points In Section 6.3 ou learned to graph first-degree equations. Similar methods will allow ou to graph quadratic equations
Lines, Lines, Lines!!! Slope-Intercept Form ~ Lesson Plan
 Lines, Lines, Lines!!! Slope-Intercept Form ~ Lesson Plan I. Topic: Slope-Intercept Form II. III. Goals and Objectives: A. The student will write an equation of a line given information about its graph.
GeoGebra. 10 lessons. Gerrit Stols
 GeoGebra in 10 lessons Gerrit Stols Acknowledgements GeoGebra is dynamic mathematics open source (free) software for learning and teaching mathematics in schools. It was developed by Markus Hohenwarter
Solving Quadratic Equations by Graphing. Consider an equation of the form. y ax 2 bx c a 0. In an equation of the form
 SECTION 11.3 Solving Quadratic Equations b Graphing 11.3 OBJECTIVES 1. Find an ais of smmetr 2. Find a verte 3. Graph a parabola 4. Solve quadratic equations b graphing 5. Solve an application involving
1.6. Piecewise Functions. LEARN ABOUT the Math. Representing the problem using a graphical model
 . Piecewise Functions YOU WILL NEED graph paper graphing calculator GOAL Understand, interpret, and graph situations that are described b piecewise functions. LEARN ABOUT the Math A cit parking lot uses
Linear Equations in Two Variables
 Section. Sets of Numbers and Interval Notation 0 Linear Equations in Two Variables. The Rectangular Coordinate Sstem and Midpoint Formula. Linear Equations in Two Variables. Slope of a Line. Equations
E XPLORING QUADRILATERALS
 E XPLORING QUADRILATERALS E 1 Geometry State Goal 9: Use geometric methods to analyze, categorize and draw conclusions about points, lines, planes and space. Statement of Purpose: The activities in this
MATH 110 College Algebra Online Families of Functions Transformations
 MATH 110 College Algebra Online Families of Functions Transformations Functions are important in mathematics. Being able to tell what family a function comes from, its domain and range and finding a function
Algebra II Notes Piecewise Functions Unit 1.5. Piecewise linear functions. Math Background
 Piecewise linear functions Math Background Previousl, ou Related a table of values to its graph. Graphed linear functions given a table or an equation. In this unit ou will Determine when a situation requiring
Imagine a cube with any side length. Imagine increasing the height by 2 cm, the. Imagine a cube. x x
 OBJECTIVES Eplore functions defined b rddegree polnomials (cubic functions) Use graphs of polnomial equations to find the roots and write the equations in factored form Relate the graphs of polnomial equations
Unit 3: Day 2: Factoring Polynomial Expressions
 Unit 3: Day : Factoring Polynomial Expressions Minds On: 0 Action: 45 Consolidate:10 Total =75 min Learning Goals: Extend knowledge of factoring to factor cubic and quartic expressions that can be factored
LESSON EIII.E EXPONENTS AND LOGARITHMS
 LESSON EIII.E EXPONENTS AND LOGARITHMS LESSON EIII.E EXPONENTS AND LOGARITHMS OVERVIEW Here s what ou ll learn in this lesson: Eponential Functions a. Graphing eponential functions b. Applications of eponential
Algebra 2 Unit 10 Tentative Syllabus Cubics & Factoring
 Name Algebra Unit 10 Tentative Sllabus Cubics & Factoring DATE CLASS ASSIGNMENT Tuesda Da 1: S.1 Eponent s P: -1, -7 Jan Wednesda Da : S.1 More Eponent s P: 9- Jan Thursda Da : Graphing the cubic parent
Slope-Intercept Form and Point-Slope Form
 Slope-Intercept Form and Point-Slope Form In this section we will be discussing Slope-Intercept Form and the Point-Slope Form of a line. We will also discuss how to graph using the Slope-Intercept Form.
Years after 2000. US Student to Teacher Ratio 0 16.048 1 15.893 2 15.900 3 15.900 4 15.800 5 15.657 6 15.540
 To complete this technology assignment, you should already have created a scatter plot for your data on your calculator and/or in Excel. You could do this with any two columns of data, but for demonstration
TImath.com Algebra 1. Absolutely!
 Absolutely! ID: 8791 Time required 45 minutes Activity Overview In this activity, students first solve linear absolute value equations in a single variable using the definition of absolute value to write
Solving Systems of Linear Equations Substitutions
 Solving Systems of Linear Equations Substitutions Outcome (learning objective) Students will accurately solve a system of equations algebraically using substitution. Student/Class Goal Students thinking
Downloaded from www.heinemann.co.uk/ib. equations. 2.4 The reciprocal function x 1 x
 Functions and equations Assessment statements. Concept of function f : f (); domain, range, image (value). Composite functions (f g); identit function. Inverse function f.. The graph of a function; its
Exponential and Logarithmic Functions
 Chapter 6 Eponential and Logarithmic Functions Section summaries Section 6.1 Composite Functions Some functions are constructed in several steps, where each of the individual steps is a function. For eample,
o Graph an expression as a function of the chosen independent variable to determine the existence of a minimum or maximum
 Two Parabolas Time required 90 minutes Teaching Goals:. Students interpret the given word problem and complete geometric constructions according to the condition of the problem.. Students choose an independent
Students Currently in Algebra 2 Maine East Math Placement Exam Review Problems
 Students Currently in Algebra Maine East Math Placement Eam Review Problems The actual placement eam has 100 questions 3 hours. The placement eam is free response students must solve questions and write
7.3 Parabolas. 7.3 Parabolas 505
 7. Parabolas 0 7. Parabolas We have alread learned that the graph of a quadratic function f() = a + b + c (a 0) is called a parabola. To our surprise and delight, we ma also define parabolas in terms of
Polynomials. Jackie Nicholas Jacquie Hargreaves Janet Hunter
 Mathematics Learning Centre Polnomials Jackie Nicholas Jacquie Hargreaves Janet Hunter c 26 Universit of Sdne Mathematics Learning Centre, Universit of Sdne 1 1 Polnomials Man of the functions we will
The Geometry of a Circle Geometry (Grades 10 or 11)
") The Geometry of a Circle Geometry (Grades 10 or 11) A 5 day Unit Plan using Geometers Sketchpad, graphing calculators, and various manipulatives (string, cardboard circles, Mira s, etc.). Dennis Kapatos
The Geometry of a Circle Geometry (Grades 10 or 11) A 5 day Unit Plan using Geometers Sketchpad, graphing calculators, and various manipulatives (string, cardboard circles, Mira s, etc.). Dennis Kapatos
Geometer s Sketchpad. Discovering the incenter of a triangle
 Geometer s Sketchpad Discovering the incenter of a triangle Name: Date: 1.) Open Geometer s Sketchpad (GSP 4.02) by double clicking the icon in the Start menu. The icon looks like this: 2.) Once the program
Section 7.2 Linear Programming: The Graphical Method
 Section 7.2 Linear Programming: The Graphical Method Man problems in business, science, and economics involve finding the optimal value of a function (for instance, the maimum value of the profit function
Acquisition Lesson Planning Form Key Standards addressed in this Lesson: MM2A2c Time allotted for this Lesson: 5 Hours
 Acquisition Lesson Planning Form Key Standards addressed in this Lesson: MM2A2c Time allotted for this Lesson: 5 Hours Essential Question: LESSON 2 Absolute Value Equations and Inequalities How do you
Systems of Linear Equations: Solving by Substitution
 8.3 Sstems of Linear Equations: Solving b Substitution 8.3 OBJECTIVES 1. Solve sstems using the substitution method 2. Solve applications of sstems of equations In Sections 8.1 and 8.2, we looked at graphing
Mathematical goals. Starting points. Materials required. Time needed
 Level SS6 of challenge: B SS6 Mathematical goals Starting points Materials required Time needed Representing 3D shapes To enable learners to: interpret 2D representations of 3D shapes; analyse 3D shapes
AP Calculus AB 2005 Scoring Guidelines Form B
 AP Calculus AB 5 coring Guidelines Form B The College Board: Connecting tudents to College uccess The College Board is a not-for-profit membership association whose mission is to connect students to college
Use order of operations to simplify. Show all steps in the space provided below each problem. INTEGER OPERATIONS
 ORDER OF OPERATIONS In the following order: 1) Work inside the grouping smbols such as parenthesis and brackets. ) Evaluate the powers. 3) Do the multiplication and/or division in order from left to right.
Pre-Calculus Math 12 First Assignment
 Name: Pre-Calculus Math 12 First Assignment This assignment consists of two parts, a review of function notation and an introduction to translating graphs of functions. It is the first work for the Pre-Calculus
Calculator Notes for the TI-Nspire and TI-Nspire CAS
 CHAPTER 4 Calculator Notes for the Note 4A: Function Notation The handheld uses function notation automatically. You can define a function in the Calculator, Graphs & Geometry, and Data & Statistics applications.
Creating an Access Database. To start an Access Database, you should first go into Access and then select file, new.
 To start an Access Database, you should first go into Access and then select file, new. Then on the right side of the screen, select Blank database. Give your database a name where it says db1 and save
F.IF.7b: Graph Root, Piecewise, Step, & Absolute Value Functions
 F.IF.7b: Graph Root, Piecewise, Step, & Absolute Value Functions F.IF.7b: Graph Root, Piecewise, Step, & Absolute Value Functions Analyze functions using different representations. 7. Graph functions expressed
Graphic Designing with Transformed Functions
 Math Objectives Students will be able to identify a restricted domain interval and use function translations and dilations to choose and position a portion of the graph accurately in the plane to match
Investigating Area Under a Curve
 Mathematics Investigating Area Under a Curve About this Lesson This lesson is an introduction to areas bounded by functions and the x-axis on a given interval. Since the functions in the beginning of the
Warm-Up y. What type of triangle is formed by the points A(4,2), B(6, 1), and C( 1, 3)? A. right B. equilateral C. isosceles D.
, B(6, 1), and C( 1, 3)? A. right B. equilateral C. isosceles D.") CST/CAHSEE: Warm-Up Review: Grade What tpe of triangle is formed b the points A(4,), B(6, 1), and C( 1, 3)? A. right B. equilateral C. isosceles D. scalene Find the distance between the points (, 5) and
CST/CAHSEE: Warm-Up Review: Grade What tpe of triangle is formed b the points A(4,), B(6, 1), and C( 1, 3)? A. right B. equilateral C. isosceles D. scalene Find the distance between the points (, 5) and
D.3. Angles and Degree Measure. Review of Trigonometric Functions
 APPENDIX D Precalculus Review D7 SECTION D. Review of Trigonometric Functions Angles and Degree Measure Radian Measure The Trigonometric Functions Evaluating Trigonometric Functions Solving Trigonometric
SECTION 2.2. Distance and Midpoint Formulas; Circles
 SECTION. Objectives. Find the distance between two points.. Find the midpoint of a line segment.. Write the standard form of a circle s equation.. Give the center and radius of a circle whose equation
Core Maths C2. Revision Notes
 Core Maths C Revision Notes November 0 Core Maths C Algebra... Polnomials: +,,,.... Factorising... Long division... Remainder theorem... Factor theorem... 4 Choosing a suitable factor... 5 Cubic equations...
Solving Special Systems of Linear Equations
 5. Solving Special Sstems of Linear Equations Essential Question Can a sstem of linear equations have no solution or infinitel man solutions? Using a Table to Solve a Sstem Work with a partner. You invest
Using the Area Model to Teach Multiplying, Factoring and Division of Polynomials
 visit us at www.cpm.org Using the Area Model to Teach Multiplying, Factoring and Division of Polynomials For more information about the materials presented, contact Chris Mikles mikles@cpm.org From CCA
Classifying Solutions to Systems of Equations
 CONCEPT DEVELOPMENT Mathematics Assessment Project CLASSROOM CHALLENGES A Formative Assessment Lesson Classifing Solutions to Sstems of Equations Mathematics Assessment Resource Service Universit of Nottingham
Method To Solve Linear, Polynomial, or Absolute Value Inequalities:
 Solving Inequalities An inequality is the result of replacing the = sign in an equation with ,, or. For example, 3x 2 < 7 is a linear inequality. We call it linear because if the < were replaced with
Find the Relationship: An Exercise in Graphing Analysis
 Find the Relationship: An Eercise in Graphing Analsis Computer 5 In several laborator investigations ou do this ear, a primar purpose will be to find the mathematical relationship between two variables.
Tessellating with Regular Polygons
 Tessellating with Regular Polygons You ve probably seen a floor tiled with square tiles. Squares make good tiles because they can cover a surface without any gaps or overlapping. This kind of tiling is
Graphing Linear Equations
 6.3 Graphing Linear Equations 6.3 OBJECTIVES 1. Graph a linear equation b plotting points 2. Graph a linear equation b the intercept method 3. Graph a linear equation b solving the equation for We are
Functions. MATH 160, Precalculus. J. Robert Buchanan. Fall 2011. Department of Mathematics. J. Robert Buchanan Functions
 Functions MATH 160, Precalculus J. Robert Buchanan Department of Mathematics Fall 2011 Objectives In this lesson we will learn to: determine whether relations between variables are functions, use function
Algebra and Functions Practice Quiz #1
 Help Profile My Bookmarks Logout Algebra and Functions Practice Quiz #1 20 Questions Directions: This quiz contains two types of questions. For questions 1-15, solve each problem and decide which is the
Contents. Sample worksheet from www.mathmammoth.com
 Contents Introduction... 4 Warmup: Mental Math 1... 8 Warmup: Mental Math 2... 10 Review: Addition and Subtraction... 12 Review: Multiplication and Division... 15 Balance Problems and Equations... 19 More
1. Then f has a relative maximum at x = c if f(c) f(x) for all values of x in some
 f(x) for all values of x in some") Section 3.1: First Derivative Test Definition. Let f be a function with domain D. 1. Then f has a relative maximum at x = c if f(c) f(x) for all values of x in some open interval containing c. The number
Section 3.1: First Derivative Test Definition. Let f be a function with domain D. 1. Then f has a relative maximum at x = c if f(c) f(x) for all values of x in some open interval containing c. The number
DISTANCE, CIRCLES, AND QUADRATIC EQUATIONS
 a p p e n d i g DISTANCE, CIRCLES, AND QUADRATIC EQUATIONS DISTANCE BETWEEN TWO POINTS IN THE PLANE Suppose that we are interested in finding the distance d between two points P (, ) and P (, ) in the
Functions and Graphs CHAPTER INTRODUCTION. The function concept is one of the most important ideas in mathematics. The study
 Functions and Graphs CHAPTER 2 INTRODUCTION The function concept is one of the most important ideas in mathematics. The stud 2-1 Functions 2-2 Elementar Functions: Graphs and Transformations 2-3 Quadratic
Examples of Tasks from CCSS Edition Course 3, Unit 5
 Examples of Tasks from CCSS Edition Course 3, Unit 5 Getting Started The tasks below are selected with the intent of presenting key ideas and skills. Not every answer is complete, so that teachers can
LMS User Manual LMS Grade Book NUST LMS lms.team@nust.edu.pk
 LMS User Manual LMS Grade Book NUST LMS lms.team@nust.edu.pk Setting up LMS Grade book Setting up LMS gradebook involves followings main steps: 1. Create gradebook categories 2. Add grade items in grade
GRADE 3 CURRICULUM COMPANION - ACTIVITIES PANOPLY SCHOOL DAYS ~ STUDENT ART TENT
 ACTIVITY ONE (BEFORE VISITNG PANOPLY SCHOOL DAYS) ART VOCABULARY Students will learn art related vocabulary words in order to better understand and evaluate what they observe in the Student Art Tent. Within
Core Maths C3. Revision Notes
 Core Maths C Revision Notes October 0 Core Maths C Algebraic fractions... Cancelling common factors... Multipling and dividing fractions... Adding and subtracting fractions... Equations... 4 Functions...
Create a Room Block in the Hotel Center?
 Create a Room Block in the Hotel Center? To create a room block for an event in the Hotel Center, click on the Room Blocks tab Click on the button to get to the add room block page Revised 6/1/10 by SignUp4
Chapter 8. Lines and Planes. By the end of this chapter, you will
 Chapter 8 Lines and Planes In this chapter, ou will revisit our knowledge of intersecting lines in two dimensions and etend those ideas into three dimensions. You will investigate the nature of planes
https://williamshartunionca.springboardonline.org/ebook/book/27e8f1b87a1c4555a1212b...
 of 19 9/2/2014 12:09 PM Answers Teacher Copy Plan Pacing: 1 class period Chunking the Lesson Example A #1 Example B Example C #2 Check Your Understanding Lesson Practice Teach Bell-Ringer Activity Students
PROPERTIES OF ELLIPTIC CURVES AND THEIR USE IN FACTORING LARGE NUMBERS
 PROPERTIES OF ELLIPTIC CURVES AND THEIR USE IN FACTORING LARGE NUMBERS A ver important set of curves which has received considerabl attention in recent ears in connection with the factoring of large numbers
USING ADOBE PhotoShop TO MEASURE EarthKAM IMAGES
 USING ADOBE PhotoShop TO MEASURE EarthKAM IMAGES By James H. Nicholson and Ellen Vaughan Charleston County School District CAN DO Project for the EarthKAM Teacher Training Institute Introduction EarthKAM
Course Outlines. 1. Name of the Course: Algebra I (Standard, College Prep, Honors) Course Description: ALGEBRA I STANDARD (1 Credit)
 Course Description: ALGEBRA I STANDARD (1 Credit)") Course Outlines 1. Name of the Course: Algebra I (Standard, College Prep, Honors) Course Description: ALGEBRA I STANDARD (1 Credit) This course will cover Algebra I concepts such as algebra as a language,
Course Outlines 1. Name of the Course: Algebra I (Standard, College Prep, Honors) Course Description: ALGEBRA I STANDARD (1 Credit) This course will cover Algebra I concepts such as algebra as a language,
Linear Equations. 5- Day Lesson Plan Unit: Linear Equations Grade Level: Grade 9 Time Span: 50 minute class periods By: Richard Weber
 Linear Equations 5- Day Lesson Plan Unit: Linear Equations Grade Level: Grade 9 Time Span: 50 minute class periods By: Richard Weber Tools: Geometer s Sketchpad Software Overhead projector with TI- 83
http://school-maths.com Gerrit Stols
 For more info and downloads go to: http://school-maths.com Gerrit Stols Acknowledgements GeoGebra is dynamic mathematics open source (free) software for learning and teaching mathematics in schools. It
Linear Inequality in Two Variables
 90 (7-) Chapter 7 Sstems of Linear Equations and Inequalities In this section 7.4 GRAPHING LINEAR INEQUALITIES IN TWO VARIABLES You studied linear equations and inequalities in one variable in Chapter.
FINAL EXAM REVIEW MULTIPLE CHOICE. Choose the one alternative that best completes the statement or answers the question.
 FINAL EXAM REVIEW MULTIPLE CHOICE. Choose the one alternative that best completes the statement or answers the question. Determine whether or not the relationship shown in the table is a function. 1) -
Functions and Their Graphs
 3 Functions and Their Graphs On a sales rack of clothes at a department store, ou see a shirt ou like. The original price of the shirt was $00, but it has been discounted 30%. As a preferred shopper, ou
When I was 3.1 POLYNOMIAL FUNCTIONS
 146 Chapter 3 Polnomial and Rational Functions Section 3.1 begins with basic definitions and graphical concepts and gives an overview of ke properties of polnomial functions. In Sections 3.2 and 3.3 we
ACT Math Vocabulary. Altitude The height of a triangle that makes a 90-degree angle with the base of the triangle. Altitude
 ACT Math Vocabular Acute When referring to an angle acute means less than 90 degrees. When referring to a triangle, acute means that all angles are less than 90 degrees. For eample: Altitude The height
1.6. Piecewise Functions. LEARN ABOUT the Math. Representing the problem using a graphical model
 1.6 Piecewise Functions YOU WILL NEED graph paper graphing calculator GOAL Understand, interpret, and graph situations that are described by piecewise functions. LEARN ABOUT the Math A city parking lot
2.3 TRANSFORMATIONS OF GRAPHS
 78 Chapter Functions 7. Overtime Pa A carpenter earns $0 per hour when he works 0 hours or fewer per week, and time-and-ahalf for the number of hours he works above 0. Let denote the number of hours he
Creating Graphs. Learning Objective-To create graphs that show data.
 Creating Graphs Summary- Key Words- Students will be able to identify graphs, components of graphs, interpret graphs, and construct various types of graphs. Pictograph Bar Graph Circle Graph Background
THE POWER RULES. Raising an Exponential Expression to a Power
 8 (5-) Chapter 5 Eponents and Polnomials 5. THE POWER RULES In this section Raising an Eponential Epression to a Power Raising a Product to a Power Raising a Quotient to a Power Variable Eponents Summar
Graphing in excel on the Mac
 Graphing in excel on the Mac Quick Reference for people who just need a reminder The easiest thing is to have a single series, with y data in the column to the left of the x- data. Select the data and
Pearson s Correlation Coefficient
 Pearson s Correlation Coefficient In this lesson, we will find a quantitative measure to describe the strength of a linear relationship (instead of using the terms strong or weak). A quantitative measure
Lesson 3 Using the Sine Function to Model Periodic Graphs
 Lesson 3 Using the Sine Function to Model Periodic Graphs Objectives After completing this lesson you should 1. Know that the sine function is one of a family of functions which is used to model periodic