MICROECONOMICS II. Author: Gergely K hegyi. Supervised by Gergely K hegyi. February 2011
|
|
|
- Louisa Watkins
- 7 years ago
- Views:
Transcription
1 MICROECONOMICS II. Sponsored by a Grant TÁMOP /2/A/KMR Course Material Developed by Department of Economics, Faculty of Social Sciences, Eötvös Loránd University Budapest (ELTE) Department of Economics, Eötvös Loránd University Budapest Institute of Economics, Hungarian Academy of Sciences Balassi Kiadó, Budapest Author: Gergely K hegyi Supervised by Gergely K hegyi February

2 ELTE Faculty of Social Sciences, Department of Economics MICROECONOMICS II. week 1 Factor markets and income distribution, part 2 Gergely K hegyi Prepared by: Gergely K hegyi, using Jack Hirshleifer, Amihai Glazer és David Hirshleifer (2009) Mikroökonómia. Budapest: Osiris Kiadó, ELTECON-könyvek (henceforth: HGH), and Kertesi Gábor (ed.) (2004) Mikroökonómia el adásvázlatok. kertesi/kertesimikro/ (henceforth: KG). Endowment; buying and selling Where does income come from? So far we have considered I income as given in p 1 x 1 + p 2 x 2 = I budget constraint. Let's assume that we have ω 1, ω 2 amounts from the consumed goods, where (ω 1 0, ω 2 0). In this space of goods (ω 1, ω 2 ) is the vector of endowment. Self-suciency (autarchy): x 1 = ω 1, x 2 = ω 2, U(ω 1, ω 2 ). If market exchange of goods is possible (taking p 1, p 2 prices as given), total income from selling the goods is: I = p 1 ω 1 + p 2 ω 2 The new budget constraint (utility function is unchanged): p 1 x 1 + p 2 x 2 = p 1 ω 1 + p 2 ω 2 Lagrange-function: L = U(x 1, x 2 ) λ(p 1 x 1 + p 2 x 2 p 1 ω 1 p 2 ω 2 ) Demand: x i (p 1, p 2, ω 1, ω 2 ) Net demand: x N i = x i ω i Buying: x N i > 0, selling: x N i < 0 2

3 Endowment eect Slutsky theorem with Slutsky decomposition: Change in demand due to income change: Change in income due to price change: I p j x M i I = ω j (E.g.: (p 1ω 1+p 2ω 2) p 1 = ω 1 Endowment eect: Slutsky theorem: x M i I ω j E.g.: x M i p j = xs i p j xm I (x j ω j ) x M (p 1, p 2, p 1 x 1 + p 2 x 2) p 1 = 3
 x M (p 1, p 2, p 1 x 1 + p 2 x 2) p")
4 x S (p 1, p 2, x 1, x 2) xm p 1 I (x 1 ω 1 ) Optimal decision of the resource owner Work time and freetime Income: I Working hours: L Freetime (hours): R "Disposable" time (hours): R L + R = R Wage (price of a working hour and also the price of a freetime hour): h L = I R Total income: I = Ī + h LL, where Ī is the starting income (not from work). Budget constraint: h L R + I = h L R + Ī Utility function (with respect to free time and income): U(I, R) Both income and freetime are goods (as opposed to bads): U I Utility function (with respect to work hours and income): U(I, L) Income is a goods while work is a bad: U I Marginal rate of substitution: U > 0; L < 0 MRS R I R U MU R MU I Lagrange function: L = U(R, I) λ(h L R + I h L R Ī) First order condition: L R = MU R λh L = 0 L I = MU I λ = 0 h L R + I h L R Ī = 0 U > 0; R > 0 Optimum condition: MU R MU I = h L Optimum The E staring endowment consists of Ī income and R freetime. The (absolute value of the) slope of the budget constraint equals the hourly wage (rental fee) which one can gain by sacricing free time. The G point is the optimal decision of the resource-owner. 4
: U(I, L) Income is a goods while work is a bad: U I Marginal rate of substitution: U > 0; L < 0 MRS R I R U MU R MU I Lagrange function: L = U(R, I) λ(h L R + I h L R Ī)")
5 Income and price change 5
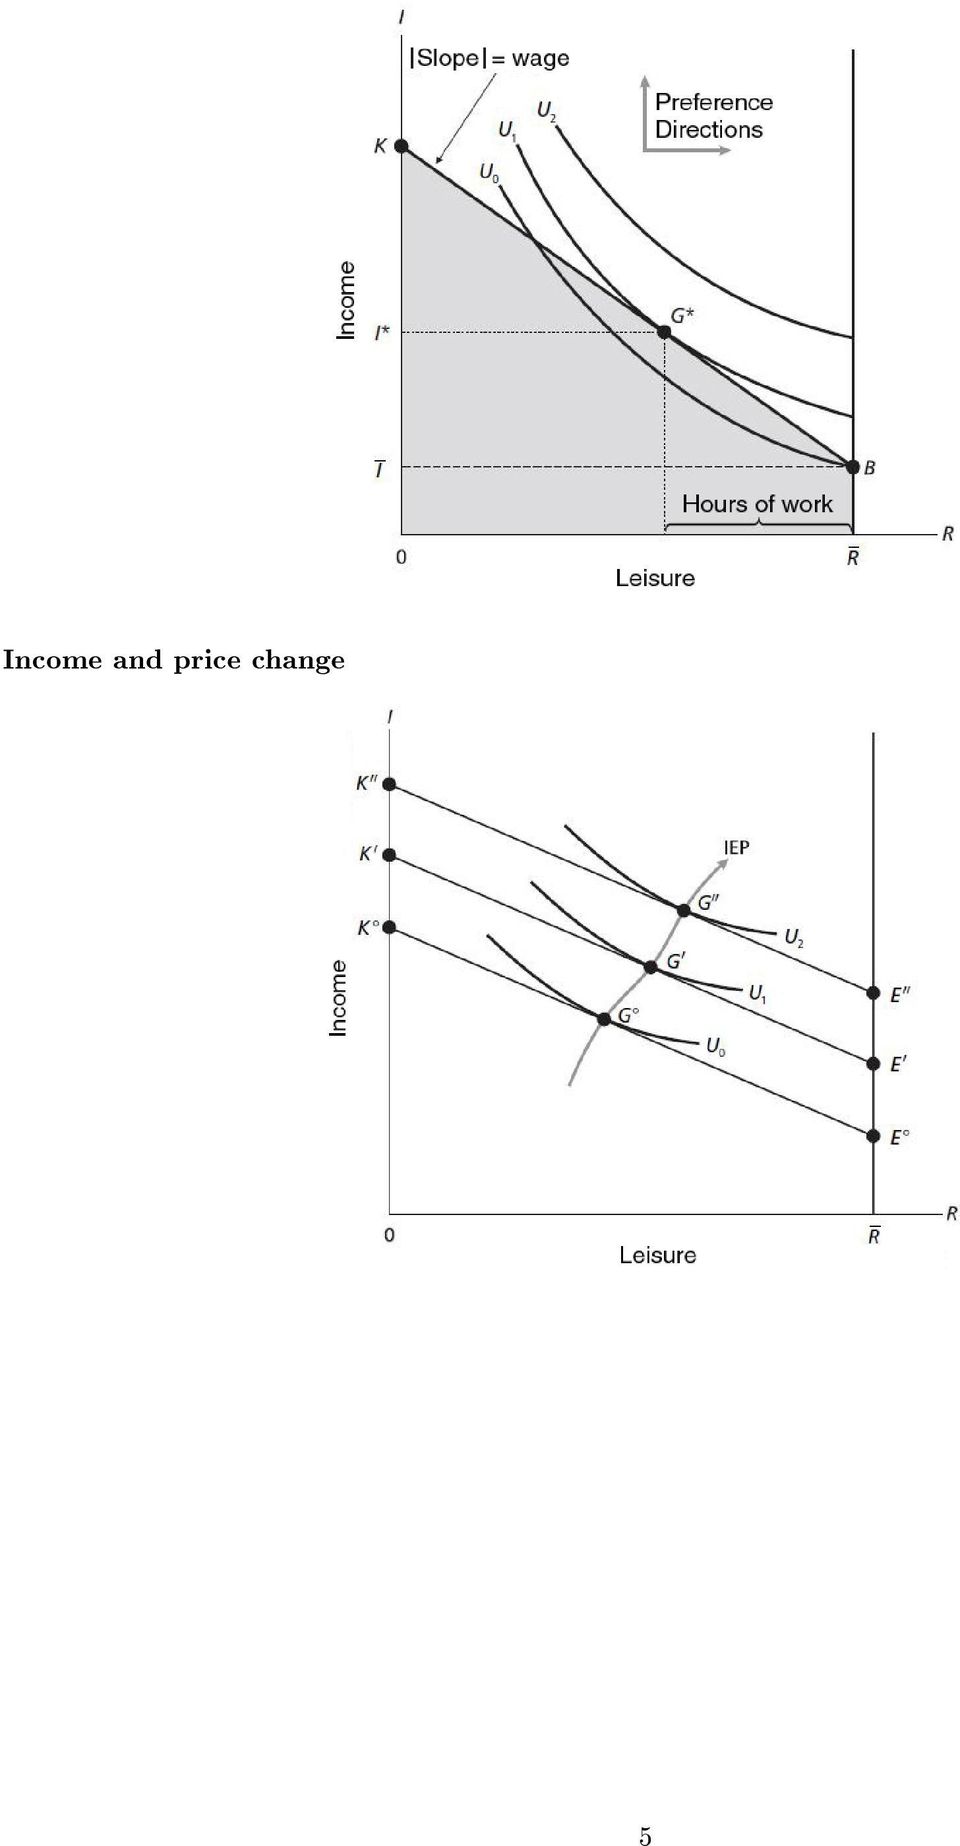
6 1. Statement. Changing the h L rental fee has an income and opposite sign substitution eect. With low income the substitution eect is larger: if someone works at all, with larger h L will make her work more. With higher income income eect can counteract substitution eect: increasing wages can act as an incentive to decrease work hours. Supply of labor The slope of the individual supply curve of labor is positive until the h L wage level, then it "bends back". Welfare and social security Eect of welfare Without any welfare the individual optimum is at G point on the U 0 utility function, where the employee would earn 7000 dollars, and would work = 250 days a year. If the welfare system guarantees a 6000 dollar minimum wage, (supplementing her wage if it is under this level) the real budget constraint will be MLK curve, with a break at L. 6

7 Labor force participation rates in the US Year man over 60 man over , , ,5 2010* 19,5 * forecast Source: Hirshleifer et al., 2009, 504. Equilibrium on the factor markets Labor market Labor market equilibrium Aggregate labor demand (D L ) and aggregate labor supply (S L ) curves. Equilibrium wage: h L Employment rate: L 7

8 Factors inuencing the labor market Demand side eects Technology. The level of technological development aects the marginal product functions of dierent resources and also the interaction between them. Demand for the nal product. The consumer preferences aect the demand for the nal product, and this indirectly aects the marginal product functions of the dierent resources used for the given nal product. Supply of complementary or substitute resources. The supply of complementary or substitute resources (depending on the strength of interaction) aect the marginal product of a given resource. Supply side eects Preferences.The preferences of the employees over work and leisure time, and over dierent jobs or occupations aects the shape of the resource-supply curves. Wealth. Preferences are aected by individual wealth. Richer people tend to keep most of their resources. So the greater one's wealth is, ceteris paribus, the less she is likely to oer for sale on the market. Demography. The size of the population, and also its age and sex composition also aects the labormarket supply; moreover it could also aect the supply of land and other resources. (Remember the example of black death in the previous chapter!) Social forces and laws. There are several jobs that woman could not have done (and cannot do still today). Child labor is still illegal in most countries. Laws can also constrain the use of land or other resources for dierent reasons (e.g. environmental protection). Potential reason for increasing gender wage gap Changes in wage dierences in the USA, (1963=100) Possible explanations: Year 90. percentile median 10. percentile Source: Hirshleifer et al., 2009, 516. International competition. Barriers of international trade have decreased over the last couple of decades. The expansion of trade and the growing international division of labor have increased the real wages internationally. Some groups, however, have suered. Uneducated low wage American labor have to compete with even lower waged Chinese, Indian, etc., uneducated labor force. On the other hand, highly educated European, Japanese, etc., labor also puts up a competition for the well educated highly paid Americans. It is not evident, therefore, that free trade, alone, would have increased wage dierences within the US. Technological change. The development of computers and other technology intensive jobs have increased the demand for high skills (analytical skills, adaptability, etc.). Low skilled labor, who can oer no more than physical strength, cannot prot from this (only as a consumer). On the other side the level of education of the US population have also increased. Thus the demand for as well as the supply of highly educated workforce have increased. So the net eect of technological change on wage dierences is not evident. 8
 aect the marginal product of a given resource.")
9 Immigration. Mostly low skilled people have immigrated to the US (mainly from Latin-America and Asia). Their involvement in the US labor market have lowered wages in the bottom part of the wage distribution. And, due to the supplementary nature of these resources, it also increased wages near the top of the distribution. Immigration have evidently increased wage dierences within the US. (However it also decreased dierences between countries.) Weakening of trade unions. Resource side trade unions, acting as cartels, can manage to increase wages. The membership of these have fallen in the last decades so their pressure on wages have also decreased. Trade unions, however, are more likely to represent workers near the middle of the wage distribution (or above). So the weakening of trade unions cannot be the reason in the decrease of lower wage position. We have to mention two more speculative reasons: "Winner takes all" type markets. According to this theory workers today compete for one big price, instead of several small ones. Earlier smaller towns had theaters, opera halls, gymnastic clubs, and other smaller businesses which have disappeared. Due to better communication and transportation possibilities consumers are served by world wide chain stores, and entertained by world class superstars. Possibilities of lesser skilled have therefore narrowed down. (Note that this logic leads to the decease of wages of the middle and not of the bottom.) Paradox of increasing possibilities. Lower mobility societies, where the birth class constrained the choices one could make, and choose only from the occupations available for the given class, the level of born skills was approximately evenly distributed across classes. So even if a talented son of a shoemaker could only become a shoemaker, he would become a very good one of that, so consumers would pay a lot more for him. A more mobile society, however, allows the best to climb up faster on the class hierarchy, and leave their birth class. So this leads to the observation, that lower class people will also become less skilled, with lower possibilities on the labor market. Owning more factors Leisure time: R Capital: K j, (j = 1,..., m) Endowments (of goods): ω i, (i = 1,..., n) Property: E k, (k = 1,..., r) Etc. Utility function: U(R, x 1,..., x n, K 1,..., K m, E 1,..., E r,...) max Budget constraint: h l R + p 1x p nx n + h 1K h mk m + τ 1E τ re r +... = h l R + p1ω p nω n + h 1 K h m Km + τ 1 Ē τ r Ē r
 Weakening of trade unions. Resource side trade unions, acting as cartels, can manage to increase wages.")
10 Factor market monopolies Trade union membership in the private and the public sector (million employees, ratio of trade union members) total empl. trade union memb. total empl. trade union memb. million million % million million % Private sector 71,2 11, ,6 8,7 8 Public sector 15,6 5, ,4 7,3 38 Source: Hirshleifer et al., 2009,520. Functional income distribution Conventional classication: Labor, Capital, Land LAND VERSUS CAPITAL. Land was traditionally dened as "the power of the natural and inexhaustible soil", while capital was "instrument used to produce". The "power of the soil" (fertility, location... etc.), however, is often the result of human activity. People have discovered the American continent, or have drained the great swamps in England. We might think that land and capital diers in their supply: while the quantity of the land is xed (supply curve is vertical), the production made capital has an upward sloping curve. The supply of land is not xed, however. On the one hand it can grow as a result of rising prices: gain land from the ocean. On the other hand it could become infertile, or erode. Even if the quantity of land would be physically xed, the quantity available for the market would denitely react to changing prices, because the owners can always decide to keep it for themselves. LABOR VERSUS CAPITAL. Labor and capital cannot be separated "functionally". In a modern society people do not oer their sole physical strength, but their skills and other characteristics as well, which is based on their education and experiences. The capital is thus not only the tool, but can also be the "human capital". So the skill of people to do work is just as a "produced capital" as any other tool or machine. Sources of income in Great Britain (top 10 percent of the population) Capital, Yield, Interest England and Wales United Kingdom Land 13 1 Investments Labor Total Source: Hirshleifer et al., 2009, 523. Value of the dierent sources of wealth in the 15 southern states, prices, million dollars Value of property and personal belongings 8644 Value of agricultural land 2550 Value of machines, equipment in use 104 Value of live-endowment 515 Value of freed slavery 3685 Total Source: Hirshleifer et al., 2009,

11 Real capital Capital value 1. Denition. Real capital (or capital goods): physical sources of production services: land, buildings, labor force, etc. 2. Denition. Capital value: the value of real capital Yield of assets: Cash-Flow: z A Capital value (price of assets): p A Expected change in capital value during the year: p A Rate of return (ROR): ROR A = z A + p A p A 2. Statement. All yields of assets are equal in equlibrium ROR A = ROR B =... = r 1. Consequence. Interest is not the yield of an asset (named capital). The relation between interest rate and capital is the following: in equilibrium, interest rate equal the yield of capital value of all assets, or factor of production. In other words, interest rate is the ratio of the net revenue (cash-ow) and the price of any given asset (corrected for the yearly devaluation or appreciation), in equilibrium. Economic rent Economic rent The revenue of a given asset. 11
.")
MICROECONOMICS II. "B"
 MICROECONOMICS II. "B" Sponsored by a Grant TÁMOP-4.1.2-08/2/A/KMR-2009-0041 Course Material Developed by Department of Economics, Faculty of Social Sciences, Eötvös Loránd University Budapest (ELTE) Department
How To Understand The Theory Of Economic Theory
 MICROECONOMICS II. ELTE Faculty of Social Sciences, Department of Economics Microeconomics II. MARKET THEORY AND MARKETING, PART 3 Author: Supervised by February 2011 Prepared by:, using Jack Hirshleifer,
Intermediate Microeconomics (22014)
") Intermediate Microeconomics (22014) I. Consumer Instructor: Marc Teignier-Baqué First Semester, 2011 Outline Part I. Consumer 1. umer 1.1 Budget Constraints 1.2 Preferences 1.3 Utility Function 1.4 1.5
Intermediate Microeconomics (22014) I. Consumer Instructor: Marc Teignier-Baqué First Semester, 2011 Outline Part I. Consumer 1. umer 1.1 Budget Constraints 1.2 Preferences 1.3 Utility Function 1.4 1.5
AP Microeconomics Chapter 12 Outline
 I. Learning Objectives In this chapter students will learn: A. The significance of resource pricing. B. How the marginal revenue productivity of a resource relates to a firm s demand for that resource.
 1 The Market for Factors of Production Factors of Production are the inputs used to produce goods and services. The markets for these factors of production are similar to the markets for goods and services
Problem Set #5-Key. Economics 305-Intermediate Microeconomic Theory
 Problem Set #5-Key Sonoma State University Economics 305-Intermediate Microeconomic Theory Dr Cuellar (1) Suppose that you are paying your for your own education and that your college tuition is $200 per
MULTIPLE CHOICE. Choose the one alternative that best completes the statement or answers the question.
 MBA 640 Survey of Microeconomics Fall 2006, Quiz 6 Name MULTIPLE CHOICE. Choose the one alternative that best completes the statement or answers the question. 1) A monopoly is best defined as a firm that
THIRD EDITION. ECONOMICS and. MICROECONOMICS Paul Krugman Robin Wells. Chapter 19. Factor Markets and Distribution of Income
 THIRD EDITION ECONOMICS and MICROECONOMICS Paul Krugman Robin Wells Chapter 19 Factor Markets and Distribution of Income WHAT YOU WILL LEARN IN THIS CHAPTER How factors of production resources like land,
Microeconomics Instructor Miller Practice Problems Labor Market
 Microeconomics Instructor Miller Practice Problems Labor Market 1. What is a factor market? A) It is a market where financial instruments are traded. B) It is a market where stocks and bonds are traded.
Econ 202 Final Exam. Table 3-1 Labor Hours Needed to Make 1 Pound of: Meat Potatoes Farmer 8 2 Rancher 4 5
 Econ 202 Final Exam 1. If inflation expectations rise, the short-run Phillips curve shifts a. right, so that at any inflation rate unemployment is higher. b. left, so that at any inflation rate unemployment
Employment and Pricing of Inputs
 Employment and Pricing of Inputs Previously we studied the factors that determine the output and price of goods. In chapters 16 and 17, we will focus on the factors that determine the employment level
Demand, Supply, and Market Equilibrium
 3 Demand, Supply, and Market Equilibrium The price of vanilla is bouncing. A kilogram (2.2 pounds) of vanilla beans sold for $50 in 2000, but by 2003 the price had risen to $500 per kilogram. The price
POTENTIAL OUTPUT and LONG RUN AGGREGATE SUPPLY
 POTENTIAL OUTPUT and LONG RUN AGGREGATE SUPPLY Aggregate Supply represents the ability of an economy to produce goods and services. In the Long-run this ability to produce is based on the level of production
AK 4 SLUTSKY COMPENSATION
 AK 4 SLUTSKY COMPENSATION ECON 210 A. JOSEPH GUSE (1) (a) First calculate the demand at the original price p b = 2 b(p b,m) = 1000 20 5p b b 0 = b(2) = 40 In general m c = m+(p 1 b p0 b )b 0. If the price
Microeconomics Topic 3: Understand how various factors shift supply or demand and understand the consequences for equilibrium price and quantity.
 Microeconomics Topic 3: Understand how various factors shift supply or demand and understand the consequences for equilibrium price and quantity. Reference: Gregory Mankiw s rinciples of Microeconomics,
Notes - Gruber, Public Finance Chapter 20.3 A calculation that finds the optimal income tax in a simple model: Gruber and Saez (2002).
.") Notes - Gruber, Public Finance Chapter 20.3 A calculation that finds the optimal income tax in a simple model: Gruber and Saez (2002). Description of the model. This is a special case of a Mirrlees model.
Notes - Gruber, Public Finance Chapter 20.3 A calculation that finds the optimal income tax in a simple model: Gruber and Saez (2002). Description of the model. This is a special case of a Mirrlees model.
INTRODUCTION THE LABOR MARKET LABOR SUPPLY INCOME VS. LEISURE THE SUPPLY OF LABOR
 INTRODUCTION Chapter 15 THE LBOR MRKET This chapter covers why there are differences in wages: How do people decide how much time to spend working? What determines the wage rate an employer is willing
Homework #5: Answers. b. How can land rents as well as total wages be shown in such a diagram?
 Homework #5: Answers Text questions, hapter 6, problems 1-4. Note that in all of these questions, the convention in the text, whereby production of food uses land and labor, and clothing uses capital and
I. Introduction to Aggregate Demand/Aggregate Supply Model
 University of California-Davis Economics 1B-Intro to Macro Handout 8 TA: Jason Lee Email: jawlee@ucdavis.edu I. Introduction to Aggregate Demand/Aggregate Supply Model In this chapter we develop a model
THE MARKET OF FACTORS OF PRODUCTION
 THE MARKET OF FACTORS OF PRODUCTION The basis of the economy is the production of goods and services. Economics distinguishes between 3 factors of production which are used in the production of goods:
Constrained optimization.
 ams/econ 11b supplementary notes ucsc Constrained optimization. c 2010, Yonatan Katznelson 1. Constraints In many of the optimization problems that arise in economics, there are restrictions on the values
Practice Multiple Choice Questions Answers are bolded. Explanations to come soon!!
 Practice Multiple Choice Questions Answers are bolded. Explanations to come soon!! For more, please visit: http://courses.missouristate.edu/reedolsen/courses/eco165/qeq.htm Market Equilibrium and Applications
For instance between 1960 and 2000 the average hourly output produced by US workers rose by 140 percent.
 Causes of shifts in labor demand curve The labor demand curve shows the value of the marginal product of labor as a function of quantity of labor hired. Using this fact, it can be seen that the following
Pre-Test Chapter 25 ed17
 Pre-Test Chapter 25 ed17 Multiple Choice Questions 1. Refer to the above graph. An increase in the quantity of labor demanded (as distinct from an increase in demand) is shown by the: A. shift from labor
CHAPTER 13 MARKETS FOR LABOR Microeconomics in Context (Goodwin, et al.), 2 nd Edition
, 2 nd Edition") CHAPTER 13 MARKETS FOR LABOR Microeconomics in Context (Goodwin, et al.), 2 nd Edition Chapter Summary This chapter deals with supply and demand for labor. You will learn about why the supply curve for
CHAPTER 13 MARKETS FOR LABOR Microeconomics in Context (Goodwin, et al.), 2 nd Edition Chapter Summary This chapter deals with supply and demand for labor. You will learn about why the supply curve for
TRADE UNION MEMBERSHIP 2014. Statistical Bulletin JUNE 2015
 TRADE UNION MEMBERSHIP 2014 Statistical Bulletin JUNE 2015 Contents Contents... 2 Introduction... 3 Key findings... 5 1. Long Term Trends... 6 2.Private and Public Sectors. 12 3. Personal and job characteristics...
Monopoly WHY MONOPOLIES ARISE
 In this chapter, look for the answers to these questions: Why do monopolies arise? Why is MR < P for a monopolist? How do monopolies choose their P and Q? How do monopolies affect society s well-being?
Prot Maximization and Cost Minimization
 Simon Fraser University Prof. Karaivanov Department of Economics Econ 0 COST MINIMIZATION Prot Maximization and Cost Minimization Remember that the rm's problem is maximizing prots by choosing the optimal
MICROECONOMICS AND POLICY ANALYSIS - U8213 Professor Rajeev H. Dehejia Class Notes - Spring 2001
 MICROECONOMICS AND POLICY ANALYSIS - U8213 Professor Rajeev H. Dehejia Class Notes - Spring 2001 General Equilibrium and welfare with production Wednesday, January 24 th and Monday, January 29 th Reading:
Pure Competition urely competitive markets are used as the benchmark to evaluate market
 R. Larry Reynolds Pure Competition urely competitive markets are used as the benchmark to evaluate market P performance. It is generally believed that market structure influences the behavior and performance
SUPPLY AND DEMAND : HOW MARKETS WORK
 SUPPLY AND DEMAND : HOW MARKETS WORK Chapter 4 : The Market Forces of and and demand are the two words that economists use most often. and demand are the forces that make market economies work. Modern
Health Economics Demand for health capital Gerald J. Pruckner University of Linz & Lecture Notes, Summer Term 2010 Demand for health capital 1 / 31
 Health Economics Demand for health capital University of Linz & Gerald J. Pruckner Lecture Notes, Summer Term 2010 Demand for health capital 1 / 31 An individual s production of health The Grossman model:
Chapter 13. Aggregate Demand and Aggregate Supply Analysis
 Chapter 13. Aggregate Demand and Aggregate Supply Analysis Instructor: JINKOOK LEE Department of Economics / Texas A&M University ECON 203 502 Principles of Macroeconomics In the short run, real GDP and
Economics 100 Exam 2
 Name: 1. During the long run: Economics 100 Exam 2 A. Output is limited because of the law of diminishing returns B. The scale of operations cannot be changed C. The firm must decide how to use the current
2 0 0 0 E D I T I O N CLEP O F F I C I A L S T U D Y G U I D E. The College Board. College Level Examination Program
 2 0 0 0 E D I T I O N CLEP O F F I C I A L S T U D Y G U I D E College Level Examination Program The College Board Principles of Macroeconomics Description of the Examination The Subject Examination in
Common sense, and the model that we have used, suggest that an increase in p means a decrease in demand, but this is not the only possibility.
 Lecture 6: Income and Substitution E ects c 2009 Je rey A. Miron Outline 1. Introduction 2. The Substitution E ect 3. The Income E ect 4. The Sign of the Substitution E ect 5. The Total Change in Demand
Chapter 9. The IS-LM/AD-AS Model: A General Framework for Macroeconomic Analysis. 2008 Pearson Addison-Wesley. All rights reserved
 Chapter 9 The IS-LM/AD-AS Model: A General Framework for Macroeconomic Analysis Chapter Outline The FE Line: Equilibrium in the Labor Market The IS Curve: Equilibrium in the Goods Market The LM Curve:
Econ 101: Principles of Microeconomics
 Econ 101: Principles of Microeconomics Chapter 12 - Behind the Supply Curve - Inputs and Costs Fall 2010 Herriges (ISU) Ch. 12 Behind the Supply Curve Fall 2010 1 / 30 Outline 1 The Production Function
 1 Monopoly Why Monopolies Arise? Monopoly is a rm that is the sole seller of a product without close substitutes. The fundamental cause of monopoly is barriers to entry: A monopoly remains the only seller
ECON 443 Labor Market Analysis Final Exam (07/20/2005)
") ECON 443 Labor Market Analysis Final Exam (07/20/2005) I. Multiple-Choice Questions (80%) 1. A compensating wage differential is A) an extra wage that will make all workers willing to accept undesirable
ECON 443 Labor Market Analysis Final Exam (07/20/2005) I. Multiple-Choice Questions (80%) 1. A compensating wage differential is A) an extra wage that will make all workers willing to accept undesirable
BPE_MIC1 Microeconomics 1 Fall Semester 2011
 Masaryk University - Brno Department of Economics Faculty of Economics and Administration BPE_MIC1 Microeconomics 1 Fall Semester 2011 Final Exam - 05.12.2011, 9:00-10:30 a.m. Test A Guidelines and Rules:
MULTIPLE CHOICE. Choose the one alternative that best completes the statement or answers the question.
 Chapter 6 - Markets in Action - Sample Questions MULTIPLE CHOICE. Choose the one alternative that best completes the statement or answers the question. 1) The short-run impact of the San Francisco earthquake
Economics 201 Fall 2010 Introduction to Economic Analysis Problem Set #6 Due: Wednesday, November 3
 Economics 201 Fall 2010 Introduction to Economic Analysis Jeffrey Parker Problem Set #6 Due: Wednesday, November 3 1. Cournot Duopoly. Bartels and Jaymes are two individuals who one day discover a stream
7 AGGREGATE SUPPLY AND AGGREGATE DEMAND* Chapter. Key Concepts
 Chapter 7 AGGREGATE SUPPLY AND AGGREGATE DEMAND* Key Concepts Aggregate Supply The aggregate production function shows that the quantity of real GDP (Y ) supplied depends on the quantity of labor (L ),
Envelope Theorem. Kevin Wainwright. Mar 22, 2004
 Envelope Theorem Kevin Wainwright Mar 22, 2004 1 Maximum Value Functions A maximum (or minimum) value function is an objective function where the choice variables have been assigned their optimal values.
The Aggregate Demand- Aggregate Supply (AD-AS) Model
 Model") The AD-AS Model The Aggregate Demand- Aggregate Supply (AD-AS) Model Chapter 9 The AD-AS Model addresses two deficiencies of the AE Model: No explicit modeling of aggregate supply. Fixed price level. 2
The AD-AS Model The Aggregate Demand- Aggregate Supply (AD-AS) Model Chapter 9 The AD-AS Model addresses two deficiencies of the AE Model: No explicit modeling of aggregate supply. Fixed price level. 2
LECTURE NOTES ON MACROECONOMIC PRINCIPLES
 LECTURE NOTES ON MACROECONOMIC PRINCIPLES Peter Ireland Department of Economics Boston College peter.ireland@bc.edu http://www2.bc.edu/peter-ireland/ec132.html Copyright (c) 2013 by Peter Ireland. Redistribution
Consumers face constraints on their choices because they have limited incomes.
 Consumer Choice: the Demand Side of the Market Consumers face constraints on their choices because they have limited incomes. Wealthy and poor individuals have limited budgets relative to their desires.
4 THE MARKET FORCES OF SUPPLY AND DEMAND
 4 THE MARKET FORCES OF SUPPLY AND DEMAND IN THIS CHAPTER YOU WILL Learn what a competitive market is Examine what determines the demand for a good in a competitive market Chapter Overview Examine what
Microeconomics Topic 6: Be able to explain and calculate average and marginal cost to make production decisions.
 Microeconomics Topic 6: Be able to explain and calculate average and marginal cost to make production decisions. Reference: Gregory Mankiw s Principles of Microeconomics, 2 nd edition, Chapter 13. Long-Run
The Cost of Production
 The Cost of Production 1. Opportunity Costs 2. Economic Costs versus Accounting Costs 3. All Sorts of Different Kinds of Costs 4. Cost in the Short Run 5. Cost in the Long Run 6. Cost Minimization 7. The
Labor Demand The Labor Market
 Labor Demand The Labor Market 1. Labor demand 2. Labor supply Assumptions Hold capital stock fixed (for now) Workers are all alike. We are going to ignore differences in worker s aptitudes, skills, ambition
Theoretical Tools of Public Economics. Part-2
 Theoretical Tools of Public Economics Part-2 Previous Lecture Definitions and Properties Utility functions Marginal utility: positive (negative) if x is a good ( bad ) Diminishing marginal utility Indifferences
Economics 212 Principles of Macroeconomics Study Guide. David L. Kelly
 Economics 212 Principles of Macroeconomics Study Guide David L. Kelly Department of Economics University of Miami Box 248126 Coral Gables, FL 33134 dkelly@miami.edu First Version: Spring, 2006 Current
Chapter 3 Consumer Behavior
 Chapter 3 Consumer Behavior Read Pindyck and Rubinfeld (2013), Chapter 3 Microeconomics, 8 h Edition by R.S. Pindyck and D.L. Rubinfeld Adapted by Chairat Aemkulwat for Econ I: 2900111 1/29/2015 CHAPTER
Chapter 7 Monopoly, Oligopoly and Strategy
 Chapter 7 Monopoly, Oligopoly and Strategy After reading Chapter 7, MONOPOLY, OLIGOPOLY AND STRATEGY, you should be able to: Define the characteristics of Monopoly and Oligopoly, and explain why the are
Theory of Demand. ECON 212 Lecture 7. Tianyi Wang. Winter 2013. Queen s Univerisity. Tianyi Wang (Queen s Univerisity) Lecture 7 Winter 2013 1 / 46
 Lecture 7 Winter 2013 1 / 46") Theory of Demand ECON 212 Lecture 7 Tianyi Wang Queen s Univerisity Winter 2013 Tianyi Wang (Queen s Univerisity) Lecture 7 Winter 2013 1 / 46 Intro Note: Quiz 1 can be picked up at Distribution Center.
Theory of Demand ECON 212 Lecture 7 Tianyi Wang Queen s Univerisity Winter 2013 Tianyi Wang (Queen s Univerisity) Lecture 7 Winter 2013 1 / 46 Intro Note: Quiz 1 can be picked up at Distribution Center.
Principles of Economics: Micro: Exam #2: Chapters 1-10 Page 1 of 9
 Principles of Economics: Micro: Exam #2: Chapters 1-10 Page 1 of 9 print name on the line above as your signature INSTRUCTIONS: 1. This Exam #2 must be completed within the allocated time (i.e., between
At the end of Chapter 18, you should be able to answer the following:
 1 How to Study for Chapter 18 Pure Monopoly Chapter 18 considers the opposite of perfect competition --- pure monopoly. 1. Begin by looking over the Objectives listed below. This will tell you the main
Demand, Supply and Elasticity
 Demand, Supply and Elasticity CHAPTER 2 OUTLINE 2.1 Demand and Supply Definitions, Determinants and Disturbances 2.2 The Market Mechanism 2.3 Changes in Market Equilibrium 2.4 Elasticities of Supply and
April 4th, 2014. Flow C was 9 trillion dollars, Flow G was 2 trillion dollars, Flow I was 3 trillion dollars, Flow (X-M) was -0.7 trillion dollars.
 was -0.7 trillion dollars.") Problem Session I April 4th, 2014 Reference: Parkin, Introduction to economics, 2011 1. The rm that printed your Introduction to economics textbook bought the paper from XYZ Paper Mills. Was this purchase
Problem Session I April 4th, 2014 Reference: Parkin, Introduction to economics, 2011 1. The rm that printed your Introduction to economics textbook bought the paper from XYZ Paper Mills. Was this purchase
Introduction to microeconomics
 RELEVANT TO ACCA QUALIFICATION PAPER F1 / FOUNDATIONS IN ACCOUNTANCY PAPER FAB Introduction to microeconomics The new Paper F1/FAB, Accountant in Business carried over many subjects from its Paper F1 predecessor,
Microeconomics. Lecture Outline. Claudia Vogel. Winter Term 2009/2010. Part III Market Structure and Competitive Strategy
 Microeconomics Claudia Vogel EUV Winter Term 2009/2010 Claudia Vogel (EUV) Microeconomics Winter Term 2009/2010 1 / 25 Lecture Outline Part III Market Structure and Competitive Strategy 12 Monopolistic
QUIZ 3 14.02 Principles of Macroeconomics May 19, 2005. I. True/False (30 points)
") QUIZ 3 14.02 Principles of Macroeconomics May 19, 2005 I. True/False (30 points) 1. A decrease in government spending and a real depreciation is the right policy mix to improve the trade balance without
QUIZ 3 14.02 Principles of Macroeconomics May 19, 2005 I. True/False (30 points) 1. A decrease in government spending and a real depreciation is the right policy mix to improve the trade balance without
Introduction to Macroeconomics 1012 Final Exam Spring 2013 Instructor: Elsie Sawatzky
 Introduction to Macroeconomics 1012 Final Exam Spring 2013 Instructor: Elsie Sawatzky Name Time: 2 hours Marks: 80 Multiple choice questions 1 mark each and a choice of 2 out of 3 short answer question
14 : Elasticity of Supply
 14 : Elasticity of Supply 1 Recap from Session Budget line and Consumer equilibrium Law of Equi Marginal utility Price, income and substitution effect Consumer Surplus Session Outline Elasticity of Supply
CHAPTER 4 Labor Demand Elasticities
 CHAPTER 4 Labor Demand Elasticities In addition to the multiple choice problems listed below, complete the following end of chapter questions: Review questions 1,3, 4, 6 and 7. Problems 1, 2, 3 and 5.
MULTIPLE CHOICE. Choose the one alternative that best completes the statement or answers the question on the accompanying scantron.
 Principles of Microeconomics Fall 2007, Quiz #6 Name MULTIPLE CHOICE. Choose the one alternative that best completes the statement or answers the question on the accompanying scantron. 1) A monopoly is
LABOR UNIONS. Appendix. Key Concepts
 Appendix LABOR UNION Key Concepts Market Power in the Labor Market A labor union is an organized group of workers that aims to increase wages and influence other job conditions. Craft union a group of
Problem Set 1 Solutions
 Health Economics Economics 156 Prof. Jay Bhattacharya Problem Set 1 Solutions A. Risk Aversion Consider a risk averse consumer with probability p of becoming sick. Let I s be the consumer s income if he
Notes - Gruber, Public Finance Chapter 17 - Income distribution and Welfare programs Welfare policy in the United States Motivations - relative
 Notes - Gruber, Public Finance Chapter 17 - Income distribution and Welfare programs Welfare policy in the United States Motivations - relative income inequality, income distribution: The evolution of
Trade and Resources: The Heckscher-Ohlin Model. Professor Ralph Ossa 33501 International Commercial Policy
 Trade and Resources: The Heckscher-Ohlin Model Professor Ralph Ossa 33501 International Commercial Policy Introduction Remember that countries trade either because they are different from one another or
Supplement Unit 1. Demand, Supply, and Adjustments to Dynamic Change
 1 Supplement Unit 1. Demand, Supply, and Adjustments to Dynamic Change Introduction This supplemental highlights how markets work and their impact on the allocation of resources. This feature will investigate
Econ 202 H01 Final Exam Spring 2005
 Econ202Final Spring 2005 1 Econ 202 H01 Final Exam Spring 2005 1. Which of the following tends to reduce the size of a shift in aggregate demand? a. the multiplier effect b. the crowding-out effect c.
New York s 2005-2007 minimum wage increases: Good for the state s workers, good for the economy. A Fiscal Policy Institute Report January 22, 2007
 FISCAL POLICY NOTE$ New York s 2005-2007 minimum wage increases: Good for the state s workers, good for the economy A Fiscal Policy Institute Report January 22, 2007 The federal minimum wage has not increased
Reference: Gregory Mankiw s Principles of Macroeconomics, 2 nd edition, Chapters 10 and 11. Gross Domestic Product
 Macroeconomics Topic 1: Define and calculate GDP. Understand the difference between real and nominal variables (e.g., GDP, wages, interest rates) and know how to construct a price index. Reference: Gregory
6. Budget Deficits and Fiscal Policy
 Prof. Dr. Thomas Steger Advanced Macroeconomics II Lecture SS 2012 6. Budget Deficits and Fiscal Policy Introduction Ricardian equivalence Distorting taxes Debt crises Introduction (1) Ricardian equivalence
Chapter 3 Market Demand, Supply and Elasticity
 Chapter 3 Market Demand, Supply and Elasticity Multiple Choice Questions Choose the one alternative that best completes the statement or answers the question. 1. Ceteris paribus means (a) other things
Labour markets. Spring 2013. Suppose workers can freely choose the amount of hours they work, wages are given, no unemployment.
 Labour markets Spring 2013 1 A Static Model of Labour Supply Suppose workers can freely choose the amount of hours they work, wages are given, no unemployment. Interpretations: Literally choosing hours
QE1: Economics Notes 1
 QE1: Economics Notes 1 Box 1: The Household and Consumer Welfare The final basket of goods that is chosen are determined by three factors: a. Income b. Price c. Preferences Substitution Effect: change
ECON 305 Tutorial 7 (Week 9)
") H. K. Chen (SFU) ECON 305 Tutorial 7 (Week 9) July 2,3, 2014 1 / 24 ECON 305 Tutorial 7 (Week 9) Questions for today: Ch.9 Problems 15, 7, 11, 12 MC113 Tutorial slides will be posted Thursday after 10:30am,
H. K. Chen (SFU) ECON 305 Tutorial 7 (Week 9) July 2,3, 2014 1 / 24 ECON 305 Tutorial 7 (Week 9) Questions for today: Ch.9 Problems 15, 7, 11, 12 MC113 Tutorial slides will be posted Thursday after 10:30am,
Profit and Revenue Maximization
 WSG7 7/7/03 4:36 PM Page 95 7 Profit and Revenue Maximization OVERVIEW The purpose of this chapter is to develop a general framework for finding optimal solutions to managerial decision-making problems.
ECON 103, 2008-2 ANSWERS TO HOME WORK ASSIGNMENTS
 ECON 103, 2008-2 ANSWERS TO HOME WORK ASSIGNMENTS Due the Week of July 14 Chapter 11 WRITE: [2] Complete the following labour demand table for a firm that is hiring labour competitively and selling its
Chapter 6 Economic Growth
 Chapter 6 Economic Growth 1 The Basics of Economic Growth 1) The best definition for economic growth is A) a sustained expansion of production possibilities measured as the increase in real GDP over a
REVIEW OF MICROECONOMICS
 ECO 352 Spring 2010 Precepts Weeks 1, 2 Feb. 1, 8 REVIEW OF MICROECONOMICS Concepts to be reviewed Budget constraint: graphical and algebraic representation Preferences, indifference curves. Utility function
Outline. Not assigned problems Chapter 11. Q10 Go Chapter 11. Q14 Go Chapter 11. Q20 Go Chapter 11. Q22 Go Chapter 11. Q26 Go
 Outline Not assigned problems Chapter 11. Q10 Go Chapter 11. Q14 Go Chapter 11. Q20 Go Chapter 11. Q22 Go Chapter 11. Q26 Go Assignment problems: Chapter 11. Q4 Go Chapter 11. Q8 Go Chapter 11. Q12 Go
2011 Pearson Education. Elasticities of Demand and Supply: Today add elasticity and slope, cross elasticities
 2011 Pearson Education Elasticities of Demand and Supply: Today add elasticity and slope, cross elasticities What Determines Elasticity? Influences on the price elasticity of demand fall into two categories:
Demand. Lecture 3. August 2015. Reading: Perlo Chapter 4 1 / 58
 Demand Lecture 3 Reading: Perlo Chapter 4 August 2015 1 / 58 Introduction We saw the demand curve in chapter 2. We learned about consumer decision making in chapter 3. Now we bridge the gap between the
The Keynesian Cross. A Fixed Price Level. The Simplest Keynesian-Cross Model: Autonomous Consumption Only
 The Keynesian Cross Some instructors like to develop a more detailed macroeconomic model than is presented in the textbook. This supplemental material provides a concise description of the Keynesian-cross
Chapter 27: Taxation. 27.1: Introduction. 27.2: The Two Prices with a Tax. 27.2: The Pre-Tax Position
 Chapter 27: Taxation 27.1: Introduction We consider the effect of taxation on some good on the market for that good. We ask the questions: who pays the tax? what effect does it have on the equilibrium
Comparing Levels of Development
 2 Comparing Levels of Development Countries are unequally endowed with natural capital. For example, some benefit from fertile agricultural soils, while others have to put a lot of effort into artificial
A Detailed Price Discrimination Example
 A Detailed Price Discrimination Example Suppose that there are two different types of customers for a monopolist s product. Customers of type 1 have demand curves as follows. These demand curves include
A Utility Maximization Example
 A Utilit Maximization Example Charlie Gibbons Universit of California, Berkele September 17, 2007 Since we couldn t finish the utilit maximization problem in section, here it is solved from the beginning.
Overview on milk prices and production costs world wide
 Overview on milk prices and production costs world wide This article summarises the key findings of the IFCN work in 2013 and the recently published IFCN Dairy Report 2013 Authors: Torsten Hemme and dairy
Aggregate Demand and Aggregate Supply Ing. Mansoor Maitah Ph.D. et Ph.D.
 Aggregate Demand and Aggregate Supply Ing. Mansoor Maitah Ph.D. et Ph.D. Aggregate Demand and Aggregate Supply Economic fluctuations, also called business cycles, are movements of GDP away from potential
Connecting the Firm s Optimal Output and Input Decisions
 Perspectives on Economic Education Research Connecting the Firm s Optimal Output and Input Decisions Stephen Shmanske * Abstract: The paper presents a figure and some simple numerical/algebraic examples
Secondary Analysis of the Gender Pay Gap. Changes in the gender pay gap over time
 Secondary Analysis of the Gender Pay Gap Changes in the gender pay gap over time March 2014 Department for Culture, Media & Sport Department for Culture, Media & Sport 3 Contents Chapter 1: Introduction...
Workforce Training Results Report December 2008
 Report December 2008 Community and Technical Colleges (CTC) Job Preparatory Training Washington s 34 community and technical colleges offer job preparatory training that provides students with skills required
Chapter Outline. Chapter 13. Exchange Rates. Exchange Rates
 Chapter 13, Business Cycles, and Macroeconomic Policy in the Open Economy Chapter Outline How Are Determined: A Supply-and-Demand Analysis The IS-LM Model for an Open Economy Macroeconomic Policy in an
Potential GDP and Economic Growth
 Potential GDP and Economic Growth CHAPTER17 C H A P T E R C H E C K L I S T When you have completed your study of this chapter, you will be able to 1 Explain the forces that determine potential GDP and