Data repository for `Active normal fault control on landscape and rockslope failure in northern Norway
|
|
|
- Victor Randall
- 7 years ago
- Views:
Transcription
1 Data repository for `Active normal fault control on landscape and rockslope failure in northern Norway By Osmundsen, P.T. 1 & Henderson, I. 1, Lauknes, T. R. 2, & Larsen, Y. 2, Redfield, T.F. 1 & Dehls, J. 1 1: Geological Survey of Norway, 7491, Trondheim, Norway 2: Norut a/s, Forskningsparken, 9294 Tromsø, Norway Data Repository (DR) item 1: Geological map of part of northern Scandinavia between Lyngen and Lofoten and adjacent offshore areas (Mainly from Sigmond 2002). The geology of onshore northern Scandinavia is dominated by remnants of the Caledonian Mountain belt (Proterozoic and younger rocks) and by the Archean to Proterozoic rocks of the Baltic shield (Fig. 1.1). West of the Caledonian nappe front, gneissic rocks, belonging to the Baltic shield or to structurally low allochthonous units, crop out in belts and windows. The gabbros, greenstones and ultramafics of the Lyngen Ophiolite belong to the Caledonian nappe succession occupy large parts of the Lyngen peninsula. Compared to surrounding, penetratively foliated schistose units, the ophiolite consists of relatively resistant rocks. However, high topography is not confined to the Lyngen ophiolite, and across southern Lyngenfjorden, the contrast in topographic elevation is relatively small. A pronounced marker is constituted by the so-called `summit surface, an undated palaeosurface incised into ophiolitic rocks as well as in the surrounding schists (see main text and data repository item 4). On the map, please note the NE-SW to NNE-SSW-trending fault systems that constitute the boundary between the continent and the offshore Mesozoic-Cenozoic Harstad Basin. The trend of the bounding faults is reflected by the trends of a number of onshore faults, by a number of fjords and valleys and by the NNE- SSW orientation of the Lyngen peninsula. The main active faults proposed by us to bound the Lyngen peninsula (marked in red on fig. 1.1.) are thus parallel to major faults that offset offshore stratigraphy. Reference: Sigmond, E.M.O., Geologisk kart over land- og havområder I Nord-Europa, målestokk 1:4 millioner. Norges geologiske Undersøkelse. 1
.")
2 Fig. DR1. Geological map of part of northern Scandinavia and adjacent offshore areas. Study area outlined in red. V = Vesterålen, L = Lyngen peninsula. UTM coordinates, metres. From Sigmond, (2002). 2

3 DR item 2: INSAR Technical Notes Description of data, processing, and inversion for deformation velocity The interferometric synthetic aperture radar (InSAR) analysis is based on 19 European Space Agency ERS-1 and ERS-2 synthetic aperture radar (SAR) data from 1992 through 1999 (descending track 251, frame 2196). The ERS satellites have an operating wavelength of 5.66 cm, and the radar looks to the right (west) with an angle of approximately 23.5 from the vertical. The radar is only sensitive to displacement changes with a component in the radar lineof-sight direction. We computed 59 interferograms (see Table 1.) with a maximum baseline of 450 m and a maximum temporal separation of 5 years using the Norut GSAR software (Larsen et al., 2005). A digital elevation model (DEM) with a grid size of 25x25 m and a height standard deviation of 5 6 m was used to remove the topographic phase. Only snow-free SAR scenes were used in the study. We applied a complex multi-look operation using two looks in range and eight looks in azimuth, producing pixels with ground range dimensions of about 50x30 m in the range and azimuth directions, respectively. For each complex interferogram, a best fitting linear phase ramp due to imprecise orbit knowledge was estimated and removed (Lauknes et al., 2005). In addition, after removal of the orbital phase ramp, differential phase delay due to tropospheric stratification was estimated for each interferogram, assuming that phase as a function of elevation is the same for the entire scene. Based on the individual differential estimates, we solve for the phase as a function of height for each SAR scene using a least squares approach, and remove the resulting differential contribution from each interferogram. Furthermore, in order to exclude decorrelated areas from the study, and to make phase unwrapping feasible, we performed a pixel thresholding, selecting only the pixels that exhibited an estimated coherence value larger than 0.25 in at least 30% of the interferograms. The overall phase coherence is relatively high due to the limited vegetation cover above m elevation. In order to ease the phase unwrapping of the interferograms, a Delauney triangulation and interpolation (Costantini and Rosen, 1999) was done for all images, based on the selected pixels only. By performing this operation, we are able to link closely separated coherent patches. It 3

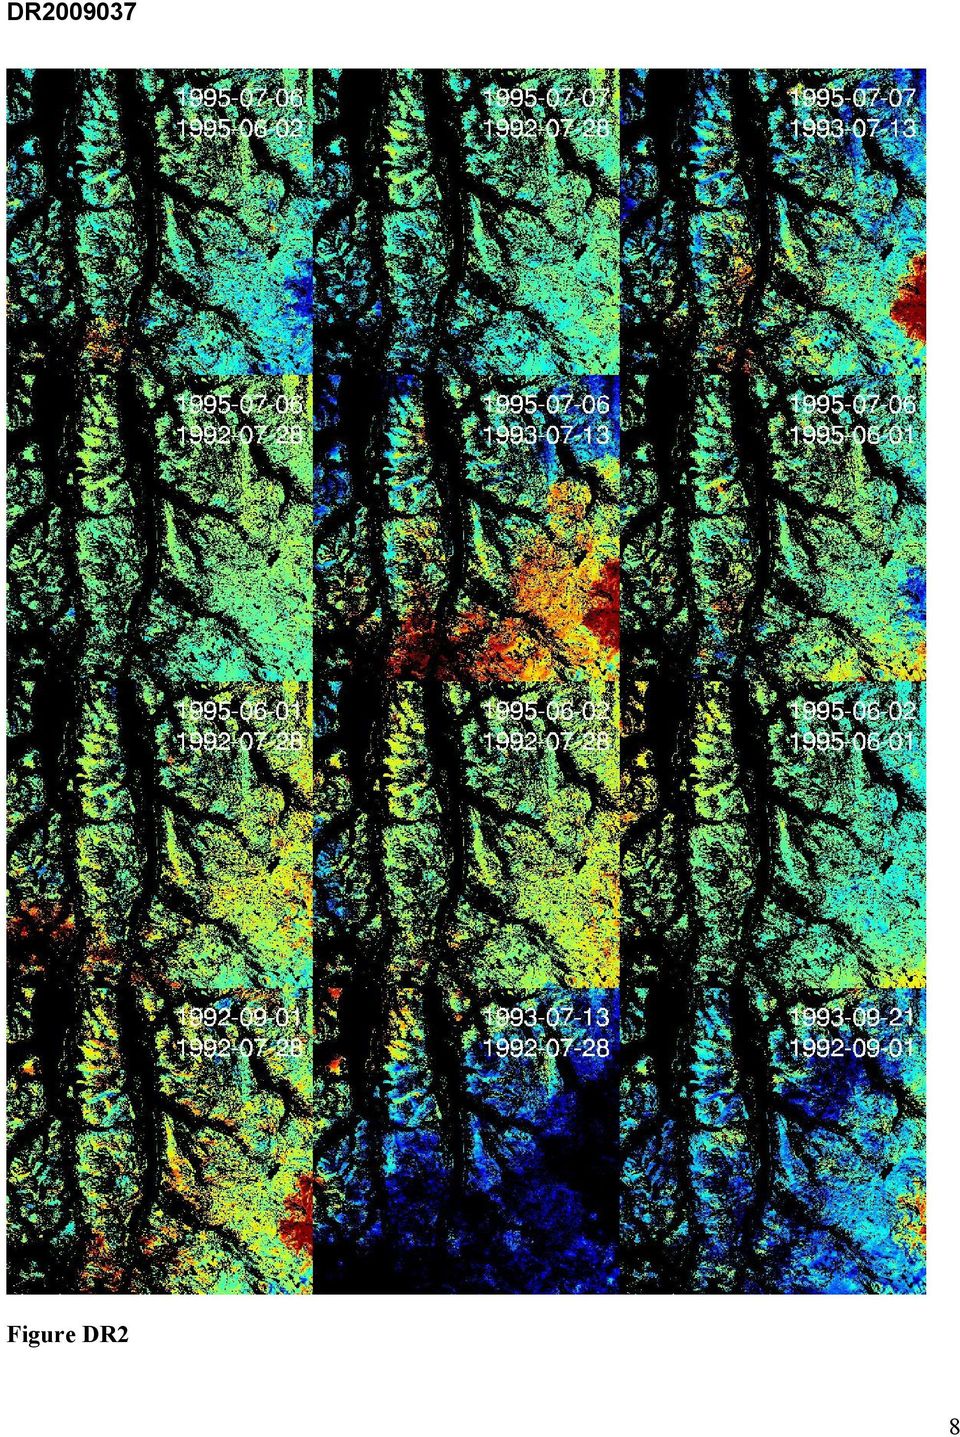
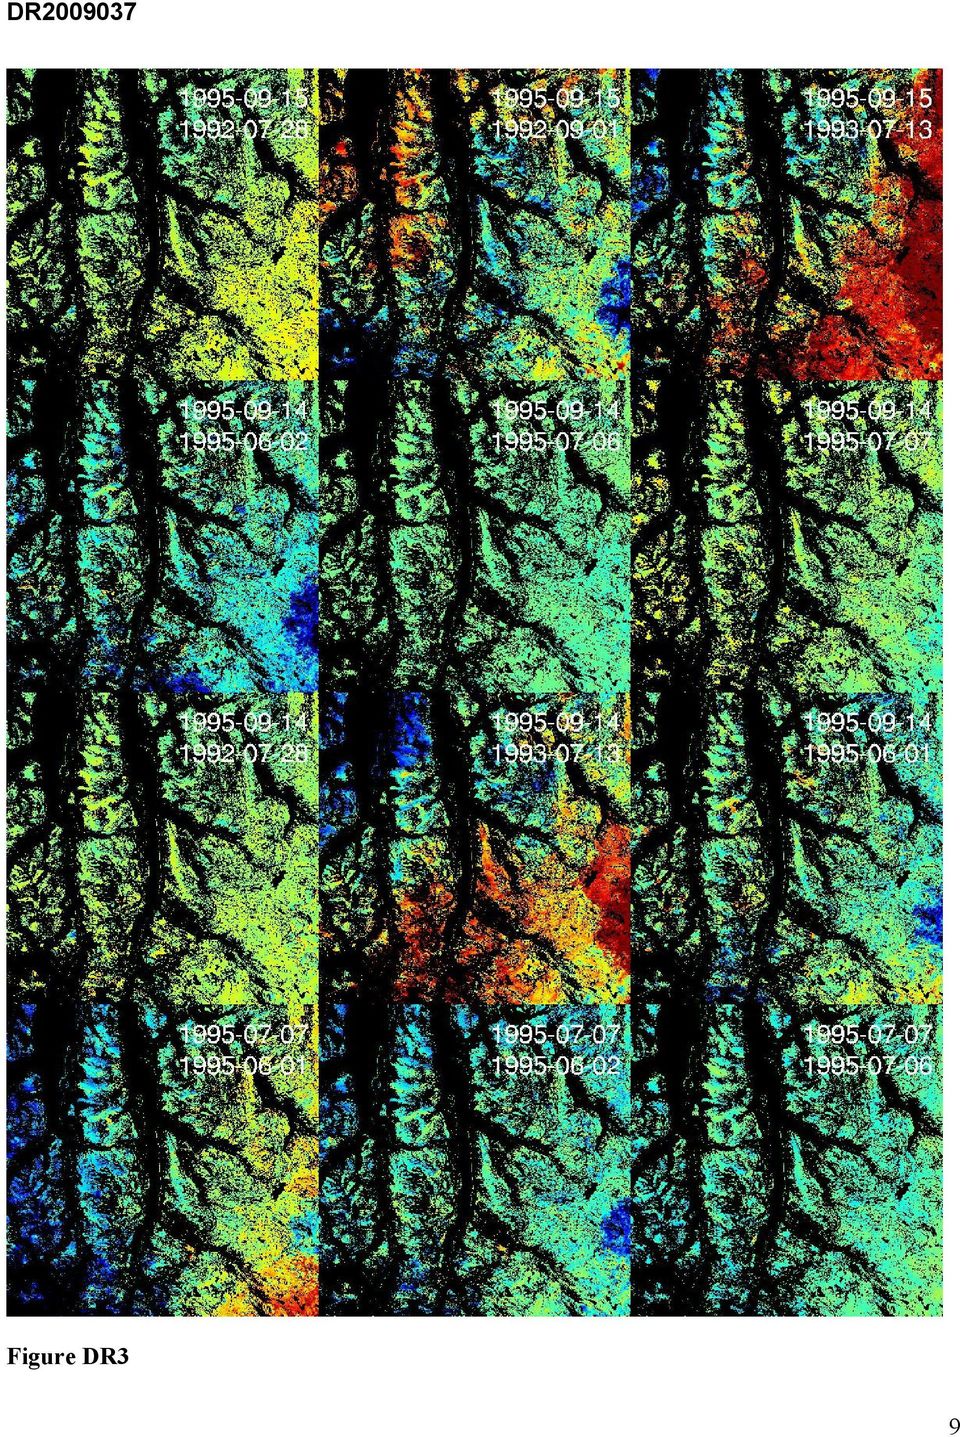
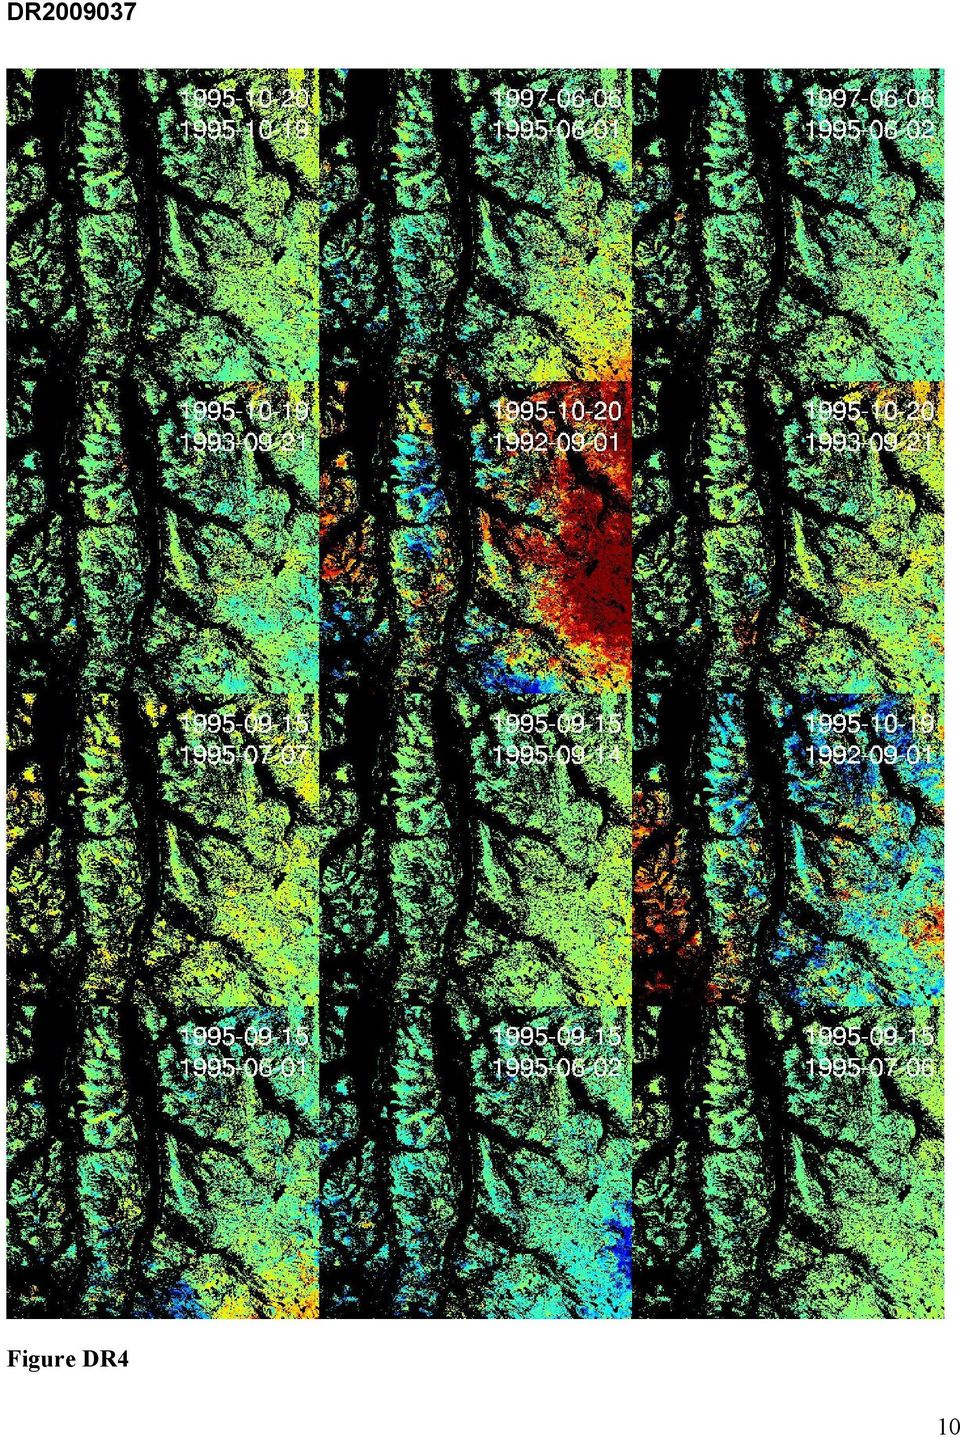
4 should be noted that for this particular dataset we do have coherent points all around the Lyngen fjord. The maximum width of the fjord is about 5 km. The interferograms were unwrapped using the SNAPHU software (Figures 1.1 to 1.5; Chen and Zebker, 2001). It can be clearly seen that our unwrapping approach is able to correctly unwrap across the fjord. It should be noted that our preprocessing steps (orbital error ramp and atmospheric stratification removal) are crucial for a successful spatial unwrapping. After removing orbital trends and topography related atmosphere, as well as replacing the phase of low coherence points with Delauney triangulated phase, we are left with a spatially correlated atmospheric signal with at most one or two phase cycles throughout the entire scene. In addition, we have the assumed tectonic movement of a magnitude less than a phase cycle over a period of up to 5 years (the maximum temporal separation). If this assumption is true, the signal is possible to unwrap even across the fjord since an unwrapper will select the smallest possible phase difference in case of an ambiguity. In this dataset we also have coherent points all around the fjord, which helps the unwrapping procedure. After the phase unwrapping, all pixels were calibrated with respect to an arbitrary point on the eastern shore of the Lyngen fjord. Based on the 59 InSAR pairs, we then applied the small-baseline subset (SBAS) algorithm (Berardino et al., 2002). In order to exclude decorrelated areas from the study, we selected only the common coherent pixels in all interferograms. The spatially correlated atmospheric contributions were estimated and filtered out before estimating a mean displacement velocity. References Berardino, P., Fornaro, G., Lanari, R., and Sansosti, E., 2002, A new algorithm for surface deformation monitoring based on small baseline differential SAR interferograms: IEEE Transactions on Geoscience and Remote Sensing, v. 40, no. 11, p Costantini, M., and Rosen, P., 1999, A generalized phase unwrapping approach for sparse data: In Proc. IGARSS, Hamburg, Germany, p Chen, C., W., and Zebker, H., A., 2001, Two-dimensional phase unwrapping with use of stastistical models for cost functions in nonlinear optimization: Journal of the Optical Society 4
 are crucial for a successful spatial unwrapping.")
5 of America A., v. 18, no. 2, p Larsen, Y., Engen, G., Lauknes, T. R., Malnes, E., and Høgda, K. A., 2005, A generic differential interferometric SAR processing system, with applications to land subsidence and snow-water equivalent retrieval: In Proc. Fringe 2005 Workshop, ESA ESRIN, Frascati, Rome. Lauknes, T. R., Dehls, J., Larsen, Y., Høgda, K. A., and Weydahl, D. J., 2005, A comparison of SBAS and PS ERS InSAR for subsidence monitoring in Oslo, Norway: In Proc. Fringe 2005 Workshop, ESA ESRIN, Frascati, Rome. Acknowledgments The ERS-1/2 synthetic aperture radar data were provided by the European Space Agency through proposals AOALO.3668 and AOPOL The University of Delft, The Netherlands, provided precise satellite orbits. Table DR1. Parameters of SAR images used in the InSAR analysis Interferogram [dates] Perpendicular baseline [m] Temporal separation [days]

6

7

8 DR Figure DR2 8
9 DR Figure DR3 9
10 DR Figure DR4 10
11 DR Figure DR5 11

12 DR Figure DR6 12
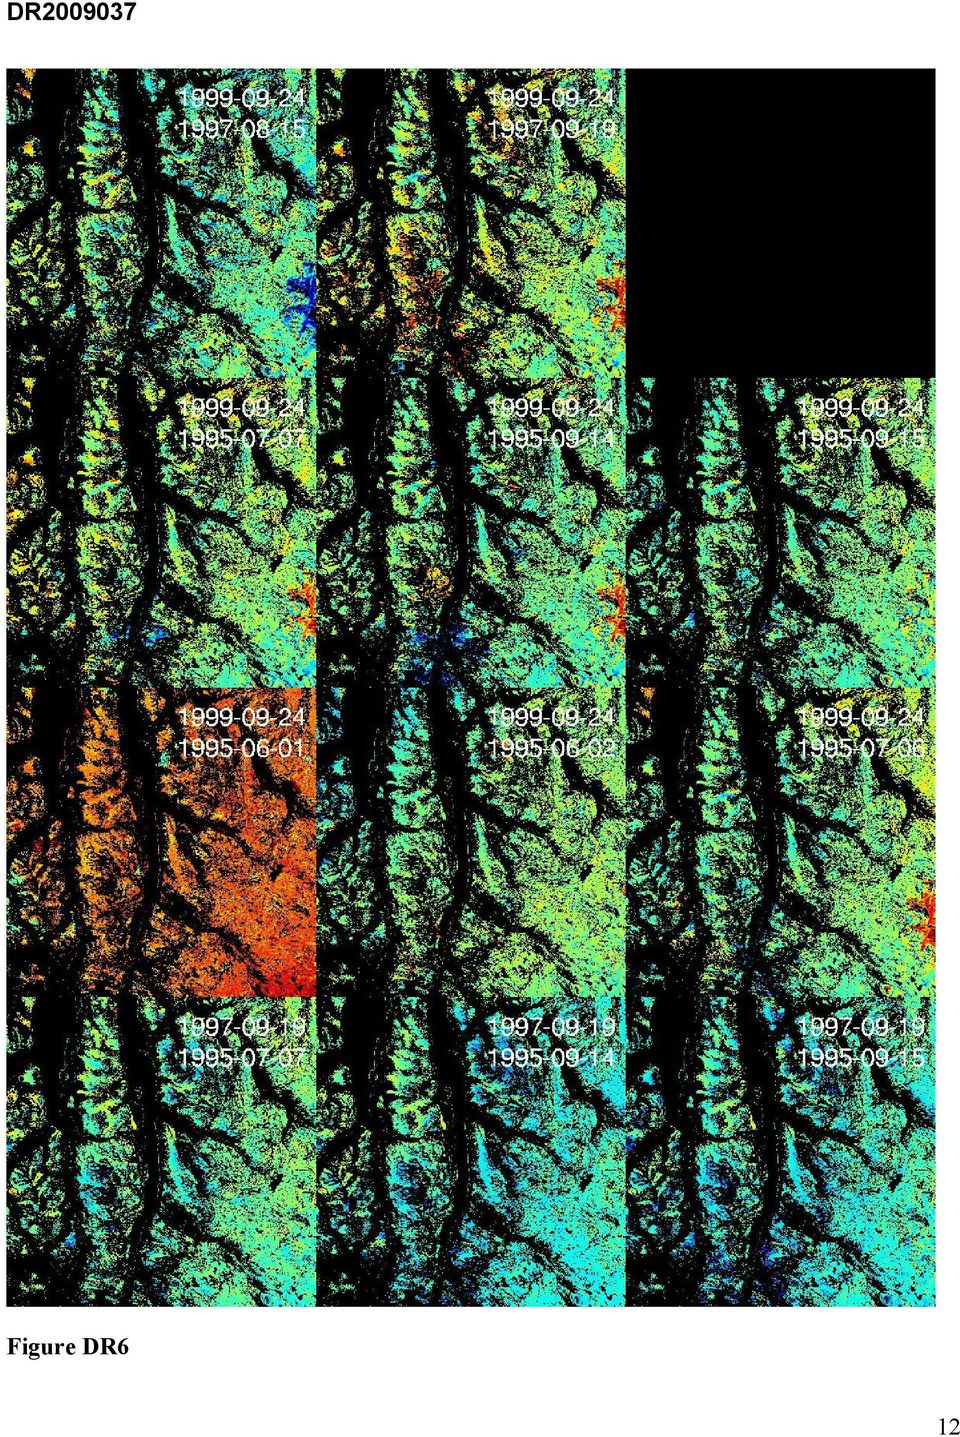
13 Figures DR2-DR6: Unwrapped interferograms. The phase values have been scaled between (-4π, 4π) in order to illustrate possible phase unwrapping errors. See Table 1 for details about the interferometric baselines. The unwrapped interferograms still include possible heterogenous atmospheric artifacts and residual phase due to errors in the digital elevation model. 13

14 DR item 3: Complete INSAR profile data The INSAR data described in the main text and in the Supplement text above were archived as a Band Interleaved file in UTM33N coordinates in ERMapper.ers format. A small counterclockwise rotation was applied to align the edges of the non-null data with a NS azimuth. A filter was applied to remove fast motion representing actual landslides (see text). The grid was then sliced into twenty-three EW bands of approximately 500 meters width (20 pixels). A random subset of these pixels was then plotted against native Easting coordinates. The complete set of EW cross sections (Figures DR8-DR30) are presented below, keyed to a location map (Figure DR7 ). Figure DR7 14
.")
15 Figure DR8: Profile 1 Figure DR9: Profile 2 15

16 Figure DR10: Profile 3 Figure DR11: Profile 4 16

17 Figure DR12: Profile 5 Figure DR13: Profile 6 17

18 Figure DR14: Profile 7 Figure DR15: Profile 8 18

19 Figure DR16: Profile 9 Figure DR17: Profile 10 19

20 Figure DR18: Profile 11 Figure DR19: Profile 12 20

21 Figure DR20: Profile 13 Figure DR21: Profile 14 21
22 Figure DR22: Profile 15 Figure DR23: Profile 16 22
23 Figure DR24: Profile 17 Figure DR25: Profile 18 23
24 Figure DR26: Profile 19 Figure DR27: Profile 20 24
25 Figure DR28: Profile 21 Figure DR29: Profile 22 25
26 Figure DR30: Profile 23 26
27 DR item 4: Topography, landscape and rock-slope failure in the Lyngen region The main text describes briefly the contrasting landscapes observed across Lyngenfjorden. Below, we provide DEM views and photographs that illustrate these contrasts, which appear to arise from the differential preservation of palaeosurfaces in the region. We also provide an example of a map derivative that may help to illustrate further the structural configuration around the Lyngen Peninsula. E W Fig. DR31. Oblique view of DEM ( southwards along Lyngenfjorden, showing contrasting landscapes across the fjord. Please note that at the far (southern) end of the fjord, high topography can be traced from the southernmost part of the Lyngen peninsula (ophiolitic rocks) across to the western side of the fjord (schistose metasedimentary rocks). This indicates that topographic elevation is not universally controlled by lithology. `Summit palaeosurface preserved across the peaks Fig. DR32. Detail of central parts of the Lyngen peninsula, looking west, showing the `summit palaeosurface. In general, the deeply incised Lyngen peninsula preserves less of this palaeolandscape than the surrounding areas. 27
28 E Widespread, but deeply incised `summit palaeosurface, Sloping palaeosurface(s) W Fig. DR33. View southwards towards southern end of Lyngenfjorden, showing contrasting landscapes across the fjord. Note high topography at south end of fjord, with relatively widespread preservation of `summit palaeosurface at high elevations. Towards the north, this level drops across a NW-SEtrending lineament Fig. DR34. Rockslide bund by two surfaces of rupture, inset shows multiple, scarp-bounded ridges on the northwest side of main scarp. Roadcut exposure at base of photograph is that of figure 3.d of the main text. 28
29 Fig. DR35. c Examples of surfaces of rupture (SR) and overlying complex rockslides, Kåfjord area. In both cases, the surface of rupture has been exhumed from underneath a complex slide containing rotated slide blocks (SB) and now constitutes the upper parts of the valley slope. In a.), another fault plane (F) is expressed as a fault scarp (FS) along the ridge, but can be traced to the floor of a tributary valley, underlying a mountain-sized fault block (FB) (see also fig. 3b in main text). Complex rockslides are developed above the surfaces of rupture, displaying various degrees of disintegration Whereas in a.), a surface caps the uppermost slide block SB, b) presents a more dismembered and disintegrated slide, although the shape of rotated blocks can sometimes be recognised in the mounds of rubble. c.) shows slickenline lineations developed on black, polished fault surface containing a thin layer of fine-grained fault rock. This occurs on the exhumed surface of rupture close to the SE end of the photograph in b.). See stereogram in fig. 3d, main text. 29
30 S N Fig. DR36 Normannvikdalen with trace of Normannvikdalen fault (NF, Dehls et al. 2000, 3-D DEM view from marked by arrows. Note triangular facet (T) on the N-S-trending range front on the opposite side of Lyngenfjorden. Right-hand photograph shows the c. 2 meters high scarp in the vegetated cover along the Normannsvikdalen fault. Person for scale. 30
31 Fig. DR37. (a) Top surface less minimum surface map of the Lyngen region. Zmax and Zmin were identified within a 3 km radius moving window passed stepwise over a 25m resolution DEM. The resultant map gives a measure of the amount of incision and the erosion potential, in this case filtered so that Zmax-Zmin > 1000m. Scale in metres. Note that the highest values are observed along the northeast and southwest sides of the Lyngen peninsula, in the areas where we have observed the faceted range-front (c) and the propagating scarps (b), respectively. This indicates that the main structures may change polarity along the peninsula, with down-to-the-east displacement in the northeast and down-to-the west displacement in the south. 31
32 b. c. 32
Orbital and atmospheric noise in InSAR data inferred from the global ERS1,2 and Envisat SAR data archives
 Category-1 proposal submitted to the European Space Agency Orbital and atmospheric noise in InSAR data inferred from the global ERS1,2 and Envisat SAR data archives Executive Summary We request the online
Focus Earth The Velingara Circular Structure A meteorite impact crater?
 Focus Earth The Velingara Circular Structure A meteorite impact crater? S. Wade Institut des Sciences de la Terre, Faculté des Sciences et Techniques, Université Cheikh Anta Diop, Dakar-Fann, Sénégal M.
How Did These Ocean Features and Continental Margins Form?
 298 10.14 INVESTIGATION How Did These Ocean Features and Continental Margins Form? The terrain below contains various features on the seafloor, as well as parts of three continents. Some general observations
PI: Riccardo Lanari (IREA CNR) email:lanari.r@irea.cnr.it
 email:lanari.r@irea.cnr.it") On the exploitation and validation of COSMO-SkyMed interferometric SAR data for digital terrain modelling and surface deformation analysis in extensive urban areas (ID: 1441) Project partners: Istituto
On the exploitation and validation of COSMO-SkyMed interferometric SAR data for digital terrain modelling and surface deformation analysis in extensive urban areas (ID: 1441) Project partners: Istituto
Radar images Università di Pavia Fabio Dell Acqua Gruppo di Telerilevamento
 Radar images Radar images radar image DNs linked to backscattered field Backscattered field depends on wave-target interaction, with different factors relevant to it: within-pixel coherent combination
I.D.I.O.T.: A FREE AND EASY-TO-USE SOFTWARE TOOL FOR DINSAR ANALYSIS
 I.D.I.O.T.: A FREE AND EASY-TO-USE SOFTWARE TOOL FOR DINSAR ANALYSIS A. Reigber, E. Erten, S. Guillaso, and O. Hellwich Berlin University of Technology, Computer Vision and Remote Sensing Franklinstr.
Interferometric TOPS Chain Description
 www.dlr.de/hr > SEOM INSARAP INSARAP Workshop December 10, 2014 > Slide 1 SEOM INSARAP: Sentinel-1 InSAR Performance Study with TOPS Data ESA-ESRIN Contract 4000110587/14/I-BG Interferometric TOPS Chain
Satellites for Terrain Motion Mapping Terrafirma User Workshop Mining. Nico Adam
 Satellites for Terrain Motion Mapping Terrafirma User Workshop Mining Nico Adam Outline SAR / InSAR observation characteristic Sensors TSX, TDX ERS-1, ERS-2 Processing techniques D-InSAR PSI SBAS Acquisition
DIFFERENTIAL INSAR MONITORING OF THE LAMPUR SIDOARJO MUD VOLCANO (JAVA, INDONESIA) USING ALOS PALSAR IMAGERY
 USING ALOS PALSAR IMAGERY") DIFFERENTIAL INSAR MONITORING OF THE LAMPUR SIDOARJO MUD VOLCANO (JAVA, INDONESIA) USING ALOS PALSAR IMAGERY Adam Thomas (1), Rachel Holley (1), Richard Burren (1), Chris Meikle (2), David Shilston (2)
DIFFERENTIAL INSAR MONITORING OF THE LAMPUR SIDOARJO MUD VOLCANO (JAVA, INDONESIA) USING ALOS PALSAR IMAGERY Adam Thomas (1), Rachel Holley (1), Richard Burren (1), Chris Meikle (2), David Shilston (2)
POTENTIALS OF HIGH RESOLUTION TERRASAR-X IMAGES IN INSAR PROCESSING
 POTENTIALS OF HIGH RESOLUTION TERRASAR-X IMAGES IN INSAR PROCESSING FOR EARTH DEFORMATION AND ENVIRONMENTAL STUDIES Magdalena Niemiec 1 Abstract Accurate determination of topography and surface deformation
Radar interferometric techniques and data validation Terrafirma Essen, March 2011. Page 1
 Radar interferometric techniques and data validation Terrafirma Essen, March 2011 Page 1 Agenda Introduction to InSAR technology Different radarinterferometric techniques Validation of InSAR technology
TerraSAR-X Interferometry. Michael Eineder, Nico Adam Remote Sensing Technology Institute
 TerraSAR-X Interferometry Michael Eineder, Nico Adam Remote Sensing Technology Institute TerraSAR-X Contribution to Commissioning Phase: verify phase and geometric stability of instrument and SAR processor
Information Contents of High Resolution Satellite Images
 Information Contents of High Resolution Satellite Images H. Topan, G. Büyüksalih Zonguldak Karelmas University K. Jacobsen University of Hannover, Germany Keywords: satellite images, mapping, resolution,
Software Architecture Document (SAD) for the Interferometric Modules of the Next ESA SAR Toolbox (NEST)
 for the Interferometric Modules of the Next ESA SAR Toolbox (NEST)") Software Architecture Document (SAD) for the Interferometric Modules of the Next ESA SAR Toolbox (NEST) Contract number: 20809/07/I-LG Prepared by: PPO.labs Prepared for: The European Space Agency Revision
Software Architecture Document (SAD) for the Interferometric Modules of the Next ESA SAR Toolbox (NEST) Contract number: 20809/07/I-LG Prepared by: PPO.labs Prepared for: The European Space Agency Revision
AUTOMATIC INSAR SYSTEMATIC PROCESSING AND WEB BASED TOOL FOR EFFICIENT DATA MINING: APPLICATION TO VOLCANO MONITORING IN AFRICA
 AUTOMATIC INSAR SYSTEMATIC PROCESSING AND WEB BASED TOOL FOR EFFICIENT DATA MINING: APPLICATION TO VOLCANO MONITORING IN AFRICA N. d Oreye (1), and G. Celli (1) (1) National Museum of Natural History,
Map Patterns and Finding the Strike and Dip from a Mapped Outcrop of a Planar Surface
 Map Patterns and Finding the Strike and Dip from a Mapped Outcrop of a Planar Surface Topographic maps represent the complex curves of earth s surface with contour lines that represent the intersection
Two primary advantages of radars: all-weather and day /night imaging
 Lecture 0 Principles of active remote sensing: Radars. Objectives: 1. Radar basics. Main types of radars.. Basic antenna parameters. Required reading: G: 8.1, p.401-40 dditional/advanced reading: Online
GEOLOGIC MAPS. PURPOSE: To be able to understand, visualize, and analyze geologic maps
 GEOLOGIC MAPS PURPOSE: To be able to understand, visualize, and analyze geologic maps Geologic maps show the distribution of the various igneous, sedimentary, and metamorphic rocks at Earth s surface in
SAR INTERFEROMETRIC ANALYSIS OF GROUND DEFORMATION AT SANTORINI VOLCANO (GREECE)
") SAR INTERFEROMETRIC ANALYSIS OF GROUND DEFORMATION AT SANTORINI VOLCANO (GREECE) Papageorgiou Elena (1), Foumelis Michael (2), Parcharidis Issaak (2) (1) National and Kapodistrian University of Athens,
SAR INTERFEROMETRIC ANALYSIS OF GROUND DEFORMATION AT SANTORINI VOLCANO (GREECE) Papageorgiou Elena (1), Foumelis Michael (2), Parcharidis Issaak (2) (1) National and Kapodistrian University of Athens,
Solving Simultaneous Equations and Matrices
 Solving Simultaneous Equations and Matrices The following represents a systematic investigation for the steps used to solve two simultaneous linear equations in two unknowns. The motivation for considering
ERS-ENVISAT ENVISAT deformation time-series analysis: a unique opportunity to investigate long term surface deformation of large areas
 ERS-ENVISAT ENVISAT deformation time-series analysis: a unique opportunity to investigate long term surface deformation of large areas R. Lanari 1, P. Berardino 1, M. Bonano 1,2, F. Casu 1, A. Manconi
Using advanced InSAR techniques as a remote tool for mine site monitoring
 The Southern African Institute of Mining and Metallurgy Slope Stability 2015 D. Colombo and B. MacDonald Using advanced InSAR techniques as a remote tool for mine site monitoring D. Colombo* and B. MacDonald
Plate Tectonics: Ridges, Transform Faults and Subduction Zones
 Plate Tectonics: Ridges, Transform Faults and Subduction Zones Goals of this exercise: 1. review the major physiographic features of the ocean basins 2. investigate the creation of oceanic crust at mid-ocean
Exploitation of historical satellite SAR archives for mapping and monitoring landslides at regional and local scale
 Exploitation of historical satellite SAR archives for mapping and monitoring landslides at regional and local scale (A. Ferretti (TRE), A. Tamburini (TRE), M. Bianchi (TRE), M. Broccolato (Regione Valle
Wide Area Persistent Scatterer Interferometry: Algorithms and Examples
 Wide Area Persistent Scatterer Interferometry: Algorithms and Examples Nico Adam, Fernando Rodriguez Gonzalez, Alessandro Parizzi, Werner Liebhart with contributions of Ramon Brcic and Xiao Ying Cong ca.
STUDY ON RADAR DIFFERENTIAL INTERFEROMETRY TECHNOLOGY AND IT S APPLICATION TO MANI EARTHQUAKE USING ERS-1/2 SAR DATA: A CASE STUDY IN CHINA
 STUDY ON RADAR DIFFERENTIAL INTERFEROMETRY TECHNOLOGY AND IT S APPLICATION TO MANI EARTHQUAKE USING ERS-1/2 SAR DATA: A CASE STUDY IN CHINA Qulin Tan a, *, Siwen i b, in Wang a, Songlin Yang a a School
Satellite Altimetry Missions
 Satellite Altimetry Missions SINGAPORE SPACE SYMPOSIUM 30 TH SEPTEMBER 2015 AUTHORS: LUCA SIMONINI/ ERICK LANSARD/ JOSE M GONZALEZ www.thalesgroup.com Table of Content General Principles and Applications
A multi-scale approach to InSAR time series analysis
 A multi-scale approach to InSAR time series analysis M. Simons, E. Hetland, P. Muse, Y. N. Lin & C. DiCaprio U Interferogram stack time A geophysical perspective on deformation tomography Examples: Long
The use of Satellite Remote Sensing for Offshore Environmental Benchmarking
 The use of Satellite Remote Sensing for Offshore Environmental Benchmarking Michael King Fugro NPA Limited Fugro NPA (Formerly Nigel Press Associates) World leading Satellite Remote Sensing & Geoscience
DESCW: PC Software Supporting Remote Sensing Data
 r bulletin 97 march 1999 DESCW: PC Software Supporting Remote Sensing Data S. D Elia Earth Remote Sensing Exploitation Division, ESA Directorate for Application Programmes, ESRIN, Frascati, Italy R. Biasutti
Introduction to Structural Geology
 Introduction to Structural Geology Workbook 3 Geological Maps BGS Introduction to geological maps 4 1. Outcrop patterns on geological maps 7 2. Cross sections 16 3. Structure contours 22 cknowledgements
Appendix B. Introduction to Landslide Evaluation Tools Mapping, Remote Sensing, and Monitoring of Landslides
 Appendix B. Introduction to Landslide Evaluation Tools Mapping, Remote Sensing, and Monitoring of Landslides 66 The Landslide Handbook A Guide to Understanding Landslides Part 1. Mapping Maps are a useful
Stability Assessment of Chamshir Dam Based on DEM, South West Zagros
 2015 2nd International Conference on Geological and Civil Engineering IPCBEE vol. 80 (2015) (2015) IACSIT Press, Singapore DOI: 10.7763/IPCBEE. 2015. V80. 13 Stability Assessment of Chamshir Dam Based
Integration between spaceand ground-based data sets: application on ground deformations measurements
 Integration between spaceand ground-based data sets: application on ground deformations measurements Giuseppe Puglisi Istituto Nazionale di Geofisica e Vulcanologia Sezione di Catania Osservatorio Etneo
HIGH RESOLUTION MONITORING OF CAMPI FLEGREI (NAPLES, ITALY) BY EXPLOITING TERRASAR-X DATA: AN APPLICATION TO SOLFATARA CRATER
 BY EXPLOITING TERRASAR-X DATA: AN APPLICATION TO SOLFATARA CRATER") HIGH RESOLUTION MONITORING OF CAMPI FLEGREI (NAPLES, ITALY) BY EXPLOITING TERRASAR-X DATA: AN APPLICATION TO SOLFATARA CRATER Christian Minet (1), Kanika Goel (1), Ida Aquino (2), Rosario Avino (2), Giovanna
HIGH RESOLUTION MONITORING OF CAMPI FLEGREI (NAPLES, ITALY) BY EXPLOITING TERRASAR-X DATA: AN APPLICATION TO SOLFATARA CRATER Christian Minet (1), Kanika Goel (1), Ida Aquino (2), Rosario Avino (2), Giovanna
Step 2: Learn where the nearest divergent boundaries are located.
 What happens when plates diverge? Plates spread apart, or diverge, from each other at divergent boundaries. At these boundaries new ocean crust is added to the Earth s surface and ocean basins are created.
Case Study Australia. Dr John Dawson A/g Branch Head Geodesy and Seismic Monitoring Geoscience Australia. Chair UN-GGIM-AP WG1 Chair APREF.
 Case Study Australia Dr John Dawson A/g Branch Head Geodesy and Seismic Monitoring Geoscience Australia Chair UN-GGIM-AP WG1 Chair APREF Page 1 Overview 1. Australian height system Australian Height Datum
CASE STUDY LANDSLIDE MONITORING
 Introduction Monitoring of terrain movements (unstable slopes, landslides, glaciers, ) is an increasingly important task for today s geotechnical people asked to prevent or forecast natural disaster that
Введение в спутниковую радиолокацию: Радиолокаторы с синтезированной апертурой (РСА) Introduction to satellite radars: Synthetic Aperture Radars (SAR)
 Introduction to satellite radars: Synthetic Aperture Radars (SAR)") Введение в спутниковую радиолокацию: Радиолокаторы с синтезированной апертурой (РСА) Introduction to satellite radars: Synthetic Aperture Radars (SAR) проф. Бертран Шапрон IFREMER / ЛСО РГГМУ Prof. Bertrand
Введение в спутниковую радиолокацию: Радиолокаторы с синтезированной апертурой (РСА) Introduction to satellite radars: Synthetic Aperture Radars (SAR) проф. Бертран Шапрон IFREMER / ЛСО РГГМУ Prof. Bertrand
CHARACTERIZATION AND MODELLING OF GEOLOGICAL INSTABILITIES THROUGH REMOTE SENSING TECHNIQUES AND NUMERICAL SIMULATIONS
 CHARACTERIZATION AND MODELLING OF GEOLOGICAL INSTABILITIES THROUGH REMOTE SENSING TECHNIQUES AND NUMERICAL SIMULATIONS Ph.D. candidate: GIULIA TESSARI, III course Tutor: Dott. MARIO FLORIS Cycle: XXVII
Multisensor Data Integration in O&G Business Lutz Petrat Hélène Lemonnier Michael Hall
 Multisensor Data in O&G Business Lutz Petrat Hélène Lemonnier Michael Hall ESA Oil and Gas Workshop 15/09/2010, Frascati, Italy Satellite Products and Services during a typical O&G project Project Life
LABORATORY TWO GEOLOGIC STRUCTURES
 EARTH AND ENVIRONMENT THROUGH TIME LABORATORY- EES 1005 LABORATORY TWO GEOLOGIC STRUCTURES Introduction Structural geology is the study of the ways in which rocks or sediments are arranged and deformed
Terrafirma Persistent Scatterer Processing Validation
 Terrafirma Persistent Scatterer Processing Validation Nico Adam (1), Alessandro Parizzi (1), Michael Eineder (1), Michele Crosetto () (1) Remote Sensing Technology Institute () Institute of Geomatics Signal
Dip is the vertical angle perpendicular to strike between the imaginary horizontal plane and the inclined planar geological feature.
 Geological Visualization Tools and Structural Geology Geologists use several visualization tools to understand rock outcrop relationships, regional patterns and subsurface geology in 3D and 4D. Geological
Description of Simandou Archaeological Potential Model. 13A.1 Overview
 13A Description of Simandou Archaeological Potential Model 13A.1 Overview The most accurate and reliable way of establishing archaeological baseline conditions in an area is by conventional methods of
Investigation 6: What happens when plates collide?
 Tectonics Investigation 6: Teacher Guide Investigation 6: What happens when plates collide? In this activity, students will use the distribution of earthquakes and volcanoes in a Web GIS to learn about
Data source, type, and file naming convention
 Exercise 1: Basic visualization of LiDAR Digital Elevation Models using ArcGIS Introduction This exercise covers activities associated with basic visualization of LiDAR Digital Elevation Models using ArcGIS.
GEOENGINE MSc in Geomatics Engineering (Master Thesis) Anamelechi, Falasy Ebere
 Anamelechi, Falasy Ebere") Master s Thesis: ANAMELECHI, FALASY EBERE Analysis of a Raster DEM Creation for a Farm Management Information System based on GNSS and Total Station Coordinates Duration of the Thesis: 6 Months Completion
Master s Thesis: ANAMELECHI, FALASY EBERE Analysis of a Raster DEM Creation for a Farm Management Information System based on GNSS and Total Station Coordinates Duration of the Thesis: 6 Months Completion
Remote Sensing and Land Use Classification: Supervised vs. Unsupervised Classification Glen Busch
 Remote Sensing and Land Use Classification: Supervised vs. Unsupervised Classification Glen Busch Introduction In this time of large-scale planning and land management on public lands, managers are increasingly
GPS Precise Point Positioning as a Method to Evaluate Global TanDEM-X Digital Elevation Model
 GPS Precise Point Positioning as a Method to Evaluate Global TanDEM-X Digital Elevation Model 7 th FIG Regional Conference TS 1C Advances in GNSS Positioning and Applications I Volker Schwieger 1, Jürgen
COMPARISON OF EISCAT RADAR DATA ON SPACE DEBRIS WITH MODEL PREDICTIONS BY THE MASTER MODEL OF ESA
 PEDAS1-B1.4-0003-02 COMPARISON OF EISCAT RADAR DATA ON SPACE DEBRIS WITH MODEL PREDICTIONS BY THE MASTER MODEL OF ESA M. Landgraf 1, R. Jehn 1, and W. Flury 1 1 ESA/ESOC, Robert-Bosch-Str. 5, 64293 Darmstadt,
SURVEYING WITH GPS. GPS has become a standard surveying technique in most surveying practices
 SURVEYING WITH GPS Key Words: Static, Fast-static, Kinematic, Pseudo- Kinematic, Real-time kinematic, Receiver Initialization, On The Fly (OTF), Baselines, Redundant baselines, Base Receiver, Rover GPS
Monitoring a Changing Environment with Synthetic Aperture Radar. Alaska Satellite Facility National Park Service Don Atwood
 Monitoring a Changing Environment with Synthetic Aperture Radar Don Atwood Alaska Satellite Facility 1 Entering the SAR Age 2 SAR Satellites RADARSAT-1 Launched 1995 by CSA 5.6 cm (C-Band) HH Polarization
TUTORIAL MOVE 2009.1: 3D MODEL CONSTRUCTION FROM SURFACE GEOLOGICAL DATA
 UNIVERSITÁ DEGLI STUDI DI MILANO FACOLTÀ DI SCIENZE MATEMATICHE FISICHE E NATURALI DIPARTIMENTO DI SCIENZE DELLA TERRA ARDITO DESIO TUTORIAL MOVE 2009.1: 3D MODEL CONSTRUCTION FROM SURFACE GEOLOGICAL DATA
How To Determine The Ability Of Anos/Palsar To Detect Deformation In Iceland
 RECENT DEEP-SEATED MAGMATIC ACTIVITY AND THE 2008 M6.3 EARTHQUAKE: APPLICABILITY OF ALOS/PALSAR IN ICELAND Andrew Hooper 1, Benedikt Ofeigsson 2, Freysteinn Sigmundsson 2, and Halldór Geirsson 3 1 Department
A Study on SURF Algorithm and Real-Time Tracking Objects Using Optical Flow
 , pp.233-237 http://dx.doi.org/10.14257/astl.2014.51.53 A Study on SURF Algorithm and Real-Time Tracking Objects Using Optical Flow Giwoo Kim 1, Hye-Youn Lim 1 and Dae-Seong Kang 1, 1 Department of electronices
Monitoring of Arctic Conditions from a Virtual Constellation of Synthetic Aperture Radar Satellites
 DISTRIBUTION STATEMENT A. Approved for public release; distribution is unlimited. Monitoring of Arctic Conditions from a Virtual Constellation of Synthetic Aperture Radar Satellites Hans C. Graber RSMAS
The process components and related data characteristics addressed in this document are:
 TM Tech Notes Certainty 3D November 1, 2012 To: General Release From: Ted Knaak Certainty 3D, LLC Re: Structural Wall Monitoring (#1017) rev: A Introduction TopoDOT offers several tools designed specifically
3D Visualization of Seismic Activity Associated with the Nazca and South American Plate Subduction Zone (Along Southwestern Chile) Using RockWorks
 Using RockWorks") 3D Visualization of Seismic Activity Associated with the Nazca and South American Plate Subduction Zone (Along Southwestern Chile) Using RockWorks Table of Contents Figure 1: Top of Nazca plate relative
3D Visualization of Seismic Activity Associated with the Nazca and South American Plate Subduction Zone (Along Southwestern Chile) Using RockWorks Table of Contents Figure 1: Top of Nazca plate relative
The relationships between Argo Steric Height and AVISO Sea Surface Height
 The relationships between Argo Steric Height and AVISO Sea Surface Height Phil Sutton 1 Dean Roemmich 2 1 National Institute of Water and Atmospheric Research, New Zealand 2 Scripps Institution of Oceanography,
Modelling, Extraction and Description of Intrinsic Cues of High Resolution Satellite Images: Independent Component Analysis based approaches
 Modelling, Extraction and Description of Intrinsic Cues of High Resolution Satellite Images: Independent Component Analysis based approaches PhD Thesis by Payam Birjandi Director: Prof. Mihai Datcu Problematic
Create a folder on your network drive called DEM. This is where data for the first part of this lesson will be stored.
 In this lesson you will create a Digital Elevation Model (DEM). A DEM is a gridded array of elevations. In its raw form it is an ASCII, or text, file. First, you will interpolate elevations on a topographic
Structural Axial, Shear and Bending Moments
 Structural Axial, Shear and Bending Moments Positive Internal Forces Acting Recall from mechanics of materials that the internal forces P (generic axial), V (shear) and M (moment) represent resultants
Laboratory #8: Structural Geology Thinking in 3D
 Name: Lab day: Tuesday Wednesday Thursday ENVG /SC 10110-20110L Planet Earth Laboratory Laboratory #8: Structural Geology Thinking in 3D http://www.nd.edu/~cneal/physicalgeo/lab-structural/index.html Readings:
1) Summary of work performed and progress made during preceding month
 Summary of work performed and progress made during preceding month") Mapping and Characterization of Recurring Spring Leads and Landfast Ice in the Chukchi and Beaufort Seas, Coastal Marine Institute Project (NOFA MMS09HQPA0004T) Monthly progress report, June 2010 1) Summary
Mapping and Characterization of Recurring Spring Leads and Landfast Ice in the Chukchi and Beaufort Seas, Coastal Marine Institute Project (NOFA MMS09HQPA0004T) Monthly progress report, June 2010 1) Summary
Brian D. Conway Hydrologist/Supervisor Geophysics-Surveying Unit
 Arizona Department of Water Resources Land Subsidence Monitoring Program Using Interferometric Synthetic Aperture Radar (InSAR) in Cochise County, Southeastern Arizona Brian D. Conway Hydrologist/Supervisor
Aneeqa Syed [Hatfield Consultants] Vancouver GIS Users Group Meeting December 8, 2010
![Aneeqa Syed [Hatfield Consultants] Vancouver GIS Users Group Meeting December 8, 2010](/thumbs/27/11179985.jpg "Aneeqa Syed [Hatfield Consultants] Vancouver GIS Users Group Meeting December 8, 2010") NEAR-REAL-TIME FLOOD MAPPING AND MONITORING SERVICE Aneeqa Syed [Hatfield Consultants] Vancouver GIS Users Group Meeting December 8, 2010 SLIDE 1 MRC Flood Service Project Partners and Client Hatfield
NEAR-REAL-TIME FLOOD MAPPING AND MONITORING SERVICE Aneeqa Syed [Hatfield Consultants] Vancouver GIS Users Group Meeting December 8, 2010 SLIDE 1 MRC Flood Service Project Partners and Client Hatfield
LiDAR for vegetation applications
 LiDAR for vegetation applications UoL MSc Remote Sensing Dr Lewis plewis@geog.ucl.ac.uk Introduction Introduction to LiDAR RS for vegetation Review instruments and observational concepts Discuss applications
Gravitational potential
 Gravitational potential Let s assume: A particle of unit mass moving freely A body of mass M The particle is attracted by M and moves toward it by a small quantity dr. This displacement is the result of
What has 16 years of Satellite Radar Altimetry given us towards Global monitoring of the Earth s inland water resources?
 What has 16 years of Satellite Radar Altimetry given us towards Global monitoring of the Earth s inland water resources? P.A.M Berry (1), R.G.Smith (1), J.A.Freeman (1) 1. EAPRS Laboratory, De Montfort
Unit 6 Direction and angle
 Unit 6 Direction and angle Three daily lessons Year 4 Spring term Unit Objectives Year 4 Recognise positions and directions: e.g. describe and find the Page 108 position of a point on a grid of squares
Monitoring of Arctic Conditions from a Virtual Constellation of Synthetic Aperture Radar Satellites
 DISTRIBUTION STATEMENT A. Approved for public release; distribution is unlimited. Monitoring of Arctic Conditions from a Virtual Constellation of Synthetic Aperture Radar Satellites Hans C. Graber RSMAS
INTERPRETATION ADDENDUM CANADIAN MINING COMPANY INC. SUITE 2300-1066 WEST HASTINGS STREET VANCOUVER, BC V6E 3X2 3D INDUCED POLARIZATION
 INTERPRETATION ADDENDUM FOR CANADIAN MINING COMPANY INC. SUITE 2300-1066 WEST HASTINGS STREET VANCOUVER, BC V6E 3X2 3D INDUCED POLARIZATION ON THE SAN BERNARDO PROJECT EL GOCHICO GRID Approximate Location:
Optical modeling of finite element surface displacements using commercial software
 Optical modeling of finite element surface displacements using commercial software Keith B. Doyle, Victor L. Genberg, Gregory J. Michels, Gary R. Bisson Sigmadyne, Inc. 803 West Avenue, Rochester, NY 14611
Structural Geology Laboratory 9 (Name)
") Structural Geology Laboratory 9 (Name) Geologic maps show the distribution of different types of structures and rock stratigraphic units generally on a topographic base such as a quadrangle map. Key structures
Structural Geology Laboratory 9 (Name) Geologic maps show the distribution of different types of structures and rock stratigraphic units generally on a topographic base such as a quadrangle map. Key structures
Files Used in this Tutorial
 Generate Point Clouds Tutorial This tutorial shows how to generate point clouds from IKONOS satellite stereo imagery. You will view the point clouds in the ENVI LiDAR Viewer. The estimated time to complete
Determination of source parameters from seismic spectra
 Topic Determination of source parameters from seismic spectra Authors Michael Baumbach, and Peter Bormann (formerly GeoForschungsZentrum Potsdam, Telegrafenberg, D-14473 Potsdam, Germany); E-mail: pb65@gmx.net
Remote Sensing and GIS based Approach for Multi-Source Landslide Mapping in Southern Kyrgyzstan
 Remote Sensing and GIS based Approach for Multi-Source Landslide Mapping in Southern Kyrgyzstan DARYA GOLOVKO 1, SIGRID ROESSNER 2, ROBERT BEHLING 3, HANS-ULRICH WETZEL 4 & HERMANN KAUFMANN 5 Southern
MONITORING MINING INDUCED GROUND-MOVEMENTS USING SAR INTERFEROMETRIC TECHNIQUES
 MONITORING MINING INDUCED GROUND-MOVEMENTS USING SAR INTERFEROMETRIC TECHNIQUES U. Wegmüller (1), T. Strozzi (1), N. Benecke (2), L. Petrat (11), M. Schlautmann (2), R. Kuchenbecker (2), J. Deutschmann
STAR Algorithm and Data Products (ADP) Beta Review. Suomi NPP Surface Reflectance IP ARP Product
 Beta Review. Suomi NPP Surface Reflectance IP ARP Product") STAR Algorithm and Data Products (ADP) Beta Review Suomi NPP Surface Reflectance IP ARP Product Alexei Lyapustin Surface Reflectance Cal Val Team 11/26/2012 STAR ADP Surface Reflectance ARP Team Member
STAR Algorithm and Data Products (ADP) Beta Review Suomi NPP Surface Reflectance IP ARP Product Alexei Lyapustin Surface Reflectance Cal Val Team 11/26/2012 STAR ADP Surface Reflectance ARP Team Member
Image courtesy of the Canadian Center for Remote Sensing
 ADWR s Land Subsidence Monitoring Program Interferometric Synthetic Aperture Radar (InSAR) Brian D. Conway Hydrology Division Geophysics/Surveying Unit Image courtesy of the Canadian Center for Remote
Using LIDAR to monitor beach changes: Goochs Beach, Kennebunk, Maine
 Geologic Site of the Month February, 2010 Using LIDAR to monitor beach changes: Goochs Beach, Kennebunk, Maine 43 o 20 51.31 N, 70 o 28 54.18 W Text by Peter Slovinsky, Department of Agriculture, Conservation
Chapter Overview. Bathymetry. Measuring Bathymetry. Echo Sounding Record. Measuring Bathymetry. CHAPTER 3 Marine Provinces
 Chapter Overview CHAPTER 3 Marine Provinces The study of bathymetry charts ocean depths and ocean floor topography. Echo sounding and satellites are efficient bathymetric tools. Most ocean floor features
CROP CLASSIFICATION WITH HYPERSPECTRAL DATA OF THE HYMAP SENSOR USING DIFFERENT FEATURE EXTRACTION TECHNIQUES
 Proceedings of the 2 nd Workshop of the EARSeL SIG on Land Use and Land Cover CROP CLASSIFICATION WITH HYPERSPECTRAL DATA OF THE HYMAP SENSOR USING DIFFERENT FEATURE EXTRACTION TECHNIQUES Sebastian Mader
APPLICATION OF SATELLITE DATA FOR IMPROVED FLOOD FORECASTING AND MAPPING
 4 th International Symposium on Flood Defence: Managing Flood Risk, Reliability and Vulnerability Toronto, Ontario, Canada, May 6-8, 2008 APPLICATION OF SATELLITE DATA FOR IMPROVED FLOOD FORECASTING AND
The impact of window size on AMV
 The impact of window size on AMV E. H. Sohn 1 and R. Borde 2 KMA 1 and EUMETSAT 2 Abstract Target size determination is subjective not only for tracking the vector but also AMV results. Smaller target
Correcting the Lateral Response Artifact in Radiochromic Film Images from Flatbed Scanners
 Correcting the Lateral Response Artifact in Radiochromic Film Images from Flatbed Scanners Background The lateral response artifact (LRA) in radiochromic film images from flatbed scanners was first pointed
Data Mining: Exploring Data. Lecture Notes for Chapter 3. Introduction to Data Mining
 Data Mining: Exploring Data Lecture Notes for Chapter 3 Introduction to Data Mining by Tan, Steinbach, Kumar What is data exploration? A preliminary exploration of the data to better understand its characteristics.
Robot Perception Continued
 Robot Perception Continued 1 Visual Perception Visual Odometry Reconstruction Recognition CS 685 11 Range Sensing strategies Active range sensors Ultrasound Laser range sensor Slides adopted from Siegwart
Relevance of moving window size in landform classification by TPI
 Relevance of moving window size in landform classification by TPI Zbigniew Zwoliński Institute Geoecology and Geoinformation Adam Mickiewicz University in Poznań Dzięgielowa 27, 61-680 Poznań, Poland zbzw@amu.edu.pl
Building 1D reference velocity model of the Irpinia region (Southern Apennines): microearthquakes locations and focal mechanism
: microearthquakes locations and focal mechanism") Building 1D reference velocity model of the Irpinia region (Southern Apennines): microearthquakes locations and focal mechanism Tutor Prof. Raffaella De Matteis PhD student Emanuela Matrullo Geophisics
Building 1D reference velocity model of the Irpinia region (Southern Apennines): microearthquakes locations and focal mechanism Tutor Prof. Raffaella De Matteis PhD student Emanuela Matrullo Geophisics
Application Report: Running µshape TM on a VF-20 Interferometer
 : Running µshape TM on a VF-20 Interferometer General This report describes how a fiber interferometer from Arden Photonics Ltd was used together with the µshape TM Generic software package. The VF-20
Digital image processing
 746A27 Remote Sensing and GIS Lecture 4 Digital image processing Chandan Roy Guest Lecturer Department of Computer and Information Science Linköping University Digital Image Processing Most of the common
3D Interactive Information Visualization: Guidelines from experience and analysis of applications
 3D Interactive Information Visualization: Guidelines from experience and analysis of applications Richard Brath Visible Decisions Inc., 200 Front St. W. #2203, Toronto, Canada, rbrath@vdi.com 1. EXPERT
MODULATION TRANSFER FUNCTION MEASUREMENT METHOD AND RESULTS FOR THE ORBVIEW-3 HIGH RESOLUTION IMAGING SATELLITE
 MODULATION TRANSFER FUNCTION MEASUREMENT METHOD AND RESULTS FOR THE ORBVIEW-3 HIGH RESOLUTION IMAGING SATELLITE K. Kohm ORBIMAGE, 1835 Lackland Hill Parkway, St. Louis, MO 63146, USA kohm.kevin@orbimage.com
Ground Penetrating Radar Survey of a Portion of the Riverside Cemetery, Hopkinsville, Kentucky
 Ground Penetrating Radar Survey of a Portion of the Riverside Cemetery, Hopkinsville, Kentucky October 2012 Report prepared by Anthony L. Ortmann, Ph.D. Assistant Professor Department of Geosciences Murray
Using Google Earth to Explore Plate Tectonics
 Using Google Earth to Explore Plate Tectonics Laurel Goodell, Department of Geosciences, Princeton University, Princeton, NJ 08544 laurel@princeton.edu Inspired by, and borrows from, the GIS-based Exploring
COMPARISON OF OBJECT BASED AND PIXEL BASED CLASSIFICATION OF HIGH RESOLUTION SATELLITE IMAGES USING ARTIFICIAL NEURAL NETWORKS
 COMPARISON OF OBJECT BASED AND PIXEL BASED CLASSIFICATION OF HIGH RESOLUTION SATELLITE IMAGES USING ARTIFICIAL NEURAL NETWORKS B.K. Mohan and S. N. Ladha Centre for Studies in Resources Engineering IIT
Havnepromenade 9, DK-9000 Aalborg, Denmark. Denmark. Sohngaardsholmsvej 57, DK-9000 Aalborg, Denmark
 Urban run-off volumes dependency on rainfall measurement method - Scaling properties of precipitation within a 2x2 km radar pixel L. Pedersen 1 *, N. E. Jensen 2, M. R. Rasmussen 3 and M. G. Nicolajsen
A HYDROLOGIC NETWORK SUPPORTING SPATIALLY REFERENCED REGRESSION MODELING IN THE CHESAPEAKE BAY WATERSHED
 A HYDROLOGIC NETWORK SUPPORTING SPATIALLY REFERENCED REGRESSION MODELING IN THE CHESAPEAKE BAY WATERSHED JOHN W. BRAKEBILL 1* AND STEPHEN D. PRESTON 2 1 U.S. Geological Survey, Baltimore, MD, USA; 2 U.S.