The Main Page of RE STATS will provide the range of data at the very top of the page.
|
|
|
- Shauna Boyd
- 7 years ago
- Views:
Transcription


1 RE STATS Navigator can be accessed from Tempo under the Financials Tab at the top. It will be your bottom option under the drop down menu. The Main Page of RE STATS will provide the range of data at the very top of the page.


2 The first step in creating a new search is to open the search panel. When you choose the option Open Search Panel the search panel will appear there is also an advanced search criteria option on the page. Choose the fields you want for your search and then name your search. Once your search is named, click the submit option at the top of the page and then on the control panel click save to save your search. Your search now will appear in the saved search section of the upper info box. Now close the search panel and start reviewing the many features of RE STATS. Please Note: With Statistics the larger the pool of data, the more accurate and meaningful the statistic and graphs.

3 Summary Be identified as the market expert. Provide important real estate information to potential clients at the click of a button! Activate the Summary Dashboard! Monthly Key Metrics Quickly identify the year over year statistics of various key metrics and calculations. Use the drop-down list (controller) to switch between average and median values. Advanced Analysis Reports Make it easy for you to relay the key metrics to clients as well as the general public. By selecting the Inventory Analysis report, you will produce the Advanced Analysis Report into a newsletter format and send it to current or future clients as well as post the information on your website, blog or monthly campaign. KPM Summary By looking at each key indicator, quickly identify which way the market is going based on each key metric and calculation.


4 Market Trends RE STATS Inc. Special Points Be identified as the market expert. Our graphical dashboard features, deliver comprehensive market summary information in seconds. Activate the Market Trends Dashboard! Market Distribution Displays statistical analysis by Key Distribution Indices such as: Price District City Zipcode County Class Style Type, and more... > Dynamically switch indices by clicking on the controllers in each box. > Look at comparative growth numerically and by percentage > Drill-down functionality to additional dashboards Market Metrics Market Metrics displays statistical analysis by Key Metrics such as: Information is displayed in four sections: Units Volume AVG Days On Market Median Days on Market AVG Asked to Sold Ratio Median Asked to Sold Ratio AVG Price Market Summary Market Summary displays the main Key Metrics and growth by year-over-year in numerical or percentage value. Market Dynamics Market Dynamics are displayed by Key Distribution Indices (KDI). This section also includes drill-down functionality that will launch the Inventory Analyzer dashboard specifically for the underlining KDI that you isolate.

5 Trend Analyzer RE STATS Inc. Special Points Be identified as the market expert. Easily understand the current market conditions based on Closed Listings within your selected criteria. Activate the Trends Analyzer Dashboard! Key Metrics Summary This section provides a year-over-year comparative summary of the Key Metrics including the growth and decline in a percentage format Quickly determine the market conditions in a selected area and Key Metrics such as: > Provide long-term(12 month) and short term (3 month, 1 month) trends to potential clients. > Quickly identify the direction the market is going by looking at the market indicators of each key metric. Units Volume Average Price Average Days on Market Average Sold to Asked Ratio Market Trends Graphs and Comparative Analysis Instantly identify current trend information used for market research and substantiate expert recommendations. Identify the 12 month; year versus year comparative trend and growth analysis of the market. Use the drop down list (controller) to view the market conditions of the different Key Metrics. The Comparative Analysis section calculates the growth and decline of each month automatically and simplifies the reporting process for you. Comparative Dynamics This area quickly magnifies the temperature of the real estate market by Key Metrics and allows you to compare the growth of an area based on a 3 month and 12 month analysis The year-over-year comparative of the ceiling and floor allows members to identify the high and low of market indices based on the Key Metrics (controller) drop down list.
 and short term (3 month, 1 month) trends to potential clients.")
6 Inventory Analyzer Be identified as the market expert. Activate the Inventory Analysis Dashboard! Inventory Metrics Key Metrics are automatically calculated and summarized to give vital information on Market Inventory. Metrics such as: Average Sales per Month Sold versus Listed Unit Ratio Average Days on Market Active Listings* *This value represents the last available count of active listings based on the most recent update. RE STATS Inc. Special Points > Members quickly get a sense of the market shifts based on easily identifying growth and decline indicators by Units and by Volume Look at each Key Status (Listed, Closed, Pending and Expired) in the sales cycle, while reporting on their ever changing values on a monthly and yearly basis. Inventory Trends Members will identify the most recent and accurate trends in order to better understand the current market conditions. Members have the ability to view a 12 month summary or isolate individual months in a yearover-year analysis of each Key Status. Users then can track the Key Metrics for each status both visually and in a numerical format with our Mouse-Over functionality adding more dimensions to the data.. Comparative Trends Users can track monthly and yearly changes within each Key Status using reference benchmarks to substantiate key negotiation points

7 Inventory Metrics Be identified as the market expert. Activate the Inventory Metrics Dashboard! These calculations are set up to provide you with an easier way to identify the growth or decline of market indicators. Calculations such as Absorption Rate, Months Supply and Listed vs. Closed Ratio are readily available in various time windows. RE STATS Inc. Special Points > All values and calculations are compared to the previous twelve months to give users a sense of relativity


8 Easily cross reference multiple fields to determine the characteristics that are in demand in any area. Price Analyzer Be identified as the market expert. Activate the Price Analyzer Dashboard! Summary Identify the top yielding indices for the selected criteria. Price Range, Bedrooms, Bathrooms and Square Foot Range are always displayed. There are 2 additional controllers to display the indices of your choice. Quickly identify the price range and features that are in demand for your area. RE STATS Inc. Special Points > Use the Metrics table to substantiate your recommendations as a professional realtor by easily crossreferencing multiple fields to identify correlational information. Price Distribution Analysis This section provides a graphical view displaying the distribution of the total units in each price range. The controller changes the increments to: $10,000 $25,000 $50,000 $100,000 $250,000


9 Price Analyzer - Analysis View Price Analysis Table - This section provides detailed metrics and top indices for each price range Units is displayed in either total units or units by percentage of total units. Quickly identify the price range that has the most closed units. Days on Market, Sold Price, and Sold Price vs. Listed Price is displayed as Median or Average values. Compare the performance in each price range to the performance of the entire area. Closed Units by DOM - This graph displays a distribution of the total units within each Days on Market performance level. The graph can be displayed in terms of 12 weeks or 12 months For example, there were 290 closed units in the last 12 months that closed with a Days on Market of 1 to units closed within 8 to 14 days on market. Users can view the top yielding index from: Area City/County Zipcode School District Subdivision Property Type Style Median/Average Asked$ vs. Sold$ % by DOM - This graph displays the average/median sold price vs. listed price ratio within each Days on Market performance level. The graph can be displayed in terms of 12 weeks or 12 months. For example, the average sold vs. listed price ratio of homes that closed in the first 30 days was 97.87%. The average sold vs. listed price ratio of homes that closed between 31 and 60 days was 96.65%. Price Analyzer - Metrics View Index Distribution Matrix - This table displays the distribution of each key index within each given price range. Key indices displayed are: Bedrooms Bathrooms Square Feet (1000 s)

10 Market Intelligence RE STATS Inc. Special Points Be identified as the market expert. Take out the second guessing when setting up your marketing campaign. Activate the Market Intel Dashboard! Progressive Trends After identifying what area you would like to research on, observe the peaks and valleys of the market > By clicking on any Distribution Index, the Metric and Progressive Trend Graphs will change Know which areas are selling the most homes so you will be able to maximize your marketing dollars. Metric Graphs These graphs provide a year over year trend of each key metric for the specified area. With this view, you can compare the current market conditions to the conditions of years past. Index Matrix - Identify the areas that will give you the most return on your marketing investment. Users use this matrix by cross-referencing the various indices to identify areas that best match their target market. User can identify: the top Property Type in each MLS Area the top Zipcode in each city the top price range in each zipcode Information is displayed based on key indices Each column is sortable by both ascending and descending order to identify the floor and ceiling for each key index Each key metric displays the current number as well as the previous 12 month s comparative. This will help you see the growth of each key metric; and help determine if the area you would like to work in is getting better or worse and by how much. Current Top Price Range - this number is displayed based on the Main Distribution Index chosen. This number shows you the top price range for the area chosen. The percentage shows you, out of 100%, the number of homes that sold in that price range for the area chosen. Current Top Yielded Index - this will display the index that has sold the most units for the area chosen.


11 Key Reports Market Graphs Be identified as the market expert. These graphs provide a monthly view isolating Key Metrics over the last 12 months These graphs clearly display the seasonal market shifts for realtors and homeowners to easily interpret. Units Volume AVG/Median Days on Market AVG/Median Asked to Sold Ratio AVG/Median Price Sold by Days on Market Asked to Sold Ratio by Days on Market Performance Distribution These reports display the distribution of the total units for each Key Index. These reports help realtors identify top performing indices. New realtors will be able to determine a suitable market to start their business. Seasoned veterans will be able to identify markets that give them the best return on investment. Price City Zipcode County Class Style Month Agent Distribution - These reports display the distribution of agents at each production level. For example, 592 agents had 1 transaction close between June 1, 2008 and May 31, 2009 in the City/County of Chesterfield. 225 agents had 2 transactions close in the same timeframe and area. New and experienced agents can use these reports to help in setting realistic performance goals. For example, by achieving a production level of 6 listed units that close between June 1, 2008 and May 31, 2009 in the City/County of Chesterfield, agents will be among the top 7% of all listing agents.

12 Market Trends - prepared for RAR/ CVR MLS Education Closed Date From Oct 01, 2012 To Sep 30, 2013 Area Delimited by Entire CVR MLS Closed Sales by Total Volume Sold Data compiled from the Central Virginia Regional MLS Report Produced on: Oct 28, M Market Trends 400.0M 300.0M 255.7M 259.7M 259.3M 242.7M 306.3M 387.4M 421.9M 412.9M 396.5M 300.8M 200.0M 185.5M 200.9M Ready to Buy or Sell Real Estate? Contact an experienced REALTOR 100.0M 0 Oct 2012 Nov 2012 Dec 2012 Jan 2013 Feb 2013 Mar 2013 Apr 2013 May 2013 Jun 2013 Jul 2013 Aug 2013 Sep 2013 Reports produced and compiled by RE STATS Inc Information is deemed reliable but not guaranteed. Does not reflect all market activity. Contact: RAR/ CVR MLS Education Ph: Plynch@rarealtors.com pp. 1

13 Market Trends - prepared for RAR/ CVR MLS Education Closed Date From Oct 01, 2012 To Sep 30, 2013 Area Delimited by Entire CVR MLS Closed Sales by Units Sold Data compiled from the Central Virginia Regional MLS Report Produced on: Oct 25, ,000 Market Trends 1,186 1,192 1,178 1,195 1,422 1,710 1,749 1,729 1,643 1,328 1, Ready to Buy or Sell Real Estate? Contact an experienced REALTOR 0 Oct 2012 Nov 2012 Dec 2012 Jan 2013 Feb 2013 Mar 2013 Apr 2013 May 2013 Jun 2013 Jul 2013 Aug 2013 Sep 2013 Reports produced and compiled by RE STATS Inc Information is deemed reliable but not guaranteed. Does not reflect all market activity. Contact: RAR/ CVR MLS Education Ph: Plynch@rarealtors.com pp. 1

14 Market Trends - prepared for RAR/ CVR MLS Education Closed Date From Oct 01, 2012 To Sep 30, 2013 Area Delimited by Entire CVR MLS Closed Sales by Average Days On Market Data compiled from the Central Virginia Regional MLS Report Produced on: Oct 25, Market Trends Ready to Buy or Sell Real Estate? Contact an experienced REALTOR Oct 2012 Nov 2012 Dec 2012 Jan 2013 Feb 2013 Mar 2013 Apr 2013 May 2013 Jun 2013 Jul 2013 Aug 2013 Sep 2013 Reports produced and compiled by RE STATS Inc Information is deemed reliable but not guaranteed. Does not reflect all market activity. Contact: RAR/ CVR MLS Education Ph: Plynch@rarealtors.com pp. 1

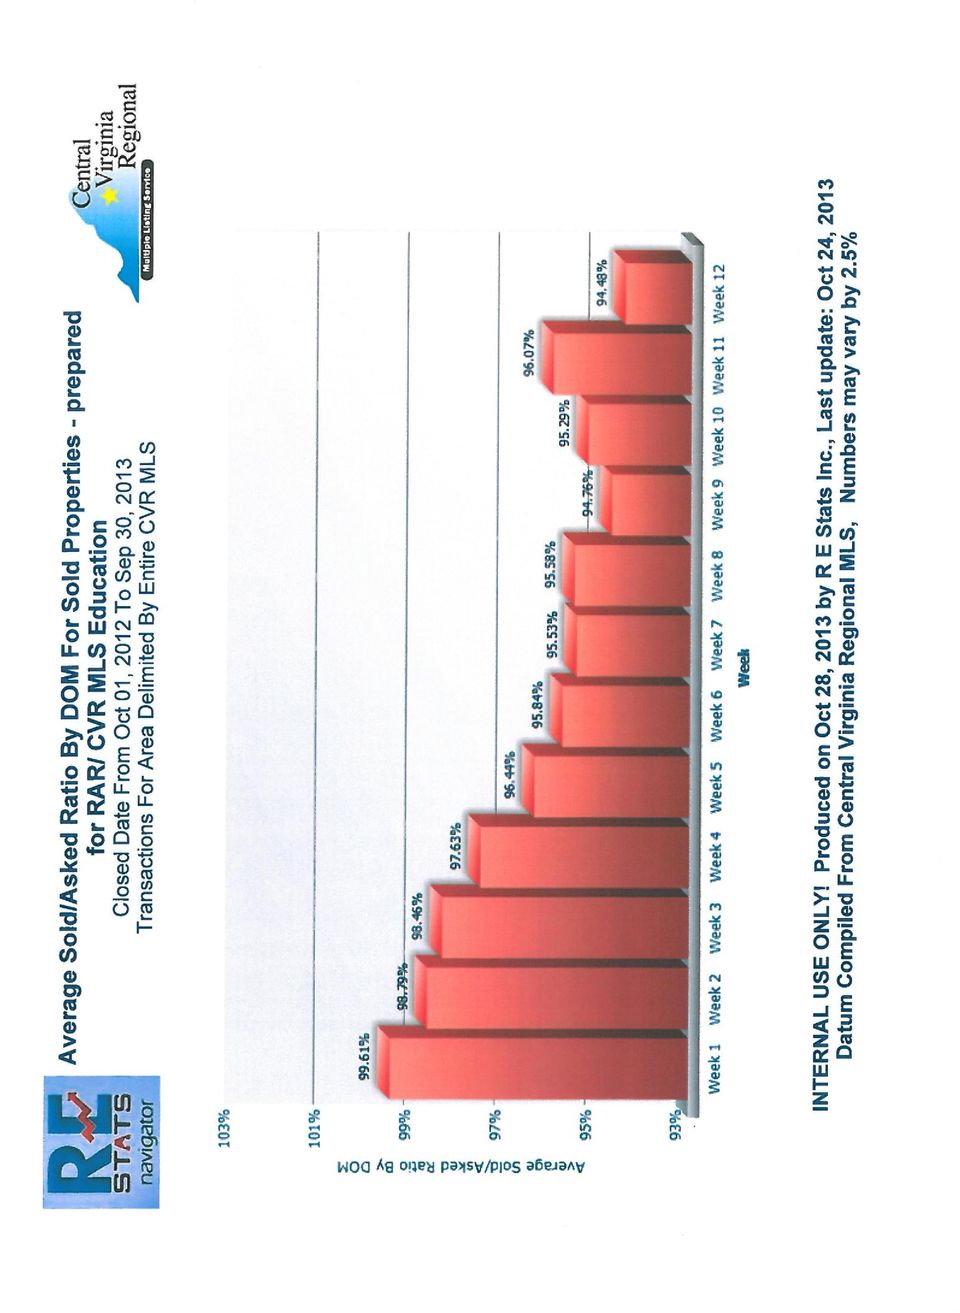
15 Market Trends - prepared for RAR/ CVR MLS Education Closed Date From Oct 01, 2012 To Sep 30, 2013 Area Delimited by Entire CVR MLS Closed Sales by Average Sold Per Asked Ratio Data compiled from the Central Virginia Regional MLS Report Produced on: Oct 25, % Market Trends 97% 96.72% 96.87% 97.61% 97.21% 96.82% 97.44% 96.22% 96.22% 96.22% 96.22% Ready to Buy or Sell Real Estate? Contact an experienced REALTOR 96% 95% 95.74% 95.74% Oct 2012 Nov 2012 Dec 2012 Jan 2013 Feb 2013 Mar 2013 Apr 2013 May 2013 Jun 2013 Jul 2013 Aug 2013 Sep 2013 Reports produced and compiled by RE STATS Inc Information is deemed reliable but not guaranteed. Does not reflect all market activity. Contact: RAR/ CVR MLS Education Ph: Plynch@rarealtors.com pp. 1

16 Market Trends - prepared for RAR/ CVR MLS Education Closed Date From Oct 01, 2012 To Sep 30, 2013 Area Delimited by Entire CVR MLS Closed Sales by Average Sold Price Data compiled from the Central Virginia Regional MLS Report Produced on: Oct 25, K 241K 241K Market Trends 240K 227K 239K 226K 230K 220K 218K Ready to Buy or Sell Real Estate? Contact an experienced REALTOR 220K 210K 216K 215K 206K 204K 203K Oct 2012 Nov 2012 Dec 2012 Jan 2013 Feb 2013 Mar 2013 Apr 2013 May 2013 Jun 2013 Jul 2013 Aug 2013 Sep 2013 Reports produced and compiled by RE STATS Inc Information is deemed reliable but not guaranteed. Does not reflect all market activity. Contact: RAR/ CVR MLS Education Ph: Plynch@rarealtors.com pp. 1

17

18
19 Glossary DEFINITIONS Active Listings*: The number of active listings at a specific point in time. Also referred to as Active Inventory AV: Average Closed Sales: Transactions with a closed status and closing date falls within the selected timeframe. Distribution: How the total data is grouped together across a choice of market indices such as price range, area or zip code. DOM: Days On Market. Refers to the last list date to change of status date. - List DOM also known as Active DOM is calculated from the last list date to the current update date. - Sold DOM also known as Pending or Under Contract DOM is calculated from the last list date to the sold, pending or under contract date. - Closed DOM also known as Firmed or Finalized DOM is calculated from the last list date to the closed, firmed or finalized date. - Expired DOM is calculated from the last list date to the expired date. - Withdrawn DOM is calculated from the last list date to the withdrawn date. - Other Off-Market DOM including, but not limited to suspended, terminated, or cancelled is calculated from the last list date to the suspended, terminated or cancelled date. KM: Key Metrics or significant indices selected to display as numbers or percentages KPM: Short for Key Performance Metrics, the term used to summarize the market trend indicators for an area Listed: The number of properties showing as active in the MLS at midnight of the last day of the month shown. Median: The middle number in a series of numbers. Median does not change even if other numbers in the series change in value. Thus median tends to minimize the effect of anomalies. Month End Inventory: Properties that are active and available for purchase on the last day of the month. New Listings: Newly listed properties Pending Sales: Transactions with a pending/sold status and closing date falls within the selected timeframe Property Type: Single-Family, Condo, Multi-Family, Land, etc. Trends: Direction, Distribution and Difference of Market characteristics or indices compare and viewed either year to year or month to month. Type: Attached or Detached structures Units: Individual property records. Volume: Total dollars

20 Glossary CALCULATIONS A/S%: Asking (Listed Price) versus Sold (Closed) Price. Shows accepted offers that successfully closed in relationship to the Listed Price at the time of sale. Absorption: Average number of properties sold per month over the given period. AVG Sales/Month: Average sales per month of the previous 12 month period. Also called Absorption Rate. Average Last List Price at Closing: The last listed price of all qualifying transactions is recorded. Averages are then calculated Average Last List Price to Closed Price: Calculations is derived by dividing closing price by the last listed price. The ration for all transactions is then calculated and recorded. Next all the ratios are averaged out to arrive at the final number. Average $ Growth: Calculated by taking the Average Closing Price for the last twelve months then subtracting the Average Closing Price of exactly 1 year prior. Inventory Supply: The number of the months, in theory, it would take for all active listings to sell if no additional properties were listed during the time period. Also referred to as Months Supply of Inventory or Supply. Sold vs. Listed %: The percentage of properties sold compared to new listings. Also referred to as Sales Success

SAN JUAN ISLAND Su M Tu W Th F Sa
 Su M Tu W Th F Sa 2 3 4 5 6 Monday, August 7 8 9 2 3 4 5 6 7 8 9 2 2 22 23 24 25 26 27 28 29 3 3 26 TABLE OF CONTENTS Charts and Commentary.. Pages 2 Market Summary Table.. Page 3 Glossary... Page 4 Windermere
AT&T Global Network Client for Windows Product Support Matrix January 29, 2015
 AT&T Global Network Client for Windows Product Support Matrix January 29, 2015 Product Support Matrix Following is the Product Support Matrix for the AT&T Global Network Client. See the AT&T Global Network
Scott Market Report. Weather Affects Winter Sales
 Mar. Apr. 2014 Scott Market Report Weather Affects Winter Sales Sales of real estate through the Outer Banks Association of Realtors MLS system for the last few months has been similar to the last two
COMPARISON OF FIXED & VARIABLE RATES (25 YEARS) CHARTERED BANK ADMINISTERED INTEREST RATES - PRIME BUSINESS*
 CHARTERED BANK ADMINISTERED INTEREST RATES - PRIME BUSINESS*") COMPARISON OF FIXED & VARIABLE RATES (25 YEARS) 2 Fixed Rates Variable Rates FIXED RATES OF THE PAST 25 YEARS AVERAGE RESIDENTIAL MORTGAGE LENDING RATE - 5 YEAR* (Per cent) Year Jan Feb Mar Apr May Jun
COMPARISON OF FIXED & VARIABLE RATES (25 YEARS) 2 Fixed Rates Variable Rates FIXED RATES OF THE PAST 25 YEARS AVERAGE RESIDENTIAL MORTGAGE LENDING RATE - 5 YEAR* (Per cent) Year Jan Feb Mar Apr May Jun
CATHEDRAL CITY Su M Tu W Th F Sa
 Su M Tu W Th F Sa 1 2 3 4 5 6 Monday, August 1 7 8 9 1 11 12 13 14 15 16 17 18 19 2 21 22 23 24 25 26 27 28 29 3 31 216 TABLE OF CONTENTS Charts and Commentary.. Pages 12 Market Summary Table.. Page 3
Su M Tu W Th F Sa TABLE OF CONTENTS
 Su M Tu W Th F Sa 1 2 3 4 5 6 Monday, August 1 7 8 9 1 11 12 13 14 15 16 17 18 19 2 21 22 23 24 25 26 27 28 29 3 31 216 TABLE OF CONTENTS Charts and Commentary.. Pages 12 Market Summary Table.. Page 3
Case 2:08-cv-02463-ABC-E Document 1-4 Filed 04/15/2008 Page 1 of 138. Exhibit 8
 Case 2:08-cv-02463-ABC-E Document 1-4 Filed 04/15/2008 Page 1 of 138 Exhibit 8 Case 2:08-cv-02463-ABC-E Document 1-4 Filed 04/15/2008 Page 2 of 138 Domain Name: CELLULARVERISON.COM Updated Date: 12-dec-2007
March 2015 Las Vegas Metro Residential Housing Sales
 March 2015 Las Vegas Metro Residential Housing Sales SFR Transactions - Inventory While one data point does not a trend make the increasing amplitude in weekly closings combined with a look at March closings
Based on Chapter 11, Excel 2007 Dashboards & Reports (Alexander) and Create Dynamic Charts in Microsoft Office Excel 2007 and Beyond (Scheck)
 and Create Dynamic Charts in Microsoft Office Excel 2007 and Beyond (Scheck)") Reporting Results: Part 2 Based on Chapter 11, Excel 2007 Dashboards & Reports (Alexander) and Create Dynamic Charts in Microsoft Office Excel 2007 and Beyond (Scheck) Bullet Graph (pp. 200 205, Alexander,
Reporting Results: Part 2 Based on Chapter 11, Excel 2007 Dashboards & Reports (Alexander) and Create Dynamic Charts in Microsoft Office Excel 2007 and Beyond (Scheck) Bullet Graph (pp. 200 205, Alexander,
Analysis One Code Desc. Transaction Amount. Fiscal Period
 Analysis One Code Desc Transaction Amount Fiscal Period 57.63 Oct-12 12.13 Oct-12-38.90 Oct-12-773.00 Oct-12-800.00 Oct-12-187.00 Oct-12-82.00 Oct-12-82.00 Oct-12-110.00 Oct-12-1115.25 Oct-12-71.00 Oct-12-41.00
An Assessment of Prices of Natural Gas Futures Contracts As A Predictor of Realized Spot Prices at the Henry Hub
 An Assessment of Prices of Natural Gas Futures Contracts As A Predictor of Realized Spot Prices at the Henry Hub This article compares realized Henry Hub spot market prices for natural gas during the three
Enhanced Vessel Traffic Management System Booking Slots Available and Vessels Booked per Day From 12-JAN-2016 To 30-JUN-2017
 From -JAN- To -JUN- -JAN- VIRP Page Period Period Period -JAN- 8 -JAN- 8 9 -JAN- 8 8 -JAN- -JAN- -JAN- 8-JAN- 9-JAN- -JAN- -JAN- -JAN- -JAN- -JAN- -JAN- -JAN- -JAN- 8-JAN- 9-JAN- -JAN- -JAN- -FEB- : days
Accident & Emergency Department Clinical Quality Indicators
 Overview This dashboard presents our performance in the new A&E clinical quality indicators. These 8 indicators will allow you to see the quality of care being delivered by our A&E department, and reflect
Housing Price Forecasts. Illinois and Chicago PMSA, April 2014
 Housing Price Forecasts Illinois and Chicago PMSA, April 2014 Presented To Illinois Association of Realtors From R E A L Regional Economics Applications Laboratory, Institute of Government and Public Affairs
Monthly Statistics Package January 2016
 Vancouver Island Real Estate Board Monthly Statistics Package January 2016 FOR IMMEDIATE RELEASE February 1, 2016 Housing Market Kicks Off 2016 With Strong Sales NANAIMO, BC The Vancouver Island housing
BEHIND UNDERSTANDING AND MANAGING. SaaS BUSINESSES. Recurly counts some of the world s most successful subscription businesses as its customers
 BEHIND UNDERSTANDING AND MANAGING SaaS BUSINESSES Recurly counts some of the world s most successful subscription businesses as its customers Subscription and Software-as-a-Service (SaaS) are commonly
Discussion of Discounting in Oil and Gas Property Appraisal
 Discussion of Discounting in Oil and Gas Property Appraisal Because investors prefer immediate cash returns over future cash returns, investors pay less for future cashflows; i.e., they "discount" them.
Ashley Institute of Training Schedule of VET Tuition Fees 2015
 Ashley Institute of Training Schedule of VET Fees Year of Study Group ID:DECE15G1 Total Course Fees $ 12,000 29-Aug- 17-Oct- 50 14-Sep- 0.167 blended various $2,000 CHC02 Best practice 24-Oct- 12-Dec-
Supply and demand analysis of single-family residential units in Carroll County, Georgia
 Supply and demand analysis of single-family residential units in Carroll County, Georgia ABSTRACT Nyerere Delauney University of West Georgia James Burton University of West Georgia Salil Talpade University
The Reporting Console
 Chapter 1 The Reporting Console This chapter provides a tour of the WebTrends Reporting Console and describes how you can use it to view WebTrends reports. It also provides information about how to customize
Discussion Outline. A. KPIs Defined. B. Why KPIs Matter. C. KPI Menu. D. Implementation. E. Example KPIs. F. Pitfalls
 Discussion Outline A. KPIs Defined B. Why KPIs Matter C. KPI Menu D. Implementation E. Example KPIs F. Pitfalls 1 Key Performance Indicators (KPI s) Defined Periodic assessment of an organization, business
Matrix. Creating a CMA Report. For Support: (800) 925-1525. Support Hours: M-F 8:30 AM 9:00 PM Sat-Sun: 10:00 AM 3:00 PM www.crmls.
 925-1525. Support Hours: M-F 8:30 AM 9:00 PM Sat-Sun: 10:00 AM 3:00 PM www.crmls.") Matrix Creating a CMA Report For Support: (800) 925-1525 Support Hours: M-F 8:30 AM 9:00 PM Sat-Sun: 10:00 AM 3:00 PM www.crmls.org/support All rights reserved. No part of this publication may be reproduced,
Matrix Creating a CMA Report For Support: (800) 925-1525 Support Hours: M-F 8:30 AM 9:00 PM Sat-Sun: 10:00 AM 3:00 PM www.crmls.org/support All rights reserved. No part of this publication may be reproduced,
1. Introduction. 2. User Instructions. 2.1 Set-up
 1. Introduction The Lead Generation Plan & Budget Template allows the user to quickly generate a Lead Generation Plan and Budget. Up to 10 Lead Generation Categories, typically email, telemarketing, advertising,
USER GUIDE ES REAL ESTATE MANAGEMENT. Contacts
 USER GUIDE ES REAL ESTATE MANAGEMENT General Introduction ES Real Estate Management is built on an Idea to simplify the obvious complications evolved in Real Estate Business Flow. The system provides the
Simple Inventory Management
 Jon Bennett Consulting http://www.jondbennett.com Simple Inventory Management Free Up Cash While Satisfying Your Customers Part of the Business Philosophy White Papers Series Author: Jon Bennett September
Analyzing price seasonality
 Analyzing price seasonality Asfaw Negassa and Shahidur Rashid Presented at the COMESA policy seminar Food price variability: Causes, consequences, and policy options" on 25-26 January 2010 in Maputo, Mozambique
Matrix Advanced User Manual
 & CRMLS Matrix Advanced User Manual www.srar.com www.crmlsmobile.com (for small screen devices like Smartphones) CRIS HELPLINE: SFV 818-947-2202 SCV 661-295-7117 email: techsupport@srar.com Mar-2011 More
BMO NESBITT BURNS. Gateway User Guide. An Online Standard in Connectivity
 BMO NESBITT BURNS Gateway User Guide An Online Standard in Connectivity Gateway User Guide Table of Contents Introduction................................ Signing into Gateway... Ensuring the Security of
quick start guide A Quick Start Guide inflow Support GET STARTED WITH INFLOW
 GET STARTED WITH INFLOW quick start guide Welcome to the inflow Community! This quick-start guide includes all the important stuff to get you tracking your inventory before you know it! Just follow along
July 2015 Montgomery County Market Trends Report Townhouses and condos lead the way in sales gains
 FOR IMMEDIATE RELEASE Contact: Bobette Banks 301-590-8764 Director of Communications Greater Capital Area Association of REALTORS bbanks@gcaar.com July 2015 Montgomery County Market Trends Report Townhouses
AL GULF COAST CONDOS Su M Tu W
 REL ESTTE RKET REPORT L GULF COST CONDOS Su Tu W 1 2 3 7 8 9 1 14 15 16 17 21 22 23 24 28 29 3 31 Th F Sa onday, ugust 1 4 5 6 216 11 12 13 18 19 2 25 26 27 TBLE OF CONTENTS Charts and Commentary.. Pages
How to create a winning CMA
 Purpose: This 3-hour course is will teach you how to create a Comparative Market Analysis (CMA) before listing a home for sale. We will show you how to research a home using the Internet, Tax Records,
July 2015 Washington, DC Market Trends Report Another strong month for District home sales as supply remains tight
 FOR IMMEDIATE RELEASE Contact: Bobette Banks 301-590-8764 Director of Communications Greater Capital Area Association of REALTORS bbanks@gcaar.com July 2015 Washington, DC Market Trends Report Another
FCR The Driver of All Other Metrics
 1 At SQM, we measure all major voice of the customer (VoC) metrics, such as customer satisfaction (Csat), ease of effort, net promoter score (NPS) and word of mouth index (WoMI). SQM also measures moments
House for sale (Dept. of Finance) Real Estate
 Real Estate") House for sale (Dept. of Finance) Real Estate The residential real estate market turned in another solid performance in 2010. Strong demand for housing during the first half of 2010 was fuelled by record
House for sale (Dept. of Finance) Real Estate The residential real estate market turned in another solid performance in 2010. Strong demand for housing during the first half of 2010 was fuelled by record
CREDIT UNION TRENDS REPORT
 $ in Billions CREDIT UNION TRENDS REPORT CUNA Mutual Group Economics July 216 (May 216 Data) Highlights During May, credit unions picked-up 431, in new memberships, loan and savings balances grew at an
Challenging economies and major fluctuations in demand require changes in commodity management
 Supply Management Raw Material Sourcing Strategies Are Critical to Revenue and Profit Margins by Mickey North Rizza April 2010 Challenging economies and major fluctuations in demand require changes in
ABOUT THIS DOCUMENT ABOUT CHARTS/COMMON TERMINOLOGY
 A. Introduction B. Common Terminology C. Introduction to Chart Types D. Creating a Chart in FileMaker E. About Quick Charts 1. Quick Chart Behavior When Based on Sort Order F. Chart Examples 1. Charting
Using Cash Flow Tracker
 Using Cash Flow Tracker About this guide This guide helps you understand the information provided in the Cash Flow Tracker. Important information This data is available to all CommBiz services, but user
Marathon Data Systems
 Marathon Data Systems Executive Dashboard Executive Dashboard is a powerful business intelligence tool that allows owners, managers and executives to: Easily see trends that exist within the data that
Microsoft Dynamics NAV
 Microsoft Dynamics NAV Maximizing value through business insight Business Intelligence White Paper November 2011 The information contained in this document represents the current view of Microsoft Corporation
Driving Action through. Title Style. Moderated by: Sarah Zaleski U.S. DOE
 Driving Action through Click Energy To Data Edit Visualization Master Title Style Moderated by: Sarah Zaleski U.S. DOE Driving Action through Energy Data Visualization Dan Walworth HEI Hotels HEI Hotels
Insurance and Banking Subcommittee
 Insurance and Banking Subcommittee Citizens Depopulation Update September 16, 2015 Christine Ashburn VP Communications, Legislative and External Affairs 2 3 Depopulation Customer Communications 1. 40 days
Stock Market Indicators: Historical Monthly & Annual Returns
 Stock Market Indicators: Historical Monthly & Annual Returns July 31, 1 Dr. Edward Yardeni 51-97-73 eyardeni@ Joe Abbott 7397-53 jabbott@ Please visit our sites at blog. thinking outside the box Table
Loudoun County 1 st Quarter Housing Trends
 Loudoun County 1 st Quarter Housing Trends Presentation to Dulles Area Association of Realtors Corey Hart, Sr. Product Manager RealEstate Business Intelligence April 24, 2015 A quick peek at March trends
Single Property Website Quickstart Guide
 Single Property Website Quickstart Guide Win More Listings. Attract More Buyers. Sell More Homes. TABLE OF CONTENTS Getting Started... 3 First Time Registration...3 Existing Account...6 Administration
2016 Examina on dates
 Please note the following informa on: The following exams are available throughout the year: Please click on the exam for which you wish to see the dates. When you have finished, you can select to return
Top Marketer Marketing Tools FAQ
 Top Marketer Marketing Tools FQ Market Snapshot Market Snapshot Pro Newsletter Market Data Contents General... 3 Which browsers are supported by Top Marketer?... 3 What is all the information that appears
The Thinking Approach LEAN CONCEPTS. 2012-2013, IL Holdings, LLC All rights reserved 1
 The Thinking Approach LEAN CONCEPTS All rights reserved 1 Basic Thinking to Manage the Journey MANAGEMENT TACTICS OF A LEAN TRANSFORMATION All rights reserved 2 LEAN MANAGEMENT Two key questions What is
THE RETURN-ON-INVESTMENT (ROI) OF CRM SOLUTIONS
 OF CRM SOLUTIONS") THE RETURN-ON-INVESTMENT (ROI) OF CRM SOLUTIONS Russ Lombardo PEAK Sales Consulting, LLC russ@peaksalesconsulting.com www.peaksalesconsulting.com THE RETURN-ON-INVESTMENT (ROI) OF CRM SOLUTIONS Measurements
THE RETURN-ON-INVESTMENT (ROI) OF CRM SOLUTIONS Russ Lombardo PEAK Sales Consulting, LLC russ@peaksalesconsulting.com www.peaksalesconsulting.com THE RETURN-ON-INVESTMENT (ROI) OF CRM SOLUTIONS Measurements
Estimated Crush Margins for Hog Producers, 2006-2015 Lee Schulz 1 Iowa State University
 Estimated Crush Margins for Hog Producers, 2006-2015 Lee Schulz 1 Iowa State University Buying weaned pigs, corn, and soybean meal and selling hogs at discrete times throughout the year exposes wean to
Infographics in the Classroom: Using Data Visualization to Engage in Scientific Practices
 Infographics in the Classroom: Using Data Visualization to Engage in Scientific Practices Activity 4: Graphing and Interpreting Data In Activity 4, the class will compare different ways to graph the exact
Mobile Advertising Insights Q3 2013
 Mobile Advertising Insights Q3 2013 Market Color Highlights Pricing in Q3 has held near all-time highs, defying traditional summer slowdown with Competitive Factor up 30% ecpm increased 9% Q/Q, maintaining
Housing Highlights. A Snapshot of the Market in Summit County, CO. Key Findings. Key Indicators. May 2010. Rees Consulting, Inc.
 May 2010 Housing Highlights A Snapshot of the Market in Summit County, CO Key Indicators 2010 Median Income (4 persons) $87,200 Affordable Price $343,384 Affordable Rent $2,180 Median Price -- Single Family
NATIONAL CREDIT UNION SHARE INSURANCE FUND
 NATIONAL CREDIT UNION SHARE INSURANCE FUND PRELIMINARY & UNAUDITED FINANCIAL HIGHLIGHTS RENDELL L. JONES CHIEF FINANCIAL OFFICER MANAGEMENT OVERVIEW Balance Sheet Other - Insurance and Guarantee Program
Teller & Cash Activity Analysis Tools
 Teller & Cash Activity Analysis Tools CU*BASE Relationship Management Tools INTRODUCTION Take a look at the numbers...what do you see? Let s talk about the teller line. What do we need to know in order
BIG LOTS VENDOR COMPLIANCE WEB PORTAL USER GUIDE - VENDOR 300 PHILLIPI RD. COLUMBUS, OH 43228
 BIG LOTS VENDOR COMPLIANCE WEB PORTAL USER GUIDE - VENDOR 300 PHILLIPI RD. COLUMBUS, OH 43228 Contents Getting Started...4 Tips for Using Actionable Intelligence... 4 Logging into Actionable Intelligence...
Are you protected against market risk?
 Are you protected against market risk? The Aston Hill Capital Growth Fund provides low volatility access to U.S. equities with a strong focus on downside protection. Since taking over management of the
CENTERPOINT ENERGY TEXARKANA SERVICE AREA GAS SUPPLY RATE (GSR) JULY 2015. Small Commercial Service (SCS-1) GSR
 JULY 2015. Small Commercial Service (SCS-1) GSR") JULY 2015 Area (RS-1) GSR GSR (LCS-1) Texarkana Incorporated July-15 $0.50690/Ccf $0.45450/Ccf $0.00000/Ccf $2.85090/MMBtu $17.52070/MMBtu Texarkana Unincorporated July-15 $0.56370/Ccf $0.26110/Ccf $1.66900/Ccf
JULY 2015 Area (RS-1) GSR GSR (LCS-1) Texarkana Incorporated July-15 $0.50690/Ccf $0.45450/Ccf $0.00000/Ccf $2.85090/MMBtu $17.52070/MMBtu Texarkana Unincorporated July-15 $0.56370/Ccf $0.26110/Ccf $1.66900/Ccf
Performance Dashboards in Local Government: What, Why, and How?
 Performance Dashboards in Local Government: What, Why, and How? City of Portland TriMet TSCC Quarterly Meeting August 18, 2015 Dashboards: An Overview What s Driving the Interest in Performance Dashboards?
Table 1: Summary of Findings Variables which: Increased Time-till-sale Decreased Time-till-sale. Condominium, Ranch style, Rental Property
 House Prices and Time-till-sale in Windsor 1 Introduction Advice and anecdotes surrounding house marketing proliferate. While vendors desire to sell quickly and for a high price, few people trade enough
Financial Statement Consolidation
 Financial Statement Consolidation We will consolidate the previously completed worksheets in this financial plan. In order to complete this section of the plan, you must have already completed all of the
Box Plots. Objectives To create, read, and interpret box plots; and to find the interquartile range of a data set. Family Letters
 Bo Plots Objectives To create, read, and interpret bo plots; and to find the interquartile range of a data set. www.everydaymathonline.com epresentations etoolkit Algorithms Practice EM Facts Workshop
Consumer ID Theft Total Costs
 Billions Consumer and Business Identity Theft Statistics Business identity (ID) theft is a growing crime and is a growing concern for state filing offices. Similar to consumer ID theft, after initially
SOCIAL ENGAGEMENT BENCHMARK REPORT THE SALESFORCE MARKETING CLOUD. Metrics from 3+ Million Twitter* Messages Sent Through Our Platform
 THE SALESFORCE MARKETING CLOUD SOCIAL ENGAGEMENT BENCHMARK REPORT Metrics from 3+ Million Twitter* Messages Sent Through Our Platform *All trademarks, service marks, and trade names are the property of
EXCEED IEP Goals Product Screen
 The Goals product screen is used when you need to document the goals the student will be working towards during the course of their IEP. The Events screen displays with the Current and Upcoming Events
July 22, 2010 Page 1 of 5
 Page 1 of 5 On November 30, 2009, the Commodity Futures Trading Commission (CFTC) approved Variable Storage Rates (VSR) in CBOT Wheat futures contracts beginning with the July 2010 contract expiration.
APES Math Review. For each problem show every step of your work, and indicate the cancellation of all units No Calculators!!
 APES Math Review For each problem show every step of your work, and indicate the cancellation of all units No Calculators!! Scientific Notation All APES students should be able to work comfortably with
Using INZight for Time series analysis. A step-by-step guide.
 Using INZight for Time series analysis. A step-by-step guide. inzight can be downloaded from http://www.stat.auckland.ac.nz/~wild/inzight/index.html Step 1 Click on START_iNZightVIT.bat. Step 2 Click on
Basic Online Banking. User s Guide. Version 3.0
 Basic Online Banking User s Guide Version 3.0 OVERVIEW General Navigation Information: Supports backward and forward browser navigation Print and Help buttons are available from most pages Single-clicking
Supervisor Instructions for Approving Web Time Entry
 Supervisor Instructions for Approving Web Time Entry Time Approval Deadlines by Category Local 2110 Members members submit time by NOON on Monday of the pay week. Time should be approved no later than
W I S C O N S I N R E A L T O R S A S S O C I A T I O N Media Kit
 W I S C O N S I N R E A L T O R S A S S O C I A T I O N Media Kit 2014 PRINT WEB EMAIL SOCIAL VIDEO EVENTS & SPONSORSHIPS C O N T A C T Robert B. Uhrina VP, Marketing and Communications Ph: 608.241.2047
STATUS [ ] For office use only
![STATUS [ ] For office use only](/thumbs/40/20698308.jpg "STATUS [ ] For office use only") CITY OF CHICAGO DEPARTMENT OF REVENUE GROUND TRANSPORTATION TAX - 7595US FOR USE BY APPROVED APPLICANTS OF UNDERSERVED AREAS CREDIT PROGRAM ONLY STATUS [ ] For office use only ACCOUNT NUMBER DUE DATE CHECK
CITY OF CHICAGO DEPARTMENT OF REVENUE GROUND TRANSPORTATION TAX - 7595US FOR USE BY APPROVED APPLICANTS OF UNDERSERVED AREAS CREDIT PROGRAM ONLY STATUS [ ] For office use only ACCOUNT NUMBER DUE DATE CHECK
Excel 2007 Basic knowledge
 Ribbon menu The Ribbon menu system with tabs for various Excel commands. This Ribbon system replaces the traditional menus used with Excel 2003. Above the Ribbon in the upper-left corner is the Microsoft
Employers Compliance with the Health Insurance Act Annual Report 2015
 Employers Compliance with the Health Insurance Act Annual Report 2015 ea Health Council Health Council: Employers Compliance with the Health Insurance Act 1970 Annual Report 2015 Contact us: If you would
Realist A Quick Start Guide for New Users
 Realist A Quick Start Guide for New Users Realist is a service from: First American Real Estate Solutions 4 First American Way Santa Ana, CA 92707 Contents 1. Welcome to Realist... 2 2. How to Access Realist...
Welcome! First Steps to Achieving Effective Inventory Management
 Welcome! First Steps to Achieving Effective Inventory Management Tuesday, January 25, 2011 10 a.m. 11 a.m. EST Housekeeping Items This meeting will run for approximately one hour. Submit all questions
OPTIMIZING THE USE OF VHA s FEE BASIS CLAIMS SYSTEM (FBCS)
") VA-CASE VISN 11 VA Center for Applied Systems Engineering OPTIMIZING THE USE OF VHA s FEE BASIS CLAIMS SYSTEM (FBCS) The Fee Basis Claims System (FBCS) Optimization initiative aims to improve, standardize,
VA-CASE VISN 11 VA Center for Applied Systems Engineering OPTIMIZING THE USE OF VHA s FEE BASIS CLAIMS SYSTEM (FBCS) The Fee Basis Claims System (FBCS) Optimization initiative aims to improve, standardize,
Preparing A Cash Flow Statement
 Preparing A Cash Flow Statement By: Norm Dalsted and Rod Sharp Colorado State University It is highly unlikely you would attempt to drive to Detroit, Michigan, without first consulting a road map. You
2012 B2B Marke+ng Benchmark Report 1
 2012 B2B Marke+ng Benchmark Report 2012 B2B Marke+ng Benchmark Report 1 2012 B2B MARKETING BENCHMARK REPORT About the Report Optify s annual B2B Marketing Benchmark Report details the performance of the
Intelligent Process Management & Process Visualization. TAProViz 2014 workshop. Presenter: Dafna Levy
 Intelligent Process Management & Process Visualization TAProViz 2014 workshop Presenter: Dafna Levy The Topics Process Visualization in Priority ERP Planning Execution BI analysis (Built-in) Discovering
Chapter 9 Creating Reports in Excel
 Chapter 9 Creating Reports in Excel One of the most powerful features of Standard & Poor s Research Insight is its ability to communicate with Microsoft Excel through Active-X Technology. Excel requests
Getting Started with the DCHR Service Desk. District Service Management Program
 Getting Started with the DCHR Service Desk District Service Management Program October 30, 2008 Contacting the District Service Management Group You can access the District Service Management group s website
Financial Planning. Preparing Financial Budgets to support your Development Plan
 Introduction Financial Planning Preparing Financial Budgets to support your Development Plan Welcome to Oxfordshire Early Years Development & Childcare Partnership s electronic financial planning tool.
mytraining INSTRUCTION GUIDE
 mytraining INSTRUCTION GUIDE This guide is to be used as a resource for successfully completing training within the mytraining training management system LOGGING INTO MYTRAINING To log into mytraining:
FORECASTING. Operations Management
 2013 FORECASTING Brad Fink CIT 492 Operations Management Executive Summary Woodlawn hospital needs to forecast type A blood so there is no shortage for the week of 12 October, to correctly forecast, a
May 2014 Texas School Bond Elections
 May 2014 Texas School Bond Elections What are the individual districts needs? New facilities Renovations Technology Central facilities How much tax revenue can the district generate? Depends on district
Priority Income Protection Headline Quote & e-app Quick Start Guide
 Mutual of Omaha Insurance Company Priority Income Protection Headline Quote & e-app Quick Start Guide SM SUBHE AD 79508 For producer use only. Not for use with the general public. quick start guide The
Department of Public Welfare (DPW)
") Department of Public Welfare (DPW) Office of Income Maintenance Electronic Benefits Transfer Card Risk Management Report Out-of-State Residency Review FISCAL YEAR 2012-2013 June 2013 (March, April and
Department of Public Welfare (DPW) Office of Income Maintenance Electronic Benefits Transfer Card Risk Management Report Out-of-State Residency Review FISCAL YEAR 2012-2013 June 2013 (March, April and
New Jersey Private Sector Employment Up by 57,500 Jobs Over the Past Year Preliminary Data: July Employment Contracts
 Media Contact Amanda Pisano 609-984-2841 EMAIL: MediaCalls@dol.state.nj.us New Jersey Private Sector Employment Up by 57,500 Jobs Over the Past Year Preliminary Data: July Employment Contracts TRENTON,
Sample Table. Columns. Column 1 Column 2 Column 3 Row 1 Cell 1 Cell 2 Cell 3 Row 2 Cell 4 Cell 5 Cell 6 Row 3 Cell 7 Cell 8 Cell 9.
 Working with Tables in Microsoft Word The purpose of this document is to lead you through the steps of creating, editing and deleting tables and parts of tables. This document follows a tutorial format
Interest rate Derivatives
 Interest rate Derivatives There is a wide variety of interest rate options available. The most widely offered are interest rate caps and floors. Increasingly we also see swaptions offered. This note will
Manual. Version: 1.0.0
 Manual Version: 1.0.0 Table of Contents I. INTRODUCTION... 3 II. INSTALLATION... 5 a. System Requirements... 5 b. Installation... 5 c. Configure PayPal IPN... 5 d. Cron Setup... 6 e. Upload Email Logo...
Merchant Interface Online Help Files
 Merchant Interface Online Help Files Table of Contents Merchant Interface Online Help Files... 5 Tools... 6 Virtual Terminal... 7 Submit a Credit Card Charge... 7 Submit a Credit Card Refund... 9 Submit
WE RE AMPED TO MEET YOU!
 2016 WE RE AMPED TO MEET YOU! Katie Milligan OPERATIONS MANAGER, AVIDPAY SERVICES TEAM Becky Hughes SENIOR DIRECTOR OF AVIDPAY SERVICES 2016 PROPRIETARY AND CONFIDENTIAL 2 2016 PROPRIETARY AND CONFIDENTIAL
Sonoma County Economic Development Board BUSINESS BAROMETER
 BUSINESS BAROMETER September 2006 In This Month s Report: Newly revised employment data shows that Sonoma County added 3,000 jobs in the 12-month period ending July 2006. The seasonally adjusted unemployment
Managing Staffing in High Demand Variability Environments
 Managing Staffing in High Demand Variability Environments By: Dennis J. Monroe, Six Sigma Master Black Belt, Lean Master, and Vice President, Juran Institute, Inc. Many functions within a variety of businesses
VisualCalc AdWords Dashboard Indicator Whitepaper Rev 3.2
 VisualCalc AdWords Dashboard Indicator Whitepaper Rev 3.2 873 Embarcadero Drive, Suite 3 El Dorado Hills, California 95762 916.939.2020 www.visualcalc.com Introduction The VisualCalc AdWords Dashboard
IT HELP Desk Dashboard ManageEngine Service Desk Plus User Guide
 Create an Incident When you need to report a failure or problem of your system to the IT help desk team, then send a request to the team. There are different modes of placing a request, such as submitting