2013 National Tuition and Fee Report
|
|
|
- Marjorie Rice
- 8 years ago
- Views:
Transcription
1 Christy England-Siegerdt, Ph.D. Director, Research and Planning March 2013 (revised July 2013) Washington Student Achievement Council Report to the Legislature

2 Summary The amount institutions charge students for tuition and fees is a critical factor affecting access to higher education. In recent years, tuition across the United States has become more and more expensive as institutions have increased tuition rates to offset reductions in public support for higher education programs. Washington has mitigated the impact of rising tuition costs by increasing financial aid to students least able to pay. However, the growing number of eligible low-income students has outpaced available resources, leaving many without support. Rising tuition costs also have shifted the barrier of higher education affordability to many students outside traditional low-income categories. The rising cost of tuition, particularly at public universities and colleges, is exceeding the resources of many middle-class families, the Washington Student Achievement Council noted in its first strategic action plan, titled Critical Crossroads: A Call for Action. Understanding these national trends and how each state s tuition levels compare with other states are important for government and education leaders as they search for ways to expand college access and improve the overall quality of their education systems. This report, commissioned by Washington s Legislature and Governor, provides accurate and timely tuition and fee data for public flagship institutions, comprehensive institutions and community colleges in the 50 states. This survey is intended not only for Washington state policy-makers and institutional leaders, but also for those in other states who are preparing tuition and fee analyses. The data show that since the academic year, tuition and required fees at Washington s public institutions have exceeded the national average in all categories. Washington ranks in the top 15 for highest tuition and required fees in all categories except for nonresident undergraduate tuition at community and technical colleges where Washington ranks 19th. Washington s tuition and required fees generally are comparable to the averages of the Global Challenge States (GCS), a comparison group frequently referenced by the Washington State Legislature. The recent increases in tuition and required fees have had the greatest impact on resident undergraduates in all sectors. Washington s tuition and required fees have historically been lower than the national average, placing Washington between 25th and 30th nationally. In , resident undergraduate tuition and required fees at Washington s public universities shifted from being lower than the national average to among the highest in the nation. The data in this report will provide the Washington Student Achievement Council with important comparative background information as the Council develops its 10-Year Roadmap for raising the state s educational achievement level. During this process, the Council will examine policy issues concerning college affordability and higher education funding, both of which are directly tied to tuition. Washington Student Achievement Council

3 Contents Introduction... 1 How Washington Compares... 2 Conclusion... 3 Acknowledgements... 4 Author Contact Information... 4 Tables Table 1. Resident Undergraduate Tuition Table 2. Nonresident Undergraduate Tuition Table 3. Resident Graduate Tuition Table 4. Nonresident Graduate Tuition Appendices Appendix A. Resident Undergraduate Tuition and Required Fees by State... 5 Chart 1: Flagship Universities Resident Undergraduate Tuition and Required Fees, Chart 2: Flagship Universities Percentage Change in Resident Undergraduate Tuition and Required Fees, to Chart 3: Comprehensive Colleges and Universities Resident Undergraduate Tuition and Required Fees, Chart 4: Comprehensive Colleges and Universities Percentage Change in Resident Undergraduate Tuition and Required Fees, to Chart 5: Community Colleges Resident Undergraduate Tuition and Required Fees, Chart 6: Community Colleges Percentage Change in Resident Undergraduate Tuition and Required Fees, to Appendix B. National Comparisons-Tuition & Required Fees by State, Table 1: Flagship Universities Resident Undergraduate Tuition and Required Fees...13 Table 2: Flagship Universities Nonresident Undergraduate Tuition and Required Fees...14 Table 3: Flagship Universities Resident Graduate Tuition and Required Fees...15 Table 4: Flagship Universities Nonresident Graduate Tuition and Required Fees...16 Table 5: Comprehensive Colleges and Universities Resident Undergraduate Tuition and Required Fees (State Averages)...17 Table 6: Comprehensive Colleges and Universities Nonresident Undergraduate Tuition and Required Fees (State Averages)...18 Table 5: Comprehensive Colleges and Universities Resident Graduate Tuition and Required Fees (State Averages)...19 Table 6: Comprehensive Colleges and Universities Nonresident Graduate Tuition and Required Fees (State Averages)...20 Table 9: Community Colleges Resident Tuition and Required Fees (Est. State Averages)...21 Table 10: Community Colleges Nonresident Tuition and Required Fees (Est. State Averages)...22 Appendix C. Endnotes for National Tables Appendix D. List of Included Colleges and Universities National Tables 1 through Washington Student Achievement Council

4 Introduction This report fulfills requirements of legislation passed in 2011, requiring the Washington Student Achievement Council to provide an annual comparison of tuition and required fees at public institutions in the 50 states (RCW 28B ). 1 The report includes tuition and required fee comparisons for flagship institutions, comprehensive institutions, and community colleges. This is the forty-second such report prepared in Washington. Previous annual reports published by predecessor agencies to the Washington Student Achievement Council are available online at Tuition and required fee amounts are provided for academic years between and Data for and were collected by the Washington Higher Education Coordinating Board via a survey of state agencies or individual institutions. Tuition and required fee rates for subsequent years were collected by the Connecticut Office of Higher Education, which partnered with the Washington Student Achievement Council who analyzed the data and prepared the current report. Connecticut utilized an online tool nearly identical to the survey tool previously used in Washington, with one exception. This year s survey did not include a request for tuition and required fees for medical, dental, law, or veterinary schools and programs. Agency staff in Connecticut and Washington will assess the need to reinstate these components next year. This year s survey respondents were asked to provide tuition and required fee rates for the , , and academic years, in addition to reviewing and updating the rates. Data are collected for residents and nonresidents at the undergraduate and graduate level. Appendix A of this report includes six bar charts showing resident undergraduate tuition and required fees for each state, and providing comparisons to the national and GCS averages. Bar charts showing percentage changes in tuition and required fees between and are also provided. Appendix B provides the national data tables used to create the bar charts in Appendix A. Appendix C provides additional notes on the Appendix B data, and Appendix D provides a list of the institutions included in this analysis. 1 The statute is available at Washington Student Achievement Council 1

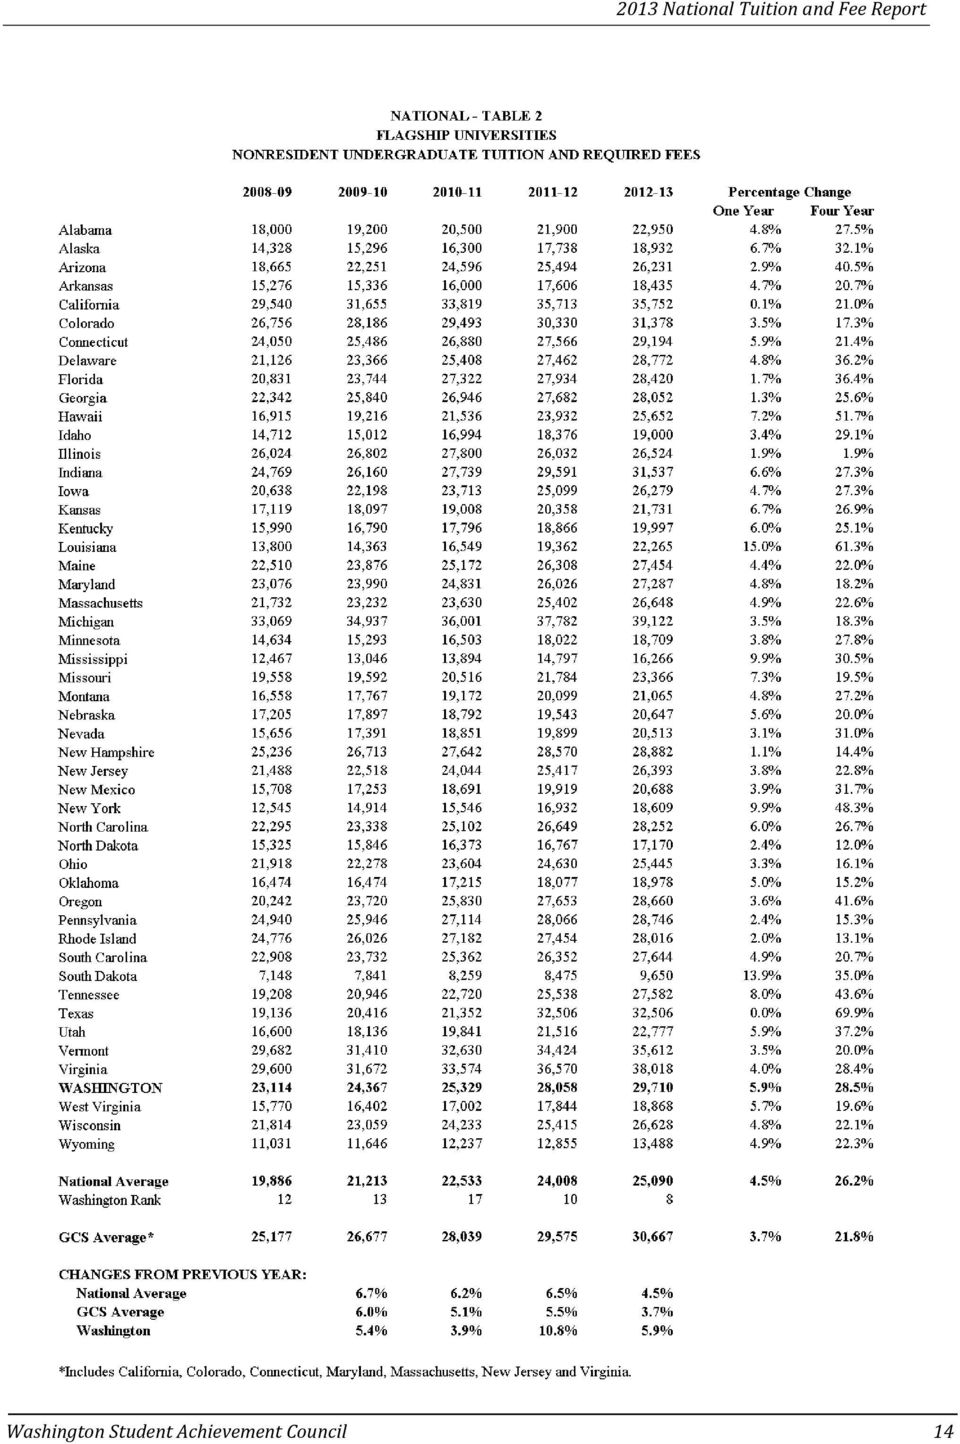
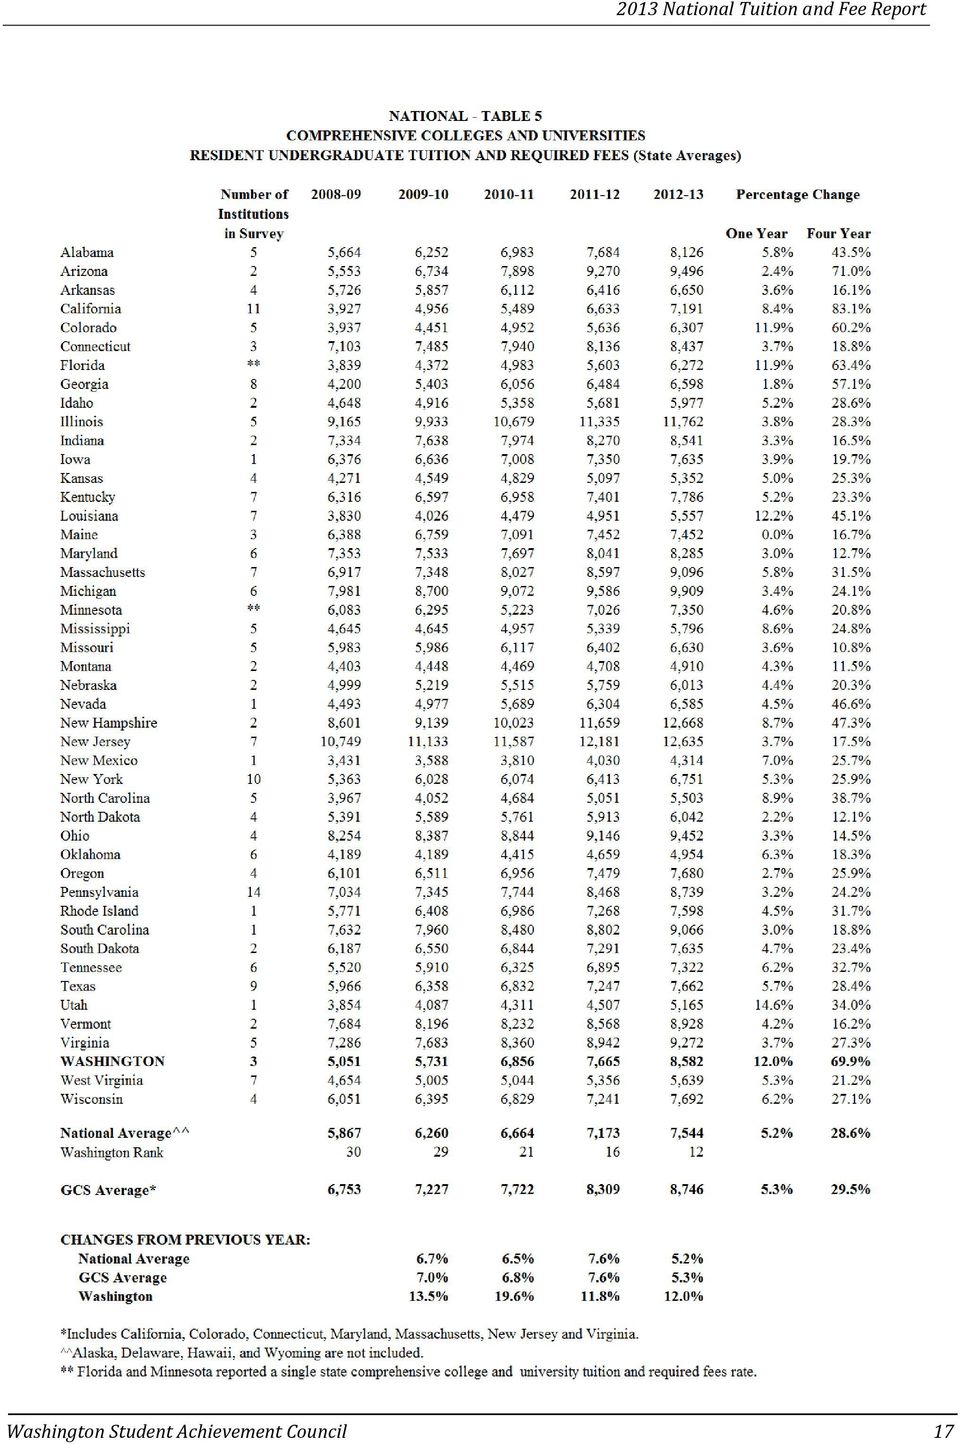
5 How Washington Compares Tuition and required fees at Washington s public institutions for the academic year exceed the national average in all categories (see Tables 1-4 below). Washington ranks in the top 15 for highest tuition and required fees in all categories except for nonresident undergraduate tuition at community and technical colleges where Washington ranks 19th. Relative to the seven Global Challenge States, Washington is generally comparable with a few exceptions. Washington s public institution tuition and required fees are higher for resident undergraduates at the flagship institution, nonresident graduate students at comprehensive institutions, and resident undergraduates at community and technical colleges. Only the tuition and required fees for nonresident undergraduate students at the flagship institution and resident graduate students at comprehensive institutions was lower compared to the GCS average. Tuition and required fees in Washington increased faster than the national average and faster than the GCS average (see National Tables in Appendix B). Tuition and required fees increased most dramatically for resident undergraduates at Washington s flagship institution, University of Washington, where tuition and required fees increased 82 percent between and Tuition and required fees increased by 70 percent and 47 percent for resident undergraduates at comprehensive institutions and community colleges respectively during the same time frame. Table 1. Resident Undergraduate Tuition Flagship Institution 1 Comprehensive Institutions 2 Community & Technical Colleges Washington $12,155 $8,582 $4,000 1-year Percent Change 15.0% 12.0% 12.9% 5-year Percent Change 81.5% 69.9% 46.5% National Average $9,647 $7,544 $3,591 Washington s Rank GCS 3 Average $11,562 $8,746 $3,625 Table 2. Nonresident Undergraduate Tuition Flagship Institution 1 Comprehensive Institutions 2 Community & Technical Colleges Washington $29,710 $19,157 $9,235 1-year Percent Change 5.9% 7.0% 5.2% 5-year Percent Change 28.5% 28.8% 16.3% National Average $25,090 $16,939 $8,593 Washington s Rank GCS 3 Average $30,667 $19,471 $9,345 Washington Student Achievement Council 2

6 Table 3. Resident Graduate Tuition Flagship Institution Comprehensive Institutions Washington $14,470 $9,696 1-year Percent Change 7.7% 8.7% 5-year Percent Change 38.6% 42.3% National Average $11,121 $8,463 Washington s Rank GCS 3 Average $14,314 $11,237 Table 4. Nonresident Graduate Tuition Flagship Institution Comprehensive Institutions Washington $27,090 $20,666 1-year Percent Change 3.0% 6.7% 5-year Percent Change 18.2% 26.4% National Average $23,818 $16,575 Washington s Rank 14 7 GCS 3 Average $27,780 $19,256 1 For Washington, this number represents the University of Washington. 2 For Washington, this number represents the average tuition and required fees at Central Washington University, Eastern Washington University, and Western Washington University. 3 Includes California, Colorado, Connecticut, Maryland, Massachusetts, New Jersey, and Virginia. Conclusion In preparing its 10-year Roadmap for increasing educational attainment, the Washington Student Achievement Council will be examining college affordability and higher education funding. As shown in this national comparison summary, Washington s tuition and required fees for resident undergraduate students have shifted from being consistently well below the national average to being among the highest in the nation. The assumptions or goals about the rate of tuition increase in the future will be of critical importance in developing the Roadmap. Washington Student Achievement Council 3

7 Acknowledgements The author wishes to thank staff from the Connecticut Office of Higher Education, who partnered with the Council to conduct the survey. Special thanks go to the survey respondents in the 50 states for their continued participation. Author Contact Information Christy England-Siegerdt, Ph.D. Director, Research and Planning Washington Student Achievement Council 4

8 Appendix A. Resident Undergraduate Tuition and Required Fees by State Charts 1 6 present data on the resident undergraduate tuition and required fees, and percentage changes from to States are listed in decreasing order of magnitude. These data also are available in National Tables 1, 5, and 9 of Appendix B. Charts 1 and 2 represent tuition and required fee rates for full-time undergraduate and graduate students at the flagship institution in each state. Charts 3 and 4 represent the average tuition and fees of the comprehensive colleges and universities in each state. Charts 5 and 6 represent the average tuition and fees of all community colleges as reported by each state s system office. Tuition and fee data are not collected for individual community colleges, with one exception. For Michigan, the average community college tuition and fee rate was calculated using data from the Integrated Postsecondary Education Data System (IPEDS) maintained by the U.S. Department of Education s National Center on Education Statistics. As a result, tuition and fee information for was not available from IPEDS at the time of publication. Some states have more than one public research institution. The tuition and required fees at the non-flagship institutions are not included in any of the charts below. Washington Student Achievement Council 5

9 Chart 1: Flagship Universities Resident Undergraduate Tuition and Required Fees, Pennsylvania New Hampshire Vermont Illinois Minnesota Massachusetts New Jersey Michigan California Rhode Island WASHINGTON Virginia Delaware GCS Average* Connecticut Maine South Carolina Wisconsin Indiana Ohio Arizona Georgia Kentucky Texas National Average Colorado Hawaii Oregon Missouri Alabama Tennessee Maryland Kansas Iowa New York Nebraska South Dakota Arkansas North Carolina Oklahoma North Dakota Utah Louisiana Nevada Mississippi Alaska Idaho Florida West Virginia New Mexico Montana Wyoming 4,277 16,444 16,422 13,459 14,960 15,284 13,232 13,073 12,994 12,874 12,450 12,155 12,006 11,682 11,562 11,362 10,594 10,488 10,379 10,087 10,037 10,035 9,842 9,816 9,794 9,647 9,482 9,404 9,310 9,257 9,200 9,092 8,908 8,888 8,057 7,989 7,897 7,704 7,553 7,500 7,340 7,254 7,176 6,989 6,603 6,282 6,233 6,212 6,143 6,090 6,050 5,973 $0 $2,000 $4,000 $6,000 $8,000 $10,000 $12,000 $14,000 $16,000 *Includes California, Colorado, Connecticut, Maryland, Massachusetts, New Jersey, and Virginia. Washington Student Achievement Council 6

10 Chart 2: Flagship Universities Percentage Change in Resident Undergraduate Tuition and Required Fees, to WASHINGTON Louisiana North Carolina Rhode Island Florida Mississippi Tennessee New Hampshire Wisconsin West Virginia Alabama South Dakota New York Connecticut Alaska Idaho Kentucky Oregon Utah Indiana Arkansas Kansas Massachusetts National Average Nevada Montana Delaware New Mexico Georgia Illinois Iowa Virginia Wyoming Colorado GCS Average* Vermont Minnesota Hawaii South Carolina Ohio Oklahoma Missouri Maryland Pennsylvania Nebraska Michigan New Jersey North Dakota California Maine Texas Arizona 10.0% 9.9% 9.5% 8.6% 8.5% 8.3% 7.7% 7.4% 7.3% 7.0% 6.9% 6.8% 6.5% 6.3% 6.1% 6.0% 5.9% 5.6% 5.3% 5.3% 4.9% 4.9% 4.8% 4.7% 4.4% 4.4% 4.1% 3.9% 3.8% 3.8% 3.7% 3.7% 3.6% 3.4% 3.4% 3.4% 3.3% 3.1% 3.1% 3.0% 3.0% 2.9% 2.9% 2.9% 2.8% 2.5% 2.3% 0.3% 0.1% 0.0% 0.0% 15.0% 0% 5% 10% 15% 20% 25% 30% * Includes California, Colorado, Connecticut, Maryland, Massachusetts, New Jersey, and Virginia. Washington Student Achievement Council 7

11 Chart 3: Comprehensive Colleges and Universities Resident Undergraduate Tuition and Required Fees, New Hampshire New Jersey Illinois Michigan Arizona Ohio Virginia Massachusetts South Carolina Vermont GCS Average* Pennsylvania WASHINGTON Indiana Connecticut Maryland Alabama Kentucky Wisconsin Oregon Texas South Dakota Iowa Rhode Island National Average^^ Maine Minnesota Tennessee California New York Arkansas Missouri Georgia Nevada Colorado Florida North Dakota Nebraska Idaho Mississippi West Virginia Louisiana North Carolina Kansas Utah Oklahoma Montana New Mexico 9,909 9,496 9,452 9,272 9,096 9,066 8,928 8,746 8,739 8,582 8,541 8,437 8,285 8,126 7,786 7,692 7,680 7,662 7,635 7,635 7,598 7,544 7,452 7,350 7,322 7,191 6,751 6,650 6,630 6,598 6,585 6,307 6,272 6,042 6,013 5,977 5,796 5,639 5,557 5,503 5,352 5,165 4,954 4,910 4,314 $0 $2,000 $4,000 $6,000 $8,000 $10,000 $12,000 12,668 12,635 11,762 *Includes California, Colorado, Connecticut, Maryland, Massachusetts, New Jersey, and Virginia. Washington Student Achievement Council 8

12 Chart 4: Comprehensive Colleges and Universities Percentage Change in Resident Undergraduate Tuition and Required Fees, to Utah Louisiana WASHINGTON Florida Colorado North Carolina New Hampshire Mississippi California New Mexico Oklahoma Wisconsin Tennessee Massachusetts Alabama Texas West Virginia New York GCS Average* Idaho Kentucky National Average^^ Kansas South Dakota Minnesota Rhode Island Nevada Nebraska Montana Vermont Iowa Illinois New Jersey Connecticut Virginia Arkansas Missouri Michigan Ohio Indiana Pennsylvania Maryland South Carolina Oregon Arizona North Dakota Georgia Maine 8.9% 8.7% 8.6% 8.4% 7.0% 6.3% 6.2% 6.2% 5.8% 5.8% 5.7% 5.3% 5.3% 5.3% 5.2% 5.2% 5.2% 5.0% 4.7% 4.6% 4.5% 4.5% 4.4% 4.3% 4.2% 3.9% 3.8% 3.7% 3.7% 3.7% 3.6% 3.6% 3.4% 3.3% 3.3% 3.2% 3.0% 3.0% 2.7% 2.4% 2.2% 1.8% 0.0% 14.6% 12.2% 12.0% 11.9% 11.9% 0.0% 5.0% 10.0% 15.0% 20.0% 25.0% 30.0% *Includes California, Colorado, Connecticut, Maryland, Massachusetts, New Jersey, and Virginia. Washington Student Achievement Council 9

13 Chart 5: Community Colleges Resident Undergraduate Tuition and Required Fees, New Hampshire Alaska Vermont Minnesota Massachusetts Wisconsin Montana New York Iowa Oregon Kentucky New Jersey Alabama WASHINGTON Pennsylvania Missouri Rhode Island North Dakota Virginia Maryland Georgia Tennessee Ohio South Carolina GCS Average* Colorado Connecticut National Average Indiana Maine Illinois Oklahoma Delaware Utah Hawaii Florida West Virginia Arkansas Idaho Louisiana Nevada Nebraska North Carolina Wyoming Kansas Texas Mississippi Arizona California New Mexico 1,380 1,187 5,585 5,352 5,335 5,177 5,086 4,686 4,470 4,437 4,369 4,200 4,149 4,110 4,000 3,976 3,967 3,950 3,937 3,735 3,722 3,688 3,686 3,682 3,629 3,625 3,616 3,598 3,591 3,455 3,287 3,237 3,178 3,136 3,109 3,100 3,091 2,997 2,944 2,917 2,904 2,700 2,674 2,440 2,391 2,332 2,273 2,252 2,216 $0 $1,000 $2,000 $3,000 $4,000 $5,000 $6,000 $7,000 7,033 *Includes California, Colorado, Connecticut, Maryland, Massachusetts, New Jersey, and Virginia. Washington Student Achievement Council 10

14 Chart 6: Community Colleges Percentage Change in Resident Undergraduate Tuition and Required Fees, to Montana California Louisiana WASHINGTON North Carolina Colorado Rhode Island Nevada Arizona Alaska New York Oregon National Average Ohio GCS Average* Wisconsin Maryland Wyoming Oklahoma Arkansas Utah Missouri Pennsylvania Texas Virginia West Virginia Tennessee New Mexico Vermont Hawaii Massachusetts Illinois Nebraska Kentucky Mississippi Alabama Iowa Florida Minnesota Connecticut New Jersey South Carolina Indiana Georgia Delaware Idaho New Hampshire Kansas North Dakota Maine 8% 7% 7% 7% 7% 7% 6% 6% 6% 6% 5% 5% 5% 5% 5% 5% 5% 5% 5% 5% 4% 4% 4% 4% 4% 4% 4% 4% 4% 4% 4% 3% 3% 3% 3% 3% 3% 3% 2% 2% 1% 1% 1% 1% 0% 13% 13% 12% 28% 0% 5% 10% 15% 20% 25% 30% 35% 36% * Includes California, Colorado, Connecticut, Maryland, Massachusetts, New Jersey, and Virginia. Washington Student Achievement Council 11

15 Appendix B. National Comparisons of Tuition and Required Fees By State, through National Tables 1-10 provide tuition and required fee rates for institutions in the 50 states between and The tables also show percentage changes in tuition and required fees over the last five academic years. States are listed in alphabetical order. Each table also includes national averages for each year, Washington s national rank, and averages for the seven Global Challenge States (GCS). The Global Challenge States have been identified as having a high potential to succeed in today s knowledge-driven, global economy. This comparison group is frequently used by the Washington State Legislature. The Global Challenge States include California, Colorado, Connecticut, Maryland, Massachusetts, New Jersey, and Virginia. National Tables 1-4 display tuition and required fee rates for full-time undergraduate and graduate students at the flagship institution in each state. National Tables 5-8 represent the average tuition and fees of the comprehensive colleges and universities in each state. National Tables 9-10 represent the average tuition and fees of all community colleges as reported by each state s system office. Tuition and fee data are not collected for individual community colleges, with one exception. For Michigan, the average community college tuition and fee rate was calculated using data from the Integrated Postsecondary Education Data System (IPEDS) maintained by the U.S. Department of Education s National Center on Education Statistics. As a result, tuition and fee information for was not available from IPEDS at the time of publication. Some states have more than one public research institution. The tuition and required fees at the non-flagship institutions are not included in any of the above tables. Washington Student Achievement Council 12
.")
16 Washington Student Achievement Council 13

17 Washington Student Achievement Council 14
18 Washington Student Achievement Council 15

19 Washington Student Achievement Council 16

20 Washington Student Achievement Council 17
21 Washington Student Achievement Council 18
22 Washington Student Achievement Council 19
23 Washington Student Achievement Council 20
24 Washington Student Achievement Council 21
25 Washington Student Achievement Council 22
26 Appendix C. Endnotes for National Tables Endnotes Pertinent information about the tuition and fee data reported in all tables of Appendix B is included below. Only tables with endnotes are included in this listing. National - Table 1: Flagship Universities: Resident Undergraduate Tuition and Required Fees National - Table 2: Flagship Universities: Nonresident Undergraduate Tuition and Required Fees National - Table 3: Flagship Universities: Resident Graduate Tuition and Required Fees National - Table 4: Flagship Universities: Nonresident Graduate Tuition and Required Fees National - Table 5: Comprehensive Colleges and Universities: Resident Undergraduate Tuition and Required Fees (State Averages) Illinois: tuition and fees reflect entry-level rates. Kentucky: tuition and fees reflect average of upperand lower-divisions. Ohio: tuition and fees reflect entering students in that year. Rhode Island: includes one-time assessment fee of $200 ($250 for University of Rhode Island students) in spring 2009 due to decreases in state appropriations to higher education. Washington: required fees only reflect services and activities, and technology fees. Illinois: tuition and fees reflect entry-level rates. Kentucky: tuition and fees reflect average of upperand lower-divisions. Ohio: tuition and fees reflect entering students in that year. Rhode Island: includes one-time assessment fee of $200 ($250 for University of Rhode Island students) in spring 2009 due to decreases in state appropriations to higher education. Washington: required fees only reflect services and activities, and technology fees. Washington: required fees only reflect services and activities, and technology fees. University of Washington rates are for the Tier II graduate level. Washington: required fees only reflect services and activities, and technology fees. University of Washington rates are for the Tier II graduate level. Illinois: tuition and fees reflect entry-level rates. Ohio: tuition and fees reflect entering students in that year. Rhode Island: includes one-time assessment fee of $200 ($250 for University of Rhode Island students) in spring 2009 due to decreases in state appropriations to higher education. Washington: required fees only reflect services and activities, and technology fees. Washington Student Achievement Council 23
27 Endnotes (continued) National - Table 6: Comprehensive Colleges and Universities: Nonresident Undergraduate Tuition and Required Fees (State Averages) National - Table 7: Comprehensive Colleges and Universities: Resident Graduate Tuition and Required Fees (State Averages) National - Table 8: Comprehensive Colleges and Universities: Nonresident Graduate Tuition and Required Fees (State Averages) National - Table 9: Community Colleges: Resident Tuition and Required Fees (Estimated State Averages) National - Table 10: Community Colleges: Nonresident Tuition and Required Fees (Estimated State Averages) Illinois: tuition and fees reflect entry-level rates. Ohio: tuition and fees reflect entering students in that year. Rhode Island: includes one-time assessment fee of $200 ($250 for University of Rhode Island students) in spring 2009 due to decreases in state appropriations to higher education. Washington: required fees only reflect services and activities, and technology fees. Washington: required fees only reflect services and activities, and technology fees. Washington: required fees only reflect services and activities, and technology fees. Indiana: tuition and fees reflect those at Ivy Tech Community College of Indiana. In prior reports, Indiana reported a blended tuition that included Vincennes University (two-year). Washington: required fees only reflect services and activities, and technology fees. Indiana: tuition and fees reflect those at Ivy Tech Community College of Indiana. In prior reports, Indiana reported a blended tuition that included Vincennes University (two-year). Washington: required fees only reflect services and activities, and technology fees. Washington Student Achievement Council 24
28 Appendix D. List of Included Colleges and Universities National Tables 1 through 8 National Tables: Colleges and Universities This appendix lists only the institutions reflected in National Comparison Tables 1-8 in Appendix B. The names of some colleges and universities have changed over time. The most current names are listed below. *Indicates the state flagship university reflected in Tables 1-4 in Appendix B. States with more than one research institution will not see the non-flagship institution listed here. **Indicates a state university system. Data represent an average of comprehensive institutions in the system. Tuition and fee data from comprehensive state colleges and universities are averaged for Tables 5, 6, 7, and 8. ALABAMA *University of Alabama-Tuscaloosa Alabama State University University of Montevallo University of North Alabama University of South Alabama University of West Alabama ALASKA *University of Alaska Fairbanks ARIZONA *University of Arizona Arizona State University-Main Campus Northern Arizona University ARKANSAS *University of Arkansas-Fayetteville Arkansas State University-Main Campus Arkansas Tech University University of Arkansas at Monticello University of Central Arkansas CALIFORNIA *University of California-Berkeley California Polytechnic State University-San Luis Obispo California State College-San Bernardino California State University-Chico California State University-Fresno California State University-Fullerton California State University-Northridge California State University-Long Beach California State University-Los Angeles California State University-Sacramento Humboldt State University Sonoma State University COLORADO *University of Colorado at Boulder Adams State College Fort Lewis State College Metropolitan State College of Denver University of Northern Colorado Western State College Colorado CONNECTICUT *University of Connecticut-Storrs Central Connecticut State University Southern Connecticut State University Western Connecticut State University DELAWARE *University of Delaware FLORIDA *University of Florida-Gainesville **State University System Comprehensive GEORGIA *University of Georgia Albany State University Armstrong Atlantic State University Augusta State University Columbus State University Georgia College and State University Georgia Southern University University of West Georgia Valdosta State University HAWAII *University of Hawaii at Manoa Washington Student Achievement Council 25
29 IDAHO *University of Idaho Boise State University Idaho State University ILLINOIS *University of Illinois at Urbana/Champaign Eastern Illinois University Illinois State University Northeastern Illinois University Northern Illinois University Western Illinois University INDIANA *Indiana University-Bloomington Ball State University Indiana State University IOWA *University of Iowa University of Northern Iowa KANSAS *University of Kansas-Main Campus Emporia State University Fort Hays State University Pittsburg State University Wichita State University KENTUCKY *University of Kentucky-Lexington Eastern Kentucky University Kentucky State University Morehead State University Murray State University Northern Kentucky University University of Louisville Western Kentucky University LOUISIANA *Louisiana State University-Baton Rouge Grambling State University Louisiana Technical University McNeese State University Nicholls State University Northwestern State University of LA Southeastern Louisiana University University of Louisiana-Monroe MAINE *University of Maine University of Maine at Fort Kent University of Maine at Machias University of Maine at Presque Isle MARYLAND *University of Maryland-College Park Bowie State University Coppin State University Frostburg State University Morgan State University St. Mary's College of Maryland Towson State University MASSACHUSETTS *University of Massachusetts-Amherst Fitchburg State College Framingham State College Massachusetts College of Art and Design Massachusetts College of Liberal Arts Salem State College University of Massachusetts-Dartmouth Worcester State College MICHIGAN *University of Michigan-Ann Arbor Central Michigan University Eastern Michigan University Grand Valley State University Northern Michigan University Oakland University Western Michigan University MINNESOTA *University of Minnesota-Twin Cities **State University System Comprehensive MISSISSIPPI *University of Mississippi-Main Campus Alcorn State University Jackson State University Mississippi University for Women Mississippi Valley State University University of Southern Mississippi MISSOURI *University of Missouri-Columbia Missouri Southern State University Missouri State University Missouri Western State University Truman State University University of Central Missouri MONTANA *University of Montana-Missoula Montana State University-Billings University of Montana-Western Washington Student Achievement Council 26
30 NEBRASKA *University of Nebraska-Lincoln University of Nebraska-Kearney Wayne State College NEVADA *University of Nevada-Reno University of Nevada-Las Vegas NEW HAMPSHIRE *University of New Hampshire-Durham Keene State College Plymouth State University NEW JERSEY *Rutgers University-New Brunswick Ramapo College of New Jersey Richard Stockton College of NJ Rowan University Montclair State University New Jersey City University New Jersey Institute of Technology The College of New Jersey NEW MEXICO *University of New Mexico-Main Campus Western New Mexico University NEW YORK *University of Buffalo SUNY at Fredonia SUNY at Geneseo SUNY College at Brockport SUNY College at Buffalo SUNY College at New Paltz SUNY College at Old Westbury SUNY College at Oswego SUNY College at Plattsburgh SUNY College at Potsdam SUNY Empire State College NORTH CAROLINA *University of N. Carolina at Chapel Hill Appalachian State University East Carolina University North Carolina Central University Western Carolina University Winston Salem State University NORTH DAKOTA *University of North Dakota-Grand Forks Dickinson State University Mayville State University Minot State University Valley City State University OHIO *Ohio State University-Main Campus Bowling Green State University-Main Campus University of Akron-Main Campus University of Toledo Wright State University-Main Campus OKLAHOMA *University of Oklahoma-Norman East Central University Northeastern State University Northwestern OK State University Southeastern OK State University Southwestern OK State University University of Central Oklahoma OREGON *University of Oregon-Eugene Eastern Oregon University Oregon Institute of Technology Portland State University Southern Oregon University PENNSYLVANIA *Pennsylvania State University-Main Campus Bloomsburg University of Pennsylvania California University of Pennsylvania Cheyney University of Pennsylvania Clarion University of Pennsylvania East Stroudsburg University of Pennsylvania Edinboro University of Pennsylvania Indiana University of Pennsylvania Kutztown University of Pennsylvania Lock Haven University of Pennsylvania Mansfield University of Pennsylvania Millersville University of Pennsylvania Slippery Rock University of Pennsylvania Shippensburg University of Pennsylvania RHODE ISLAND *University of Rhode Island Rhode Island College SOUTH CAROLINA *University of South Carolina/Columbia Francis Marion College SOUTH DAKOTA *University of South Dakota-Vermillion Black Hills State University Dakota State University Washington Student Achievement Council 27
31 TENNESSEE *University of Tennessee-Knoxville Austin Peay State University East Tennessee State University Middle Tennessee State University University of Memphis University of Tennessee-Chattanooga University of Tennessee-Martin TEXAS *University of Texas at Austin Angelo State University Midwestern State University Sam Houston State University Stephen F. Austin State University Texas A&M University-Commerce Texas A&M University-Kingsville Texas State University-San Marcos University of North Texas West Texas A&M University UTAH *University of Utah Weber State University VERMONT *University of Vermont Castleton State College Lyndon State College West Chester University of Pennsylvania WASHINGTON *University of Washington Central Washington University Eastern Washington University Western Washington University WEST VIRGINIA *West Virginia University-Morgantown Bluefield State College Concord University Fairmont State University Marshall University Shepherd University West Liberty State College West Virginia University Institute of Technology WISCONSIN *University of Wisconsin-Madison University of Wisconsin-Eau Claire University of Wisconsin-Oshkosh University of Wisconsin-River Falls University of Wisconsin-Stevens Point WYOMING *University of Wyoming VIRGINIA *University of Virginia Main Campus George Mason University James Madison University Longwood College Old Dominion University Radford University Washington Student Achievement Council 28
Draft 2013 National Tuition and Fee Report
 Draft 2013 National Tuition and Fee Report Christy England-Siegerdt Director, Research and Planning March 2013 Washington Student Achievement Council www.wsac.wa.gov 13-1004 Draft Report to the Legislature
ATTACHMENT A NCHEMS PEERS - Adams State College. Date: Revised 7/24/2007. Institution
 ATTACHMENT A NCHEMS PEERS - Adams State College ADAMS STATE COLLEGE ARIZONA STATE UNIVERSITY AT THE WEST CAMPUS ARMSTRONG ATLANTIC STATE UNIVERSITY AUGUSTA STATE UNIVERSITY BOWIE STATE UNIVERSITY CAMERON
In-state Tuition & Fees at Flagship Universities by State 2014-15 Rank School State In-state Tuition & Fees Penn State University Park Pennsylvania 1
 In-state Tuition & Fees at Flagship Universities by State 2014-15 Rank School State In-state Tuition & Fees Penn State University Park Pennsylvania 1 $18,464 New New Hampshire 2 Hampshire $16,552 3 Vermont
Public Two year Colleges
 Public Two year Colleges in the Southern Regional Education Board (SREB) States Annual Tuition and Required Fees for In state Undergraduates, 2010 11 North Carolina Community College System 1,798 Texas
Tuition and Fees. & Room and Board. Costs 2011-12
 National and Regional Comparisons of Tuition and Fees & Room and Board Costs 2011-12 Table of Contents Table of Contents... 1 Comparator Institutions... 3 University of Wyoming Comparator Institutions...
The Nationally Certified School Psychologist (NCSP) Credential: Number Granted in the Past Year by Institution and State and Total Active
 Credential: Number Granted in the Past Year by Institution and State and Total Active") The Nationally Certified School Psychologist (NCSP) Credential: Number Granted in the Past Year by Institution and State and Total Active Prepared by Eric Rossen, PhD, NCSP NASP Director of Professional
The Nationally Certified School Psychologist (NCSP) Credential: Number Granted in the Past Year by Institution and State and Total Active Prepared by Eric Rossen, PhD, NCSP NASP Director of Professional
Public School Teacher Experience Distribution. Public School Teacher Experience Distribution
 Public School Teacher Experience Distribution Lower Quartile Median Upper Quartile Mode Alabama Percent of Teachers FY Public School Teacher Experience Distribution Lower Quartile Median Upper Quartile
NON-RESIDENT INDEPENDENT, PUBLIC, AND COMPANY ADJUSTER LICENSING CHECKLIST
 NON-RESIDENT INDEPENDENT, PUBLIC, AND COMPANY ADJUSTER LICENSING CHECKLIST ** Utilize this list to determine whether or not a non-resident applicant may waive the Oklahoma examination or become licensed
Three-Year Moving Averages by States % Home Internet Access
 Three-Year Moving Averages by States % Home Internet Access Alabama Alaska Arizona Arkansas California Colorado Connecticut Delaware Florida Georgia Hawaii Idaho Illinois Indiana Iowa Kansas Kentucky Louisiana
Top 5 'Best Value' Education Schools and Programs By State. Alabama. Alaska
 Top 5 'Best Value' Education Schools and Programs By State KEY: State Alabama Graduate (G) Undergraduate (UG) Program 1 University of Alabama in Huntsville Secondary (UG) 2 Alabama A&M University Secondary
Institution Name Adams State University Air Force Institute of Technology-Graduate School of Engineering & Management Alabama A & M University
 Institution Name Adams State University Air Force Institute of Technology-Graduate School of Engineering & Management Alabama A & M University Alabama State University Albany State University Alcorn State
Nationally Certified School Psychologist (NCSP) Credentials Granted in the Past Year
 Credentials Granted in the Past Year") State Institution Nationally Certified School Psychologist (NCSP) Credentials Granted in the Past Year Prepared by Eric Rossen, PhD, NCSP NASP Director of Professional Development and Standards July, 205
State Institution Nationally Certified School Psychologist (NCSP) Credentials Granted in the Past Year Prepared by Eric Rossen, PhD, NCSP NASP Director of Professional Development and Standards July, 205
MAINE (Augusta) Maryland (Annapolis) MICHIGAN (Lansing) MINNESOTA (St. Paul) MISSISSIPPI (Jackson) MISSOURI (Jefferson City) MONTANA (Helena)
 Maryland (Annapolis) MICHIGAN (Lansing) MINNESOTA (St. Paul) MISSISSIPPI (Jackson) MISSOURI (Jefferson City) MONTANA (Helena)") HAWAII () IDAHO () Illinois () MAINE () Maryland () MASSACHUSETTS () NEBRASKA () NEVADA (Carson ) NEW HAMPSHIRE () OHIO () OKLAHOMA ( ) OREGON () TEXAS () UTAH ( ) VERMONT () ALABAMA () COLORADO () INDIANA
HAWAII () IDAHO () Illinois () MAINE () Maryland () MASSACHUSETTS () NEBRASKA () NEVADA (Carson ) NEW HAMPSHIRE () OHIO () OKLAHOMA ( ) OREGON () TEXAS () UTAH ( ) VERMONT () ALABAMA () COLORADO () INDIANA
2004 KICKOFF WEEKEND COLLEGES - ALPHABETICALLY
 Abilene Christian 1 Air Force 1 Akron 3 Ala.-Birmingham 4 Alabama 20 Alabama A&M 1 Alcorn State 4 Appalachian State 2 Arizona 14 Arizona State 23 Arkansas 13 Arkansas State 5 Arkansas-Monticello 1 Arkansas-Pine
Impacts of Sequestration on the States
 Impacts of Sequestration on the States Alabama Alabama will lose about $230,000 in Justice Assistance Grants that support law STOP Violence Against Women Program: Alabama could lose up to $102,000 in funds
High Risk Health Pools and Plans by State
 High Risk Health Pools and Plans by State State Program Contact Alabama Alabama Health 1-866-833-3375 Insurance Plan 1-334-263-8311 http://www.alseib.org/healthinsurance/ahip/ Alaska Alaska Comprehensive
NAAB Accredited Program List
 Auburn University Alabama Architecture Bachelor's degree NAAB Tuskegee University Alabama Architecture Bachelor's degree NAAB Arizona State University Arizona Architecture Master's degree NAAB Frank Lloyd
Workers Compensation State Guidelines & Availability
 ALABAMA Alabama State Specific Release Form Control\Release Forms_pdf\Alabama 1-2 Weeks ALASKA ARIZONA Arizona State Specific Release Form Control\Release Forms_pdf\Arizona 7-8 Weeks by mail By Mail ARKANSAS
Englishinusa.com Positions in MSN under different search terms.
 Englishinusa.com Positions in MSN under different search terms. Search Term Position 1 Accent Reduction Programs in USA 1 2 American English for Business Students 1 3 American English for Graduate Students
NASPAA s Research Universities Report 3/4/16
 NASPAA s Research Universities Report 3/4/16 Data Source: 2014-2015 NASPAA Annual Data Report N= 109 schools, 120 programs 70% of Research Universities Fall 2015 Current Enrollment 15552 students Average
NASP-Approved/Nationally Recognized Graduate Programs in School Psychology
 NASP-Approved/Nationally Recognized Graduate Programs in School Psychology The mission of the National Association of School Psychologists (NASP) is to represent school psychology and support school psychologists
NAIC ANNUITY TRAINING Regulations By State
 Select a state below to display the current regulation and requirements, or continue to scroll down. Light grey text signifies states that have not adopted an annuity training program. Alabama Illinois
Chex Systems, Inc. does not currently charge a fee to place, lift or remove a freeze; however, we reserve the right to apply the following fees:
 Chex Systems, Inc. does not currently charge a fee to place, lift or remove a freeze; however, we reserve the right to apply the following fees: Security Freeze Table AA, AP and AE Military addresses*
NASP-Approved/Nationally Recognized Graduate Programs in School Psychology
 NASP-Approved/Nationally Recognized Graduate Programs in School Psychology The mission of the National Association of School Psychologists (NASP) is to represent school psychology and support school psychologists
State-Specific Annuity Suitability Requirements
 Alabama Alaska Arizona Arkansas California Colorado Connecticut Delaware District of Columbia Effective 10/16/11: Producers holding a life line of authority on or before 10/16/11 who sell or wish to sell
Non-NAAB Accredited Program List
 Non-NAAB Accredited List Alabama A & M University Alabama City/Urban, Community and Regional Planning Bachelor's degree Non-NAAB Alabama A & M University Alabama City/Urban, Community and Regional Planning
2012 UNIVERSITY & COLLEGE SPRING BREAK DATES* ALABAMA
 2012 UNIVERSITY & COLLEGE SPRING BREAK DATES* ALABAMA Auburn University Samford University Troy State University University of Alabama-Huntsville Mar 19-24 University of Alabama-Birmingham Mar 18-24 University
BUSINESS DEVELOPMENT OUTCOMES
 BUSINESS DEVELOPMENT OUTCOMES Small Business Ownership Description Total number of employer firms and self-employment in the state per 100 people in the labor force, 2003. Explanation Business ownership
List of low tuition universities in the USA. 1. Louisiana Tech University, LA Total Cost to. International Students: $17,472
 A list of top universities in the US with low tuition fees for international students. So please find below a comprehensive list of low tuition universities in the US with their respective tuition fees.
Data show key role for community colleges in 4-year
 Page 1 of 7 (https://www.insidehighered.com) Data show key role for community colleges in 4-year degree production Submitted by Doug Lederman on September 10, 2012-3:00am The notion that community colleges
Net-Temps Job Distribution Network
 Net-Temps Job Distribution Network The Net-Temps Job Distribution Network is a group of 25,000 employment-related websites with a local, regional, national, industry and niche focus. Net-Temps customers'
New Charter University (previously known as Andrew Jackson University) University of Arkansas Little Rock
 University of Arkansas Little Rock") ALABAMA University of North Alabama University of Alabama Tuscaloosa University of Alabama Birmingham New Charter University (previously known as Andrew Jackson University) Troy University ARIZONA Arizona
ALABAMA University of North Alabama University of Alabama Tuscaloosa University of Alabama Birmingham New Charter University (previously known as Andrew Jackson University) Troy University ARIZONA Arizona
Psychology NRC Study S Rankings (1 of 6)
") 1 2 3 4 5 6 Princeton U. Harvard U. Stanford U. U. of Wisconsin at Madison Yale U. U. of Rochester U. of Michigan at Ann Arbor San Diego State U. and U. of California at San Diego Columbia U. U. of California
1 2 3 4 5 6 Princeton U. Harvard U. Stanford U. U. of Wisconsin at Madison Yale U. U. of Rochester U. of Michigan at Ann Arbor San Diego State U. and U. of California at San Diego Columbia U. U. of California
Psychology NRC Study R Rankings (1 of 6)
") 1 2 3 4 5 6 7 8 Princeton U. Harvard U. Stanford U. U. of Michigan at Ann Arbor Yale U. U. of Wisconsin at Madison U. of Rochester U. of California at Los Angeles Columbia U. Brown U. U. of Chicago U.
1 2 3 4 5 6 7 8 Princeton U. Harvard U. Stanford U. U. of Michigan at Ann Arbor Yale U. U. of Wisconsin at Madison U. of Rochester U. of California at Los Angeles Columbia U. Brown U. U. of Chicago U.
STATE-SPECIFIC ANNUITY SUITABILITY REQUIREMENTS
 Alabama Alaska Arizona Arkansas California This jurisdiction has pending annuity training legislation/regulation Annuity Training Requirement Currently Effective Initial 8-Hour Annuity Training Requirement:
Licensure Resources by State
 Licensure Resources by State Alabama Alabama State Board of Social Work Examiners http://socialwork.alabama.gov/ Alaska Alaska Board of Social Work Examiners http://commerce.state.ak.us/dnn/cbpl/professionallicensing/socialworkexaminers.as
2011 Survey of Differential Tuition at Public Higher Education Institutions
 2011 Survey of Differential Tuition at Public Higher Education Institutions American colleges and universities have historically charged the same tuition levels for all of their undergraduate majors (with
Statewide Universities That Accept ASL in Fulfillment of Foreign Language Requirements
 Statewide Universities That Accept ASL in Fulfillment of Foreign Language Requirements List maintained by Sherman Wilcox, Ph.D. University of New Mexico http://web.mac.com/swilcox/unm/univlist.html Last
American C.E. Requirements
 American C.E. Requirements Alaska Board of Nursing Two of the following: 30 contact hours 30 hours of professional nursing activities 320 hours of nursing employment Arizona State Board of Nursing Arkansas
Project Degree Completion: A Public University Initiative Commitment Statement
 Project Degree Completion: A Public University Initiative Commitment Statement We the undersigned members of the Association of Public and Land-grant Universities (APLU) and the American Association of
State Tax Information
 State Tax Information The information contained in this document is not intended or written as specific legal or tax advice and may not be relied on for purposes of avoiding any state tax penalties. Neither
FAEIS. May 2014. Issue 27
 Enrollment Headcount undergraduate enrollment is growing within agriculture. undergraduate enrollment by ethnicity. undergraduate student enrollment by type of universities. undergraduate student enrollment
Overview of School Choice Policies
 Overview of School Choice Policies Tonette Salazar, Director of State Relations Micah Wixom, Policy Analyst CSG West Education Committee July 29, 2015 Who we are The essential, indispensable member of
State Specific Annuity Suitability Requirements updated 10/10/11
 Alabama Alaska Ai Arizona Arkansas California This jurisdiction has pending annuity training legislation/regulation Initial 8 Hour Annuity Training Requirement: Prior to selling annuities in California,
http://chronicle.com/daily2004/09/2004091504n.htm 5 http://www.ed.gov/print/news/pressreleases/2004/09/09142004.html March 2005 Page 2 of 6
 Student Loan Rates FY2002 Fifty percent of all financial aid received by USG students is in the form of federal loans. In FY2003, this amounted to over $450 million dollars. Over the course of a student
BenefitsMonitor National Higher Education Participants. Mercer Health & Benefits 20
 BenefitsMonitor National Higher Education Participants Arizona State University Austin Peay State University Bates College Baylor College of Medicine Baylor University Boston University Bowling Green State
State Pest Control/Pesticide Application Laws & Regulations. As Compiled by NPMA, as of December 2011
 State Pest Control/Pesticide Application Laws & As Compiled by NPMA, as of December 2011 Alabama http://alabamaadministrativecode.state.al.us/docs/agr/mcword10agr9.pdf Alabama Pest Control Alaska http://dec.alaska.gov/commish/regulations/pdfs/18%20aac%2090.pdf
What to Know About State CPA Reciprocity Rules. John Gillett, PhD, CPA Chair, Department of Accounting Bradley University, Peoria, IL
 What to Know About State CPA Reciprocity Rules Paul Swanson, MBA, CPA Instructor of Accounting John Gillett, PhD, CPA Chair, Department of Accounting Kevin Berry, PhD, Assistant Professor of Accounting
The Obama Administration and Community Health Centers
 The Obama Administration and Community Health Centers Community health centers are a critical source of health care for millions of Americans particularly those in underserved communities. Thanks primarily
Enhancing Educational Attainment in Arizona
 Enhancing Educational Attainment in Arizona Status Report on the 2002 Changing Directions Policy of the Arizona Board of Regents at Arizona State University February 2006 Chance for College in the U.S.
2009 GRADUATE FACULTY IN PSYCHOLOGY INTERESTED IN LESBIAN, GAY, BISEXUAL, & TRANSGENDER ISSUES SURVEY
 2009 GRADUATE FACULTY IN PSYCHOLOGY INTERESTED IN LESBIAN, GAY, BISEXUAL, & TRANSGENDER ISSUES SURVEY Climate Indicators Nondiscrimination Policy for ALABAMA Auburn University University of South Alabama
State Tax Information
 State Tax Information The information contained in this document is not intended or written as specific legal or tax advice and may not be relied on for purposes of avoiding any state tax penalties. Neither
DO NOT COPY. Psychiatric Mental Health Graduate Programs 2012 Update
 Psychiatric Mental Health Graduate Programs 2012 Update Graduate education in Psychiatric Mental Health (PMH) nursing has witnessed a significant shift in the last decade. The number of graduates has increased
Real Progress in Food Code Adoption
 Real Progress in Food Code Adoption The Association of Food and Drug Officials (AFDO), under contract to the Food and Drug Administration, is gathering data on the progress of FDA Food Code adoptions by
A/B MAC Jurisdiction 1 Original Medicare Claims Processor
 A/B MAC Jurisdiction 1 Jurisdiction 1 - American Samoa, California, Guam, Hawaii, Nevada and Northern Mariana Islands Total Number of Fee-For-Service Beneficiaries: 3,141,183 (as of Total Number of Beneficiaries
Supplier Business Continuity Survey - Update Page 1
 Supplier Business Continuity Survey - Update Page 1 Supplier Business Continuity Survey A response is required for every question General Information Supplier Name: JCI Supplier Number: Supplier Facility
Attachment A. Program approval is aligned to NCATE and is outcomes/performance based
 Attachment A The following table provides information on student teaching requirements across several states. There are several models for these requirements; minimum number of weeks, number of required
Universities classified as "very high research activity"
 Universities classified as "very high research activity" 108 institutions classified as "RU/VH: Research Universities (very high research activity)" in the 2010 Carnegie Classification of Institutions
STATISTICAL BRIEF #273
 STATISTICAL BRIEF #273 December 29 Employer-Sponsored Health Insurance for Employees of State and Local Governments, by Census Division, 28 Beth Levin Crimmel, M.S. Introduction Employees of state and
NAIC Annuity Suitability Requirements by State
 NAIC Annuity Suitability Requirements by Specific Alabama Alaska 10/16/2011 TBD Arizona Arkansas If you obtained a life insurance license prior to 10/16/11, you must complete the NAIC course by 4/16/12.
NOTICE OF PROTECTION PROVIDED BY [STATE] LIFE AND HEALTH INSURANCE GUARANTY ASSOCIATION
![NOTICE OF PROTECTION PROVIDED BY [STATE] LIFE AND HEALTH INSURANCE GUARANTY ASSOCIATION](/thumbs/25/5402451.jpg "NOTICE OF PROTECTION PROVIDED BY [STATE] LIFE AND HEALTH INSURANCE GUARANTY ASSOCIATION") NOTICE OF PROTECTION PROVIDED BY This notice provides a brief summary of the [STATE] Life and Health Insurance Guaranty Association (the Association) and the protection it provides for policyholders. This
NOTICE OF PROTECTION PROVIDED BY This notice provides a brief summary of the [STATE] Life and Health Insurance Guaranty Association (the Association) and the protection it provides for policyholders. This
Real Progress in Food Code Adoption
 Real Progress in Food Code Adoption August 27, 2013 The Association of Food and Drug Officials (AFDO), under contract to the Food and Drug Administration, is gathering data on the progress of FDA Food
Annual ICFAD Program Advertising Opportunity
 Annual ICFAD Program Advertising Opportunity The International Council of Fine Arts Deans (ICFAD) is a professional organization through which members share information and ideas that enhance the leadership
NIH 2009* Total $ Awarded. NIH 2009 Rank
 Organization Name (Schools of Nursing) 2009* Total $ Awarded 2009 2008 Total $ Awarded 2008 2007 UNIVERSITY OF PENNSYLVANIA $10,908,657 1 $7,721,221 2 4 5 UNIVERSITY OF CALIFORNIA SAN FRANCISCO $8,780,469
University Your selection: 169 universities
 University Your selection: 169 universities Level of study: bachelor, master Regions: United States, compareuni T eaching & Learning Research Knowledge T ransf er International Orientation Regional Engagement
Compare Your Stats Pharmacy
 THE PREMIER SOURCE FOR FUTURE DR. S *Data provided by the American Association of Colleges of Pharmacy **Data based on matriculated students at respective schools entering fall 2010 Compare Your Stats
Schedule B DS1 & DS3 Service
 Schedule B DS1 & DS3 Service SCHEDULE B Private Line Data Services DS1 & DS3 Service... 2 DS-1 Local Access Channel... 2 DS-1 Local Access Channel, New Jersey... 2 DS-1 Local Access Channel, Out-of-State...
2014 INCOME EARNED BY STATE INFORMATION
 BY STATE INFORMATION This information is being provided to assist in your 2014 tax preparations. The information is also mailed to applicable Columbia fund non-corporate shareholders with their year-end
State by State Summary of Nurses Allowed to Perform Conservative Sharp Debridement
 State by State Summary of Nurses Allowed to Perform Conservative Sharp Debridement THE FOLLOWING ARE ONLY GENERAL SUMMARIES OF THE PRACTICE ACTS EACH STATE HAS REGARDING CONSERVATIVE SHARP DEBRIDEMENT
Recruitment and Retention Resources By State List
 Recruitment and Retention Resources By State List Alabama $5,000 rural physician tax credit o http://codes.lp.findlaw.com/alcode/40/18/4a/40-18-132 o http://adph.org/ruralhealth/index.asp?id=882 Area Health
Facing Cost-Sensitive Shoppers, Health Plan Providers Must Demonstrate Value
 w Reports: Health Insurance Marketplace Exchange Enrollment Satisfaction Improves Significantly in Second Year Facing Cost-Sensitive Shoppers, Health Plan Providers Must Demonstrate Value WESTLAKE VILLAGE,
STATE DATA CENTER. District of Columbia MONTHLY BRIEF
 District of Columbia STATE DATA CENTER MONTHLY BRIEF N o v e m b e r 2 0 1 2 District Residents Health Insurance Coverage 2000-2010 By Minwuyelet Azimeraw Joy Phillips, Ph.D. This report is based on data
NAIC Annuity Suitability Requirements by State
 NAIC Annuity Suitability Requirements by Specific Alabama Alaska 10/16/2011 TBD Arizona Arkansas If you obtained a life insurance license prior to 10/16/11, you must complete the NAIC course by 4/16/12.
Universities classified as "high research activity"
 Universities classified as "high research activity" 99 institutions classified as "RU/H: Research Universities (high research activity)" in the 2010 Carnegie Classification of Institutions of Higher Education.
We do require the name and mailing address of each person forming the LLC.
 Topic: LLC Managers/Members Question by: Jeff Harvey : Idaho Date: March 7, 2012 Manitoba Corporations Canada Alabama Alaska Arizona Arkansas California Colorado Arizona requires that member-managed LLCs
America s #1 Condom trusted for Over 90 Years
 TOP 10 1 Oregon State University 2 The University of Texas at Austin 3 University of Maryland 4 University of Arizona 5 Stanford University 6 University of Michigan 7 Brown University 8 Columbia University
ARCHITECTURE TOP 20 PROGRAMS 2014
 TOP 0 PROGRAMS 0 In your firm s hiring experience in the past five years, which schools are best preparing students for success in the profession? UNDER. Cornell University. Rice University. University
GOVERNMENT-FINANCED EMPLOYMENT AND THE REAL PRIVATE SECTOR IN THE 50 STATES
 GOVERNMENT-FINANCED EMPLOYMENT AND THE REAL PRIVATE SECTOR IN THE 50 STATES BY KEITH HALL AND ROBERT GREENE November 25, 2013 www.mercatus.org 0.7 2.4 4.2 FEDERAL CONTRACT FUNDED PRIVATE-SECTOR JOBS AS
LPSC Renewable Energy Pilot y RFPs issued by Utility Companies by Order of Commission, November 2010
 Renewable Energy LPSC Renewable Energy Pilot y RFPs issued by Utility Companies by Order of Commission, November 2010 y Searching for various forms of renewable energy and their actual cost in Louisiana
Current State Regulations
 Current State Regulations Alabama: Enacted in 1996, the state of Alabama requires all licensed massage therapists to * A minimum of 650 classroom hours at an accredited school approved by the state of
********************
 THE SURETY & FIDELITY ASSOCIATION OF AMERICA 1101 Connecticut Avenue, N.W., Suite 800 Washington, D. C. 20036 Phone: (202) 463-0600 Fax: (202) 463-0606 Web page: www.surety.org APPLICATION Application
Forestry Reading Room
 University of Arkansas School of Law Division of Agriculture www.nationalaglawcenter.com Forestry Reading Room Compilation of State Forestry Organizations Rusty W. Rumley Staff Attorney and Nastasya Knyazhishcheva
Question for the filing office of Texas, Re: the Texas LLC act. Professor Daniel S. Kleinberger. William Mitchell College of Law, Minnesota
 Topic: Question by: : Question for the filing office of Texas, Re: the Texas LLC act Professor Daniel S. Kleinberger William Mitchell College of Law, Minnesota Date: March 18, 2012 Manitoba Corporations
$7.5 appropriation $6.5 2011 2012 2013 2014 2015 2016. Preschool Development Grants
 School Readiness: High-Quality Early Learning Head Start $10.5 $9.5 $10.1 +$1.5 +17.7% $8.5 $7.5 +$2.1 +27.0% $6.5 for fiscal year 2010 Included in the budget is $1.078 billion to ensure that every Head
Acceptable Certificates from States other than New York
 Alabama 2 2 Professional Educator Certificate 5 Years Teacher Yes Professional Educator Certificate 5 Years Support Services Yes Alaska 2 Regular Certificate, Type A 5 Years, renewable Teacher Yes At least
OKLAHOMA $3,567,533 in Academic Competitiveness (AC) Grants awarded to 4,754 students
 Grants awarded to 4,754 students") OKLAHOMA $3,567,533 in Academic Competitiveness (AC) Grants awarded to 4,754 students $2,941,144 in National Science and Mathematics Access to Retain Talent (SMART) Grants awarded to 970 students For AC
OKLAHOMA $3,567,533 in Academic Competitiveness (AC) Grants awarded to 4,754 students $2,941,144 in National Science and Mathematics Access to Retain Talent (SMART) Grants awarded to 970 students For AC
Sample/Excerpts ONLY Not Full Report
 Sample/Excerpts ONLY Not Full Report Contents at a Glance CONTENTS AT A GLANCE... 2 HOME AUTOMATION USA MARKET... 4 DESCRIPTION... 4 KEY BENEFITS... 4 KEYWORDS... 4 REGION-BASED HOME AUTOMATION MARKET
(In effect as of January 1, 2004*) TABLE 5a. MEDICAL BENEFITS PROVIDED BY WORKERS' COMPENSATION STATUTES FECA LHWCA
 TABLE 5a. MEDICAL BENEFITS PROVIDED BY WORKERS' COMPENSATION STATUTES FECA LHWCA") (In effect as of January 1, 2004*) TABLE 5a. MEDICAL BENEFITS PROVIDED BY WORKERS' COMPENSATION STATUTES Full Medical Benefits** Alabama Indiana Nebraska South Carolina Alaska Iowa Nevada South Dakota
(In effect as of January 1, 2004*) TABLE 5a. MEDICAL BENEFITS PROVIDED BY WORKERS' COMPENSATION STATUTES Full Medical Benefits** Alabama Indiana Nebraska South Carolina Alaska Iowa Nevada South Dakota
Healthcare. State Report. Anthony P. Carnevale Nicole Smith Artem Gulish Bennett H. Beach. June 2012
 Healthcare State Report June 2012 Anthony P. Carnevale Nicole Smith Artem Gulish Bennett H. Beach B Table of Contents Healthcare: State Level Analysis... 3 Alabama... 12 Alaska... 14 Arizona... 16 Arkansas...
FELONY DUI SYNOPSIS. 46 states have felony DUI. Charts 1 and 2 detail the felony threshold for each of the 46 states analyzed.
 FELONY DUI SYNOPSIS The information in the following charts was compiled by examining the felony DUI laws in all 50 sates and the District of Columbia. The analysis focuses on the felony DUI threshold,
2010 Allocations to States of Volume Cap for Qualified School Construction Bonds
 2010 Allocations to States of Volume Cap for Qualified School Construction Bonds Total Dollar Allocation by State/ State/Territory Territory Alabama 140,453,000 Alaska 28,163,000 Arizona 171,115,000 Arkansas
Census Data on Uninsured Women and Children September 2009
 March of Dimes Foundation Office of Government Affairs 1146 19 th Street, NW, 6 th Floor Washington, DC 20036 Telephone (202) 659-1800 Fax (202) 296-2964 marchofdimes.com nacersano.org Census Data on Uninsured
National Association of Black Accountants, Inc. National Policies and Procedures Manual
 Introduction The purpose of the (NPPM) is to provide additional guidance on implementing the Bylaws of the Association. This manual provides a comprehensive set of policies, procedures and guidelines that
EMBARGOED UNTIL 6:00 AM ET WEDNESDAY, NOVEMBER 30, 2011
 A State-by-State Look at the President s Payroll Tax Cuts for Middle-Class Families An Analysis by the U.S. Department of the Treasury s Office of Tax Policy The President signed into law a 2 percentage
PUBLIC HOUSING AUTHORITY COMPENSATION
 PUBLIC HOUSING AUTHORITY COMPENSATION Background After concerns were raised about the level of compensation being paid to some public housing authority (PHA) leaders, in August 2011 HUD reached out to
THE 2013 HPS SALARY SURVEY
 THE 2013 HPS SALARY SURVEY Stephen L. Bump Introduction The 2013 Health Physics Society (HPS) survey data was collected by having health physicists (HPs) submit their responses to survey questions on a
14-Sep-15 State and Local Tax Deduction by State, Tax Year 2013
 14-Sep-15 State and Local Tax Deduction by State, Tax Year 2013 (millions) deduction in state dollars) claimed (dollars) taxes paid [1] state AGI United States 44.2 100.0 30.2 507.7 100.0 11,483 100.0
Low-Profit Limited Liability Company (L3C) Date: July 29, 2013. [Low-Profit Limited Liability Company (L3C)] [July 29, 2013]
![Low-Profit Limited Liability Company (L3C) Date: July 29, 2013. [Low-Profit Limited Liability Company (L3C)] [July 29, 2013]](/thumbs/27/11522934.jpg "Low-Profit Limited Liability Company (L3C) Date: July 29, 2013. [Low-Profit Limited Liability Company (L3C)] [July 29, 2013]") Topic: Question by: : Low-Profit Limited Liability Company (L3C) Kevin Rayburn, Esq., MBA Tennessee Date: July 29, 2013 Manitoba Corporations Canada Alabama Alaska Arizona Arkansas California Colorado
Topic: Question by: : Low-Profit Limited Liability Company (L3C) Kevin Rayburn, Esq., MBA Tennessee Date: July 29, 2013 Manitoba Corporations Canada Alabama Alaska Arizona Arkansas California Colorado
ADDENDUM TO THE HEALTH INSURANCE MARKETPLACE SUMMARY ENROLLMENT REPORT FOR THE INITIAL ANNUAL OPEN ENROLLMENT PERIOD
 ASPE Issue BRIEF ADDENDUM TO THE HEALTH INSURANCE MARKETPLACE SUMMARY ENROLLMENT REPORT FOR THE INITIAL ANNUAL OPEN ENROLLMENT PERIOD For the period: October 1, 2013 March 31, 2014 (Including Additional