Trading with an Edge. Multiple systems Multiple time frames
|
|
|
- George Small
- 8 years ago
- Views:
Transcription
1 Trading with an Edge Multiple systems Multiple time frames


2 Joe Rondinone and Gann RONDINONE, Joseph Anthony Joseph Anthony Rondinone, 88, formerly of East Hartford, husband of the late LouAnne (Dahnke) Rondinone, died Friday, (August 28, 2009). He was born in Italy He was a graduate of East Hartford High School, Class of 1938 and was a World War II, US Army Air Force veteran. Joseph was a musician in the greater Hartford area for over 40 years. He owned and operated the Rondinone Music Centres in East Hartford and Newington. Joe was a Master trader and amassed a substantial fortune. He developed Symmetrics, Presto and Primus. Joe developed many students around the world. His system was used in central banks and large funds groups. He was famous for accurately calling the Sp500 live on the wire a week before the crash and the Gold all time high in the 80 s as few examples. He loved stocks and commodities and traded these with absolute precision.

3 Joe Rondinone and Gann Details are sketchy as to the achievements of this trading legend, but he did claim to have made $50 million dollars trading. He certainly made some exceptional market calls and was able to charge $5,000 for his trading courses. Today, that would be an equivalent of $50,000. There is little doubt among the trading community that W.D. Gann contributed immensely to the trading world and he is a trader who should be studied.


4


5 Gann s s work Joe and Krausz The Development of Symmetrics, - Symmetrics Symmetry is a characteristic of geometrical shapes, equations and other objects; we say that such an object is symmetric with respect to a given operation if this operation, when applied to the object, does not appear to change c it. The three main symmetrical operations are reflection, rotation and translation. tion. Joe Rondinone states: I I do not care who the CEO of a company is: nor do I care if they do or do not pay a dividend: nor do I care if they make drugs, chips, baseballs, autos or raise ducks. Nor do I care where the planets are, or the e stars, moon or Sun are! JUST LET ME SEE A CHART If the price is above my TRUE TREND LINE, IT S S A BUY! If the price is below my TRUE TREND LINE, It s s a SELL PERIOD! Learn the trading rules that square price with time. It is very simple, easy and logical. When the price is squared, the trend will change; so let the price do the talking.

6 Gann s s work Joe and Krausz Robert Krausz was profiled and interviewed in The New Market Wizards by Jack Schwager for his trading prowess. Krausz created several custom indicators and multiple timeframe t analysis software, which is available to the general public. Krausz was a very successful trader and made a good living from trading stocks and commodities. The Trading Plans While W.D. Gann was considered quite an enigma and much of his writings w were less than clear, the trading plans in W.D. Gann Treasure Discovered are not overly complicated. In fact, Krausz does a superb job explaining e the rules for the trading plans and the charts are the clearest you ll find in any trading book. The main thrust of the trading plan is identifying the swings in the trend and trading with the direction of the trend swing trading. With this method, you are almost assured to catch any major trend that t develops. You will lose on about half of your trades, but the bulk of your profits will come from a few strong trends. Stops are highly stressed under these trading plans, as they should be with any trading plan. Krausz also shows you how to calculate where to place trailing stops, designed to help keep you in the trades as long as possible and also to lock in profits. These trading plans can be used on any timeframes and should apply to most markets. Back Testing the Data Krausz stresses in the book the importance of back testing a strategy before you trade it. For starters, he includes several years of back testing several markets with this trading plan. Needless to say, it has been very successful. Still, you would want to test it further on more recent data before you trade. Robert Krausz, of Market Wizards fame, reveals a trading plan of the legendary trader W.D. Gann. Krausz was able to obtain an original trading course created by W.D. Gann that t was dated June This trading plan is thoroughly explained and back-tested in W.D. Gann Treasure Discovered Simple Trading Plans for Stocks and Commodities.

7 Gann s s work Joe and Krausz

8 Time and price what does this really mean? Time can be represented in many forms, in trading there are 3 main ones Dates Time Timing Price can be represented in many forms, Visually e.g. charting Numerically Relative Fundamentally

9 Math in the market Strategies and algorithms in use are purely mathematical. Some are based on Geometry and Calculus, others are a simpler form of averages and balanced points in the historical data. Using several combined algorithms and unique ideas, the system presented allows for consistent performance and accurate definitions of trend and momentum. The system can be applied across Commodities, FX, Index s and Equity markets.


10 Cont. The concepts are to exploit price pressure and time constraints that exist in the market instruments. By combining several types of algorithms, it is possible to produce accurate and defined rules which are not always 100% correct but give the lowest risk with balanced allocations according to market conditions at the time. Some concepts, such as taking opportunities in the market when that instrument price is under extreme pressure or forced rapidly in one direction, can be measured. As an analogy it s s a bit like a rubber band effect. Rubber bands can be stretched and pulled, in extreme cases the band can be so tight that either two things will happen. A. The band will break / snap and the force will cause the band to reverse and eventually fade to nothing B. The force holding the band will release and the band will ricochet back and forth until new pressure is applied

11 Technical analysis What makes us doubt our analysis and what makes us think we are right? The small voice example Ego, self and I 46, 68

12 Technical analysis - the two forms ( pure and general ) Exploiting market prices cont cont Another exploit is the use of variations of calculus where the introduction of rate of change and principles of time can be defined in the markets. Basically the analogy is the market can move in an ideal mode/trend. However, as we know this is rare and introductions of many variables exit making the markets look random, thus harder to define and trade. So looking at a car travelling from Adelaide to Melbourne, A to B we can define some points. 1. We know the car travels at 100km/hr. We know the distance is approx 800km so we can safely say, in 8 hrs we will arrive in Melbourne. Obviously this is ideal. 2. In fact the principle I use is more like exploiting this ideal mathematical principle. The car travels at various speeds during its destination, however in the process is able to travel much faster and therefore reaches its destination in much shorter time than anticipated. The effect when arriving early is usually we have lots of time,, slow down or we can relax. Inversely in travelling from A to B we encounter delays and fluctuations in speed. This slows the arrival time and therefore when late, the principle is normally to rush and stress. These same analogies exist in the market. This is why we don t t get constant trends, or predictable price and time movements.

13 Cont. Fundamental Economic Analysis There are effectively two methodologies for determining whether to buy or sell an asset. Either; fundamental economic analysis, or technical analysis. The vast majority of fund managers (90%+) utilize fundamental economic analysis to predict the future prices of target asset markets. Analysis focuses on the likely actions of the Central Bank and the point the economy is in, in the business cycle. From this analysts generate predictions for interest rates, credit spreads, currencies, equities, property, etc. Whilst most market economists use a sort t of post war adjusted Keynesian approach, there is no hard evidence to suggest any one school of economics has proved more successful than any other. More recently, ently, the use of econometric models has accelerated, but with no real evidence of increased predictability. Both active relative return managers and absolute return managers use the fundamental economic analysis approach, the only real difference being the leverage. This approach advocates buying when analysis suggests an asset is cheap and selling it when analysis suggests it is expensive. Effectively,, buy weakness, sell strength, with an expectation of mean reversion. There is no capital c management embedded in this approach, as the weaker an asset becomes the more attractive it is. This can lead to some disastrous results.

14 Cont. Technical Analysis Technical analysis is the opposite; it advocates buying strength and selling weakness, and has an embedded capital management. Technical analysis is the mathematical examination of prices to see if certain patterns repeat themselves over time. These patterns can occur over both short (intraday/daily) and long (weekly/monthly) periods or time. The cause of the pattern is unimportant and may be the result of human responses to stimuli or the impact of long-term economic pressures, invariably unknown until some later date. Once a pattern (a system is a combination of patterns) has been identified, it is tested against historical data of any given market. The underlying commodity modity is irrelevant, only the price behavior matters. The longer the period over which the pattern occurs, the greater amount of data needed. E.g. patterns that occur on weekly charts would need at least 10 years of data. The period must include periods when markets moved both up, down, and sideways, and also a major shock to prices where markets are discontinuous, such as the 1987 stock market crash or Sept 11 terrorist attack. The system must not only be profitable but also avoid large drawdown's in capital. The best systems accumulate profit without excessive volatility. There are many different types of technical analysis. Most of these utilize just price data.

15 Cont. Analysis done with a view of limitations, Limit your understanding and capabilities to trade the market and analyse it correctly. Ceiling and floors does the market have a ceiling, does the market have a floor? - Pure form relates to accurate definition sin which precise calculations can be used to determine your analysis, general is rough analysis which subjects itself to the viewer or perceived interpretation at the time.

16 Indicators vs. algorithms Algorithmic trading From Wikipedia, the free encyclopedia In electronic financial markets, algorithmic trading or automated trading,, also known as algo trading, black-box box trading or robo trading,, is the use of computer programmes for entering trading orders with the computer algorithm deciding on aspects of the order such as the timing, price, or quantity of the order, or in many cases initiating the order without human intervention. Algorithmic Trading is widely used by pension funds, mutual funds,, and other buy side (investor driven) institutional traders, to divide large trades into several smaller trades in order to manage market impact,, and risk.[1] [1][2][2] Sell side traders, such as market makers and some hedge funds,, provide liquidity to the market, generating and executing orders rs automatically. A special class of algorithmic trading is "high" high-frequency trading" " (HFT), in which computers make elaborate decisions to initiate orders based on information that is received electronically, before human traders are capable of processing the information they t observe. Algorithmic trading may be used in any investment strategy, including market making,, inter-market spreading, arbitrage,, or pure speculation (including trend following). The investment decision and implementation may be augmented at any stage with algorithmic support or may operate completely automatically a ("on auto-pilot pilot"). A third of all EU and US stock trades in 2006 were driven by automatic programs, or algorithms, according to Boston-based financial services industry research and consulting firm Aite Group.[3] As of 2009, high frequency trading firms account for 73% of all US equity trading volume.[4] In 2006 at the London Stock Exchange,, over 40% of all orders were entered by algo traders, with 60% predicted for American markets and equity markets generally have a higher proportion of algo trades than other markets, and estimates for 2008 range as high as an 80% proportion in some markets. Foreign exchange markets also have active algo trading (about 25% of orders in 2006).[5] Futures and options markets are considered to be fairly easily integrated into algorithmic trading,[6] with about 20% of options volume expected to be computer generated by 2010.[7] Bond markets are moving toward more access to algorithmic traders.[8] One of the main issues regarding high frequency trading is the difficulty d in determining just how profitable it is. A report released eased in August 2009 by the TABB Group, a financial services industry research firm, estimated that the 300 securities firms and hedge funds that specialize in this t type of trading took in roughly $21 billion in profits in 2008[9] [9]. 0.htm In the algorithmic trading space, an "algorithm" describes a sequence of steps by which patterns in real-time market data can be recognized and responded to in order to detect trading opportunities and place and manage orders in the market. The term "algorithmic trading" has only become b commonly used within the financial sector over the past few years although although trading algorithms have been around for longer. Historically, large investment banks have deployed armies of Ph.D.s to custom build trading algorithms. Now, an advanced anced technology approach called "Complex Event Processing" (CEP) ) is making it much quicker and easier to build, deploy, and manage trading algorithms, with fewer personnel necessary. performance-computing/ ;jsessionid=gnrclrogpqhilqe1ghrskh4atmy32jvn computing/ ;jsessionid=gnrclrogpqhilqe1ghrskh4atmy32jvn ABSTRACT Real world stock markets predictions such as stock prices, unpredictability, and stock selection for portfolios, are challenging problems. Technical indicators are applied to interpret stock market trending and investing decision. The main difficulty of an indicator usage is deciding its appropriate parameter values, as number of days of the periods or quantity and kind of indicators.. Each stock index, price or volatility series is different among g the rest. In this work, Evolutionary Algorithms are proposed to discover correct indicator parameters in trading. In order to check this proposal the Moving Average Convergence- Divergence (MACD) technical indicator has been selected. Preliminary results show that this technique could work well on stock index i trending


17 Mathematical algorithms As mentioned previously, combining some geometry based algorithms into the system allows a different look at the markets and therefore not correlated with the masses of trading techniques. E.g. trend traders / support- resistance traders / swing traders. Using an algorithm known as Symmetrics, defining trends and points of interest can be measured without interpretation or subjective analysis, giving stable definitions and unique trend changes. A. Monthly trend change Monthly Wheat h09 trend is down and continues to show no sign of change.


18 Mathematical algorithms Other simple techniques used are defined as accurately as possible to provide the best assessment. The use of the moving average, simple as it is, can be extremely effective in defining trends, momentum and balance points in the market. Pit traders have used these techniques for a 100 years and they still work well today. The difference is the stepping of prices and defined levels, provides accurate representation and therefore performance in the instruments traded. Using pivots or Balance points, these historical values in price, can be used to assess price support / resistance levels and therefore points of interest for entering or exiting the market. B. Stepped average, defines momentum, accurate defined trends, price pressure.

19 Back test vs. Simulation What is a back test and how do analyst get it so wrong? Back test viability Simulation, the real deal and evidence of profit and loss. Simulation: The principles of trading

20 Software platforms technology changes Neo ticker Ninja trader ds.php IB flow-ons ons

21 Brokers / Brokerage IB and other now discounted brokers What can you ask for? What service do you get How the system works and why you should be educated on finer points Slippage what is it? Positive Slippage, Negative Slippage
22 Funds management concept changes The Investment Industry is broadly divided into two areas. 1. Relative returns 2. Absolute returns Of the relative return area there are passive and active groups. Both of these groups s have a strong mantra of buy and hold. If the market drops after buying it, the asset is considered better value,, so hold the asset and buy more while this has worked to some degree the markets are changing and a the strategy has depreciated considerably with the likes of Enron, AOL, and other major companies, whereby the company goes bust or re-lists at significantly lower levels. Attempts have been made to counter this by employing Modern portfolio management, which states grouped investments are less risky than individual constituents, however if the group goes down then you have a bigger problem. The only way is to exit at a great loss or short the market, which breaks the rules of these groups. Passive seek to replicate a benchmark such as the S&P500 for example and d base their performance relative to this market. The S&P500 has moved down 15 % of it s value and the fund has moved 5% relative to this (in other words both have performed negatively, or bluntly, made a loss while the funds promote a bias on this scenario, that they have performed relatively better than the index it does not negate the fact they have made a loss. Approximately 40 % of assets are managed this way. Active seek to deviate either side of the benchmark. They rarely short the asset or hedge against the downside. They will switch between asset classes based on the company strategies tegies and market indicated direction. Over 75 % of these funds are governed by market direction. Up to 85% of all relative return funds under perform their benchmark Performance persistence is limited to about 1-22 yrs and inevitably this year s s winners are next year s s losers. Performance is attributed to style rather than skill. The Relative funds withdraw a fee regardless of performance and in some cases multiple fees based on the spreading of risk through Funds of Funds.
23 In Contrast Fees Double Bubble $ $ $ Investor Financial Planner Super Fund Fund of Funds Fees Fees Fees Fees $ $ $ Fees Fees Fees Hedge Fund A Hedge Fund B Hedge Fund C Hedge Fund D The absolute return managers focus on delivering an absolute return on investment, irrespective of whether markets are going up or down. In periods of prolonged bear markets, this is only achievable by outright shorting of the markets. The image of the absolute return industry is dominated by the Managed Futures & Hedge Funds, where funds invested are supplemented by borrowed funds with a leverage of up to 20 times.
24 Cont Hedge (Absolute Return) Fund Returns Interestingly, not only are returns notably higher in the absolute return funds, the standard deviation of those returns are lower than their relative return counterparts. The correlation between the return on these funds & relative return managed monies is very small, making it a very attractive a risk diversification instrument. This has led to increased institutional ional investment in these funds, with most asset consultants now recommending that institutions invest between 5 & 15% of their assets into this growing area. Given institutional involvement is currently only around 1% of assets, a future growth will remain explosive as the institutions play catch up. This can be seen by the fact that institutional funds now represent over 20% of all growth in hedge fund new monies. Volatility the art of allocating
25 Allocations and Risk Any trading technique requires good money management and risk assessment. sessment. Contracts = (notional value * f%) / {est{ worst loss} The crux of the whole matter therefore comes down to the dynamic estimation of worst loss (from entry), which is depicted as the absolute value of the 'est. worst loss' above. Obviously, the most accurate estimate for worst loss is the stop loss placed on a trade. The big benefit is this calculation is in complete harmony with the market-system's behaviour, however, it does create a problem. Using the current stop-loss can mean that if the stop loss is extremely tight, then contract numbers can become extremely large. Also, these periods also do not tend to be the points of highest expectation for certain models. For example, volatility models require relatively high volatility, therefore traders use stop loss as they 'est. Worst Loss' generally set a volatility minimum for each market which is used as when the stop loss is smaller. Using a combined short term and long term technique, give a balanced assessment of contract allocations and volatility. The benefit of a short term average is that contracts are not loaded up quite as aggressively as volatility reduces and not scaled back as aggressively as volatility increase. This s aligns with the general characteristics of many volatility models, wherein, expectation improves as volatility expands e (at least in the initial phase of a move). Additionally the assessment of time frames and levels extremes ( rubber ban effect) play a major role in risk and allocation of contracts. As example: in the recent Wheat May09 contract, the nominal value e of contracts say 220 is allocated on the short side, as the levels are touched and confirmation of each change in price is monitored, at some point a rally will occur, how we allocate and assess the risk using higher time frames becomes important. Risk exits in Portfolio Risk, Market Risk and Trade Risk. wheat contract setup an entry on the 9 th of February at 585.5, the allocation is already initiated ( $$ available or type of hedge required) and market risk has already been assessed d ( volume per day, liquidity, volatility etc..) the fact that monthly and weekly pressure is short then the assessment for a continuation after a small rally is very high. Thus entering with confidence and at a point where the market has extended itself ( extreme ) against the momentum of the current direction then this entry is valid, risk on the trade is assessed as stop level vs. the entry point of The process now is to de-allocate when signals show a possible turn or rally, taking profit is paramount for locking in performance. On a note of profit, some markets produce times where the instrument is extremely profitable and others where it flat lines. By assessing profitability (performance on a short term and long term scale) allows the portfolio to be assessed and dynamically adjusted so that we don t t flog a dead horse on one market and be lean and mean on another.
26 PORTFOLIO ALLOCATION PORTFOLIO ALLOCATION Portfolio allocation is a major downfall of system traders. Short term systems are reliant on market volatility, therefore, the average daily range in dollar terms relative to the average market slippage becomes very significant and some traders use this as a filter. Using this type of filter can have the benefit of bringing in markets such as Corn, that normally would not be viable due to their normally low volatility (in $$ terms), or Unleaded Gasoline because of its normally high slippage. The idea here is to introduce several aspects of market variations which will effect performance. Introducing performance, liquidity and time frames give the portfolio the ability to adjust dynamically and thus lower risk on instruments of concern or sudden changes which were unaccounted for. Market Type Disbursement Commodities Fixed Income Currencies Stock Indices Energies Precious Metals Market Corn Wheat Oats Coffee 11% Live Cattle Lean Hogs Soybeans Sugar #11 Cocoa Pork Bellies Cotton 7% 25% 16% Type Commodities Commodities Commodities Commodities Commodities Commodities Commodities Commodities Commodities Commodities Commodities 27% 14% % weighting p.a ( 5 yr ) 5.00% 30.00% 8.00% 22.50% 15.00% 13.00% 20.00% 9.00% 7.00% 6.80% 12.00%
27 Summary and Questions Why do we trade stocks? Why do we use technical analysis?
28 Examples of System analysis Analysis on several commodities and index s s showed defined levels of accuracy and timing analysis to set positions in these instruments. Wheat March / level to touched by end of the month low so far Wheat May level to touched initially current low Corn May , current low Beans May initial level hit and updated to current low By using multiple time frames, analysis can be refined to determine overall trend, market momentum and support/resistance levels. Understanding Monthly and weekly price pressures allows the trader to determine daily fluctuations and if they are short term or long term.
29 Examples of System analysis Wheat May k09 weekly example and below the daily. Notice the unique trend of the daily still short trend despite the spike up, did not tip the position out and continues to track weekly and monthly analysis. Also the ability to re-measure vibrations/reactions in price where was the resistance area the actual high was Panamax index Capesize index
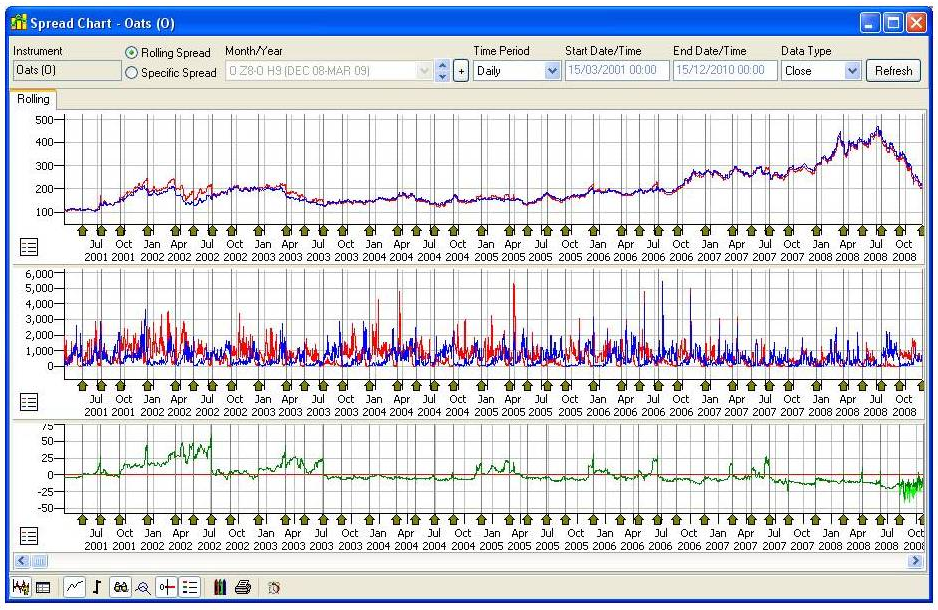
30 Spreads

31 Cont When things go wrong!
32 - 10 Major factors in trading Identify the exact amount of money you are going to use in trading; understanding that it is money you can AFFORD TO LOSE. Identify the markets you are going to trade and the contracts associated with them. Understand yourself, how do I react under pressure? YOUR EGO refer Tolle Book Am I Intuitive & Instinctive, do I pay attention to detail, do I follow my gut feelings etc. Accuracy and precise measurements are key mathematical principles. Control your costs Data feed, hardware & software. (this has nothing to do with the service from your broker) Prepare your own personalized trading sheet. Prepare yourself for minor losses they are a very important part of your plan. Loses are our business expenses. Cut your loss quickly by following our exit strategy. Allow your profits to run and only exit the market using our trading plan. Always remain objective by following your plan.
33 questions donmillerjournal.blogspot.com/ ogs.php# look at the trial only, get a idea of trading with accuracy. I have some recorded sessions of his trades look down the right side and see the Some Fibonacci Trader features icon, under this is the newsletters on some great principles of Joe s s which Krauz used to great effect. Further interest : In symmetrics and trading/mentoring please contact via symmetrics@internode.on.net
34 AUDUSD daily reacting to weekly/monthly
35 Monthly Sp500, the true trend shows where the index is currently heading.
36 Weekly Sp500, notice the true trend change in line with Monthly.
37 Daily Sp500
38 Added document on 4/5 market 95% accuracy tested live. Thank you for the opportunity to present some concepts and style of trading. I will explain how I process the data and apply into positions for each market. Requested Markets: February 11, 2009 Wheat US exchange CBOT / CME Corn US exchange CBOT / CME Soybeans (beans) US exchange CBOT / CME Panamax index- I was able to load closing data only and hence my accuracy is limited l to some degree due the nature of the math I use to determine the levels. Normally the requirements r are open, high, low and close normally. However I have ran some test over the data and these are a the results. Capesize index- as above Analysis is provided in 2 ways firstly assessing the pricing levels els in 3 time frames- Monthly, weekly and daily In order to determine true price movement s s analysis must be applied in higher time frame to assess factors s such as VAR, extreme price peaks/troughs, momentum of the instrument and money management in regard to allocations and risk when applying them. Secondly once a clear view is reached Fundamental data can be applied plied to overlay the initial analysis and verify or provide conflict in which case risk assessment is increased or decreased d accordingly. I use a variation of 3 systems combining Pivot based floor traded d techniques with geometric/calculus bases algorithm, this effectively gives a true trend direction, momentum and effective speed of market and finally a gauge to measure whether the instrument is trading in a extreme area of price movement or in a neutral area (effectively the rubber band effect) Whereby stretching the rubber band will be classed as an extreme e price level and (neutral) - or low volatility, range price movement is when the rubber band is in neutral state or rest. Wheat is getting close to change in contract OR rollovers so ill do both contract months, namely March and May. As a Note: the calculations are dynamic in nature once a level is reach, I can recalculate the new movement, this dynamic prices provides greater accuracy and allows for sudden changes c that may occur. As an analogy: the calculations are like a water level in glass once full I require a new cup to measure the next allocation of water.
39 - Monthly Analysis: March Contract: WHEAT From the high of 1275 in March 2008 wheat has broken the bullish trend and entered a long term bear market. The low of 471 in December last year was a long term m support level - (489.5) was the calculated price from my analysis. So fairly close considering ng the 5months it was calculated before hand. The red circle represents the calculation and blue OHLC bar shows s the low. Currently the monthly trend is still down and any break past /-10pts (accuracy) will result in another larger bearish move initially to 449 even. Given the contract is nearly over time is running out to reach this point, so wheat (March) should only test levels: Bullish level (resistance) Bearish Level (support)
40 - Weekly analysis: March Contract: WHEAT Focusing onto the weekly time frame the math shows the weekly trend is also in the bearish direction and price pressure is at a key point. The price level of if held(does not close below this level); for this week being the ending week of 13th of February. Next week calculation shows in strong favour of the price of March wheat to find support at With a secondary longer term level at this correlates with the monthly level with in a few pts.
41 - Market rollover /expiry generally I use a combination of Volume and open interest to determine contract change, in this case an entry came up on March and May, knowing the expiry is coming up soon there is slightly less exposure to march contract as it 4 weeks away, effectively if the entry was later e.g. 5 to 10 days away no contracts would be traded here. (Volume and open interest has usually changed to May Contract by then). Monthly Analysis: May Contract WHEAT Monthly trend is in a bear state, the trend at this stage for the monthly is still very strong and no indications of changing. Bullish level (resistance) no upside calculation is close enough, at this stage the only one which I can measure currently is 704 But this will change at the end of the month of February. Bearish Level (support) and if this level is broken by 10pts then is the price level for February /March support points of interest.
42 - Weekly analysis: May Contract: WHEAT Weekly calculations show the trend and momentum is still down initial itial level should reach 537 this week, any close below this on Friday EOD close, c should result in as the next major support level similar to the monthly level by a few pts. On the upside nest week being from the 16th of feb any rally will struggle to break the level, therefore this will be a tough area to rally past. Daily analysis: 2 to 3 days May Contract: WHEAT Daily trend is bearish and price pressure is looking to follow down d to the weekly levels. Daily entry on the on the 9th of February Daily Bearish level = 540 for Friday or Monday. Updates to follow as levels are hit (follow thru with signals to give an idea of concepts) Corn and Beans ill just do the May contracts as it a little more work to do
43 - Monthly Analysis: May Contract Corn Monthly trend is in strong bearish trend. From the high of 822 in this contract; and the recent low of The corn market has been a much stronger in momentum on the downside than its counterparts of Wheat and Beans. Corn monthly primary support level should be testing for this month and 314 as extreme move in corn for the month of February. Basically a close below would provide a support base at 264. Weekly analysis: May Contract: Corn Weekly calculations show the trend is critically on the edge of possible change, a close above 369 with week would confirm a change in trend a possible 2 or 3 weeks rally (which can be measured). At this stage corn weekly should not fall below 370 and this may be true for next week as well. If the close this week closes below the 369 level then 362 is the target price for next week. Daily analysis: 2 to 3 days May Contract: Corn Daily trend is bearish and there is slowness in the price momentum on the downside, correlating with the weekly possible change in trend. Daily entry was a 392 9th of February If the daily closes below 378 for Thursday or Friday then initial l support level will be 370, the levels here are very close and this usually suggests a change in trend. Daily level extreme is 362 matching weekly level analysis.
44 - Monthly Analysis: May Contract Beans Monthly trend is very bearish and at this stage February should another down month. Initial level for February is 914 as a support in price area and 862 for the extreme or early march level. Weekly analysis: May Contract: Beans Weekly calculations show the trend is slight bearish, 980 seems to be a very tough area to break through. The next week level is difficult as there is 2 levels to watch carefully this week or early next week 953 level if held may provide a rally point. Likely level for next week will be to 929 (calculations show s slight discrepancy so for simplicity ill use the range as a check) Daily analysis: 2 to 3 days May Contract: Beans Daily trend is a slightly bearish is a critical level and if Thursday or Friday close below; then expect to see 962 level to be tested. The daily price is starting to setup for a possible rally again and the level close above or below will be critical for a change in trend on the daily and possible next week a rally. Entry for daily was a 1016 on 9th of February with the initial itial profit target price being hit at 982 already. Out of the 3 markets beans seems to be the most volatile and therefore higher risk, lower allocation due to the possible daily and weekly trend change form a short position to a long. I will send through a update on daily s s so u can track the progress. Any questions please ask. I ve tried to explain a little about what im doing and not add to much so at least you have levels and some timing to look at.
TOMORROW'S TRADING TECHNOLOGY. 100% automated Fibonacci support and resistance levels that you can count on every single trading day in an instant.
 TOMORROW'S TRADING TECHNOLOGY 100% automated Fibonacci support and resistance levels that you can count on every single trading day in an instant. ProTrader Table of Contents 1. Areas A. Fibonacci Confluence
Algorithmic Trading Session 1 Introduction. Oliver Steinki, CFA, FRM
 Algorithmic Trading Session 1 Introduction Oliver Steinki, CFA, FRM Outline An Introduction to Algorithmic Trading Definition, Research Areas, Relevance and Applications General Trading Overview Goals
High Probability Trading Triggers for Gold & Silver
 Welcome to a CBOT Online Seminar High Probability Trading Triggers for Gold & Silver Presented by: John Person Sponsored by Interactive Brokers Live Presentation Starts at 3:30 PM Chicago Time NOTE: Futures
Whether you re new to trading or an experienced investor, listed stock
 Chapter 1 Options Trading and Investing In This Chapter Developing an appreciation for options Using option analysis with any market approach Focusing on limiting risk Capitalizing on advanced techniques
5 Pitfalls To. Avoid For. Sucessful
 5 Pitfalls To Avoid For Sucessful Forex Trading Contents Page Legal and Copyright 3 Introduction To The 5 pitfalls 4 Pitfall 1- Unlimited Losses 6 Pitfall 2-Forex Brokers Closing Our Accounts 8 Pitfall
BULL'S EYE TRADING. by Joe Duffy. A trading champion's guide to pinpointing tops and bottoms in any market
 BULL'S EYE TRADING A trading champion's guide to pinpointing tops and bottoms in any market by Joe Duffy Trading futures and options does involve financial risk. Contact us for a discussion of the potential
Introduction... 4 A look at Binary Options... 5. Who Trades Binary Options?... 5. Binary Option Brokers... 5 Individual Investors...
 Table of Contents Introduction... 4 A look at Binary Options... 5 Who Trades Binary Options?... 5 Binary Option Brokers... 5 Individual Investors... 5 Benefits of Trading Binary Options... 6 Binary Option
Chapter 2.3. Technical Analysis: Technical Indicators
 Chapter 2.3 Technical Analysis: Technical Indicators 0 TECHNICAL ANALYSIS: TECHNICAL INDICATORS Charts always have a story to tell. However, from time to time those charts may be speaking a language you
COMMODITIES Precious Metals Industrial (Base) Metals Commodities Grains and Oilseeds Softs affect supply curves Exotics Standardization Tradability
 Metals Commodities Grains and Oilseeds Softs affect supply curves Exotics Standardization Tradability") COMMODITIES Commodities: real and tangible assets that are elements of food (agricultural products like wheat and corn), fuel (oil, gas), metals (ex: copper, aluminum, gold, tin, zinc), and natural resources
COMMODITIES Commodities: real and tangible assets that are elements of food (agricultural products like wheat and corn), fuel (oil, gas), metals (ex: copper, aluminum, gold, tin, zinc), and natural resources
Daytrading Cup Breakouts
 A Strategic Approach Daytrading Cup Breakouts inga poslitur Here s how you can daytrade momentum trades. ntering and exiting intraday trades using E precision technical trading signals has been popular
THE POWER OF FOREX OPTIONS
 THE POWER OF FOREX OPTIONS TOPICS COVERED Option basics Call options Put Options Why trade options? Covered call Covered put Hedging your position using options How to repair a trading position THE POWER
Chapter 2.3. Technical Indicators
 1 Chapter 2.3 Technical Indicators 0 TECHNICAL ANALYSIS: TECHNICAL INDICATORS Charts always have a story to tell. However, sometimes those charts may be speaking a language you do not understand and you
Trading CFDs with Trader Dealer ABN 17 090 611 680 (AFSL NO 333297)
") Trading CFDs with Trader Dealer ABN 17 090 611 680 (AFSL NO 333297) Pages 1. Overview 3 2. What is a CFD? 3 3. Why Trade CFDs? 3 4. How Do CFDs Work? 4 4.1 Margin 4 4.2 Commission 5 4.3 Financing 6 4.4
Trading CFDs with Trader Dealer ABN 17 090 611 680 (AFSL NO 333297) Pages 1. Overview 3 2. What is a CFD? 3 3. Why Trade CFDs? 3 4. How Do CFDs Work? 4 4.1 Margin 4 4.2 Commission 5 4.3 Financing 6 4.4
Chapter 3.4. Forex Options
 Chapter 3.4 Forex Options 0 Contents FOREX OPTIONS Forex options are the next frontier in forex trading. Forex options give you just what their name suggests: options in your forex trading. If you have
Phone 541-955-2885 Toll-Free 1-800-732-3118 Fax 541-955-2889 www.gbemembers.com
 Strangle Strategy GOAL The Strangle strategy is rarely mentioned in option trading circles. However, I believe it has the potential to be quite rewarding, especially for the under capitalized trader. As
MODULE 4 MODULE 4 INTRODUCTION PROGRAMME LEVERAGE AND MARGIN
 INTRODUCTION PROGRAMME MODULE 4 LEVERAGE AND MARGIN This module explains leverage and gearing and compares CFDs with non-geared investments. Additionally, there are a number of worked examples of how our
Exchange-traded Funds
 Mitch Kosev and Thomas Williams* The exchange-traded fund (ETF) industry has grown strongly in a relatively short period of time, with the industry attracting greater attention as it grows in size. The
BINARY OPTION TRADING. Lesson #1
 BINARY OPTION TRADING Lesson #1 1 Table of Contents Forward. 3 Introduction to Binary Option... 4 Benefits of Trading Binary Options. 5-6 Binary Option Basics 7 Types of Binary Option. 8-10 Unique OptionBit
FUTURES TRADING SYSTEMS
 FUTURES TRADING SYSTEMS Anatomy of Automated System Execution By Steve Dahl ASSET DIVERSIFICATION & TODAY S FINANCIAL MARKETS The globalization of financial markets has made asset diversification and managing
Secrets for profiting in bull and bear markets Sam Weinstein
 Secrets for profiting in bull and bear markets Sam Weinstein 1. Check market indicators for overall direction 2. Scan the industry groups to know which one to zero in 3. Cull out the stocks with the most
Trading Systems Series
 Trading Systems Series HOW DO I TRADE STOCKS.COM Copyright 2011 10 Trading Systems Series 10 TIMES YOUR MONEY IN 30 TRADES THE 4% SWING SYSTEM 30 4% This report will outline a simple 5 min a week strategy
Technical Analysis. Technical Analysis. Schools of Thought. Discussion Points. Discussion Points. Schools of thought. Schools of thought
 The Academy of Financial Markets Schools of Thought Random Walk Theory Can t beat market Analysis adds nothing markets adjust quickly (efficient) & all info is already in the share price Price lies in
Thinking Man s Trader
 Thinking Man s Trader Advanced Trader s Package Trading is a three dimensional world and the Advanced Trader s Package covers all three. Dimension three: Market Dynamics, conditions and change of conditions
CONTROLLING. Your TRADES, MONEY& EMOTIONS. By Chris Vermeulen
 CONTROLLING Your TRADES, MONEY& EMOTIONS By Chris Vermeulen INTRODUCTION In this condensed guide I have put together some key points which I think should be read a few times in order for these critical
SAVI TRADING 2 KEY TERMS AND TYPES OF ORDERS. SaviTrading LLP 2013
 SAVI TRADING 2 KEY TERMS AND TYPES OF ORDERS 1 SaviTrading LLP 2013 2.1.1 Key terms and definitions We will now explain and define the key terms that you are likely come across during your trading careerbefore
Structured products. Precision tools. A guide for private investors.
 Structured products Precision tools. A guide for private investors. Structured products are listed securities available for trading on London Stock Exchange s regulated Main Market. Structured products
CHART TRADING GUIDE 1
 CHART TRADING GUIDE 1 How to understand chart trading This guide is designed to teach you the basics of chart trading- the chart patterns that are covered in this booklet can be used for short and medium
DVAN SmartLines on TradeStation
 DVAN SmartLines on TradeStation This document is intended as an introduction and user guide to the apps available to Divergence Analysis users on TradeStation. For more information, please contact info@divergenceanalysis.com
Professional Trader Series: Moving Average Formula & Strategy Guide. by John Person
 Professional Trader Series: Moving Average Formula & Strategy Guide by John Person MOVING AVERAGE FORMULAS & STRATEGY GUIDE In an online seminar conducted for the Chicago Board of Trade, I shared how to
THE MOST POWERFUL DAY TRADING SETUP PERIOD!
 THE MOST POWERFUL DAY TRADING SETUP PERIOD! In this pdf I will show you how I combine my institutional numbers with my 40-60 number count 9 and 13 setups. Below you will find my concrete rules on when
Trade Forex with Support and Resistance Strategies. By Walter Peters, Phd. BestMetatraderBroker.com
 Trade Forex with Support and Resistance Strategies By Walter Peters, Phd. BestMetatraderBroker.com 1 Important Risk Disclaimer ALL INFORMATION CONTAINED IN THIS COURSE IS FOR EDUCATIONAL PURPOSES ONLY
Proceedings of the 9th WSEAS International Conference on APPLIED COMPUTER SCIENCE
 Automated Futures Trading Environment Effect on the Decision Making PETR TUCNIK Department of Information Technologies University of Hradec Kralove Rokitanskeho 62, 500 02 Hradec Kralove CZECH REPUBLIC
Forex Basics brought to you by MatrasPlatform.com
 Forex Basics brought to you by MatrasPlatform.com Table of Content What is FOREX... 3 FOREX Basics... 4 Trading Hours... 4 What Is Traded on FOREX?... 4 The Six Majors... 4 Currency Pair Distribution...
CONTRACTS FOR DIFFERENCE
 CONTRACTS FOR DIFFERENCE Contracts for Difference (CFD s) were originally developed in the early 1990s in London by UBS WARBURG. Based on equity swaps, they had the benefit of being traded on margin. They
Presents. The Trading Information Revealed Here is not the Same as the WizardTrader.com Methods -- But Together They Pack a Powerful Punch
 Presents Killer Patterns Now You Can Have These Trading Gems -- Free! The Trading Information Revealed Here is not the Same as the WizardTrader.com Methods -- But Together They Pack a Powerful Punch 1
A guide to CFDs. Contracts for difference. For more information please contact us on 0117 988 9915 or visit our website www.hlmarkets.co.
 A guide to CFDs Contracts for difference For more information please contact us on 0117 988 9915 or visit our website www.hlmarkets.co.uk One College Square South, Anchor Road, Bristol, BS1 5HL www.hl.co.uk
Market Linked Certificates of Deposit
 Market Linked Certificates of Deposit This material was prepared by Wells Fargo Securities, LLC, a registered brokerdealer and separate non-bank affiliate of Wells Fargo & Company. This material is not
How to Win the Stock Market Game
 How to Win the Stock Market Game 1 Developing Short-Term Stock Trading Strategies by Vladimir Daragan PART 1 Table of Contents 1. Introduction 2. Comparison of trading strategies 3. Return per trade 4.
Spike Trading: Spot FX Vs Futures
 You should be aware of all the risks associated with foreign exchange and futures trading. There is a substantial risk of loss in foreign exchange and futures trading. Past performance is not indicative
Stuart McPhee s Trading Plan Template
 Stuart McPhee s Trading Plan Template Mindset * Right from the start you need to ask yourself whether you are prepared to work towards achieving a trading plan that will work. If yes, great! Many people
Scalping Trade Strategies April 14, 2009
 www.fxcm.com sales@fxcm.com Scalping Trade Strategies April 14, 2009 DailyFX Research Team John Kicklighter David Rodriguez Currency Strategists 1-212-897-7660 1-888-50-FOREX (36739) Just a decade ago,
Leverage and margin. Module 3 Introduction Programme. Leverage and margin
 Module 3 Introduction Programme Leverage and margin This module explains leverage and gearing and compares spread bets with non-geared investments. Additionally, there are a number of worked examples of
Active Currency Trading Model Product Guide for Individually Managed Discretionary Accounts (MDA)
") Active Currency Trading Model Product Guide for Individually Managed Discretionary Accounts (MDA) A high growth alternative investment for private and institutional investors wanting exposure to macro
Active Currency Trading Model Product Guide for Individually Managed Discretionary Accounts (MDA) A high growth alternative investment for private and institutional investors wanting exposure to macro
Introduction to Futures Contracts
 Introduction to Futures Contracts September 2010 PREPARED BY Eric Przybylinski Research Analyst Gregory J. Leonberger, FSA Director of Research Abstract Futures contracts are widely utilized throughout
Chapter 28 LIQUIDATION
 Chapter 28 LIQUIDATION Knowing when to liquidate a trade is at least as important as knowing when to enter a trade. Since most traders are on the right side of a trade going in, then the problem would
Let s Get to Know Spread Bets
 Let s Get to Know Spread Bets Spread betting is pretty cool. Here are three reasons why. Even if you ve never traded before, you probably know how the financial market works buy in and hope it goes up.
Table of Contents. Make Money Trading Options Top-15 Option Trading Strategies. RLCG Management LLC All Rights Reserved Page 2
 Table of Contents Introduction: Why Trade Options?... 3 Strategy #1: Buy-Write or Covered Call... 4 Strategy #2: Sell-Write or Covered Put... 5 Strategy #3: Protective Put... 6 Strategy #4: Collar... 7
BEAR: A person who believes that the price of a particular security or the market as a whole will go lower.
 Trading Terms ARBITRAGE: The simultaneous purchase and sale of identical or equivalent financial instruments in order to benefit from a discrepancy in their price relationship. More generally, it refers
Forex Volatility Patterns
 Spotting Early Breakouts Forex Volatility Patterns BRUCE WALDMAN Want to catch 40 to 00 pips in each trade? Here s how you can find those entry and exit signals to make your forex trading a success. C
How To Know When A Market Is In A Strong Trending Phase
 The 3 Rules of Successful Swing Trading Trade with the Wind at Your Back The Rule That Hits Home Runs & Be In the Right Place at the Right Time by Michele Mish Schneider, Director of Trading Research &
DISCOVER THE SECRETS OF
 DISCOVER THE SECRETS OF TRADING GOLD AN INTRODUCTION TO TRADING GOLD A FOREX.COM EDUCATIONAL GUIDE 1 The desire for gold is the most universal and deeply rooted commercial instinct of the human race. Gerald
How To Be Successful At Trading Forex
 Regulated by CySEC 185/12 01 Traders often fail because they don t learn from mistakes. Keep a diary of trades to discover what works and what doesn t. 02 Don t set a stop loss order too close to the opening
FREQUENTLY ASKED QUESTIONS March 2015
 FREQUENTLY ASKED QUESTIONS March 2015 Table of Contents I. Offering a Hedge Fund Strategy in a Mutual Fund Structure... 3 II. Fundamental Research... 4 III. Portfolio Construction... 6 IV. Fund Expenses
One of the primary challenges traders deal with is
 TRADING Strategies Momentum trading: Using pre-market trading and range breakouts Focusing on days the market breaks out of the prior day s range and moves in the same direction as the pre-market trend
Pattern Recognition Software Guide
 Pattern Recognition Software Guide 2010 Important Information This material is for general information only and is not intended to provide trading or investment advice. All analysis and resulting conclusions
Today the ROAR of the S&P pit is gone but long after electronic trading took over the rules continue to be a vital part of our trading tool box
 MRTOPSTEP E-BOOK; RULES OF THE ROAD Getting Started Trading Rules 101 Trading Rules 101 is a combination of patterns and observations from the trading floors of the Chicago Board of Trade and the Chicago
SAIF-2011 Report. Rami Reddy, SOA, UW_P
 1) Title: Market Efficiency Test of Lean Hog Futures prices using Inter-Day Technical Trading Rules 2) Abstract: We investigated the effectiveness of most popular technical trading rules on the closing
An Unconventional View of Trading Volume
 An Unconventional View of Trading Volume With all the talk about the decline in trading volume (over 30% on a year- over- year basis for most of the third quarter) you would think that no one is playing
AbleTrend. Why Haven t Investors Been Told These Facts? Look inside to discover: Buyers. Call Free (888) 272-1688 www.ablesys.
 272-1688 www.ablesys.") Trading Software Buyers GuiDe Autumn 2013 $9 1997-2013 For Stocks Futures FOREX & Options Look inside to discover: Are you depending on the news and commentaries to make your investment decisions? Then
Trading Software Buyers GuiDe Autumn 2013 $9 1997-2013 For Stocks Futures FOREX & Options Look inside to discover: Are you depending on the news and commentaries to make your investment decisions? Then
Highly Active Manual FX Trading Strategy. 1.Used indicators. 2. Theory. 2.1. Standard deviation (stddev Indicator - standard MetaTrader 4 Indicator)
") Highly Active Manual FX Trading Strategy This strategy based on a mixture of two styles of trading: forex scalping, trend following short-term strategy. You can use it for any currency. Timeframe M15.
Highly Active Manual FX Trading Strategy This strategy based on a mixture of two styles of trading: forex scalping, trend following short-term strategy. You can use it for any currency. Timeframe M15.
Active Trend Trading System
 Active Trend Trading System Candle Light Trader: Dennis W. Wilborn A Trend Should Be Assumed to Continue in Effect Until Such Time as Its Reversal Has Been Definitely Signaled Edwards & Magee Disclaimer
CURRENCY TRADING Using Swing Breakouts in Forex Trading
 CURRENCY TRADING Using Swing Breakouts in Forex Trading 28 MAY 2009 Doug Schaff discusses the use of intermediate swing highs and swing lows to develop a shortterm approach to trading the currency markets.
Definitions to Basic Technical Analysis Terms. www.recognia.com
 Definitions to Basic Technical Analysis Terms www.recognia.com A Alert An alert is a notification sent when a significant event occurs in one or more investments of importance to a trader. Recognia sends
COMMODITY SPREAD TRADING
 COMMODITY SPREAD TRADING discretionary commodity trading in different and profitable way Romana Křížová CEO, TradeandFinance.eu, s.r.o. 1 What is Spread? Often used term Used in different contexts represents
Foreign Exchange Trading Managers
 Foreign Exchange Trading Managers Quantum Leap Capital (abbreviated as QLC ) is a Forex Trading Manager which focuses on trading worldwide foreign currencies on behalf of institutions, corporates and individual
I Really Trade. Trading Patterns for Stocks & Commodities. Introducing The False Break Buy and Sell Pattern
 2008 Trading Patterns for Stocks & Commodities It doesn t matter if you are a longterm investor, short swing trader or day trader, you are always looking for an advantageous spot to enter your position.
ATTITUDE TO RISK. In this module we take a look at risk management and its importance. MODULE 5 INTRODUCTION PROGRAMME NOVEMBER 2012, EDITION 18
 INTRODUCTION PROGRAMME MODULE 5 ATTITUDE TO RISK In this module we take a look at risk management and its importance. NOVEMBER 2012, EDITION 18 CONTENTS 3 6 RISK MANAGEMENT 2 In the previous module we
27PercentWeekly. By Ryan Jones. Part II in the Series Start Small and Retire Early Trading Weekly Options
 By Ryan Jones Part II in the Series Start Small and Retire Early Trading Weekly Options Important My 27% Option Strategy is one of the best option trading opportunities you will come across. When you see
Stock Market Dashboard Back-Test October 29, 1998 March 29, 2010 Revised 2010 Leslie N. Masonson
 Stock Market Dashboard Back-Test October 29, 1998 March 29, 2010 Revised 2010 Leslie N. Masonson My objective in writing Buy DON T Hold was to provide investors with a better alternative than the buy-and-hold
Binary Options Trading Strategy. Professional Binary Trading Manual Strategy
 Binary Options Trading Strategy Professional Binary Trading Manual Strategy U.S. Government Required Disclaimer - Commodity Futures Trading Commission Futures and Options trading has large potential rewards,
Trading System: BatFink Daily Range (A) Investment Market: Forex
 Investment Market: Forex") 1. Level Trading System: BatFink Daily Range (A) Investment Market: Forex Daily-Range trading technique used to capitalise on high daily range price moving pairs Author MarkJ Related Thread Reference Version
1. Level Trading System: BatFink Daily Range (A) Investment Market: Forex Daily-Range trading technique used to capitalise on high daily range price moving pairs Author MarkJ Related Thread Reference Version
Exchange-Traded Funds
 Exchange-Traded Funds Exchange Traded Funds (ETF s) are becoming popular investment vehicles for many investors. Most ETF s are cost effective, broad market funds. We have put together a layman s explanation
FxPro Education. Automated trading
 FxPro Education More than a quarter of trades with FxPro are executed automatically by computer programs. These types of trades are known by many terms, including expert advisors, algos and robots. Many
Using Historical Probabilities to Trade the Opening Gap
 Using Historical Probabilities to Trade the Opening Gap Scott Andrews Hosted by Hamzei Analytics November 10, 2010 Disclaimer This material is intended for educational purposes only and is believed to
ALFA FINANCIAL L.L.C. Licensed and Regulated by the Central Bank of the U.A.E.
 ALFA FINANCIAL L.L.C Licensed and Regulated by the Central Bank of the U.A.E. Making a world of trading opportunities accessible to you ALFA Financial L.L.C was set up to give portfolio, how to control
Annuity Linked TVI Index. Explained
 Annuity Linked TVI Index Explained 1 Key Features of the Annuity Linked TVI Index The Index aims to deliver positive returns while moderating volatility regardless of market direction. The Index goal is
TRADING MECHANISM FOR DYNAMIC STP & DYNAMIC FIXED SPREAD TRADING ACCOUNTS Contents
 WINDSOR BROKERS LTD Ref:42342 TRADING MECHANISM FOR DYNAMIC STP & DYNAMIC FIXED SPREAD TRADING ACCOUNTS Contents 1. Purpose and Scope 2. Definitions and Interpretations 3. Financial Instruments offered
A Primer On Technical Analysis. Written by. Available at
 A Primer On Technical Analysis Written by Available at Page 1 of 23 Overview Technical Analysis (Versus Fundamental Analysis) Technical analysis is a method of forecasting price movements by looking at
Outright Long/Short Speculation: Next time you are at a party and someone asks what you do for a living, tell them
 Page 1 Next time you are at a party and someone asks what you do for a living, tell them you are a commodity trader. You are likely to get a look back that conveys a sense of - that sounds impressive,
BackTestWizard.com. Simple Trading Plan Template. Please feel free to share this document.
 BackTestWizard.com Simple Trading Plan Template Please feel free to share this document. For advanced trading strategies, risk management rules and tips for improving your trading psychology Please purchase
Reading: Chapter 19. 7. Swaps
 Reading: Chapter 19 Chap. 19. Commodities and Financial Futures 1. The mechanics of investing in futures 2. Leverage 3. Hedging 4. The selection of commodity futures contracts 5. The pricing of futures
Trading Intra-Day is All About Finding an Edge (May 2008)
") Trading Intra-Day is All About Finding an Edge (May 2008) Trading intra-day is exactly what it sounds like. It s sitting in front of a computer during the trading day and making a lot of trades for small
Trading Intra-Day is All About Finding an Edge (May 2008) Trading intra-day is exactly what it sounds like. It s sitting in front of a computer during the trading day and making a lot of trades for small
W.D. Gann's Techniques of Analysis and Trading
 A Summary of W.D. Gann's Techniques of Analysis and Trading Psychological Framework Master yourself Do not overtrade See if your trade is based on hope or logic and systems developed by you Trading strategies
Money Math for Teens. Dividend-Paying Stocks
 Money Math for Teens Dividend-Paying Stocks This Money Math for Teens lesson is part of a series created by Generation Money, a multimedia financial literacy initiative of the FINRA Investor Education
FOREX analysing made easy
 FOREX analysing made easy UNDERSTANDING TECHNICAL ANALYSIS An educational tool by Blackwell Global Contents Technical Analysis 2 Line Chart 3 Bar Chart 4 Candlestick Chart 5 Support and Resistance 6 Fibonacci
Introduction, Forwards and Futures
 Introduction, Forwards and Futures Liuren Wu Zicklin School of Business, Baruch College Fall, 2007 (Hull chapters: 1,2,3,5) Liuren Wu Introduction, Forwards & Futures Option Pricing, Fall, 2007 1 / 35
Pairs Trading STRATEGIES
 Pairs Trading Pairs trading refers to opposite positions in two different stocks or indices, that is, a long (bullish) position in one stock and another short (bearish) position in another stock. The objective
Understanding Managed Futures
 Understanding Managed Futures February 2009 Introduction Managed futures have proven their strengths as an investment since the first funds were launched in the early 1970s. For over more than 30 years,
Trend Determination - a Quick, Accurate, & Effective Methodology
 Trend Determination - a Quick, Accurate, & Effective Methodology By; John Hayden Over the years, friends who are traders have often asked me how I can quickly determine a trend when looking at a chart.
SHADOWTRADERPRO FX TRADER USERS GUIDE
 SHADOWTRADERPRO FX TRADER USERS GUIDE How to get maximum value from your ShadowTraderPro FX Trader subscription. ShadowTraderPro FX Trader delivers value to its subscribers on multiple levels. The newsletter
Trader's Guide to Building An Effective Trading Strategy
 FIA Futures & Options Expo 05 Trader's Guide to Building An Effective Trading Strategy November 10, 2005 Chicago, IL Prepared and Presented by Daniel Gramza 1 Materials in this presentation are covered
Evolution of Forex the Active Trader s Market
 Evolution of Forex the Active Trader s Market The practice of trading currencies online has increased threefold from 2002 to 2005, and the growth curve is expected to continue. Forex, an abbreviation for
22Most Common. Mistakes You Must Avoid When Investing in Stocks! FREE e-book
 22Most Common Mistakes You Must Avoid When Investing in s Keep the cost of your learning curve down Respect fundamental principles of successful investors. You Must Avoid When Investing in s Mistake No.
Stock Breakout Profits Strategy
 Stock Breakout Profits Strategy Introduction Welcome and thank you for downloading the Stock Breakout Profits system. The Stock Breakout Profits is a complete trading strategy for trading not only the
Table of contents. 1. About the platform 3. 2. MetaTrader 4 platform Installation 4. 3. Logging in 5 - Common log in problems 5
 Table of contents 1. About the platform 3 2. MetaTrader 4 platform Installation 4 3. Logging in 5 - Common log in problems 5 4. How to change your password 6 5. User Interface and Customization 7 - Toolbars
Commodities not finding much traction despite USD weakness
 Commodities not finding much traction despite USD weakness Commodities continued to show weakness into the second week of 2013 despite rising stock markets and a falling US dollar. Investors are generally
Fine-Tuning Your Money Management System
 Avoid The Risk Of Ruin Fine-Tuning Your Money Management System Acknowledge the risks in trading the markets by making sure your money management system is sound. hen you hear of someone making a huge
Contents Risk Disclaimer... 3 Introduction... 4 Choosing the Right Broker... 4 The Financial Markets... 5 The Forex Market...
 Contents Risk Disclaimer... 3 Introduction... 4 Choosing the Right Broker... 4 The Financial Markets... 5 The Forex Market... 6 Trading methodologies... 7 Developing a trading strategy... 8 Risk Management...
How To Trade An Exchange Traded Fund
 How To Trade Market Sector ETFs, and Beat The Market by 17x! If you watched the first video, then you know In many ways, ETFs are more powerful than. Stocks Futures And even options! The most obvious reasons
BONUS REPORT#5. The Sell-Write Strategy
 BONUS REPORT#5 The Sell-Write Strategy 1 The Sell-Write or Covered Put Strategy Many investors and traders would assume that the covered put or sellwrite strategy is the opposite strategy of the covered