Malaysia International Biology Symposium 2019 (i-simbiomas 2019)
|
|
|
- Paulina Hicks
- 4 years ago
- Views:
Transcription

1
2 Malaysia International Biology Symposium 2019 (i-simbiomas 2019) Utilization of Biodiversity for the Greater Benefit of Mankind Edited by: Rosimah Nulit, Hishamuddin Omar, Yap Chee Kong and Mohd Noor Hisham Mohd Nadzir Department of Biology, Faculty of Science Universiti Putra Malaysia Serdang, Selangor Malaysia UPM Press Universiti Putra Malaysia Serdang, Selangor Malaysia i

3 Hak Cipta Universiti Putra Malaysia/ Copyright Universiti Putra Malaysia, 2020 Universiti Putra Malaysia Hak cipta terpelihara Tiada bahagian daripada buku ini boleh diterbitkan semula, disimpan untuk pengeluaran atau ditukarkan ke dalam sebarang bentuk atau dengan sebarang alat, sama ada dengan cara elektonik, gambar serta rakaman dan sebagainya tanpa kebenaran bertulis daripada Penerbit UPM terlebih dahulu All right reserved No part of this publication may be reproduced or transmitted in any form or by any means, electronic or mechanical including photocopy, recording, or any information storage and retrieval system, without permission in writing from Dept. of Biology, Faculty of Science, UPM. Diterbitkan di Malaysia oleh/published in Malaysia by: Jabatan Biologi, Fakulti Sains Universiti Putra Malaysia UPM, Serdang Selangor Hakcipta terpelihara: Perpustakaan Negara Malaysia Data pengkatalogan-dalam- Penerbitan Utilization of biodiversity for the greater benefit of mankind Editor: Rosimah Nulit, Hishamuddin Omar, Yap Chee Kong, Mohd Noor Hisham Mohd Nadzir eisbn ii
4 PREFACE This book is a compilation of research papers which had been successfully presented at the Malaysia International Biology Symposium 2019 (i-simbiomas 2019). The symposium had been organized by the Department of Biology, Faculty of Science, Universiti Putra Malaysia on August 23-24, Twenty-four manuscripts had been received from participants and were categorized into three subfields in biological sciences. Chapter 1 presented the multidisciplinary fields in Ecology, Chapter 2 contained studies on Animal Physiology, and Chapter 3 presented research works on Plant Physiology. Last but not least, we are thankful to the huge support by all authors by supporting us in every step of our journey towards the success completion of this book. It is hoped that the book will benefit a lot of people including academic scientists, research students, industry researchers, and the public. Thank you. THE EDITORIAL TEAM iii
5 CONTENTS PREFACE iii CHAPTER 1: ECOLOGY 1.1 Conflict between the ecological impacts and socio-economic gains of alien fishes: a sustainability concern 1.2 Prediction 2035 of the landscape changes in Central Forest Spine 2, Peninsular Malaysia 1.3 Stomach content of tiny scale barb, Thynnichthys thynnoides at Perak River, Malaysia 1.4 Nest selection by female Baya Weaver Ploceus philippinus based on nest architecture in Selangor, Malaysia 1.5 Distribution of mosquitoes in selected areas in Universiti Putra Malaysia emphasis on Aedes sp. 1.6 Knowledge and awareness level of local community towards wildlife trade of Sumatran serow and Malayan porcupine in Perak, Malaysia 1.7 Spatial climatic heterogeneity on the occurrence of terrestrial birds in Peninsular Malaysia 1.8 Canonical correspondence analysis of freshwater algae in a North Lake of Ayer Hitam Forest Reserve, Puchong, Selangor 1.9 Toxicity effects of nanomaterial (Quantum dot) following sub-acute and sub-chronic exposure to zebrafish CHAPTER 2: ANIMAL PHYSIOLOGY 2.1 The effect of lactation number and lactation stage on the lactation of crossbred Sahiwal-Friesian cows in selected dairy cattle farm of Sabah 2.2 Evaluation of baseline diagnostic lethal concentration for adult Aedes albopictus in Kuantan, Pahang iv
6 2.3 Physichochemical properties of Khaki Campbell, Muscovy and Pekin duck feet gelatin extracted with acetic acid 2.4 Physicochemical properties of duck (Khaki Campbell) skin gelatin pre-treated with acetic acid and citric acid 2.5 Calcium and phosphorus requirements of female Ayam Kampung MARDI (AKM) in pullet phases 2.6 An assessment of reproductive and stress hormone and their relation with reproductive behaviour of captive female Rusa unicolor (Sambar deer) 2.7 The effect of different concentration of livestock fertilizers on growth performances of Azolla pinnata 2.8 Feed intake, digestibility and growth performance of female goats fed feeding Napier grass supplemented with Gliricidia sepium 2.9 Divergent loci in natural populations of Gadus chalcogrammus, walleye Pollock 2.10 Behavioural and hormonal study of captive Sambar deer (Rusa unicolor) at Ladang 16, Universiti Putra Malaysia CHAPTER 3: PLANT PHYSIOLOGY 3.1Taxonomic value of stomatal complexes in Shorea Roxb. (Dipterocarpaceae) 3.2 Inhibitory effect of lemongrass (Cymbopogon citratus) leaves and stem extracts against Fusarium proliferatum pathogen isolated from banana fruit Nutritional values of fresh and roasted Sacha inchi kernel and its cake Preliminary study on antioxidant activity and total flavonoid content in four Malaysian lichens Isolation, growth and cellulose extraction of selected green algae 140 CONTRIBUTORS 146 v
7 CHAPTER 1: ECOLOGY 1.1 Conflict between the ecological impacts and socio-economic gains of alien fishes: a sustainability concerns Introduction Abdulwakil Olawale Saba, Mohammad Noor Azmai Amal, Ismail Ahmad and Syaizwan Zahmir Zulkifli The world population is growing at an alarming rate making the need for increased f ood production indispensable (Singh, 2019). Countries of the world have engaged in the culture of certain introduced fish species due to their desirable characteristics (Diana, 2009). Some of these introduced species have helped to boost fish production in many folds thereby contributing to food security and economic development (Ellender and Weyl, 2014). Besides, other ones have been introduced through the aquarium industry and they also help to improve human well-being (CBD, 2010; Strecker et al., 2011). Apart from the Antarctic region which lacks information on invasive alien fishes, the highest number of alien fish species are attributed to north America with Australia having the lowest (Figure 1). Asian aquaculture, as with global aquaculture, is dependent to a significant extent on alien fish production (De Silva et al., 2009). Furthermore, in Brazil, alien fish contributed about $US 250 million for the year 2008 and this comprises more than half of the total value of freshwater fish aquaculture (Briton and Orsi, 2012). However, in many cases, cultured alien fish species may end up in local ecosystems where they threaten biodiversity. In fact, High levels of species extinction have occurred the world over due to loss of biodiversity and species invasion has been identified as one of the major causes (Reid et al., 2019). For freshwater ecosystems, this has been linked with dwindling fish productivity (Chong et al., 2010). In fact, about 37% and 49% of all introduced fish species in South Africa and Okinawajima Island, China are known to have fully established breeding populations, respectively (Ellender and Weyl, 2014; Ishikawa and Tachihara, 2014). Although some other challenges to ecosystems biodiversity and health which can also facilitate invasion have been identified and these include habitat degradation, over-exploitation, pollution, endemism and anthropogenic factors (Chong et al., 2010), the impacts of invasive or potentially invasive fish species should not be underestimated. Amidst this conflict, sustainability is essential to help generate maximum benefits and minimal impacts on the ecosystem (Cucherousset and Olden, 2011). Assessing the impacts of alien fish species Perception of Invasive Alien Fish (IAF) impacts is influenced by the viewpoint which may be ecocentric or anthropocentric. The latter will attach value to an improvement in human welfare which emanates from IAF. This, however, would be viewed as counter 1
 since it")
, aquarium trade, sport fishing, and biological control (Esmaeili et")
8 ecological by the more ecocentric opinion (Vellend et al., 2007). Any assessment of alien fish species should consider all the advantages and disadvantages of the species in longitudinal and time-based scales (Bartley and Casal, 1998; Leal-Flórez, 2007) since it would facilitate the cause of sustainability. Alien fishes are, for the most part, intentionally introduced for reasons including aquaculture, fisheries improvement (stocking), aquarium trade, sport fishing, and biological control (Esmaeili et al., 2014; Chong et al., 2010; Khairul-Adha et al., 2013). These introductions have produced several benefits from reducing the pressure on wild stocks, to income and employment generation (Aqmal-naser and Ahmad, 2019; Diana, 2009). As time goes on, some of these beneficial alien fishes somehow get into the local waters (Salam and Gopinath, 2006; Chong et al., 2010) where they run riots by predating on, competing with, and probably altering the ecosystem or wiping out the native species. Monitoring fish invasion Introduction (intentional or unintentional) of alien fish species for various reasons paves the way for invasion in a gradual process which may go unnoticed at the early stages. For introduced fish species to invade, they go through about five stages (Figure 2). If the process is unchecked, they become more challenging and even impossible to eradicate as the stages culminate. Early detection of Invasive Alien Fishes (IAF) is the best approach so that eradication still has a chance (Kiruba-Sankar et al., 2018). In cases where invasion had finally occurred, opportunities to exploit the species and minimize their impact on the ecosystem and socio-economics should be sought. Early detection of Invasive Alien Fishes (IAF) is the best approach so that eradication still has a chance (Kiruba-Sankar et al., 2018). Figure 1: Number of invasive alien fish by species and families across the continents (Adapted from Sultana and Hashim, 2015) Figure 2: Stages of fish invasion with required measures (Modified from Gozlan et al., 2010; Kiruba-Sankar et al., 2018) 2
9 Striking a balance for sustainability Sustainability, with its environmental, social and economic components requires that the benefits and risks posed by existing and potential alien fish species be analysed to ascertain holistically the pros and cons of fish introduction into any new environment (Ellender and Weyl, 2014). In effect, proper monitoring and management measures should be intensified to minimize the possible negative impacts, maximize the positive impacts and ensure sustainability. Certification and monitoring systems should be put in place to ensure sustainable practices (Diana, 2009). In addition, merits should be weighed against demerits in the short, medium and long terms. Conclusion Despite identifying huge ecological impacts of alien fish species in some cases, analysis of the socio-economic dynamics of alien fishes for present and the future pains and gains should be carried out. For local management to be effective, more appropriate native or less invasive candidates should be researched and promoted for use in aquaculture after adequate risk assessment and relevant policies are put in place. These should be monitored and communicated on a regular basis to ensure the participation of all stakeholders. Acknowledgement This study was financially supported by Ministry of Education, Malaysia under the Fundamental Research Grant Scheme (FRGS/1/2018/STG03/UPM/02/11). References Aqmal-naser, M, and Ahmad, A (2019) Introduction of alien fishes in the ricce agroecosystem in Seberang Perai Tengah, Pulau Pinang, Malaysia: A conflict between economical and ecological importances. Fishmail, 26, 1-7. Bartley, D and Casal, CV (1998) Impacts of introductions on the conservation and sustainable use of aquatic biodiversity. FAO Aquaculture Newsletter, pp Britton, J and Orsi, ML (2012) Non-native fish in aquaculture and sport fishing in Brazil: economic benefits versus risks to fish diversity in the upper River Parana Basin. Reviews in Fish Biology and Fisheries, 22, Cucherousset, J and Olden, JD (2011) Feature: Introduced Fish and Ecology Ecological Impacts of Non-native Freshwater Fishes. Fisheries Bethesda, 36(5), De Silva, SS, Nguyen, TTT, Turchini, GM, Amarasinghe, US, and Abery, NW (2009) Alien Species in Aquaculture and Biodiversity: A Paradox in Food Production. AMBIO: A Journal of the Human Environment, 38(1), Diana, JS (2009) Aquaculture production and biodiversity conservation. Bioscience, 59(10),
10 Ellender, BR and Weyl, OL (2014) A review of current knowledge, risk and ecological impacts associated with non-native freshwater fish introductions in South Africa. Aquatic Invasions, 9(2), Esmaeili, H R, Teimori, A, Owfi, F, Abbasi, K, and Coad, B W (2014) Alien and invasive freshwater fish species in Iran : Diversity, environmental impacts and management. Iranian Journal of Ichthyology, 1, Gozlan, RE, Britton, JR, Cowx, I and Copp, GH (2010) Current knowledge on non-native freshwater fish introductions. Journal of Fish Biology, 76(4), Henriksson, PJG, Belton, B, Murshed-e-Jahan, K and Rico, A (2018) Measuring the potential for sustainable intensification of aquaculture in Bangladesh using life cycle assessment. Proceedings of the National Academy of Sciences, 115(12), Khairul-Adha, R, Yuzine, E, and Aziz, A (2013) The Influence of Alien Fish Species on Native Fish Community Structure in Malaysian Waters. Kuroshio Science, 7, Kiruba-Sankar, R, Raj, JP, Saravanan, K, Kumar, KL, Angel, JRJ, Velmurugan, A and Roy, SD (2018) Invasive Species in Freshwater Ecosystems Threats to Ecosystem Services. In Biodiversity and Climate Change Adaptation in Tropical Islands (pp ). Academic Press. Leal-Flórez, J (2007) Impacts of Non-Native Fishes on The Fish Community and The Fishery of The Ciénaga Grande De Santa Marta Estuary, Northern Colombia. Universitat Bremen. Reid, AJ, Carlson, AK, Creed, IF, Eliason, EJ, Gell, PA, Johnson, PT, Kidd, KA, MacCormack, TJ, Olden, JD, Ormerod, SJ and Smol, JP (2019) Emerging threats and persistent conservation challenges for freshwater biodiversity. Biological Reviews, 94(3), Singh, SN (2019) Population Growths and Socio-Economic Development: An Analysis of Mettu Town of Ethiopia. SocioEconomic Challenges, 3(1), Sultana, M and Hashim, ZH (2015) Invasive Alien Fish Species in Freshwater of the Continents. Journal of Environmental Science and Natural Resources, 8(2), Vellend, M, Harmon, LJ Lockwood, JL, Mayfield, M.M., Hughes, AR, Wares, JP and Sax, DF (2007) Effects of exotic species on evolutionary diversification. Trends in Ecology & Evolution, 22(9), Ishikawa, T and Tachihara, K (2014) Introduction history of non-native freshwater fish in Okinawa-jima Island: ornamental aquarium fish pose the greatest risk for future invasions. Ichthyological Research, 61(1),
11 1.2 Prediction 2035 of the landscape changes in Central Forest Spine 2, Peninsular Malaysia Saiful Arif Abdullah, Amal Najihah Muhamad Nor and Nur Hairunnisa Rafaai Introduction In peninsular Malaysia, land use planning significantly influenced the ecological landscape of wildlife habitats, mainly forested areas. A wide variety of modelling approaches have been tested to simulate land use changes (Nor et al., 2017a); however, the effectiveness of simulations of the spatial structure of land use change in the forest area remains unexplored. This study aims to model and predict landscape changes in the Central Forest Spine 2 (CFS2) area which cover the southern part of peninsular Malaysia and to identify which are the main drivers, including spatial planning, in the resulting spatial changes. Materials and methods This study focused on the Central Forest Spine 2 (CFS2) area in the state of Pahang which cover the southern part of peninsular Malaysia. The geo-coded Landsat ETM+ 30 m resolution images of the year 1988, 1996, 2005 and 2017 were processed using ERDAS Imagine software to develop the land use map. After the raster land use maps were converted to vector form using ArcGIS 9.3 (ESRI, New York Street, Redlands, CA, USA), Land Change Modeler (LCM)-Markov Chain models were used, parameterised on changes observed between 1988 and 1996 and verified with the land use form observed for These models were then used to simulate land use change for the yea r The spatial changes of the simulated 2035 land use were then compared with land use area in 1988, 1996 and 2017 using ArcGis. Results and discussion In this study, the 80% percentage of agreement and persistence showed that the LCM model verification for 2015 was reliable and therefore, the model is appropriate for predicting future transitions. Differences between the modelled spatial changes and that observed in 2014 supplied evidence for successful planning interventions. Previous research shows that data generated using LCM is more accurate when the per transition susceptibilities are combined to compose an overall potential change map because neural network outputs can express the simultaneous potential change for various LULC types more adequately than the individual probabilities obtained (Pérez-Vega et al., 2012; Triantakonstantis et al., 2015). These predictive capacities allow models to be useful tools for local stakeholders involved in urban change decision making. The results from these models obtained in this study would suggest that a verified LCM- Markov Chain model is a useful tool to simulate future urban expansion. 5
 1988, b) 1996 c) 2017 d) 2035. 6")
12 a) b) Legend Built-up area Cleared land Commercial agriculture Forest Other agriculture Waterbody Wetland c) d) Kilometers Figure 1: Land use land cover distribution in Pahang in a) 1988, b) 1996 c) 2017 d)
13 Figure 2: The area proportion (%) of land use distribution in Pahang in 1988, 1996, 2017 and Over the 29 years, Pahang has experienced a decrease in green space and an increase in the built-up area (Fig. 1 and 2). The predictions indicate a further increase in a built-up area and decrease in green space by 2035 (Fig. 1 and 2). The results further suggest that built-up area expansion and the location of the variables affecting the model outputs are the significant drivers of green space change. The projected Markov Chain conditional probability matrices for 2035 revealed that the growth of built-up areas in this area showed a multidirectional urban expansion growth pattern, tending to occur in areas of better road accessibility, near the green space edge, on higher elevations and steep slopes where there is a low risk of flooding. These results agree with the findings of other studies, in which the distance from main roads is linked to the degree of landscape changes (Mishra et al., 2014; Nor et al., 2017a; Nor et al., 2019). The combined fragmentation and barrier effects of road networks considerably degrade landscape connectivity and ecological processes in the landscape (Nor et al., 2017b, Nor et al., 2018). Inherently, green space edge has a high probability of being decreased and in the results from this study show that development changes tend to start from the edge of existing green space. Evidence suggests that these spatial changes are influenced by the forms of land use activities experienced in the study area, the historical spatial changes, and uncontrolled land use activities. Conclusion LCM-Markov Chain was proven to be suitable for simulation of the future Central Forest Spine 2 area. Human land use activities affect the landscape change, has experienced green area loss over the study period. The planning authorities could design interventions which support planning at the landscape level. This study is designed to 7
14 provide the novel integrated approach for predicting landscape changes for the forest area to provide the initial guideline for sustainable conservation planning of wildlife habitat CFS2 area. Acknowledgement Special thanks to Universiti Kebangsaan Malaysia for providing the facilities and support for this research. This study is part of the awarded grant Geran Galakan Penyelidikan UKM (GGP ). References Mishra, V. N., Rai, P. K., & Mohan, K. (2014). Prediction of land use changes based on land change modeler (LCM) using remote sensing: a case study of Muzaffarpur (Bihar), India. Journal of the Geographical Institute" Jovan Cvijic", SASA, 64(1), Nor, A. N. M., Corstanje, R., Harris, J. A., Grafius, D. R., & Siriwardena, G. M. (2017a). Ecological connectivity networks in rapidly expanding cities. Heliyon, 3(6), e Nor, A. N. M., Corstanje, R., Harris, J. A., & Brewer, T. (2017b). Impact of rapid urban expansion on green space structure. Ecological Indicators, 81, Nor, A. N. M., Isnorm, R. A., Abas, M. A., Malek, N. H. A., Hassin, N. H., Aziz, H. A., & Rafaai, N. H. (2018). Landscape Ecological Assessment of Potential Ecotourism in Malaysia. Technology, 9(10), Nor, A. N. M., & Abdullah, S. A. (2019). Developing Urban Green Space Classification System Using Multi-Criteria: The Case of Kuala Lumpur City, Malaysia. Journal of Landscape Ecology, 12(1), Pérez-Vega, A., Mas, J.F., Ligmann-Zielinska, A. (2012). Comparing two approaches to land use/cover change modelling and their implications for the assessment of biodiversity loss in a deciduous tropical forest. Environ. Modell. Software. 29 (1), Triantakonstantis, D., Stathakis, D., Area, A.S., (2015). Urban growth prediction in Athens, Greece. Using Artificial Neural Networks 9 (3),
15 1.3 Stomach content of tiny scale barb, Thynnichthys thynnoides at Perak River, Malaysia Siti Nursyakinah Muhamad, Mohd Yusoff Ishak, Farhana Ahmad Affandi and Kartina Lakuli Introduction Habitat loss or modification, overfishing, deforestation are factors that threatened most of freshwater fish. According to Ismail et al. (2015) proper management are needed to ensure the sustainability since freshwater fish like Thynnychthys thynnoides are being harvest in large amount annually. In fact, the fish is targeted as it is the main ingredients for traditional fermented dish called pekasam that can be produce up to 12 tonnes annually (Dolasoh, 2017). Management efforts such as the availability of feeding habits data are one of the information basis towards this efforts since there is a limited information available about T. thynnoides feeding habit in Malaysia. Studies on fish feeding habit are important to identify the trophic relationship in aquatic ecosystem, identifying feeding composition, structure and stability of food webs. Therefore, this study aims to determine the composition of stomach content of T. thynnoides at Perak River and to compare the stomach contents between different body sizes. Materials and methods The study was conducted at Chenderoh Reservoir (05 01 to N and to E) which is located at the middle part of Perak River basin. Total of 30 fish samples were collected from the local fisherman at the sampling site. The total length a nd weight were measured and recorded. The fish sample was then injected with 10% formalin into the gut area till bloated to prevent further digestion of prey. Fish samples were kept in icebox and transported back to the laboratory in Faculty of Environmental Studies, Universiti Putra Malaysia. The gut contents analysis was done following the laboratory procedure by Gelwick and McIntyre (2017) and Manko (2016) and the gut contents were identified following Lokman (1990). Results and discussion Total of 63 food items were detected in T. thynnoides (Table 3) namely phytoplankton, plants, insects, detritus and some unidentified items. Results showed that T. thynnoides mainly fed on phytoplankton which was present the highest, 54% of the stomach contents in total of 30 samples. There were only three phytoplankton family recorded which is Bacillariophyceae, Chlorophyceae and Chrysophyceae. Similar result were found by Ananda et al., (2015) where phytoplankton Cyanophyceae is the highest phytoplankton 9
16 consumed by T. thynnoides compared to other food items. Previous study by Rainboth (1996) also reported that T. thynnoides in Mekong River, Cambodia mostly fed on periphyton, algae, phytoplankton, and small zooplankton. In fact most freshwater and marine organism depend on phytoplankton which serves as a base for the aquatic food chain (Begon et al., 2007). This result corresponds with the abundance distribution families of phytoplankton in Perak River (Nursuhayati et al., 2013). The study stated that there were six main family of phytoplankton in Perak estuary namely Bacillariophyceae (diatoms), Chlorophyceae (green algae), Cyanobacteria (blue-green algae), Chrysophyceae (golden-brown algae) Euglenophyceae (euglenoids) and Pyrophyceae (dinoflagellates). Table 3: Stomach content of Thynnichthys thynnoides Type of food Percentage of food items (%) Phytoplankton: Bacillariophyceae 30 Chlorophyceae 19 Chrysophyceae 5 Plants 16 Insects 13 Detritus 8 Unidentified items 9 Figure 2: Stomach contents in different body size of T. thynnoides. 10
17 Figure 2 shows the percentage of stomach contents in different body size of T. thynnoides. Overall, all three categorized body size of T. thynnoides mostly fed on phytoplankton particularly Bacillariophyceae compared to other food items such as plants, insects, detritus and unidentified items. There is no significant different in trend of percentage between stomach content for each food items recorded among different body sizes of T. thynnoides. However, percentages of food items were observed decreasing with body size of T. thynnoides from small ( cm) to medium ( cm) and to large ( 24.1cm). Result shows that trends percentage of Bacillariophyceae were decreasing from small, medium and to large body sizes which were 39%, 28% to 25%, respectively. On the other hands, increasing trends percentage of plants fed increasing with body size from small, medium to large which were 11%, 14% and 25%, respectively. The trends showed an opposite result where the percentage of food item consumed increasing with body size. Therefore, it can be concluded that there is a difference between stomach content analysis among different body size of T. thynnoides. According to Schafer et al., (2002) the largest fish feeds more on teleost than those of smallest fish which feeds more on small zooplankton. Similar cases were also recorded by several studies where the increasing size of prey was increasing with the body size (Jennings et al., 2002; Platell et al., 2007; Park et al., 2017). Conclusion The tiny scale barb, Thynnichthys thynnoides at Perak River can be classified as a phytoplankton feeder since the phytoplankton was the primary food items consumed by the fish. Studies on natural food and feeding habits of fish is a subject of continuous research as it constituted the basis for development of a successful fisheries management plan on fish conservation and protection. Acknowledgement This study was funded by the Fundamental Research Grant Scheme (No: ) awarded by Ministry of Higher Education Malaysia (MOHE). The authors would like to acknowledge Mohammad Noor Amal Azmai and Intan Faraha A. Ghani for their advice and technical assistance from the locals during sampling. References Ananda, K., Putra, R. M., & Efizon, D. (2017). Stomach Content Analysis of Thynnichthys thynnoides from the Pinang Luar Oxbow Lake, Buluhcina Village, Siak Hulu Subdistrict, Kampar Regency, Riau Province. Jurnal Online Mahasiswa (JOM) Bidang Perikanan dan Ilmu Kelautan, 4(1),
18 Dolasoh, D. J. (2017, November 17). Teknologi terkini proses ikan pekasam. Harian Metro. Retrieved from Gelwick, F. P., & McIntyre, P. B. (2017). Trophic relations of stream fishes. In Methods in Stream Ecology, Volume 1 (pp ). Academic Press. Ismail, A., Azmai, M. N. A., Hassan, M. A., & Rahman, F. (2015). Notes on the tiny scale barb, Thynnichthys thynnoides Bleeker 1852 migration activity in Sungai Perak, Perak, Malaysia. Malayan Nature Journal, 67(3), Jennings, S., Pinnegar, J. K., Polunin, N. V., & Warr, K. J. (2002). Linking size-based and trophic analyses of benthic community structure. Marine Ecology Progress Series, 226, Lokman, S. (1990). Diatom Marin di Perairan Malaysia. Dewan Bahasa dan Pustaka, Kuala Lumpur. Manko, P. (2016). Stomach content analysis in freshwater fish feeding ecology. University of Prešov, 116. Nursuhayati, A. S., Yusoff, F. M., & Shariff, M. (2013). Spatial and temporal distribution of phytoplankton in Perak estuary, Malaysia, during monsoon season. Journal Fish Aquatic Science, 8(4), 480. Park, J. M., Kwak, S. N., Huh, S. H., & Han, I. S. (2017). Diets and niche overlap among nine co-occurring demersal fishes in the southern continental shelf of East Japan Sea, Korea. Deep Sea Research Part II: Topical Studies in Oceanography, 143, Platell, M. E., Ang, H. P., Hesp, S. A., & Potter, I. C. (2007). Comparisons between the influences of habitat, body size and season on the dietary composition of the sparid Acanthopagrus latus in a large marine embayment. Estuarine, Coastal and Shelf Science, 72(4), Rainboth, W. J. (1996). Fishes of the cambodian Mekong. Food and Agriculture Organisation, Rome. Schafer, L. N., Platell, M. E., Valesini, F. J., & Potter, I. C. (2002). Comparisons between the influence of habitat type, season and body size on the dietary compositions of fish species in nearshore marine waters. Journal of Experimental Marine Biology and Ecology, 278(1),
19 1.4 Nest selection by female Baya Weaver Ploceus philippinus based on nest architecture in Selangor, Malaysia Thiruvinothini Thiruvenggadam, Marina Mohd. Mohd. Tah, Chong Leong Puan and Rosimah Nulit Introduction The Baya Weaver Ploceus philippinus is a member of the Ploceidae family found across South and Southeast Asia. Baya Weavers are gregarious birds that roost communally throughout the year. These birds are distributed from India, Sri Lanka to South China and some parts of Southeast Asia such as Peninsular Malaysia, Singapore, Sumatra, Java and Bali (Davison and Yeap, 2012). Among five subspecies of Baya Weaver, three are known to inhabit Southeast Asia, and one subspecies, Ploceus philippinus infortunatus has been recorded in Malaysia (Howard, Moore and Dickinson, 2003). A unique feature of these birds is their large bell or oblique shaped nest that hangs from the edge of tree branches built by the males. Nest selection is vital with respect to reproduction of birds because it determines the survivability of the chicks (Asokan, Ali & Nagarajan 2008). Female Baya Weavers inspect nests built by males to ensure sufficient conditions are available for chicks growth (Mainwaring, Hartley, Lambrechts & Deeming, 2014). While some birds build nests by concealing the nests from eyes of predators, the nests of Baya Weavers are especially large and can be easily spotted. However, the nest structure does not exclude predatory possibilities. Hence, weavers build their nests higher from the ground to avoid terrestrial predators (Collias, 2016). Within the nest structure, there are different stages of the nests that are built by the male birds, namely the wad stage, the ring stage, helmet stage, and finally the completed nest with an entrance tube (Asokan, Ali, & Nagarajan, 2008). If a female accepts a helmet stage of the structure which is also known as the incomplete nest, the male and female birds will then complete the nest, and egg laying may follow immediately after the flow of the brood chamber has been woven (Quader, 2003). The indicator that a nest at a helmet stage has been abandoned or has not been chosen by female bird is when it is brown (Quader, 2005). Various aspects of the nest architectur e was chosen for this study in order to examine the nest structure that contributed to a female Baya Weaver s choice in nesting preference. Since the female s choice is based on the structure of the helmet stage nest, attributes pertaining to helmet stage nests were examined in order to determine the pertinent structure that led to female Baya Weaver s choice to complete the nest. Even though these local birds are protected under the country s Wildlife Conservation Act 2010, little study thus far has been conducted locally to 13


 and Quader (2005).")
20 understand the unique nest structure of Baya Weavers especially with respect to nest selection. This study aimed to identify the structures of a nest that are important for a female Baya Weaver s choice to complete the nest to commence reproduction. Materials and methods Study area The samplings were conducted in various locations in the Selangor state namely Universiti Putra Malaysia (Serdang), Bangi, and Puchong where colonies of Baya Weaver nests can be found. Data collection The sampling was carried out from August 2018 until April A study on Baya Weaver s nest architecture was conducted by measuring the following nest structures of both complete (Figure 1) and incomplete stages (Figure 2), i.e. suspension length (cm), brood chamber (cm), nest depth (cm) and height from ground (m). The parameter measurements were taken according to the methods by Quader (2006b) and Quader (2005). Figure 1: Nest structure of a Statistical complete nest Analysis (Quader, 2006b) Figure 2: Nest structure of an incomplete nest (Quader, 2005) One-way ANOVA test was performed using the SPSS software Windows version 23.0 to determine the differences in means of nest architecture variables measured between complete and incomplete nests (Ali, 2009). 14
21 Results and discussion A total of 30 complete nests and 12 incomplete nests from 12 colonies and 11 trees from Selangor were recorded. The average values of all variables are as presented in Tables 1. Table. 1: Mean values of measurements taken from complete and incomplete nests of Baya Weaver Nests Complete Nest N = 30 Incomplete Nests N=12 Suspension (cm) Nest Height (m) Brood Chamber (cm) Nest Depth (cm) Branch Diameter (cm) The one-way Analysis of Variance (ANOVA) showed that the suspension length and height of nests from ground showed no significant difference (p>0.05) between complete and incomplete nests. However, for brood chamber nest depth and branch thickness, the analysis showed a significant difference (p<0.05) between complete and incomplete nests. The size of brood chamber of all nests ranged from 7.0 to 15.6cm. As the average size of brood chamber in complete nests is higher than that in the incomplete nests (Tables 1), this implies that female Baya Weavers prefer a wider brood chamber which can be linked to the necessary internal climatic condition needed for incubation. As for nest depth, the range of nest depth for all nests was from 7.0 to 25.1cm. The significant difference in nest depths as well as the higher average nest depth among incomplete nests could be due to female Baya Weavers wanting a smaller nest as bigger and deeper nests are normally heavier and could easily fall down during strong winds or bad weather. The branch thickness for all nests ranged from 1.7 to 7.5cm. The significant difference in branch thickness b etween complete and incomplete nests showed that branch thickness plays a role in females nest selection as nesting success is known to increase with branch thickness (Achegawe, Chavan, Patil & Tarte, 2016). Thicker branches provide a sturdy support for the large hanging nests during strong winds and prevents the nest suspension from being torn off the branch. 15
22 The range of nest height from ground for all nests was from 1.1 to 4.5cm. Though the results showed that the differences in height of nest from the ground were non-significant between complete and incomplete nests, past studies showed that the nest height has increased nesting success which is directly associated with fledging success. This is because higher nests have lower risks of predation (Quader, 2006; Achegawe et al., 2016). In this study, it is possible that for both complete and incomplete nests, the factor pertaining to nest height may have been confounded as most nests were constructed at certain height, and that there might be other parameters that play a stronger role in nest selection by females. The range of suspension length for all nests was from 8.3 to 57.5cm. Similar to nest height, the same could be said for suspension, and that all male Baya Weavers are capable of building the nest suspension of equal quality which does not contribute to the female Baya Weaver s choice. Conclusion In conclusion, the nest structures that contribute to the female Baya Weaver s choice in nest selection includes brood chamber, nest depth and branch thickness. This study came by with limitations such as not being able to access all nests in a tree especially those being built at unreachable heights. Further study is required to determine other parameters such as nesting location and climatic conditions to better understand the nest choice of the Baya Weaver. Acknowledgements We would like to thank the University Agricultural Park of Universiti Putra Malaysia for the permission to conduct this research in the park. We also thank to all our friends and colleagues who were involved in this research. References Achegawe, R., Chavan, S., Patil, P., & Tarte, S. (2016). Nesting of Baya Weaver (Ploceus philippinus) in S. R. T. M. University, Nanded and Fields along Asana River at Nanded, Maharashtra, India. International Journal of Current Research and Academic Review, 4(6), doi: /ijcrar Ali, A.M.S. (2009). Studies on Nest-Site Selection and Prey Delivery Patterns to Nestlings by the Baya Weaver Ploceus philippinus (Aves: Passeriformes) in Tamil Nadu, South India. World Journal of Zoology, 4 (4), , Asokan S., Ali, A.M.S. and Nagarajan R. (2008). Studies on nest construction and nest microclimate of the Baya weaver, Ploceus philippinus (Linn.). Journal of Environmental Biology, 29(3),
23 Collias, N. (2016). Nest building and bird behavior. New Jersey: Princeton University Press. Crook, J. H. (1963). A comparative analysis of nest structure in the weaver birds (Ploceinae). Ibis, 105, Davison, G. and Yeap, C. (2012). A naturalist's guide to the birds of Malaysia. Oxford: John Beaufoy Pub. Howard, R., Moore, A. and Dickinson, E. (2003). The Howard and Moore complete checklist of the birds of the world. Princeton, N.J.: Princeton University Press. Mainwaring, M., Hartley, I., Lambrechts, M. and Deeming, D. (2014). The design and function of birds' nests. Ecology and Evolution, 4(20), Quader, S. (2003). Nesting and mating decisions and their consequences in the Baya Weaverbird (Ploceus philippinus). Ph.D. dissertation, University of Florida, Gainesville. Quader, S. (2005). Elaborate Nests in a Weaverbird: A Role for Female Choice? Ethology, 111(12), doi: /j x Quader, S. (2006a). Sequential settlement by nesting male and female Baya weaverbirds Ploceus philippinus: the role of monsoon winds. Journal of Avian Biology, 37(4), Quader, S. (2006b). What makes a good nest? Benefits of nest choice to female Baya Weavers (Ploceus philippinus). The Auk, 123(2),
24 Introduction 1.5 Distribution of mosquitoes in selected areas in Universiti Putra Malaysia emphasis on Aedes sp. Mohd Fariz Sharifuddin, Siti Nor Izani Mustapha, Hishamuddin Omar and Shamarina Shohaimi Dengue has created significant health and economic burden for individuals, societies and countries predominantly in tropical and subtropical regions. It is estimated that 390 million dengue infections and 96 million severe cases occur annually mainly among children (Bhatt et al., 2013). Dengue virus is transmitted through Aedes aegypti and Aedes albopictus (Gratz, 2004). Eradicating dengue vectors is the primary prevention and control measures to lower dengue infections in the absence of effective dengue vaccine (Chansang & Kittayapong, 2007). The World Health Organization (WHO) proposed entomological surveillance as part of global strategies for dengue prevention and control generally aimed at determining the density and geographical distribution of the vector and identifying the areas with high infestation density of vector (WHO, 2012). By knowing the species composition and the abundance of mosquitoes, it enables the assessment of disease risk to be performed well and provides guidance for the vector control operations (Bazin & Williams, 2018). Mosquito trap is a trap system based on odour and heat that is being used extensively as one of the vector surveillance components (Bazin & Williams, 2018; Chaiphongpachara, Bunyuen, & Khlaeo Chansukh, 2018). There are various raps available for use, however, in deciding the types of trap to be used, factors such as cost, effectiveness and portability should be taken into consideration (Bazin & Williams, 2018). Ovitrap is a sensitive, costeffective and passive trap used to sample the eggs and ovitrap that is modified with sticky surfaces can determine the presence of adult female (Mackay, Amador, & Barrera, 2013). A study performed by Hasnan et al. demonstrated that ovitrap is sensitive in detecting Aedes aegypti in Malaysia (Hasnan, Dom, Rosly, & Tiong, 2016). There is another sticky trap called MosquiTRAP designed specifically to capture gravid adult females for the purpo se of identification (Gama, Silva, Silva, Resende, & Eiras, 2007). In Brazil, a cluster analysis study reported that MosquiTRAP gave better results in signalling the risk of dengue transmission both temporally and geographically (de Melo, Scherrer, & Eiras, 2012). In addition, light trap and electric trap designed with light sources are now widely used to trap insects; however, their application has been limited due to the dependence of electric power. The use of light traps may be useful as most species of mosquitoes are night insects where their eyes are sensitive to light and are attracted to light sources (Warrant & Dacke, 2011). 18
25 In this study, we have developed a few mosquito traps and have identified the effectiveness of traps in measuring the abundance of mosquitoes. Furthermore, we have determined the composition of the mosquito distribution using the most effective trap at the selected residential and non-residential areas. Materials and methods Study areas Mosquito trap surveillance aimed to determine the distribution composition and mosquito species was conducted in the Universiti Putra Malaysia, Serdang campus, Selangor. Two types of study areas were selected within the campus: Serumpun College as residential area and Biology Department, Faculty of Science as non-residential area. In the present study, residential area refers to an area that provide facilities for people to live while nonresidential area is an area consist of office and educational buildings. Trap development Vector surveillance was employed using four types of modified mosquito trap: ovitrap, MosquiTRAP, light trap and electric trap. A disposable plastic bottle was cut into two parts and the bottom part was used to make an ovitrap (Figure 1a). The ovitrap then was covered with black plastic to maximize the capture ability since the adult females prefer to lay their eggs in dark places (Farnesi, Barbosa, Araripe, & Bruno, 2018). Water is placed in the ovitrap to attract the gravid mosquitoes to lay eggs and provide moisture fo r the wooden paddle that serves as oviposition substrate. The second type is MosquiTRAP, made of disposable transparent plastic bottle 2L. The bottle was cut into two parts, top and bottom. The bottom part is loaded with 200ml sugar yeast solution, a mixed of 280 g sugar, 5g of yeast and 1L of boiling water. The carbon dioxide (CO2) produced from the yeast fermentation is an important component that serve as an attractant for the mosquitoes (Mathew, Ayyanar, Shanmugavelu, & Muthuswamy, 2013). The bottle cap of the top part was removed and some bristles were placed around the bottle neck to reduce the possibility of trapped mosquitoes to escape. The top part then was sealed with the bottom part in inverted position as shown in Figure 1b. Some space is left below the bottle neck to allow the mosquitoes hovering inside the bottle. Next, light trap was developed which consists of power supply, blue light-emitting diode (LED) light, fan funnel and 6L bottle. Similar to previous trap, a 6L bottle was cut into two parts where a funnel that is attached to a fan was placed at the bottom while the blue LED light was attached to the top part. Blue colour is one of the colour spectrums that are 19
.")
26 visible to mosquitoes (Ponlawat, Khongtak, Jaichapor, Pongsiri, & Evans, 2017). Then the top and bottom parts were assembled together (Figure 1c). Lastly, an electric trap was developed, made up of a small device that consists of bug zapper and blue LED light (Figure 1d). The device was placed inside the 6L bottle to prevent it from being exposed to rain and it was connected to the wire and plug. Figure 1: Different types of mosquito traps. (a) Ovitrap. (b) MosquiTRAP. (c) Light trap (d) Electric trap. Trap setting Four different traps were set in the same area and at the same time for 13 hours from evening until the next morning. This is because the infective biting by the mosquitoes occurs throughout the night and the peak time is after 10pm (Kabbale, Akol, Kaddu, Onapa, & Matovu, 2016). The number of mosquito larvae or adult mosquitoes was counted for each trap. The most effective trap was determined and was used fo r the next step. Ovitrap setting Ovitrap was determined as the most effective trap and was used to compare the composition of mosquitoes in two different areas. Six ovitraps were set at Serumpun College and another six ovitraps were located at the Biology Department for 5 days. The traps were placed randomly at shaded and partially shaded places to avoid from direct sunlight and heavy rain that may cause water spillage (Lim et al., 2010). Mosquito collection, rearing and identification The ovitraps were collected after 5 days and were brought back to the laboratory. The contents were poured into individual plastic containers filled with fresh water. The hatched larvae were reared until they become adults. Algae were added into each container as 20
27 larval food. After the pupae turned into the adults, the plastic container was put inside the box covered with net and the mosquitoes were killed inside the killing jar. Then, the mosquitoes were kept in a vial contains with 70% alcohol to preserve it. The number o f larvae, pupae and adults were counted and recorded individually for each ovitrap. The adults were observed, and species identification was done using the stereomicroscope. Statistical analysis Descriptive statistics and independent t-test was conducted using SPSS version 23 to compare the mosquito abundance in the two different areas. Results and discussion Effectiveness of mosquito traps Different types of traps were set at Serumpun College and Biology Department for 13 hours starting from 6pm to 7am the next morning. The larvae and adults collected from the traps were counted and recorded as shown in Table 1. Table 1: The number of eggs and adult mosquitoes collected by four different types of traps. Type of trap Egg Adult Total Ovitrap 4-4 MosquiTRAP Light trap Electric trap Average temperature ( C) 34 A total of 4 mosquitoes were collected from ovitraps, compared with 1 from electric traps and null from mosquitrap and light trap at the average temperature of 34 C. The results of the present study revealed that ovitrap had a higher trapping efficacy compared to others. According to Roslan, Ngui, Vythilingam, & Sulaiman, 2017, ovitrap are considered the most effective sampling tool to locate and detect the presence of adult mosquito population. Ovitrap is utilized with black colour plastic on the outside which is the highly attractive visual cues for the mosquitoes and can increase the trap efficacy (Hoel, Kline, & Allan, 2009). Although ovitrap recorded the highest number of mosquitoes collected, it has some limitation. First, the condition of local area may compete with the ovitr ap and secondly, the 21
28 number of eggs deposited in the trap may be influenced by the skipping oviposition behavior of Aedes mosquito (Roslan et al., 2017). Light traps were developed with blue LED lights, one of the colour spectrums that are visible to mosquitoes and are able to attract the mosquitoes (Ponlawat et al., 2017). However, the traps did not collect any mosquito in this study. According to Overgaard et al. (2012), the relative trapping efficiency of light traps are inconsistent across the seasons and location. Besides, low efficacy of light trap for some species of mosquitoes especially diurnally active mosquitoes do not respond well to light traps such as Aedes mosquitoes and this may influence the efficacy of light trap (Hoel et al., 2009). In the present study, brown sugar and yeast solution was used as a source of CO 2 in the MosquiTRAP. Carbon dioxide has been shown as the most effective attractant to attract adult mosquitoes (McMeniman, Corfas, Matthews, Ritchie, & Vosshall, 2014). However, no mosquito were collected from the traps. Roey (2009) reported that yeast do not generate CO2 at a constant flow rate but at an infrequent rate and mammals release breaths in pulses and the alternations of CO2 will attract the mosquitoes as well. This may be one of the factors which may affect the efficacy of MosquiTRAP. Besides, it was found that mosquitoes also respond to the non-olfactory cues as well such as body moisture and heat (Roey, 2009). Another trap that is proven to be effective to catch mosquitoes are human-baited trap of human landing collection (HLC). However, this method is not appropriate and have serious ethical concerns because it exposes human to infected mosquito bites that may lead to serious disease (Hiwat, Andriessen, de Rijk, Koenraadt, & Takken, 2011). Moreover, according to Majambere et al. (2013), this method is difficult to supervise, labour intensive and requires a good and consistent skill in collecting the mosquitoes over long duration of time. Mosquitoes population distribution Six ovitraps were located at Biology Department and another six ovitraps were located at Serumpun College for five days. Different stage of mosquitoes including larvae, pupae and adults were found in the traps. The number of larvae, pupae and adults were counted, and the means were recorded in Table 2. The results show that Biology Department recorded the highest number of mosquitoes as compared to Serumpun Collage. Based on the observation, there are many of breeding grounds or stagnant water at Biolo gy Department compared to Serumpun College that may be one of the factors that influence the abundance of mosquitoes. 22
29 Table 2: The mean and standard deviation of the number of larvae, pupae and adult mosquitoes collected at Serumpun College and Biology Department, UPM Area Mean number of Larvae Mean number of Pupae Mean number of Adult Serumpun College 5.83± ± ±0.43 Biology Department 12.67± ± ±0.92 Mosquitoes species distribution The larvae, pupae and adult mosquitoes that were collected from Biology Department and Serumpun College were observed under the stereomicroscope. Several species of adult mosquitoes that were identified which is shown in Table 3. There are only two genus of mosquitoes that were collected which are Aedes and Culex. Table 3: Mosquito species distribution collected in Serumpun College and Biology Department, Universiti Putra Malaysia. Mosquito species Serumpun College Biology Total department (%) Aedes aegypti Aedes albopictus Culex quinquefasciatus Culex fuscocephala Culex hutchinsoni The species of the mosquitoes that were collected were Aedes aegypti, Aedes albopictus, Culex quinquefasciatus, Culex fuscocephala and Culex hutchinsoni. At Serumpun College, the number of Aedes mosquitoes is greater compared to Biology Department. Meanwhile, Culex mosquitoes are more abundant in Biology Department compared to Serumpun College. According to Yee, Kneitel, and Juliano (2010), the hatching stimuli can affect the abundance of mosquito population. Aedes sp. lay eggs above the water line, so if the place where they hatch got flooded, the eggs will hatch. Meanwhile for Culex sp., they lay their eggs on the water s surface and this will cause their eggs to hatch faster compared to Aedes mosquito s eggs. There are two types of Aedes sp. that were collected during the experiment which are Aedes aegypti and Aedes albopictus. Aedes albopictus is an aggressive feeder and able to breed in both natural and artificial container and this makes it more difficult to handle than any other mosquitoes (Hoel et al., 2009). The composition and abundance of mosquito 23
30 species are important to target disease prevention efforts because it pr ovides information about the spatial distribution of vector species (Brown et al., 2008). Conclusion Ovitrap has been found as the most effective mosquito trap in this study. Ovitrap recorded highest number of mosquitoes collected compared to other traps. The advantages of using ovitrap is it is low cost and very practical to use. Ovitrap can be used as a mosquito surveillance tool to determine the mosquito population. This study also emphasizes the importance of using the best trapping options available for mosquito surveillance and control. From this study, Biology Department was found to have more number of mosquitoes compared to Serumpun College. However, Serumpun College had higher number of Aedes mosquitoes compared to Biology Department. This shows that residential area in UPM have low number of mosquitoes but the species that occupy the area is dangerous to humans. Meanwhile for non-residential area especially in Biology Department, the number of mosquitoes is higher, but the species is less dangerous as compared to residential area. Acknowledgements The authors thank the Serumpun Collage and Biology Department fo r the approval of doing this research at the sites. References Bazin M and Williams CR (2018). Mosquito traps for urban surveillance: collection efficacy and potential for use by citizen scientists. Journal of Vector Ecology, 43, Bhatt S, Gething PW, Brady OJ, Messina JP, Farlow AW, Moyes CL, Hay SI (2013). The global distribution and burden of dengue. Nature, 496, Brown HE, Paladini M, Cook RA, Kline D, Barnard D and Fish D (2008). Effectiveness of mosquito traps in measuring species abundance and composition. Journal of Medical Entomology, 45, Chaiphongpachara T, Bunyuen P and Khlaeo Chansukh K (2018). Development of a more effective mosquito trapping box for vector control. The Scientific World Journal, 2018, 1 8. Chansang C and Kittayapong P (2007). Application of mosquito sampling count and geospatial methods to improve dengue vector surveillance. American Journal of Tropical Medicine and Hygiene, 77, de Melo DPO, Scherrer LR and Eiras ÁE (2012). Dengue fever occurrence and vector detection by larval survey, ovitrap and MosquiTRAP: A space-time clusters analysis. 24
31 PLoS ONE, 7, e Farnesi LC, Barbosa CS, Araripe LO and Bruno RV (2018). The influence of a light and dark cycle on the egg laying activity of Aedes aegypti (Linnaeus, 1762) (Diptera: Culicidae). Memorias Do Instituto Oswaldo Cruz, 113, e Gama RA, Silva EM, Silva IM, Resende MC and Eiras ÁE (2007). Evaluation of the sticky MosquiTRAP TM for detecting Aedes (Stegomyia) aegypti (L.) (Diptera: Culicidae) during the dry season in Belo Horizonte, Minas Gerais, Brazil. Neotropical Entomology, 36, Gratz NG (2004). Critical review of the vector status of Aedes albopictus. Medical and Veterinary Entomology, 18, Hasnan A, Dom, NC, Rosly H and Tiong CS (2016). Quantifying the distribution and abundance of Aedes mosquitoes in dengue risk areas in Shah Alam, Selangor. Procedia- Social and Behavioral Sciences, 234, Hiwat H, Andriessen R, de Rijk M, Koenraadt CJM and Takken W (2011). Carbon dioxide baited trap catches do not correlate with human landing collections of Anopheles aquasalis in Suriname. Memorias Do Instituto Oswaldo Cruz, 106, Hoel DF, Kline DL and Allan SA (2009). Evaluation of six mosquito traps for collection of Aedes albopictus and associated mosquito species in a suburban setting in North Central Florida 1. Journal of the American Mosquito Control Association, 25, Kabbale F, Akol A, Kaddu J, Onapa A and Matovu E (2016). Biting times of Plasmodium falciparum infected mosquitoes and transmission intensities following five years of insecticide-treated bed nets use in Kamuli District, Uganda: Implications for malaria control. International Journal of Mosquito Research, 3, Lim KW, Sit NW, Norzahira R, Sing KW, Wong HM, Chew HS, Vasan SS (2010). Dengue vector surveillance in insular settlements of Pulau Ketam, Selangor, Malaysia. Tropical Biomedicine, 27, Mackay AJ, Amador M and Barrera R (2013). An improved autocidal gravid ovitrap for the control and surveillance of Aedes aegypti. Parasites & Vectors, 6, 225. Majambere S, Massue DJ, Mlacha Y, Govella NJ, Magesa SM and Killeen GF (2013). Advantages and limitations of commercially available electrocuting grids for studying mosquito behaviour. Parasites and Vectors, 6, 53. Mathew N, Ayyanar E, Shanmugavelu S and Muthuswamy K (2013). Mosquito attractant blends to trap host seeking Aedes aegypti. Parasitology Research, 112, McMeniman CJ, Corfas, RA, Matthews BJ, Ritchie SA and Vosshall LB (2014). Multimodal integration of carbon dioxide and other sensory cues drives mosquito attraction to humans. Cell, 156, Overgaard HJ, Sæbø S, Reddy MR, Reddy VP, Abaga S, Matias A and Slotman MA (2012). Light traps fail to estimate reliable malaria mosquito biting rates on Bioko Island, Equatorial Guinea. Malaria Journal, 11, 56. Ponlawat A, Khongtak P, Jaichapor B, Pongsiri A and Evans BP (2017). Field evaluation of 25
32 two commercial mosquito traps baited with different attractants and colored lights for malaria vector surveillance in Thailand. Parasites and Vectors, 10, 378. Roey KV (2009). Yeast-generated carbon dioxide as a mosquito attractant (Masters thesis, Wageningen University). Retrieved on July 25, 2019 from Roslan MA, Ngui R, Vythilingam I and Sulaiman WYW (2017). Evaluation of sticky traps for adult Aedes mosquitoes in Malaysia: A potential monitoring and surveillance tool for the efficacy of control strategies. Journal of Vector Ecology, 42, Skae FM (1902). Dengue Fever in Penang. British Medical Journal, 2, Warrant E and Dacke M (2011). Vision and visual navigation in nocturnal insects. Annual Review of Entomology, 56, WHO. (2012). Global strategy for dengue prevention and control World Health Organiszation. Retrieved on July 22, 2019 from Yee DA, Kneitel JM and Juliano SA (2010). Environmental correlates of abundances of mosquito species and stages in discarded vehicle tires. Journal of Medical Entomology, 47,
33 1.6 Knowledge and awareness level of local community towards wildlife trade of Sumatran serow and Malayan porcupine in Perak, Malaysia Introduction Siti Aisah Dahlan, Marina Mohd. Mohd. Tah and Shamarina Shohaimi Malaysia is acknowledged for their high number of biodiversity. However, many of the species are under threat currently. Most of these wildlife species are threatened and vulnerable where one of its factors is due to commercial wildlife trade in our country. This trade becomes more widespread because of high economic demand (Hinsley & Roberts, 2018). Therefore, many traders in this kind of market are taking a short cut to gain profit by involving themselves in black market' that is done illegally without a license (Symes et al., 2017). Black market which is also known as underground economy or shadow economy is defined as the informal trade sector that would be difficult to trace including smuggling, illegal cash transaction, and unlicensed gambling (Davidson et al., 2007; Goel et al., 2019). This caused a number of wildlife species such as Sumatran serow and Malayan porcupine that have high commercial value to decrease in numbers which could lead to their extinction in future. In relation to this, IUCN Red List reported by Lunde et al., in 2008 that Malayan porcupine is declining even though it is in the Least Concern status and there is no current population status reported until This is also the same for the Sumatran serow as there were no status reported from 2008 until 2019 on their population as the y were also reported as declining even they were in Vulnerable status by IUCN Red List (Duckworth et al., 2008). On January 2018, PERHILITAN had arrested two men in Alor Setar Kedah for keeping wildlife body parts illegally and their failure on showing special permits from PERHILITAN that would otherwise allow them to keep it. The parts that were believed to be Sumatran serow s head were placed in a plastic bag together with some oil. They also believed that this serow's head was being used for traditional dispensation and ointment (Malaysia Gazette, 2018). A similar case also occurred on Jun 2017 where two local men for kept serow's head illegally and were imprisoned for two years because they failed to pay a fine not less than RM100,000 (Malaysia Gazette, 2017). In Seremban, PERHILITAN managed to find two heads, 12 legs and a piece of serow's skin during their raid to a targeted house at Jalan Pengkalan Pauh, Lubok China. All of these body parts could cost almost RM100,000 in the market (Yahya, 2016). Malayan porcupines are also not exempted from this illegal hunting threat even when PERHILITAN had approved 42 permits for commercial breeding (Ramli, 2015). This might be due to the wild porcupine meat that is believed by consumers to have higher quality a nd 27
34 nutrient than captive porcupines (Norsuhana et. al, 2012). According to Norsuhana et. al, (2012), their research stated that more than (55.6 %) of people that live in urban areas took alternative meat such as rabbit, deer, mousedeer, and also porcupine. Unfortunately, 54.7% of the consumers preferred to buy wild meats in which 33.3 % of the meats are obtained by hunters. They also stated that the Malayan porcupine had higher nutritional value than another alternatives meat that they eat (Norsuhana et. al, 2012). If this situation continuous to persist, the population of Malayan porcupine in the wild will increasingly decline due to the highest demand in the commercial market. As this illegal hunting has become one of the main reasons for wildlife traff icking, the Ministry of Natural Resources and Environment and PERHILITAN has taken serious action to overcome this problem (Sharma, 2017). Perak is one of the states in Malaysia that has already taken this matter seriously and is committed to their aim which is to achieve zero poaching by 2020 (Sharma, 2017). As they were trying to achieve that goal, it is necessary to know the level of awareness and the attitude of community perceived in Perak especially for high commercial value animals such as Sumatran serow and Malayan porcupine. Hence, the community should also be aware and help the government at the same time. In concern to this problem, many researchers have studied the roles and threats of the high commercial value of wildlife in Malaysia, but only a few of them are focusing on human awareness itself. Some researchers also studied on the way to overcome this matter, but most of them were not focusing more on the attitude and practices that had been done by Malaysians regardless of their rank, age, and gender. Therefore, this study is focusing on measuring the local community knowledge on wildlife trade of Sumatran Serow and Malayan Porcupine and determine the level of awareness of local communities in Perak towards the importance of wildlife and bio diversity. Methodology Study site This project took place in the vicinity of Perak. The two cities involved in this study are Taiping and Ipoh. From both cities, a few villagers that participated were from the district of Matang and Ipoh Kinta. There were eight villages involved in this study that are Kampung Batu Tegoh, Kampung Jelapang Jaya, Taman Sri Larut, Kampung Manjoi, Kampung Tengku Hussein, Kampung Tersusun Sungai Tapah Seberang, Kampung Sungai Tapah Tambahan and Kampung Dato' Ahmad Said Tambahan 1 dan 3. 28
.")
35 Research framework model As can be seen below, biodiversity awareness is affected by people s knowledge, their attitude and their practice which refers to their action to conserve this biodiversity (Carrasco et al., 2017; Venuste et al., 2017; Walpole & Leader-Williams, 2002). Figure 1: Research framework model of the local community role and management that could influence awareness on wildlife trade adapted and modified from Ajzen-Fishbein's Theory of Planned Behaviour (Ajzen, 1991). The public plays an important role in conservation as they could give a hand to the government in conservation. In economic view, the public usually creates the highest demand for any trading of animals in terms of food, medicinal purposes, pet and production of accessories even if it would cost a lot of money (Pires & Moreto, 2016; Nielsen et al., 2017). This could bring profit to some party, but if this kind of business is not being controlled, it would lead to the illegal trade of some animals especially animals that are under threat (Reality & Trade, 2018). Here, the community should be supportive in knowing the source of the product they consume, use, and apply in their daily life. Other than that, the community can also help by reporting any illegal activities around them as soon as possible so that the culprits can be caught (English, 2000). They can also help in supporting and joining activities being held by NGOs and governments which can at the same time expand their knowledge in biodiversity conservation issues (Zhang et al., 2008). Therefore, the relationship between governments, NGOs, private sectors and the public are very crucial in managing the biodiversity around us. 29
36 Sampling technique For this study, a cross-sectional study was used where the qualitative survey was conducted. Here, the sample was selected by using non-random sampling. Non-random sampling was used in case if the population was not well defined as the population size was not accurate (Author, 2012). Apart from that, this non-random sampling technique method is chosen because of the convenience and the cost in conducting this study which can be minimized as it was less expensive compared to random technique. On the other hand, by using this type of sampling technique, the data collection process could be implemented quickly (Bornstein et al., 2013) and was suitable for this study as there was a limited time in conducting this research. Apart from that, the convenience sampling technique was used where the enumerators conduct the interview themselves by asking directly to the person (Zhang et al., 2008). This also can be considered a face-to-face interview and self-administered interview method (Shuib, 2012). Target of population The main target while conducting this survey activity is the local community that lives in Perak areas. As had been stated before, eight villages were chosen. In obtaining the estimated population information in these villages, the head of villages or head of the community was contacted to gain confirmation and also by referring to Buku Data Asas Negeri Perak 2014 ("Data Asas Negeri Perak Darul Ridzuan - Set Data - MAMPU," n.d.) Hereby, after obtaining the estimated population, Cochran's (1977) formula was used to acquire the number of the sample that needs to be taken (Bartlett, Kotrlik, & Higgins, 2001). Only 119 samples were needed to be taken, but 124 respondents participated in this survey. Survey instrument As part of the survey, the main tool that was used while conducting this survey is the questionnaire (Alsanoy, et al., 2014; Shuib, et al., 2012). It is the most important part of this research. This questionnaire is divided into eight sections adapted from Shuib et al. (2012), Williams et al. (2017) and Zhang et al. (2008). For section A, the questionnaire focused on the respondent s demographic background such as their gender, occupation, name, education level, age and their ethnic. For section B, the questions focused more on their knowledge on wildlife and wildlife trade. While for Section C and D, the respondent knowledge towards Sumatran serow and Malayan porcupine wildlife trade respectively was recorded. For section E, the questions were geared towards the local community s 30
37 awareness on wild animals and biodiversity conservation. As for section F, the questions designed were focusing more on wild animal management of the local community. In section G, attitude and roles of respondents in conserving wild animals was recorded. Then, in section H, the involvement of respondents in wild animal conservation activities was focused. The questions were constructed with the combination of structural question and by using Likert's Scale orientation (Venuste et al., 2017). A 5 points Likert's Scale was used to measure their response based on the Level of Agreement. Data analysis In analyzing data, the Statistical Package for Social Science (SPSS) software Version 22 was used. To obtain the result, descriptive analysis was conducted. Descriptive analysis was used to sum up the socio-demographic information that was obtained based on its frequency, percentage, mean and median. Results and discussion Reliability test For this study, Cronbach's Alpha score for the questionnaire used was 0.98 that was acceptable to be used for further analysis. Cronbach's Alpha is known to measure the relationship between sets of questions and its consistency. For most social science research conditions such as this research, a reliability coefficient of 0.7 or more is considered acceptable and can be explained as closely related questions (Bruin, 2016). In this research, the reliability test was conducted by using SPSS Software. Descriptive analysis for socio-demographic background In this study, the respondents that participated were aged from 17 to 78 with th e mean of respondents aged 44 years old. More male respondents (55.6%) participated in this survey compared to female respondents (43.5%) with a variance of This might be because most of the study was conducted at the food stall around the study area where most of the customers were male. Other than that, most of the respondents were self -employed (36.3%) where there were a few of them running their own businesses. there were even respondents from the government (8.1%) and private sector (25.0%), though their field of work was not from wild animal conservation. At the same time, as for the unemployed respondents (26.6%), most of them were already retired and available at the moments of the survey. The respondents were also comprised of students (3.2%) who participated in this study. Most of them had previously migrated to other areas of Perak and shared some information on other places where wildlife trade has taken place before. As for their 31
38 educational level background most of the respondents had attended secondary school (54.0%) followed by respondents with higher educational institutions (23.4%), which they have received their certificate, diploma, and a degree. There were also some respondents that attended only primary school (16.1%) especially among the elders aged 60 to 78 years old. For respondents with lowest educational background are from others (4.8%) such as ILSAS-TNB Integrated Learning Solution and residents without any education. Local communities' perception towards knowledge on wildlife trade and their level of awareness on the importance of wildlife towards biodiversity In order to determine the level of knowledge and awareness that was perceived by the local community around Perak, a mean index score was calculated such as in Table 1 below. This questionnaire was measured by using Likert's scale, then the mean index showed their level of knowledge and awareness based on their consent to agree and disagree answer. Mean index of 1 would represent a very low awareness and knowledge leve l, while the mean index of 5 showed a very high level of awareness and knowledge. The result below (Table 1) also shows that the local community in Perak has moderate knowledge (with a mean of 3.68) on the wildlife trade of Sumatran serow with a variance of They also agree that Sumatran serow was sold in the market as end product such as ointment for medicinal purposes which is quite popular among the local community. Then, it also sells in forms of meat, horn and as well as the head. Apart from tha t, they also had moderate knowledge on wildlife trade of Malayan porcupine (mean index of 3.85) with a variance of According to the local community, they knew that this Malayan porcupine was sold in forms of meat and spine. The local community also agreed that it is sold with the purpose of medicinal, collection and for food. However, both of this species was captured through forest infringement by the sellers. As can be seen in Table 1, the local community had resulted in moderate awareness (3.65) on the importance of wildlife to biodiversity. Therefore, the result explained that the local community around Perak area agrees regarding this awareness issue and they were aware of the importance of this wildlife towards the ecosystem. At the same time, the local community also strongly agrees that wildlife trade has become a threat to wildlife and its conservation efforts. They are also aware that to hunt this wildlife such as Sumatran serow and Malayan porcupine, they should apply for a permit and license to do so. 32
39 Table 1: Mean index for awareness index and knowledge of the local community awareness. Variable Index Mean Awareness of local community on the importance of wildlife towards 3.65 biodiversity Knowledge of local community on the wildlife trade of Sumatran serow 3.68 Knowledge of local community on the wildlife trade of Malayan porcupine 3.85 Conclusion In conclusion, the local community in Perak showed that they know that the wildlife trade of Sumatran serow and Malayan porcupine in Perak are still conducted and some of them also had consumed and used the products sold by the seller and most of them were using it for medicinal purpose and for consumption purpose. For Malayan porcupine, they know that there were few sellers breeding this species with a license. Unfortunately, there were still some of them who accidentally caught the Malayan porcupine while trapping for other small mammals such as rats and squirrels but did not release their actions and ended up eating the wild animals. Besides that, this study reveals that the local community in Perak is aware of the importance of wildlife to our ecosystem. They are also aware of the existence of law enforcement that had been enacted by the government in order to protect these wildlife species. However, awareness campaigns, courses and trainings need to be done by the authority such as governments and NGOs to increase the local community knowledge. Then, this could lead to raise of awareness to the public itself. At the same time, the au thority also could share information such as hotline number that can be called if there is wildlife crime happen around the local community for example illegal wildlife trade and keeping of wildlife parts without permit. Therefore, cooperation between the local community and responsible agencies are needed in order to save our wildlife for the future. Acknowledgement The author would like to thank the head of each village, Mr. Saiful Rizal bin Shaharuddin from Mukim Kinta Ipoh, Mr. Rusli bin Abu Muhsin from Mukim Matang for their permission to do this research and also with the cooperation of villagers help in participating on this survey. Thank you also to the students from the Faculty of Forestry, UPM for their assistance in data collection. 33
40 Reference Ajzen, I. (1991). The Theory of Planned Behavior. Organizational Behavior and Human Decision Processes, 50(2), Alsanoy, A., Al-arifi, A., & Ali, W. A. (2014). an Assessment of Biodiversity Awarness Level for Sana â TM a University Students Yemen. Journal of Science & Technology, 19(1), Aswad Yahya. (2016, September). Kambing gurun. Utusan Online. Aware Definition of Aware by Merriam-Webster. (n.d.). Retrieved May 10, 2019, from Bartlett, J., Kotrlik, J., & Higgins, C. (2001). Organizational Research: Determining Appropriate Sample Size in Survey Research. Information Technology, Learning, and Performance Journal, 19(1), Retrieved from Bornstein, M. H., Jager, J., & Putnick, D. L. (2013). Sampling in developmental science: Situations, shortcomings, solutions, and standards. Developmental Review, 33(4), Brown, V. (2017, April). Traffic: Malaysia a key transit point for illegal wildlife trade. The Star Online. Retrieved from Bruin, J newtest: command to compute new test. UCLA: Statistical Consulting Group. Retrieved from Carrasco, L. R., Chan, J., McGrath, F. L., & Nghiem, L. T. P. (2017). Biodiversity conservation in a telecoupled world. Ecology and Society, 22(3) Conservation and Environmental Management Division. (2006a). Biodiversity in Malaysia. International Journal of Sciences Research Article (Vol. 2). Retrieved February 1, 2018 from Conservation and Environmental Management Division. (2006b). Biodiversity in Malaysia. International Journal of Sciences Research Article (Vol. 2). Retrieved February 1, 2018 from Data Asas Negeri Perak Darul Ridzuan - Set Data - MAMPU. (n.d.). Retrieved from Davidson, C., Martin, L., & Wilson, J. D. (2007). Efficient black markets? Journal of Public Economics, 91(7-8), Department of Forestry Sarawak (2010). Multidisciplinary Assessment Final Report and Management Plan , Kuching Wetland National Park RAMSAR Site. Center for Technology Transfer & Consultancy Universiti Malaysia Sarawak, Sarawak
41 Duckworth, J.W., Steinmetz, R. & MacKinnon, J Capricornis sumatraensis. The IUCN Red List of Threatened Species 2008: e.t3812a Downloaded on 20 January English, M. R. (2000). Who Are the Stakeholders in Environmental Risk Decisions? How Should They Be Involved? Risk: Health, Safety & Environment, 11(243), Goel, R. K., Saunoris, J. W., & Schneider, F. (2019). Drivers of the underground economy for over a century: A long term look for the United States. The Quarterly Review of Economics and Finance, 71, Hazrol Zainal. (2017, June). Dua dipenjara gagal bayar denda miliki kepala kambing gurun. Malaysia Gazette. Retrieved January 24, 2018 from Hinsley, A., & Roberts, D. L. (2018). The wild origin dilemma. Biological Conservation, 217(October 2017), Karlsson-Vinkhuyzen, S., Kok, M. T. J., Visseren-Hamakers, I. J., & Termeer, C. J. A. M. (2017). Mainstreaming biodiversity in economic sectors: An analytical framework. Biological Conservation, 210(March), Lunde, D., Aplin, K., & Molur, S., (2008). Hystrix brachyura. In: IUCN, IUCN Red List of Threatened Species. Version Retrieved from Moreto, W. D., & Lemieux, A. M. (2015). From CRAVED to CAPTURED: Introducing a Product-Based Framework to Examine Illegal Wildlife Markets. European Journal on Criminal Policy and Research, 21(3), Nielsen, M. R., Pouliot, M., Meilby, H., Smith-Hall, C., & Angelsen, A. (2017). Global patterns and determinants of the economic importance of bushmeat. Biological Conservation, 215(August), Non-Probability Sampling. (2012). Retrieved April 18, 2018, from Norlia Ramli. (2015, December). Ternak Landak Terapi Minda YB Det. Utusan Malaysia. Retrieved January 31, 2018 from Perhilitan rampas bahagian babi hutan, kepala kambing gurun. (2018). Malaysia Gazette. Retrieved January 25, 2018 from Pires, S. F., & Moreto, W. D. (2016). The Illegal Wildlife Trade (Vol. 1). Oxford University Press. Reality, T. D., & Trade, I. W. (2018). The Dark Reality of the Illegal Wildlife Trade, (May 35
42 2017), Sandbrook, C. (2015). What is conservation? ORYX, 49(4), Santos, J. (2017, August). Pygmy elephant most likely shot dead by planter. The Malaysian Insight. Retrieved February 10, 2018 from Sharma, D. (2017). The Dark Reality of the Illegal Wildlife Trade. Retrieved January 26, 2018, Reality-of-the-Illegal-Wildlife-Trade 1/ Shepherd, C. R., & Krishnasamy, K. (2014). Observations of Illegal Trade in Sumatran Serows In Malaysia. TRAFFIC Bulletin, 26(2), Shuib, A., Yee, L. S., & Edman, S. (2012). Attitudes of local communities towards conservation of the mangrove ecosystem in Kuching, Sarawak. Malaysian Forester, 75(1), Symes, W. S., McGrath, F. L., Rao, M., & Carrasco, L. R. (2017). The gravity of wildlife trade. Biological Conservation, 218(October 2017), van Uhm, D. P. (2016). The Illegal Wildlife Trade (Vol. 15) Venuste, N., Olivier, H., & Valens, N. (2017). Knowledge, Attitudes and Awareness of Pre - Service Teachers on Biodiversity Conservation in Rwanda. International Journal of Environmental and Science Education, 12(April), Walpole, M. J., & Leader-Williams, N. (2002). Tourism and flagship species in conservation. Biodiversity and Conservation, 11, Williams, V. L., Loveridge, A. J., Newton, D. J., & Macdonald, D. W. (2017). Questionnaire survey of the pan-african trade in lion body parts. PLoS ONE (Vol. 12). Zhang, L., Hua, N., & Sun, S. (2008). Wildlife trade, consumption and conservation awareness in southwest China. Biodiversity and Conservation, 17(6),
43 1.7 Spatial climatic heterogeneity on the occurrence of terrestrial birds in Peninsular Malaysia Martins Chukwumeka Onwuka, Olaniyi Oluwatobi Emmanuel and Zakaria Mohamed Introduction In Malaysia, multiple lands use by humans have opened the way to substantial loss of wetland ecosystem, and shrinkage of the populations, habitat and food bases of avian species. However, the study of avian population becomes eminent to understand the complexity of wetlands ecosystem structure and also develop appropriate management with robust monitoring tools to ensure their ecological sustainability. Researchers have also begun to explore the potential influence of climate change on bird populations (Both et al. 2010; DeLeon et al. 2011; Dybala et al 2013). Understand the habitat requirements of birds and successfully manage these species, researchers are dependent on standardized collection techniques. Hence, the study aims to determine the eco-climatic factors that influences the occurrence of terrestrial birds and to develop their habitat suitability model in Paya Indah Wetland. Materials and methods The study was conducted in Paya Indah Wetland which in the Malay language called as beautiful swamp. The wetland reserve is made up of about 3050ha of lands out of which 450 ha are under the management of the Department of Wildlife and National Parks, Peninsular Malaysia. (Fig 1). Distance sampling point count technique using stratified random design was employed to survey avian (from November 2016 to January 2019) from 57-point stations established around 14 lakes in Paya Indah wetland. An automatic linear modelling algorithm (ALMA) and geographic information systems were employed to compute the importance ratios of seventeen environmental factors (hydrology, climatic, waterscape, and landscape factors) (Fig 2). Results and discussion We also recorded 104,872 observations of terrestrial birds belonging to 71 bird species and 30 families using point-count distance sampling techniques in Putrajaya wetland. Most of the terrestrial birds are Least concern according to IUNC. 37

44 Figure 1: Location map of Paya Indah Wetlands Reserve, Peninsular Malaysia Figure 2: Framework for habitat suitability modelling of terrestrial birds in Paya Indah Wetland of Peninsular Malaysia. Table 1: Diversity indices and densities of Terrestrial Birds in Paya Indah Peninsular Malaysia Estimate Terrestrial Birds Paya Indah Wetland Observed birds individuals 104,872 Shannon s diversity index(n) 7.25 Margalefs richness index(r) Pielou s J evenness index(e) 0.92 Dominance 0.00 The Automatic linear modelling algorithm results also showed that WQI, Turbidity, salinity, ph, Pressure and Land use/land cover significantly contributed to the occurrence of terrestrial bird species in Paya Indah Wetland (Table 2). The wetland was moderately suitable for terrestrial birds (Figure 3 and Table 3). Conclusion The results of this study revealed that terrestrial birds had a rich diversity in Paya Indah Wetlands. This is due to the rich vegetation and suitable aquatic food present in the wetlands. In addition, the occurrence and richness of food resources such as fruits, seeds, insects (locus, moths, butterflies, crickets, flies, termites and beetles), nectar, reptiles (lizards, snakes), mammals (mice and rats), amphibians and birds is also a key factor that affects diversity and richness of bird species (van Heezik & Adams, 2016). 38


45 Factors Paya Indah Importance ratio Weight (%) Rank Econd ns DO ns WQI 0.153* Turbidity 0.252* Temperature ns Salinity 0.100* ph 0.090* Minimum Depth ns Maximum Depth ns Relative humidity ns Rainfall ns Wind Speed ns Pressure 0.146* Atmospheric Temperature ns NDWI ns NDVI ns LULC 0.112* Table 2: Habitat suitability evaluation criteria importance judgment weights for terrestrial birds in Paya Indah wetlands Figure 3: Habitat suitability models terrestrial birds in Paya Indah wetlands Peninsular Malaysia 39
46 Table 3: Attributes of habitat suitability models for Terrestrial in Paya Indah wetlands Suitability classes Area (Ha) Proportion (%) Highly suitable Suitable Moderately suitable Non-suitable Highly non-suitable Total 1, This Model approach can be adopted as a management tool coupled with a robust population monitoring database to enhance management effectiveness o f terrestrial bird species in the wetland. We recommend that a meteorological station should be established in this wetland in order to sample the microclimatic data such as rainfall, sunshine, relative humidity and wind speed in the area. These microclimatic data will be useful in future ecological studies. Acknowledgement The authors would like to thank the Department of Wildlife and National Parks, Peninsular Malaysia for permission to conduct this study. This research was partially funded by the Putra grant initiative (GP-IPS/2018/ ), Faculty of Forestry, Universiti Putra Malaysia. References Both, C., C. A. M. Van Turnhout, R. G. Bijlsma, H. Siepel, A. J. Van Strien, and R. P. B. Foppen Avian population consequences of climate change ar e most severe for long-distance migrants in seasonal habitats. Proceedings of the Royal Society of London. Series B, Biological Sciences, 277, DeLeon, R. L., E. E. DeLeon, and G. R. Rising Influence of climate change on avian migrants first arrival dates. Condor, 113, Dybala, K. E., J. M. Eadie, T. Gardali, N. E. Seavy, and M. P. Herzog Projecting demographic responses to climate change: adult and juvenile survival respond differently to direct and indirect effects of weather in a passerine population. Global Change Biology, 19, van Heezik, Y., and Adams, A. L. (2016). Vulnerability of native and exotic urban birds to housing densification and changing gardening and landscaping trends. Urban Ecosyst. 19, doi: /s
47 Introduction 1.8 Canonical correspondence analysis of freshwater algae in a North Lake of Ayer Hitam Forest Reserve, Puchong, Selangor N.N.F. Mat Lazim, S. Zulkifly, I.F. Uyob and N.S. Rosli Currently, environmental degradation and water pollution are environmental problems that can affect the water quality and algae diversity directly or indirectly in aquatic ecosystems. North Lake of Ayer Hitam Forest Reserve, is a freshwater lake located in Puchong Selangor. This lake is located approximately 20 kilometers from Universiti Putra Malaysia and is surrounded near to the housing area which is Kinrara Hills. The effluents discharged and the removal of wastewater into the North Lake from the nearby housing area may affect the water quality and diversity of wildlife habitat including other organisms such as algae in the lake. The study of the distribution an d biodiversity of freshwater algae is important as they can be an indicator to assess water quality in the lake as well as to provide information about the current status of algae species in Malaysia and the potential for robust species to be used in the field of biotechnology. Materials and methods Sample collection and physico-chemical analysis Triplicate water samples were collected at three different sites for weekly sampling in November 2013 until February 2014 by using a phytoplankton net. The phys ical analysis of water was measured, in situ by using YSI Multi-parameter probe while chemical analysis of nutrients was analysed in laboratory. Identification, enumeration of algae and data analysis The identification of algae species was made based on their morphological characteristics by observing under the microscope and the information from Algaebase website. The enumeration of algae was carried out by using a Sedgwick- Rafter counting chamber. Canonical correspondence analysis (CCA) was performed to determine the correlation between algae species and environmental variables in the North Lake by using Microsoft Excel Stat. Results and discussion There were 13 of algae species belonging to 5 phyla identified in this study as shown in Table 1 and Figure 1 showed the image of some species present in the lake. In the present study, Ochrophyta was the dominant group and among all species present, 41

48 Gonyaulax apiculata was the most abundant species in the North Lake. The diversity of algae community was different in each site and during the sampling period due to the differences of environmental variables availability in the lake in each site. The environmental variables were fluctuated during the sampling period caused by weather condition and might affect the composition of algae in the lake. Table 1: List of freshwater algae species in North Lake of Ayer Hitam Forest Reserve, Puchong from November 2013 until February Phylum Ochrophyta Dinophyta Charophyta Cyanophyta Chlorophyta Species Dinobryon sertularia Navicula sp. Pinnularia sp. Frustulia sp. Gomphonema sp. Gymnodinium palustre Gonyaulax apiculata Massartia musei Cylindrocystis brebissonii Micrasterias radiate Holopedium irregulare Anabaena subcylindrical Pandorina morum Figure 1: Some of species present in the North Lake Ayer Hitam, Puchong; A) Navicula sp., B) Dinobryon sertularia, C) Anabaena subcylindrica. From the CCA ordination triplot (Figure 2), a pattern of the seasons, associations of the physicochemical properties and algae species list could be seen. One is the wet season sampling (November and December) and another is the dry season sampling (January and February). For the dry season sampling, Ochrophyta, are most associated with dissolved oxygen. Dissolved oxygen creates a niche for the diatoms for their biological productivity. Ochrophyta (diatoms) are also associated with silica, which they need for their cell growth. Navicula sp. was found to be present in all months of sampling. They required silica in the lake for their cell growth as they have a unique structure of the silicified cell wall. In freshwater environment, the diversity of pennate diatoms was diverse and can be found frequently (Basavaraja, Narayana, Puttaiah & Prakash, 2013). 42
49 Cyanophyta are positively correlated with temperature. Anabaena subcylindrica became dominant on February 2014 at all sites as the temperature was high in this month and a green surface layer can be seen in the lake which indicated their abundance. Cyanophyta can survive in variety of habitat and conditions such as in extreme, strongly alkaline lakes, support high metal concentrations, freezing environments and arid desserts (Rampelotto, 2013). The high temperature and also silica are associated with the presence of Charophyta species in North Lake. The optimal growth temperature for the desmids species corresponds to a range of 25 C to 30 C. Some Charophyta also requires silica for their cell wall. Cylindrocystis brebissonii was found to be abundant compared to Micrasterias radiata. The optimal growth temperature for the desmids species corresponds to a range of 25 C to 30 C (Coesel & Wardenaar, 1990). High number of desmids species were obtained when there was a high value of temperature in the lake that range between C to C on January and February For the wet season sampling, Dinophyta are positively correlated with the phosphate and nitrate. The fluctuation of these nutrients might influence species in this phylum which have a role to limit the growth of most algae species in the lake (Naqqiuddin, Kader, Muhamad, Nor, Shohaimi, & Zulkifly, 2017) Figure 2: The ordination triplot for canonical correspondence analysis (CCA). 43
50 Conclusion The study findings indicated that the variation of algae species in North Lake of Hutan Simpan Ayer Hitam, Puchong. As the ph level of the lake was below than 7, the lake was in acidic condition and slightly polluted. This was revealed by the presence of some species, including Dinobryon sertularia (Ochrophyta) which preferred to survive in basic and acidic water. This information would be useful for the public to evaluate the use of the lake as a water source for consumption and recreational use. Acknowledgement This project was financially supported by UPM PUTRA IPM grant (GP/IPM/2013/ ) and UPM PUTRA IPM grant (GP-IPS/2018/ ) References Coesel, P. F. M., & Wardenaar, K. (1990). Growth responses of planktonic desmid species in a temperature-light gradient. Freshwater Biology, 23(3), Basavaraja, D., Narayana, J., Puttaiah, E. T., & Prakash, K. (2013). Phytoplankton species diversity indices in Anjanapura reservoir, Western Ghat region, India. Journal of Environmental Biology, 34(4), 805. Naqqiuddin, M. A., Kader, M. A. O. A., Muhamad, N., Nor, N. O., Shohaimi, S., & Zulkifly, S. (2017). Comparison of phytoplankton diversity and succession between two small man-made lakes in Serdang, Selangor. Tropical Ecology, 58(3), Rampelotto, P. H. (2013). Extremophiles and extreme environments. Life, 3(3),
51 1.9 Toxicity effects of nanomaterial (Quantum dot) following sub-acute and sub-chronic exposure to zebrafish Introduction Nur Atikah Saleh Hodin, Che Azurahanim Che Abdullah and Wan Norhamidah Wan Ibrahim Quantum Dot (QD) is a nanomaterial that nowadays has been widely used in various advanced applications such as biological imaging, food science applications and electronic applications (Bonilla et al., 2016). QD exhibited many interesting properties including high photostability, narrow emission wavelength, strong luminescence intensity and broad excitation window (Yan & Chen, 2014). Interestingly, QD is also easy to prepare and modify in which by only altering its cap and size, different desirable properties of QD can be produced (Hoshino et al., 2004). Despite of the advantages, according to Hardman (2006), QD can bring harm through variety of exposure routes. Additionally, different types of cores and caps of the QD apparently can lead to different type of toxicity (Hoshino et al., 2004). The production of QD has greatly risen yearly, yet, the research elucidating the adverse effects of QD is still lacking. Thus, in this present study, we evaluated the toxicity effects of QD by assessing the morphological and behavioral changes as well as biochemical alterations using adult zebrafish as a model organism. According to McGrath and Li (2008), zebrafish nowadays is increasingly being use for drug toxicity assessment due to its small size, low maintenance cost, easily bred and single female can produce eggs. In addition to this, drug administration to zebrafish also can be done easily as their skin and gills can absorb small molecules in the water. Importantly, zebrafish toxicity profiles are strikingly similar to the mammalian with the organs and tissues have also been shown to resemble mammals (McGrath et al., 2008). Materials and methods Random sex wild-type adult zebrafish were purchased from local pet shop and acclimatized accordingly with standard laboratory care procedure. The fish also were fed four times a day with live feed (Artemia salina) and commercial dry flakes (Sera Vipan) alternately. QD was obtained as a kind gift from Dr. Che Azurahanim Che Abdullah from Department of Physics, Faculty of Science, Universiti Putra Malaysia (UPM). Random sex adult zebrafish were divided into two different groups of exposure; sub-chronic (received media renewal every 24 hours) and sub-acute (no media renewal throughout 96 hours of exposure). The fish were exposed to four different concentrations of QD including control (0, 50, 100, 200 µg/l) for 96 hours in a tank with diameter 23.5 cm length X 11.5 cm width X 12.5 cm height. Both groups were dispersed with actual insoluble form of QD. Each group of exposure received five fish with all exposures were duplicated and repeated for three times (n=10). Following the 45
52 exposure, morphological and behavioral changes were observed every 24 hours until 96 hours of the exposure duration. Total percentage of mortality rate, changes in body shape, eye and fin structures, body discoloration and internal bleeding exerted by the fish were recorded. In addition, erratic swimming and swimming speed were manually observed to confirm the locomotor abnormalities. All changes were compared with the respective controls. In addition, biochemical assessment of the zebrafish gills was conducted via Fourier Transform Infrared Spectroscopy (FTIR). After the exposure, survived zebrafish with selected concentration (50 µg/l) were dissected to obtain the gills. The gills were then fixed with 4% paraformaldehyde (PFA) for 24 hour. The gills sample were rinsed three times and freeze dried. Dried samples were grounded using agate mortar and pestle to obtain its powder. 100 mg potassium bromide was mixed with the powder. Mixture was subjected to a pressure of 5t in an evacuated die for 5 minute. Clear KBr obtained were used for FTIR. Measurement of spectre were done using Thermo Nicolet Nexus, Smart Orbit Spectrometer based on KBr disc method (Bakar et al., 2017). Results and discussion Based on the experiment, we found that QD produced toxicity effects on adult zebrafish in which QD exposed fish exhibited morphological changes including changes in the body shape, eye structure, fin structure as well as the presence of internal bleeding in both exposure condition. In addition, the mortality rate recorded were high with 200 µg/l cause 100% mortality rate in both exposure conditions (Table 1). The tremendous mortality rate and severe morphological impairments exerted by the exposed fish had caused the anxiety-like behavioural assessment to be aborted from the experiment. Table 1: Morphological abnormalities exerted by exposed fish following the exposu re to QD. Mode of exposure Concentrations (µg/l) Sub-chronic Sub-acute Morphological abnormalities Behavioral abnormalities Morphological abnormalities Mortality rate (%) Average body mass (g) Body shape n n y y Eyes structure n n n y Fin structure n y y y Body discoloration n y n y Internal bleeding n y y y Erratic swimming n y n n Swimming speed n y n n Mortality rate (%) Average body mass (g) Body shape n y y y Eyes structure n n y n Fin structure n y y y Body discoloration n n n n 46
53 Behavioral abnormalities Internal bleeding n n n n Erratic swimming n y y y Swimming speed n y y y Note: y indicating the presence of the selected endpoints, while n indicating the absence of selected endpoints. In agreement with our result, a study by King-Haiden et al., (2009) showed that QD induced mortality rate and morphological alterations in both adult and developing zebrafish accordingly with the concentrations. QD possed nanocrystalline core of cadmium selenium (CdSe) that can cause adverse effects to the organisms and environment (Leigh et al., 2012). Moreover, besides Cd, Se itself also can contributed to the malformations of the organism (King-Haiden et al., 2009). Additionally, QD also changed the biochemical constituents of the zebrafish gills exposed with 50 µg/l QD (Figure 1). a) b) c) Figure 1: Average representative of FTIR spectre of normal, sub-chronic and sub-acute exposed zebrafish respectively. In general, sub-acute exposure produced less alterations as compared to sub-chronic exposure. QD caused alterations to the peak positions and transmission intensity (Figure 1a and 1b). Moreover, existence of the newly recognized peaks and disappearance of existed peaks indicated damage of the particular constituents (Figure 1a and 1b). The most prominent effects observed in the gills include changes of the lipid, protein, glycogen and carbohydrate as well as nucleic acid. Theoretically, the prominent effect should be seen in the gills as it is a crucial target of waterbone objects like nanoparticles. Alterations of the macromolecules (protein, lipid, glycogen and carbohydrate) may be explained by the deposition of nanomaterials on the epidermis layer which tends to occur via diffusion. Besides, accumulation of nanomaterials on the skin can lead to diffusion into the tissues, which then resulted in the impairments of the biochemical constituents on the organ (Chen et al., 2011). 47
54 Conclusion QD resulted in distinctive adverse effects on the zebrafish in a dose dependent manner. Additionally, sub-chronic exposure produces higher toxicity compared to sub-acute exposure. Taken all together, exposure to QD both sub-chronic and sub-acute induce morphological alterations and disrupt the biochemical constituents of the selected organ. Acknowledgement This research was financially supported by Ministry of Higher Education under Fundamental Research Grant Scheme ( FR ) and Putra Grant Scheme (UPM/700-2/1/GP/2017/ ). References Bonilla, J. C., Bozkurt, F., Ansari, S., Sozer, N., & Kokini, J. L. (2016). Trends in Food Science & Technology Applications of quantum dots in Food Science and biology. Trends in Food Science & Technology, 53, Chen, J., Dong, X., Xin, Y. & Zhao, M. (2011). Effects of titanium dioxide nanoparticles on growth and some histological parameters of zebrafish (Danio rerio) after a long - term exposure. Aquatic Toxicology, 101(3 4), Hoshino A, Hanaki K, Suzuki K, Yamamoto K. (2004). Applications of T-lymphoma labeled with fluorescent quantum dots to cell tracing markers in mouse body. Biochem Biophys Res Commun., 314:46 53 King-Heiden, T. C., Wiecinski, P. N., Mangham, A. N., Metz, K. M., Nesbit, D., Pedersen, J. A., Peterson, R. E. (2009). Quantum dot nanotoxicity assessment using the zebrafish embryo. Environmental Science & Technology, 43(5), Leigh, K., Bouldin, J., & Buchanan, R. (2012). Effects of exposure to semiconductor nanoparticles on aquatic organisms. Journal of Toxicology, 2012, McGrath, P., & Li, C. Q. (2008). Zebrafish: a predictive model for assessing drug-induced toxicity. Drug discovery today, 13(9-10), Yan, L., & Chen, X. (2014). Nanomaterials for drug delivery. In Nanocrystalline Materials (Second Edition) (pp ). 48
55 CHAPTER 2: ANIMAL PHYSIOLOGY 2.1 The effect of lactation number and lactation stage on the lactation of crossbred Sahiwal-Friesian cows in selected dairy cattle farm of Sabah Introduction N. Navin Kumar, Mohamad Zaihan Bin Zailan and Nur Hardy Abu Daud Lactation is defined as the process of the production of milk. This process normally occurs in all mammalian species (Boniface et al., 2007). Milk is the nutritious food product made by the lactating animals and it is rich in carbohydrates, protein, fats, vitamins and minerals (Blowey and Edmondson, 2000; Sinha, 2000). Milk is synthesized by the secretory cells in the mammary glands of the mammalian species. For the first four days post calving, the milk that was produced by milking cow is known as colostrum and it is used to feed the newborn calves. Milk production rises until peak production for about days after calving and the most ideal lactation period is 305 days or about 10 months. Milk production per lactation will increase until the fourth lactation or when the cows are at the age of six years old, this is when the cows were calved at the age of two. When the cows reach the age of eight years old, the milk production will decrease. Some of the studies suggested that the highest milk production is when the cows are at the age of seven (Boniface et al., 2007). A report by Epaphras et al. (2004) stated that most milk producers understand that the milk production fluctuates up and down from one lactation to the next. About one third of the world s cattle population are found in the tropics and they are of the Bos indicus types. The Bos indicus cattle generally have a lower performance than the European breeds of cattle, Bos taurus in the temperate regions. This can be due to poor management, low plan of nutrition, diseases and parasites and low genetic potential. The performance of the Bos taurus cattle in the tropical environment is also far from satisfaction level as they are affected by the effect of tropical diseases, poor nutrition and climatic stress. However, Bos taurus cattle play an important role in the genetic improvement of the local cattle by crossbreeding. The progeny produced by the crossbreeding between the Bos taurus and Bos indicus cattle has shown superior performances than their parents. The crossbreds did not only have higher milk yield, but their calves produced have heavier birth weights and animals with the potential for faster weight gain (Boniface et al., 2007). According to a report by Malaysian Livestock Breeding Policy (DVS, 2013), the dairy industry development project was started in the early 1970 s in Sabah with the crossbreeding program between local Zebu cattle and imported Friesian cattle using the artificial insemination technique. In 1976, the dairy breeding herds were established at the Sebrang Livestock Breed stations in Keningau and Tawau. In 1980, the initial importation of Sahiwal-Friesian heifers from New 49
56 Zealand was made. This project involved the small land holders with the purpose to form the dairy industry and hence, to increase the urban residents income in conjunction of the New Economic Foundation (Salleh, 1989). According to a report by Ahmad et al. (2011), it was stated that milk and milk products are well known to form a vital balanced diet and almost a complete food for human consumption and there isn t a single food which can replace milk (Eckles et al., 1951). Although milk is an important source of diet for humans, however the production of milk is not at a satisfactory level even though Malaysia have a huge number of milking cows and cattle populations. A report by The Star (2019) has stated based on the Malaysia agricultural sector report that the local liquid milk production covers only about 5% of the domestic needs. With rise in industrialisation and education, this has led to a more health-conscious population and a rise in the demand for dairy products. A number of factors have been reported to affect the pro duction of milk in the tropics and they may include the genetic, climatic, diseases, feeding, year of calving and managerial factors (Payne and Wilson, 1999; Msanga et al., 2000). Animal factors such as breed, age, lactation stage, parity and milking frequency have also been reported in other studies (Tekerli et al., 2000; Johnson et al., 2002). Milk yield and quality is significantly affected by the lactation (Ahmad et al., 2011). With the advances in the lactation number, the milk yield of the cows rises gradually. The lactation stage does also significantly affect the milk yield. The milk yield decreases as the lactation stage advances. Several researches other than this was conducted all around the world to study on the effect of lactation number and lactation stages on the milk yield of dairy cattle. However, very few researches had been done in our country regarding this topic. Hence, the present study was undertaken to investigate the effect of lactation number and lactation stage on the lactation of the crossbred Sahiwal-Friesian cows at a selected dairy cattle farm in Sabah, to evaluate the relationship between milk yield with lactation number and lactation stage and to investigate the effect of lactation number on the peak yield, time to peak and peak holding period of the crossbred Sahiwal-Friesian cows at the selected dairy cattle farm of Sabah. Methodology The pilot study was carried out at the Yun Fook Resources farm, a dairy farm located in Keningau, Sabah. The farm is located approximately 4.40 km from Keningau town. Yun Food Resoures farm is situated at North of Equator and East of Greenwich. The climate of the study site was characterized by the hot and humid weather. The average temperature of the farm area was approximately about 26 and the average humidity level was about 65%. The farm was located 300 meters above sea level and it lies on a highland area of Keningau, Sabah. 50
57 Currently the farm has dairy cattle of the Sahiwal-Friesian crossbreeds (5194), dairy goats (356) and deers (224). The lactating cows were supplemented with mixture of concentrates consisting of soy bean powders, palm kernel cake, corn and minerals. The concentrate mixture was provided at 10.5 kg per head of cow. Concentrates were only provided to the cows before each milking sessions. Napier grasses were provided to the cows ad libitum after each milking sessions. All lactating cows were milked using the automated milking system (AMS) for two times a day, the first session at 4 a.m. and the second session at 4 p.m. Milking was done in the milking parlour. Data was collected based on the slight modifications of the method by Bondan et al. (2018). Daily milk production data of the cows were recorded by the DelPro software. During this study, the records of the milk yield for 100 lactating dairy cows on the farm were used for the study. Data used were for the cows of days in milk (DIM). All animals included in this study were the Sahiwal-Friesian crossbreed cows, with a body condition score (BSC) of 2.75 to 3. Stage of lactation was classified into three categories according to days in milk (DIM): 1 to 60 (early), 61 to 120 (middle) and 121 to 220 (late). 25 cows were selected based on their DIM for each of the lactation number groups (first lactation, second lactation, third lactation and fourth lactation). Average daily milk yield was measured in liters/cow/day and recorded into Microsoft Excel program. From the daily milk yield data, the averages of the peak yield, time to peak and peak holding period was determined. Peak yield is the point of milk yield, in which the cow reaches the highest milk production level during the entire lactation. Peak yield was measured as liters/cow. Time to peak was defined as the number of days taken for a cow to reach the peak yield and was measured as days/cow. The peak holding period was defined as the period in which the highest milk production was maintained in the entire lactation and it was measured as days/cow. For the statistical analysis, One-way Analysis of Variance (ANOVA) was used to interpret the average daily milk yield, peak yield, time to peak and peak holding period data. Meanwhile, Two-way ANOVA was used to interpret the interaction between the effect of lactation number and the lactation stage on the average daily milk yield. This analysis was performed using SAS version 9.4 for Windows program software. Results are expressed as the mean ± standard error of the mean. Comparison between the means were evaluated using Duncan s Multiple Range Test (DMRT). A probability of less than 0.05 was considered significance (p<0.05) for the average daily milk yield, peak yield, time to peak and peak holding period data analysis. Meanwhile, a probability of less than was considered significance (p<0.0001) fo r the interaction effect between the lactation number and lactation stage data analysis. 51
58 Results and discussion Milk yield, peak yield, time to peak and peak holding period at different lactation numbers Table 1: Mean (± standard error) of milk yield, peak yield, time to peak and peak holding period of crossbred Sahiwal-Friesian cows with different lactation numbers. Lactation number Milk yield for 220 days (liters/cow/day ) Peak yield (liters/cow) 52 Time to peak (days/cow) Peak holding period (days/cow) ±0.32 ab 30.85±0.92 b 52±5 a 60±3 a ±0.29 a 34.01±1.93 ab 42±3 ab 45±5 b ±0.27 a 37.25±1.77 a 36±4 bc 40±5 b ±0.50 b 37.35±2.10 a 28±3 c 35±4 b *Different letters among lactation number indicate significant differences (P<0.05). The average daily milk yield, peak yield, time to peak and peak holding period of Sahiwal-Friesian cows at different lactation numbers was shown in Table 1. It was found that the average daily milk yield of Sahiwal-Friesian cows at the 1st, 2nd, 3rd and 4th lactation was 14.11±0.32, 14.57±0.29, 14.88±0.27 and 13.14±0.50 liters/cow/day, respectively. Statistical analysis showed that there was a significant difference (p<0.05), within the daily milk yield of different lactation for crossbred Sahiwal-Friesian cows. Milk yield increased gradually from first to third lactation. The highest milk yield was recorded in the third lactation cows (14.88±0.27 liters/cow/day) and lowest was in the fourth lactation cows (13.14±0.50 liters/cow/day). A report by Epaphras et al. (2004) stated that the lactation number or parity was positively associated with the milk yield, supporting the results of the current study. Johnson et al. (2002) reported that the capacity to produce milk by the older cows were higher than the younger cows in association with their greater feed intake. However, cows in the fourth lactations or more were no longer better milk producers than the cows in the third lactation. The older age of the cows may cause the decrease in the milk produced by the turnover rate of the secretory cells, with higher number of cells dying compared to the active secretory cells that are newly produced. Fat tissue cells normally substitute the dead secretory cells. Not only that, the results reported by Vijayakumar et al. (2017) is in support with the findings of the current study. The increase in the milk yield with the lactation number is maybe due to the increasing development and size of the udder with an increase in the secretory cells (Sorensen et al., 2006). Vijayakumar et al. (2017) have also stated that the lower milk yield in first lactation cows is due to the early lactation of cows are not yet in the productive stage but remain in the growing stage with their mammary gland and mammary vein are not well developed at this
59 stage. As the current study have shown that the highest milk yield is in the third lactation cows. Thus, cows with more than the third lactation have exhibited the tendency for total milk yield to decrease. Ray et al. (1992) have reported that as lactation number rises, the total milk yield increases but at a decreasing rate with lactation number. From Table 1, we can say that the cows with more than three lactations are not good candidates for maximizing milk yield with the automatic milking system. The peak yield of the Sahiwal-Friesian cows at the 1st, 2nd, 3rd and 4th lactation was 30.85±0.92, 34.01±1.93, 37.25±1.77 and 37.35±2.10 liters/cow, respectively. This shows that with the increase in the lactation number, the peak yield of the Sahiwal- Friesian cows also increases. Thus, the highest peak yield was produced by the cows in the third and fourth lactation. This can be explained that the peak yield produced by the third and fourth lactation cows were highest due to the well-developed mammary gland of the cows. Meanwhile, the time to peak of the Sahiwal-Friesian cows at the 1st, 2nd, 3rd and 4th lactation was 52±5, 42±3, 36±4 and 28±3 days/cow, respectively. The current study results showed that the cows of the fourth lactation have reached their peak yield much earlier than the other lactation cows. This is due to the reason that the fourth lactation cows have well developed mammary glands with secretory cells that would allow the production of more milk at the earlier days of the lactation cycle of the cows. The first lactation cows were found to reach their peak yield later than other lactation cows as this was caused by the mammary gland and mammary vein were not well developed and thus, it takes some time for more milk to be produced and hence, causing the cows to reach their peak yield at a later time. Besides that, it was found that the cows of all four lactations have reached their peak yield at the earlier stage of lactation (1-60 days) and this can be supported by the finding of Vijayakumar et al. (2017), in which the highest peak of milk yield was obtained in the early stage (1-100 days). This can be explained by the effect of the changes of hormones causing the deterioration of the mammary gland, nutrient requirement of the fetus and insufficient nutrition for milk production. Next, it was found that the peak holding period of the cows decreases as the lactation number increases. The cows of the first lactation have the longest peak holding period (60±3 days/cow) compared to the fourth lactation cows that have the shortest peak holding period (35±4 days/cow). This is due to the cows of the fourth lactation have less secretory cells than the first lactation cows during the peak holding period as higher number of cells died compared to the active secretory cells that are newly produced when the age of the cows increase (Bondan et al., 2018). 53
60 Effect of lactation stage on milk yield Table 2: Means (± standard error) of milk yield at different stages of lactation of crossbred Sahiwal-Friesian cows. Lactation stage (days) Milk yield (litres/cow/day) ±0.34 a ±0.37 a ±0.24 b *Different letters among stages indicate significant differences (P<0.05). The main predictor of milk yield was the lactation stage. The average milk yield at different stages of lactation of the crossbred Sahiwal-Friesian cows are presented in Table 2. The average milk yield of crossbred Sahiwal-Friesian cows at early, middle and later stages of lactation were 14.59±0.34, 14.46±0.37 and 13.22±0.24 litres/cow/day, respectively. The results revealed that lactation stage had a significant effect (P<0.05) on the average milk yield. The results indicated that the cows in the early and middle stage had the highest milk yield. This is because the highest peak of milk yield of the cows was obtained at the early and middle lactation stage and remains high for a while and then as the lactation progresses, the milk yield gradually decreases. This result are reasoning can be supported by the findings of Vijayakumar et al. (2017), in which it was reported that the results are due to the hormonal changes causing the deterioration of the mammary gland, nutrient required by the fetus and the lack of nutrition for milk production. Figure 1 below shows the average milk yield of the first, second, third and fourth lactation of the crossbred Sahiwal-Friesian dairy cows at early, middle and late stages. The results of the current study showed that the average milk yield of the first, second, third and fourth lactation of the dairy cows at early, middle and late stages were 14.43, 14.99, 13.21; 15.06, 14.52, 13.60; 15.81, 15.66, 13.87; and 13.15, 12.69, litres/cow/day, respectively. The current study results were found in supportive with the results of the studies by Sekerden (2002), in which it was stated that the milk yield decreases at the late stage of lactation. However, the results of the current study were not supportive to Sekerden (2002) study, at which in the current study highest yield was observed in the early stage instead of the middle stage of lactation. This difference can be due to the better feeding management and the genetics of the cows used for the current study. Based on the statistical analysis conducted, it was found that there were no significant interaction effects between the lactation numbers and lactation stages on the milk yield of the crossbred Sahiwal-Friesian cows (P=0.9148, P>0.0001). 54

61 Figure 1: Average milk yield of crossbred Sahiwal-Friesian cows at different lactation numbers and lactation stages. Conclusion Lactation number and stage of lactation does play a role in the lactation of the crossbred Sahiwal-Friesian cows. However, it was found that the lactation number and lactation stages have no significant interaction effects on the milk yield of the cows. Meanwhile, the lactation numbers of the cows have significant effects on the milk yield, peak yield, time to peak and peak holding period of the cows. Besides, the different lactation stages of the cows significantly affect the milk production of the cows. Overall, by ranking, cows of the third lactation was the most productive. Cows in the early and middle lactation stage were the most productive. Overall, the production of cows had not reached the level of satisfaction as it is a need to improve the quality of nutrition of the individual cows. With the lactation trends obtained from the current study, farmers will be able to identify the weakness and strong point for the improvement plan and the other future undertakings of the farm. Farmers must be encouraged to keep continuous record of the daily milk yield and construct the lactation curve especially with the peak milk production based on the cows different lactation numbers (age or parity of cows) and lactation stages. I would like to recommend that further studies regarding this topic should be conducted in Malaysia such as the milk production of different crossbred cows. Acknowledgement The authors are grateful to Yun Fook Resources Sdn Bhd on the data collection during the lactation. 55
62 References Ahmad S, Hossain FMA and Islam N (2011) Effects of Lactation Number and Different Stage of Lactation on Milk Yield of Indigenous and Crossbred Cows in Bangladesh. International Journal of Natural Sciences, 1(1), Blowey R and Edmondson P (2000) Mastitis control in dairy herds: an illustrated practical guide. 1st ed. Farming Press, Tonbridge, U.K., pp 196. Bondan C, Folchini JA, Noro M, Quadros DL, Machado KM and Gonzalez FHD (2018) Milk compostion of Holstein cows: a retrospective study. Journal of Animal Production, 48, 12. Boniface B, Jupikely JS and Abdul Hamid A (2007) Dairy Cattle Management: Survey on Dairy Cattle Lactation Trend in Sabah. Retrieved from Department of Veterinary Services (2013) Malaysian livestock breeding policy. Retrieved from ng_policy pdf. Eckles CH, Conbs WB and Maey H (1951) Milk and milk products. Fourth edition, McGrow Hill Book Company, Newyork, Toronto, London, Epaphras A, Karimuribo ED and Msellem SN (2004) Effect of season and parity on lactation of crossbred Ayrshire cows reared under coastal tropical climate in Tanzania. Livestock Research for Rural Development, (16)6. Retrieved from Johnson CR, Lalman DL, Appeddu-Lisa A, Brown-Michael A, Wetteman RP and Buchanan DS (2002) Effect of parity and milk production potential on forage intake of beef cows during late gestation. TEKRAN United States Department of Agriculture, Agricultural Research Service Msanga YN, Bryant MJ, Rutam IB, Minja FN and Zylstra L (2000) Effect of environmental factors and of the proportion of Holstein blood on the milk yield and lactation length of crossbred dairy cattle on smallholder farms in north-east Tanzania. Trop. Anim. Health Prod, 32(1), Payne WJA and Wilson TR (1999) An introduction to animal husbandry in the tropics. 5th ed. Blackwell Publishing Ltd, Iowa State University Press, U.S., pp 826. Ray DE, Halbach TJ and Armstrong DV (1992) Season and Lactation Number Effects on Milk Production and Reproduction of Dairy Cattle in Arizona. J Dairy Sci, 75, Salleh AS (1989) The Development of Dairy Industry in Sabah. Proceedings of Seminar on Animal Production and Health, June 12-14, 1989, Tawau, Sabah, Sekerden O (2002) Relationships between lactation stage with milk yield and constituents, and heritabilities of milk constituents. Hayvansal Uretim Journal of Animal Production, 43(2), Sinha OP (2000) Clean milk production and support service. conference on small scale milk collection and processing in developing countries. Discussion paper 1.1. FAO Dairy e-conference papers 29 May-28 July, Retrieved from Sorensen MT, Norgaard JV, Theil PK, Vestergaard M and Sejrsen K (2006) Cell Turn over and Activity in Mammary Tissue during Lactation and the Dry Period in Dairy Cows. Journal of Dairy Science, 89,
63 Tekerli M, Akinci Z, Dogan I and Akcan A (2000) Factors affecting the shape of lactation curves of Holstein cows from the Balikesir province of Turkey. J. Dairy Sci, 83, The Star (2019, April 15). Promising growth for milk industry. Metro News. Retrieved from Vijayakumar M, Park JH, Ki KS, Lim DH, Kim SB, Park SM, Jeong HY, Park BY and Kim T (2017) The Effect of Lactation Number, Stage, Length, and Milking Frequency on Milk Yield in Korean Holstein Dairy Cows Using Automatic Milking System. Asian-Australasian Journal of Animal Science, 30(8), Retrieved from 57
64 2.2 Evaluation of baseline diagnostic lethal concentration for adult Aedes albopictus in Kuantan, Pahang Ilma Syawati Osman, Norazsida Ramli, Hamdan Ahmad, Abu Hassan Shaari Abd Kadir, Jaiza Jaafar and Fatin Mardhiah Ramli Introduction Dengue is a vector borne disease transmitted from infected female mosquitoes. Principal vector for dengue virus in Malaysia is Aedes aegypti due to the preference human habitat and takes multiple blood biting. However, Aedes albopictus is a suburban mosquito also documented as sole vector where Ae. aegypti was not present or had a reduced (Rezza 2012; Peng et al. 2012; Kasai et al. 2011; and Kyle Jl and Harris GE, 2008). Moreover, Norafikah et al found the existence of Ae. albopictus almost in all study sites located in Peninsular Malaysia compared to aegypti. Transition to secondary vector has greatly increased the chances of dengue transmission through close contact to human. At present, there is no definite antiviral therapeutics to treat dengue, nor an effective vaccine to prevent infection. Tetravalent dengue vaccine (Dengvaxia) developed by Sanofi Pasteur was still in evaluation as many complications arise (WHO, 2017). Currently, the authorization relied heavily on vector control method to reduce transmission of virus either in larvae or adult stage. Fogging is rapid approach to curb the transmission once dengue case notified. However, frequent insecticide exposure will develop insecticide resistance in mosquito (Regan D et al. 2016). Insecticide resistance is a major risk to the future elimination of infected mosquito (IRAC 2011). To date, the discriminating dose of insecticide for respective species of mosquito was adhered to standard WHO which applied in worldwide generally to kill the infected vector. In this study, we aimed to establish diagnostic doses of Deltamethrin as the alternative chemical control tool based on localities in Kuantan, Pahang. Materials and methods Mosquito collection Aedes albopictus and aedes aegypti samples collection for laboratory strain were initiated in November All wild-caught immature stages of both species were brought to the insectarium at Jalan Gambut, Kuantan which was under Vector Control Unit of Jabatan Kesihatan Negeri Pahang. The samples were reared from egg to adulthood under standard insectarium conditions recommended by the World Health Organisation (WHO) (WHO, 2009). The insectarium were maintained at temperature 28 ± 2 C, room humidity 80 10% and photoperiod of 12h day/night. The larvae were fed daily on mosquito larval food made of fine powdered beef liver. Upon pupation, all wild populations from each site were separated into vials and species identified after adult emergence on the basis of morphological characteristics (Rattanarithikul et al, 2010). 58
65 Adult were provided with 10% honey solution using soaked cotton wicks and were allowed to mate. Susceptible strain of aedes mosquito has been maintained more than F2 generation to ensure free from any insecticide resistance. Susceptibility of mosquitoes toward deltamethrin 25 non-blood-fed female mosquitoes introduced into each of the holding tube and held for one hour for acclimatization. Each test consisted of 5 replicates with insecticide exposure and 2 for control. Then, susceptible strains of mosquitoes were transferred gently into exposure tube lining with impregnated insecticide paper. The tubes placed vertically for one-hour exposure of insecticide and the knockdown rate was recorded every 5 minutes. At the end of exposure, the mosquitoes were blown back into holding tube and placed vertically for 24h with glucose solution on cotton wool. The mortality rate of mosquitoes was counted after 24h. Each test was valid when the mortality of control tube met below than 5% under standard condition. The serial dilution of deltamethrin was varying from 0.005% to 0.06% (5 concentrations). The methodology adhered to guideline provided by WHO (WHO, 2016) and the impregnated insecticide paper were prepared by USM Penang. Probit analysis determined the LC50 and LC99 values and twice amount of LC99 established the diagnostic concentration to be used. Results and discussion The susceptibility of the laboratory inbred strain was confirmed by 100% mortality of Ae. albopictus against standard dosage of insecticide. According to WHO (2016), susceptibility to deltamethrin is indicated if the mortality between 98% - 100% while resistance is suggested if the mortality is less than 98%. Table 1 showed the result of percentage mortality of albopictus exposed to several type of insecticide. Based on the result obtained, almost all the albopictus mosquitoes were susceptible to insecticide. For this study, albopictus strain at F2 generation can be used as a reference for laboratory strain since the susceptibility towards different type of insecticide was higher. Deltamethrin and pemethrin are pyrethroid group of insecticide while primiphos-methryl is an organophosphate group. Variable group of insecticide act different mode of action against mosquito. Most current insecticides act on nerve and muscle targets (IRAC). Organophosphate inhibits AChE which causing hyperexcitation while pyrethroid group keeps sodium channel open. Albopictus strain was free from any insecticide resistance where the sample was collected in rural area far away from agriculture that have lower tendency of pesticide exposure. 59
66 Table 1: Susceptibility of laboratory strain towards variable of insecticide Type of insecticide Standard concentration (%) No. of female mosquito Replication No. of dead Mortality % Deltamethrin Pemethrin Primiphos-methyl Figure 1: Probit analysis for a serial dilution of deltamethrin against albopictus mosquitoes in Kuantan. R 2 : 0.77 LC : 0.05% 99 Albopictus strain has been verified as susceptible strain towards insecticide and tested to a serial dilution of Deltamethrin (0.06%, 0,04%, 0.02% 0.01% and 0.005%). Probit analysis obtained 0.05% as the LC99 for albopictus towards Deltamethrin (Graph 1). Diagnostic concentration set at twice the amount of minimum concentration to kill more than 99% mosquitoes. Currently, standard discriminating concentration used for deltamethrin against aedes mosquito is 0.05%. However, this concentration might not be applicable or reliable for all mosquito vector species. Then, the new baseline diagnostic concentration was measured at 0.1% which was higher than standard dosage endorsed by WHO. It can be deduced that the level of resistance mosquitoes is higher based on specific location in Kuantan. Similarly, a recent study carried out in Thailand established a higher concentration of pemethrin and deltamethrin for their resistance monitoring programme of Ae. albopictus (Thanispong et al. 2015). The study used different diagnostic concentration than the one recommended by WHO. This happen because there are different geographical structures that enable different life cycle and behavior of vector. The weather also contributes to different traits of vector. Conclusion Dengue vector control strategies are depending on the use of chemical insecticides. An established laboratory strain of albopictus is required to be used as the reference for susceptible strain. The increased number in generation of mosquito offspring has lower tendency towards insecticide resistance. In addition, condition and human activity at the collected sample will induce the resistance in mosquito. Routine for resistance monitoring is part of an effective intervention to reduce dengue transmission. The 60
67 findings in this research can be proceed for wild strains mosquito collected from different localities in Kuantan to detect the resistance level. However, it is undeniable that survival rate of adult mosquito is quite short and requires lengthy of time to maintain many adult female msoquitoes for sample collection. A proper plan and management should be optimized to produce a stable colonization of mosquito in insectarium. Acknowledgement We thank the Vector Control Unit, Pahang State Department of Health (JKNP) and National Institutes of Health (NMRR ) for their guidance and facilities and to the International Islamic University Malaysia for the fund under RIGS References IRAC [Insecticide Resistance Action Committee]. (2011). Prevention and management of insecticide resistance in vectors of public health importance [Internet]. Brussels, Belgium: Croplife International, Insecticide Resistance Action Committee [accessed September 18, 2019]. Available from: uploads/vm-layout-v2.6_lr.pdf. Kasai S, Ng LC, Lam-Phua SG, Tang CS,Itokawa K, Komagata O, Kobayashi M, Tomita T. (2011). First detection of a putative knockdown resistance gene in major mosquito vector, Aedes albopictus. Jpn J Inffect Dis64: Rezza G. (2012). Aedes albopictus and the reemergence of dengue. BMC Public Health. 12:1 3. Thanispong, Kanutcharee & Sathantriphop, Sunaiyana & Chareonviriyaphap, Theeraphap. (2008). Insecticide resistance of Aedes aegypti and Culex quinque fasciatus in Thailand. Journal of Pesticide Science-J PESTIC SCI /KPESTICS.g08-12 WHO (World Health Organization). (2013). Test procedures for insecticide resistance monitoring in malaria vector mosquitoes. World Health Organisation Technical Report Series, Wan-Norafikah O, et al. (2013). Susceptibility of Aedes albopictus Skuse (Diptera; Culicidae) to permethrin in Kuala Lumpur, Malaysia. Asian Biomed., 7:
68 2.3 Physichochemical properties of Khaki Campbell, Muscovy and Pekin duck feet gelatin extracted with acetic acid Fatin Arina Mohd Zain, Norshazila Shahidan, Nurul Huda, Zarinah Zakaria and Abdi Wira Septama Introduction Gelatin is a high molecular weight polypeptides with water soluble properties that was derived from collagen by thermal treatment hydrolysis (Bailey & Light., 1989; Kuan et al., 2016). The major source of gelatin production in Europe is 60% from pigs and another 40% of gelatin production are from bones and skin of cattle and other animal (Aykin-Dinçer et al., 2017). Nevertheless, the market for non-porcine and non-bovine gelatin has been increased recently by Kosher, Muslims and Vegetarian regarding the halal food issue and occurrence of diseases from bovine such as Bovine Spongiform Encephalopathy (BSE) and food and mouth diseases (FMD) (Karim & Bhat., 2009; Samsudin et al., 2018). Hence, another alternatives to gelatin is from mammalianderived source such as avian sources for example from duck feet (Kuan et al., 2016). Poultry intake per capita per year in Asia has raised by 30.5% which is from 6.6 kg to 9.5 kg with Malaysia reached 36 kg per capita per year (Supriatna, 2016; Wahyono & Utami, 2018). There was 0.8% increment of duck livestock population in Malaysia from 9.2 million to 10 million in 2017 and 2018 respectively (DVS, 2018). The increment in livestock production will also increase the waste production from duck. Hence, the duck feet can be turned into something beneficial such as gelatin from natural resources. This study focused on production of gelatin from acid pretreatment and comparison of physicochemical properties between three breeds of duck, Khaki Campbell, Pekin and Muscovy with commercial bovine gelatin. Materials and methods The Pekin duck feet was purchased from Perak Duck Food Industries Sdn Bhd, Khaki Campbell duck feet was purchased from 4R Agro Enterprise, Pasir Mas, Kelantan and Muscovy duck feet was purchased from duck farm at Kota Bharu, Kelantan. The raw materials were transported under refrigerated condition to Muscle Lab, Faculty Bioresources and Food Industry, University Sultan Zainal Abidin and stored at -18 C prior to use. Commercial bovine gelatin (CBG) was purchased from Halagel (M) Sdn Bhd, Sungai Petani, Kedah Darul Aman. Chemicals and reagents that were used were hydrochloric acid (J.T Baker, Center Valley, PA), citric acid (Bendosen, Batu Caves, Selangor), 1000 Kjeltabs Cu/3,5 (Foss Analytical A/S, Hillerod, Denmark), sodium hydroxide (Merck, Darmstadt, Germany), sulfuric acid (Merck, Darmstadt, Germany), boric acid (HmbG, Eschborn, Germany). 62
69 Gelatin extraction was done by following method by (Kuan et al., 2017). Frozen duck feet was thawed overnight in a refrigerator at 4 5 C. The duck feet then was grounded into small pieces and soaked in acetic acid (4.0%) for 16 hours. The raw materials were rinsed with running tap water until they reached ph 5.5, and then subjected to hot extraction for 12 hours. The liquid was sieved and then filtered. The filtered liquid was oven dried at 50 C for 12 hours. Lastly, the gelatin sheets was grounded and store at ambient temperature. The percentage of the gelatin yield was obtained by measuring the weight of gelatin powder (Nik Muhammad et al., 2018). The protein content of gelatin was determined according to AOAC (2005). The protein content was determined by Kjeldahl method AOAC (2005) with a protein factor of 5.55 to convert the nitrogen value to gelatin protein. The ph of gel is determined at room temperature (27 ± 1 o C) by preparing solution at concentration of 6.67% by mixing 6.67 g of gelatin powder into 100 ml distilled water (Samsudin et al., 2018). The bloom strength of gelatin are determined using texture analyser TA.XT plus (stable Micro Systems) g of gelatin was mixed with 100 ml distilled water in the bloom jar to produce 6.67% (w/v) gelatin solution to determine the bloom strength (Mhd Sarbon et al., 2013). Gelatin sample was subjected to FTIR analysis using an ATR-FTIR spectrometer, Shimadzu IR-Prestige-21 (Ahmad & Benjakul, 2011). The data were analyzed using statistical one-way analysis of variance (ANOVA) followed by Tukey test for mean comparison of Statistical Pa ckage for Social Science version 25 (SPSS inc, Chicago, Illinois, U.S.A). Significant different was define at p < Results and discussion Yield and protein content The yield and protein content of commercial bovine gelatin (CBG), Khaki Campbell duck feet gelatin (KCDFG), Muscovy duck feet gelatin (MDFG) and Pekin duck feet gelatin (PDFG) were shown at Table 1. The yield of duck feet gelatin extracted from the three different breeds of duck were significantly different at (p < 0.05). The gelatin yield was calculated as grams of dry gelatin per 100 g of raw duck feet with PDFG has the highest yield (1.91%) followed by KCDFG (1.65%) and lastly MDFG (1.40%). Nik Aisyah et al. (2014) reported that yield of Pekin Duck Feet Gelatin that was treated with 0.1M acetic acid was 2.48%. Meanwhile, in another study, (Mokhtar et al., 2017) reported that yield of chicken feet that was treated with acetic acid and enzyme papain is 12.63%.The differences percentage obtained in gelatin were causes by age of animals, species, degree of cross linking in the raw material, collagen content, proximate composition, and different method of extraction (Widyasari & Rawdkuen, 2014; Abedinia et al., 2017). Low yield percentage might be happen due to the various way of extraction method that can affect the properties of collagen extracted and different value of yield (Silva et al., 2014; Mokhtar et al., 2017).The loss of extracted collagen in the pretreatment process through leaching that happen during washing or incomplete 63
70 hydrolysis of collagen are factors that contribute to lower yield of gelatin (Mhd Sarbon et al., 2013; Widyasari & Rawdkuen, 2014). The gelatin sample showed high value of proteins with low moisture content value that range around 10% to 11%. Consumable gelatin is prescribed to has moisture content value that less than 15% (GME, 2005; Abedinia et al., 2017). Besides that, a low moisture content gelatin can prevent gelatin from become sticky and also prolonged the shelf life of the gelatin (Mohd Nazri & Syed Khair Azlan Jamalulail, 2012; Widyasari & Rawdkuen, 2014). Duck Feet Gelatin has a protein content value around 66.03% to 73.39% with Muscovy Duck Feet Gelatin (MDFG) has the highest amount and Khaki Campbell Feet Gelatin (KCDFG) has the lowest amount among the three breeds. There were significantly difference of protein value between Commercial Bovine Gelatin (CBG), Khaki Campbell Feet Gelatin (KCDFG), Muscovy Duck Feet Gelatin (MDFG) and Pekin Duck Feet Gelatin (PDFG). Widyasari & Rawdkuen. (2014) reported that the protein content of chicken deboner residue extracted with hydrochloric acid is 85.67%. Meanwhile, in another study (Abedinia et al., 2017) reported that the protein content of duck feet gelatin that was extracted with 0.05M acetic acid is 81.38% that is higher than this finding. Low protein content of gelatin sample is caused by termination of high hydrogen bonds and the excess opening of collagen structure which can cause amino acid extracted and separated from collagen and carried away by washing process (Samsudin et al., 2018). Table 4: Yield and protein content of commercial bovine gelatin (CBG) and four different species of duck feet gelatin (DFG) Sample Yield Protein CBG ± 0.57 d KCDFG 1.65 ± 0.05 b ± 0.18 a MDFG 1.40 ± 0.03 a ± 0.28 c PDFG 1.91 ± 0.04 c ± 0.13 b Means with different superscript letters within the same columns are significantly different at p < ph and Bloom strength The ph and Bloom Strength of commercial bovine gelatin (CBG), Khaki Campbell duck feet gelatin (KCDFG), Muscovy duck feet gelatin (MDFG) and Pekin duck feet gelatin (PDFG) were shown at Table 2. ph value of gelatin that using acid as pretreatment process must be within range 4.5 to 6.5 according to Gelatin Manufactures Institute of America (GMIA) standard 2013 (Samsudin et al., 2018). ph value of the extracted DFG ranged from 5.54 to 6.25 which were acidic with the value of CBG close to the value of PDFG indicating they are type B gelatin (Aykin-Dinçer et al., 2017). There was no significant difference of ph value between CBG, KCDFG and MDFG but significantly 64
71 different with PDFG. MDFG has the highest ph value, 6.25 followed by KCDFG, 6.18 and PDFG Chemical type and strength that was used during extraction process affected the ph value of the gelatin (Songchotikunpan et al., 2008; Widyasari & Rawdkuen, 2014). Samsudin et al. (2018) reported that the effectiveness of washing chemical from raw material before doing extraction process can produce a higher ph value gelatin. The gel strength of the gelatin can be categorized into three which are high (< 200), medium ( ) and low (> 120) bloom (Rafieian & Keramat, 2015). MDFG has the highest bloom value compare with other DFG and CBG. The gel strength of CBG and PDFG can be classified as medium gel value meanwhile MDFG is categorized under high gel value and KCDFG fall under low gel value. The difference of gel strength between different types of gelatin possibly due to difference in amino acid content and difference in protein chain composition (Kuan et al., 2017).The gel strength of duck feet gelatin might be related with the degree of protein degradation that happened during swelling and various heating process (Park et al., 2013). Gel strength is a function of complex interaction determined by amino acid composition and the a-chain and the amount of b- complex (Lassoued et al., 2014). The lower value of gel strength are due to the lower proline (Pro) and hydroxyproline (Hyp) content (Rafieian & Keramat, 2015). Table 5 : ph and Bloom Strength of commercial bovine gelatin (CBG) and four different species of duck feet gelatin (DFG) Sample ph Bloom Strength CBG 5.97 ± 0.02 b ± 0.52 c KCDFG 6.18 ± 0.00 b ± 0.15 a MDFG 6.25 ± 0.09 b ± 0.00 d PDFG 5.54 ± 0.28 a ± 0.00 b Means with different superscript letters within the same columns are significantly different at p < Fourier Transform Infrared Spectroscopy (FTIR) FTIR spectra of commercial bovine gelatin (CBG), Khaki Campbell duck feet gelatin (KCDFG), Muscovy duck feet gelatin (MDFG) and Pekin duck feet gelatin (PDFG) were shown at Figure 2. The FTIR fingerprint of all gelatin for three different species of duck feet (DFG) and CBG displayed the amide region as major peaks. The peak of amide bands for DFG exhibited the wavenumber around cm -1, cm -1, cm -1, cm -1 for amide I, II, III and A respectively. Meanwhile, FTIR spectra for CBG were not significantly different from all DFG with amide I, II, III, and A were 1631 cm -1, 1539 cm -1, 1394 cm -1 and 3284 cm -1 respectively. Amide A band location of the gelatin samples around cm -1 was closed to the free NH stretching frequency which indicate the involvement of NH group peptides in hydrogen bonding in the primary structure of gelatin (Shurvell, 2006; Kuan et al., 2017). Besides 65
72 that, amide band A also related to the CH stretch peak when carboxylic acid group existed in stable dimeric associations (Abdelmalek et al., 2016).The carbonyl bond (C=O) stretching of C-N bond that occurs at cm -1 in DFG and 1631 cm -1 in CBG indicate amide I in existence in gelatin sample (Chakka et al., 2017). The amide I band that located at cm -1 was associated with the secondary structure of protein and indicated the characteristics triple helix and random coil structure of gelatin (Muyonga et al., 2004; Kuan et al., 2016). The DFG sample also had peak at cm -1 and cm -1 which represented amide II band and amide III band. Meanwhile the position of amide II band and amide II band of CBG are 1539 cm -1 and 1394 cm -1 respectively. Amide II was an assigned of an out of phase combination of CN stretch and in plane NH deformation mode of the peptide group (Lavialle et al., 1982; Xu et al., 2017). The peak of amide III reflects the involvement of NH bending in the random coil or disordered structure (Kuan et al., 2016). The amide III vibration mode is the combination peaks between C-N stretching vibrations and N-H deformation from linkages as well as absorptions arising from wagging vibrations from groups (Widyasari & Rawdkuen, 2014). Figure 2 : FTIR spectra of commercial bovine gelatin (CBG) and four different species of duck feet gelatin (DFG) Conclusion Gelatin from the duck feet from three different breed of duck, Khaki Campbell, Muscovy and Pekin were successfully extracted by using acetic acid. Among all the Duck Feet Gelatin, PDFG has the highest yield followed by KCDFG and MDFG even though the yield were low compared to other study. Muscovy Duck Feet Gelatin (MDFG) has the highest amount of protein content and Khaki Campbell Feet Gelatin (KCDFG) has the lowest amount of protein content among the three breeds. ph value of the Duck Feet Gelatin are acidic indicating that they are type B gelatin with PDFG has the closest value to CBG 66
73 followed by KCDFG and MDFG. Meanwhile MDFG has the highest bloom strength value and KCDFG has the lowest bloom strength value. PDFG has the lowest melting temperature followed by MDFG and lastly KCDFG. The FTIR fingerprint of all gelatin for three different breeds of duck feet (DFG) displayed the amide region as major peaks. The peak of amide bands for DFG exhibited the wavenumber around cm -1, cm -1, cm -1, cm -1 for amide I, II, III and A respectively. Research on Khaki Campbell and Muscovy duck should be continuing on the future due to limitation of data in duck feet gelatin from these breed. Duck feet gelatin can be an alternative source for the production of gelatin from natural resources. Acknowledgement This work was financially supported by the Universiti Sultan Zainal Abidin, Malaysia through Special Research Grant Scheme (SRGS) UniSZA/2017/SRGS/03. References Abdelmalek, B. E., Gómez-Estaca, J., Sila, A., Martinez-Alvarez, O., Gómez-Guillén, M. C., Chaabouni-Ellouz, S., Bougatef, A. (2016). Characteristics and functional properties of gelatin extracted from squid (Loligo vulgaris) skin. LWT - Food Science and Technology, 65, Abedinia, A., Ariffin, F., Huda, N., & Nafchi, A. M. (2017). Extraction and characterization of gelatin from the feet of Pekin duck (Anas platyrhynchos domestica) as affected by acid, alkaline, and enzyme pretreatment. International Journal of Biological Macromolecules, 98, Ahmad, M., & Benjakul, S. (2011). Characteristics of gelatin from the skin of unicorn leatherjacket (Aluterus monoceros) as influenced by acid pretreatment and extraction time. Food Hydrocolloids, 25(3), Aykin-Dinçer, E., Koç, A., & Erbas, M. (2017). Extraction and physicochemical characterization of broiler (Gallus gallus domesticus) skin gelatin compared to commercial bovine gelatin. Poultry Science, 96(11), Chakka, A. K., Muhammed, A., Sakhare, P. Z., & Bhaskar, N. (2017). Poultry Processing Waste as an Alternative Source for Mammalian Gelatin: Extraction and Characterization of Gelatin from Chicken Feet Using Food Grade Acids. Waste and Biomass Valorization, 8(8), Haug, I. J., Draget, K. I., & Smidsrød, O. (2004). Physical and rheological properties of fish gelatin compared to mammalian gelatin. Food Hydrocolloids, 18(2),
74 Karim, A. A., & Bhat, R. (2009). Fish gelatin: properties, challenges, and prospects as an alternative to mammalian gelatins. Food Hydrocolloids, 23(3), Kuan, Y. H., Nafchi, A. M., Huda, N., Ariffin, F., & Karim, A. A. (2016). Effects of sugars on the gelation kinetics and texture of duck feet gelatin. Food Hydrocolloids, 58, Kuan, Y. H., Nafchi, A. M., Huda, N., Ariffin, F., & Karim, A. A. (2017). Comparison of physicochemical and functional properties of duck feet and bovine gelatins. Journal of the Science of Food and Agriculture, 97(5), Lassoued, I., Jridi, M., Nasri, R., Dammak, A., Hajji, M., Nasri, M., & Barkia, A. (2014). Characteristics and functional properties of gelatin from thornback ray skin obtained by pepsin-aided process in comparison with commercial halal bovine gelatin. Food Hydrocolloids, 41, Lavialle, F., Adams, R. G., & Levin, I. W. (1982). Infrared Spectroscopic Study of the Secondary Structure of Melittin in Water, 2-Chloroethanol, and Phospholipid Bilayer Dispersions. Biochemistry, 21(10), Mohd Nazri, A. R., & Syed Khair Azlan Jamalulail, S. A. (2012). Extractions, physicochemical characterizations and sensory quality of chicken feet gelatin. Borneo Science, pp Mokhtar, N. D., Wahab, W. A., Hamdan, N. A., Hadi, H. A., Shafiq, M., Hassan, A., & Bunnori, N. M. (2017). Extraction Optimization and Characterization of Collagen from Chicken (Gallus gallus domesticus) Feet Muyonga, J. H., Cole, C. G. B., & Duodu, K. G. (2004). Fourier transform infrared (FTIR) spectroscopic study of acid soluble collagen and gelatin from skins and bones of young and adult Nile perch (Lates niloticus). Food Chemistry, 86(3), Nik Aisyah, N. M., Nurul, H., Azhar, M. E., & Fazilah, A. (2014). Poultry as an Alternative Source of Gelatin. Health and the Environment Journal, 5(1), Retrieved from Nik Muhammad, N. A., Huda, N., Karim, A. A., & Mohammadi Nafchi, A. (2018). Effects of acid type extraction on characterization and sensory profile of duck feet gelatin: towards finding bovine gelatin alternative. Journal of Food Measurement and Characterization, 12(1), Park, J. H., Choe, J. H., Kim, H. W., Hwang, K. E., Song, D. H., Yeo, E. J., & Kim, C. J. (2013). Effects of various extraction methods on quality characteristics of duck feet gelatin. Korean Journal for Food Science of Animal Resources, 33(2),
75 Rafieian, F., Keramat, J., & Shahedi, M. (2015). Physicochemical properties of gelatin extracted from chicken deboner residue. LWT - Food Science and Technology, 64(2), Samsudin, F. S., Aminal lah, N., Mohd Zain, F. A., Kamarudin, A. S., Marlida, Y., & Huda, N. (2018). Physicochemical Properties of Quail Bone Gelatin Extract with Hydrochloric Acid and Citric Acid. Journal Agrobiotech, 9, Shurvell, H. F. (2006). Spectra Structure Correlations in the Mid- and Far-Infrared. Handbook of Vibrational Spectroscopy. Silva, T. H., Moreira-Silva, J., Marques, A. L. P., Domingues, A., Bayon, Y., & Reis, R. L. (2014). Marine origin collagens and its potential applications. Marine Drugs, 12(12), Songchotikunpan, P., Tattiyakul, J., & Supaphol, P. (2008). Extraction and electrospinning of gelatin from fish skin. 42, Wahyono, N. D., & Utami, M. M. D. (2018). A Review of the Poultry Meat Production Industry for Food Safety in Indonesia. Journal of Physics: Conference Series, 953(1), Widyasari, R., & Rawdkuen, S. (2014). Extraction and characterization of gelatin from chicken feet by acid and ultrasound assisted extraction. Food and Applied Bioscience Journal, 2(1), Xu, M., Wei, L., Xiao, Y., Bi, H., Yang, H., & Du, Y. (2017). Physicochemical and functional properties of gelatin extracted from Yak skin. International Journal of Biological Macromolecules, 95,
76 2.4 Physicochemical properties of duck (Khaki Campbell) skin gelatin pre-treated with acetic acid and citric acid Alya Afza Abdul Kadir, Nurul Huda, Zarinah Zakaria, Che Abdullah Abu Bakar and Norshazila Shahidan Introduction Gelatin is the main derivative of a collagen obtained by partial hydrolysis of collagenous material and has unique properties which are the ability to form thermo-reversible gels and emulsion (Rasli and Sarbon, 2015). These properties contribute to a wide range of application in many industrial fields such as food industry, pharmaceutical, cosmetic and photographic industry due to its functionality. According to Sompie et al. (2015) the higher quality of gelatin depends on its physical and chemical properties, rheological properties and manufacturing method. The awareness of the halal product is not only concerned for the muslim consumers but also non-muslim consumers. The non-muslim consumers preference about the halal issue is related to some factors such as hygiene, quality and safety of the product provided from a halal product. There are many issues related to the halal and one of them is gelatin. In addition, the halal issue is arisen when the gelatin used comes from prohibited sources such as porcine, the animal that is not slaughtered according to shariah law such as bovine (Fathin et al., 2018). For this study, Khaki Campbell duck species is chosen as a source of gelatin as it is known as one of the best, famous and most popular eggs laying breed of domestic duck. Nowadays, poultry skin, feet and bone have increased as sources to replace mammalian resources. Most of the previous study are focusing on the extraction of gelatin from pig skin, chicken skin and duck feet by using different extraction method and condition (Kim et al., 2014; Widyasari & Rawdkuen, 2014; Sompie et al., 2015). Duck skin might be used as a substitution source of bovine and porcine gelatin as reported by Lasekan et al., (2013) since gelatin from poultry by products receives some attention due to the waste generated during processing contains varying amount of protein and rich in collagen protein. Moreover, Malaysia is one of the leading countries that produce and export duck meats (Abedinia et al., 2017) which by this can supply sufficient duck skins as raw material for gelatin production in the industry. Therefore, the aim of this study was to investigate the suitability of duck skin as raw material for gelatin powder production in term of physicochemical characteristic and the yield of the gelatin extracted with two different acids (acetic acid and citric acid) and compared with the commercial bovine gelatin (CBG). Materials and methods The ducks were obtained from 4R Agro Dedak at Pasir Mas, Kelantan. All the duck skins were kept in a freezer with temperature below -18 C. Acetic acid and citric acid were 70
77 used in the gelatin extraction while 1-butanol was used to remove fat in the duck skins. The commercial bovine gelatin was purchased from Halagel (M) Sdn. Bhd. All the chemicals and reagents used were analytical graded. Sample preparation Duck skin gelatin was extracted according to Lee et al. (2012) with a slight modification. The frozen duck skins were thawed in the chiller at 5 C for 24 hours, cut into small pieces followed by fat removal. Duck skins were homogenized with 10% butanol by using blender followed by suspending in 10% (v/v) butanol solution with a ratio 1:8 (w/v) at 5 C to 7 C for 48 hours. The 10% (v/v) butanol solution was poured and changed for every 24 hours. Defatted duck skins were treated with 0.1 M acetic acid (CH3COOH) and 0.1 M citric acid (C6H8O7) respectively at a ratio 1:7 (w/v) for 40 minutes with gentle stirring by using magnetic stirrer. This step was repeated three times with alternated changed of acetic acid and citric acid solution. Then, duck skins were subjected to neutralize under running tap water approximately for 3 hours until obtained ph value 5. After that, the gelatin was extracted by water at a ratio of 1:1 (w/v) with the temperature of 65 C in water bath for 2 hours. The vacuum filtration was used to filter the gelatin solution. Duck skin gelatin (DSG) was then placed in the freeze dryer at temperature of -38 C for 72 hours until the moisture content of duck skin gelatin achieved was below 10%. Duck skin gelatin powder was kept in the tight container until used for the next analysis. Yield of gelatin The percentage of the gelatin yield was calculated according to Bueno et al. (2011). Protein recovery Protein recovery value was obtained according to Boran et al. (2009). Chemical composition of gelatin The chemical composition of duck skin gelatin powder were determined according to the method described by AOAC (2005). Bloom strength Bloom value of gelatin gel was determined according to Norziah et al. (2013). Texture analyzer TA-XT PLUS was used to determine the gel strength of the gelatin (Rahman & Jamalullail, 2012). 71
78 ph determination The ph value was determined according to See et al., 2010). Melting temperature determination The melting temperature of gelatin were measured using differential scanning calorimetry (DSC)(Norziah et al., 2013). Statistical analysis The data was subjected to the analysis of variance (ANOVA). A mean comparison was analysed by using Tukey Tests. Significance of difference was defined at p<0.05. The statistical package used was SPSS 20 (SPSS Inc, Chicago, IL). Results and discussion Based on the result in Table 1, the percentage yield of duck skin gelatin extracted using acetic acid obtained was 1.70 % and higher compared to duck skin gelatin extracted using citric acid, 1.32 %. Both acids were suitable to be used in gelatin extraction due to their smallest molecular size, low ionization constant (K) and ionic strength (Mahmood et al., 2016). However, the yield (%) of both DSGAa and DSGCa was lower than chicken skin gelatin extracted by using acid pre-treatment which was 2.16 % (Sarbon et al., 2013). The gelatin extraction yield on chicken feet skins and tendons was 7.83 % higher than chicken feet paws which was 7.37 % (Almeida & Lannes, 2013). The yield of chicken feet gelatin was higher than DSGAa and DSGCa due to the chicken feet had different amino acid composition compared to duck skin. Table 1 also showed that the protein recovery for DSGAa was 22.29% while for DSGCa was %. According to Teng (2014), the highest protein recovery of gelatin found in silver carp skin was 78.1 %. The poultry skin had abundant of stroma protein and the main content of stroma protein was collagen (Nik Aisyah et al., 2014). Table 1: Yield and protein recovery of duck skin gelatin acetic acid (DSGAa) and duck skin gelatin citric acid (DSGCa) Samples Yield (%) Protein Recovery (%) DSGAa DSGCa Based on the result in Table 2, there was significant different (p<0.05) in moisture content value between these three gelatins. The moisture content of DSGAa, DSGCa, and CBG were 9.39%, 6.47% and 11.21% respectively. The moisture content for DSGAa and DSGCa was lower than CBG which meant they undergone good drying process. Gelatin 72
79 absorbed or released moisture based on the humidity of the surrounding. Gelatin Manufacture Institute of America (GMIA) had prescribed the limit of moisture content for edible gelatin in the range of less than 15%. Thus, all these three gelatin had moisture content within the prescribed limit. Based on the previous study, moisture content for gelatin extracted from chicken skin gelatin was 9.81% (Sarbon et al., 2013) and chicken feet skins and tendons were 10.39% (Almeida & Lannes, 2013). When the moisture content exceeded 16% there was the increased risk of lump formation and microbiological growth. The low moisture content increased the shelf life of the gelatin with proper storage condition (Fathin et al., 2018). The value of protein of and DSGCa was 55.86% and 70.08% respectively lower than commercial bovine gelatin (CBG) which was %. The protein content of DSGCa had no significant different (p>0.05) with both CBG and DSGAa while DSGAa had significant difference (p<0.05) with CBG. The extraction temperature of DSGAa and DSGCa used was 65 C for 2 hours. Due to the elevated temperature during extraction, the gelatin might be degraded then caused the lower protein content. Based on the previous study by Mohd Nazri et al. (2015) showed that the protein content of chicken feet gelatin extracted at 75 C for 2 hours was 67.40%. The analysis of the protein was required due to the quality of the gelatin in which the bloom strength was related to the protein content (Fathin et al., 2018). From Table 2, the fat content showed a significant difference (p<0.05) between these three gelatins. The fat content in CBG was 0.18 % lower than DSGAa which was % and DSGCa which was %. Based on previous study conducted by Almeida and Lannes (2013 ), they have found 12.8 % fat in chicken feet, which was higher than the fat content of CBG in this study but lower than the fat content of DSGAa and DSGCa. This difference might be due to the greater efficiency of the filtration step, beyond the longer time the pretreatment acid of the raw material that contributed to the separation of fat and consequently a lower content of lipids in the final product. According to Sebastian (2014), skins poultry contained a lot of fat and industry usually used separators high performance and the fat obtained was purified. The ash content of CBG, DSGAa and DSGCa was 3.57%, 6.00% and 6.05% respectively. There was no significant difference (p>0.05) of ash content between DSGAa and DSGCa but there was significant difference (p<0.05) of ash content between these two gelatins with CBG. According to Food Act (2001) and Food Act 1983 and Food Regulations 1985, the permitted ash content of gelatin must not exceed 3% (Mohd Nazri et al., 2015). The ash content for CBG was still within an acceptable range but the ash content for DSGAa and DSGCa exceeded the prescribed limit. Previous study conducted by Huda et al. (2013) stated that the ash content for duck feet collagen was % while Kuan et al. (2017) reported that ash content for duck feet gelatin was within the range which was 2.47%. From the previous study by Almeida and Lannes (2013) the ash content of gelatin from the whole chicken feet was 6.03% and paws was 6.38% which was higher than 73
80 recommended value. This might due to the large amount of calcium and other salts present in bones. Table 2: Chemical composition of DSGAa, DSGCa and CBG Samples Moisture (%) Protein (%) Fat (%) Ash (%) DSGAa 9.39±0.33 b 55.86±4.62 a 23.76±2.41 c 6.00±0.87 b DSGCa 6.47±0.42 a 70.08±11.42 ab 16.66±0.11 b 6.05±0.42 b CBG 11.21±0.16 c 86.21±0.04 b 0.18±0.02 a 3.57±0.02 a Means with different superscript letters within the same column are significantly different at p < DSGAa, duck skin gelatin treated with acetic acid; DSGCa, duck skin gelatin treated with citric acid; CBG, commercial bovine gelatin. Data expressed as means of duplicate ± standard deviation The ph of DSGAa was 5.12 and DSGCa was 5.00 had significant different (p<0.05) to CBG which was 5.60 (Table 3). DSGCa had the lower ph of gelatin compared to other but it was still in the range of ph 5. The ph of gelatin could be affected by the types and strength of chemical used for pre-treatment according to Ratnasari (2016). Almeida and Lannes (2013) stated that the higher the ph value of gelatin was because of the effectiveness of washing the raw material after chemical treatments before extraction of gelatin. The low ph value for both DSGAa and DSGCa was due to the acid pre -treatment used before the extraction and differences in the type and strength of acids employed during the extraction procedures (Teng, 2014). GMIA standard (2013) stated that the ph value using the acid pre-treatment within the range of 4.5 to 6.0. Thus, the ph value for CBG, DSGAa and DSGCa were in the suitable range of ph. Perfect process of neutralizing and washing the raw materials before the extraction process resulted to have neutral ph values and could minimize the contamination (Sompie et al., 2015). DSGAa obtained the highest gel strength which was g with no significant different (p<0.05) with DSGCa which was g. The CBG had the lowest gel strength which was g. Bloom strength was the key to measure the quality and the amount of the gelatin needed for application in products (Almeida and Lannes, 2013). The measurement of this property was important both from the point of view of control as an indication for gelatin required for a particular application and that value was obtained according to standard methods developed by Gelatin Manufacturers In stitute of America (GMIA, 2013). The higher the bloom value, the stronger was the bloom strength (Abdullah et al., 2016). According to Nik Aisyah (2015), commercial bovine gelatin had values of gel strength range from 50g to 300g. Based on the result in Ta ble 3, the bloom strength of CBG, DSGAa and DSGCa in this present study was within the range. The gel strength values or bloom values were categorized in term of low (<120 g), medium ( g) and high (>200 g) bloom (Rafiean et al. 2015). Thus, DSGAa and DSGCa gelatins were grouped as medium quality of gelatin. The temperature where the gelatin gel softens known as melting temperature and it was one of the most important 74
81 physical properties to determine the quality of gelatin gels (Mariod and Adam (2013). Based on Table 3, the melting temperature of DSGAa, DSGCa and CBG was C, C and C respectively. From the previous study reported by Park et al. (2013), gelatin extracted from duck feet had the higher melting temperature which was C. There was no significant difference (p<0.05) between these three samples in terms of melting properties. According to Sarbon et al. (2013), the melting temperature of gelatin was greatly affected by the bloom strength and molecular weight distribution. Normally, gelatin with high bloom strength had the higher melting temperature of the gel at the same concentration (Fathin et al., 2018). In addition, Norziah et al. (2013) reported that the low melting temperature was due the weak structural stability of gelatin. Thus, based on the result, the melting point of DSGAa and DSGCa were comparable to the CBG. Table 3: ph value, bloom strength and melting temperature of DSGAa, DSGCa and CBG Samples ph Bloom Strength (g) Melting Temperature (ᵒC) DSGAa 5.12±0.07 a ±4.77ᵇ 37.06±0.73ª DSGCa 5.00±0.05 a ±5.50ᵇ 36.15±3.21ª CBG 5.60±0.10 b ±2.56ª 30.7±0.16ª Means with different superscript letters within the same column are significantly different at p<0.05. DSGAa, duck skin gelatin treated with acetic acid; DSGCa, duck skin gelatin treated with citric acid; CBG, commercial bovine gelatin. Data expressed as means of duplicate ± standard deviation. Conclusion Gelatin from duck skin was successfully extracted by using acetic acid and citric acid solution. The gel strength of DSGAa and DSGCa were categorize as medium bloom and has potential as source of high quality of gelatin. Method on extracting gelatin from duck skin should be studied to find the optimum condition for duck skin gelatin with the highest yield and protein recovery. A more efficient defatting duck skin should be studied as duck skin contain high fat content which will affects the purity and as well as the turbidity of gelatin extracted. Malaysia is the third largest country producing du ck meat, thus the duck skin as by product can be fully utilized to produce gelatin as gelatin from duck skin show good physicochemical properties. Acknowledgment This work was financially supported by the Universiti Sultan ZainalAbidin, Malaysia through Special Research Grant Scheme (SRGS) UniSZA/2017/SRGS/03. 75
82 References Abdullah MSP, Noordin MI, Nyamathulla S, Ismail SIM, Jasamai M, Wai LK and Shamsuddin AF (2016) Physicochemical evaluation and spectroscopic characterisation of gelatine from shank and toes of Gallus gallusdomesticus. Sains Malaysiana, 45(3), Abedinia A, Ariffin F, Huda N and Natchi AM (2017) Extraction and characterization of gelatin from the feet Pekin duck (Anasplatyrhynchosdomestica) as affected by acid, alkaline and enzyme pretreatment. International Journal of Biological and Macromolecules, 98, Almeida F and Lannes S (2013) Extraction and physicochemical characterization of gelatin from chicken by product. Journal of Food Process Engineering, 36(6), AOAC (Association of Official Analytical Chemists) (2005). Official Methods of Analysis. 18 th Edition. Washington DC: Association of Official Analytical Chemists. Boran G and Regenstein JM (2009) Optimization of gelatin extraction from silver carp skin. Journal of Food Science, 74(8), Bueno CM, Alvim ID, Koberstein TCRD, Portela MC and Grosso C (2011) Production of tilapia skin gelatin and its use in the production of micro -particles containing salmon oil. Brazilian Journal of Food Technology, 14(1), Fathin SS, Nuraliah A, Fatin AMZ, Ahmad SK, Yetti M and Huda N (2018) Physicochemical properties of quail bone gelatin extract with hydrochloric acid and citric acid. Journal of Agrobiotechnology, 9, GMIA (2013). Gelatin Manufacturers Institute of America Gelatin Handbook. p 15 Huda N, Seow EK, Normawati MN, NikAisyah NM, Fazilah A and Easa AM (2013) Effect of duck feet collagen addition on physicochemical properties of surimi. International Food Research Journal, 20(2), Kim HW, Park JH, Yeo EJ, Hwang KE, Song DH, Kim YJ, Ham YK, Jeong TJ, Choi YS and Kim CJ (2014) Effect of duck feet gelatin concentration on physicochemical, textural and sensory properties of duck meat jellies. Korean Journal for Food Science of Animal Resources, 34(3), Kuan YH, Nafchi AM, Huda N, Ariffin F and Karim AA (2017) Comparison of physicochemical and functional properties of duck feet and bovine gelatins. Journal of the Science of Food and Agriculture, 97(5), Lasekan A, Bakar AF and Hashim D (2013) Potential of chicken by-products as sources of useful biological resources. Waste Management, 33, Lee SJ, Kim KH, Kim YS, Kim EK, Hwang JW, Lim BO, Moon SH, Jeon BT, Jeon YJ, Ahn CB and Park PJ (2012) Biological activity from the gelatin hydrolysates of duck skin by-products. Process Biochemistry, 47(7), Mahmood K, Lubowa M, Fazilah A and Kamilah H (2016) Review of fish gelatin extraction, properties and packaging applications. Food Science and Quality Management, 56,
83 Mariod AA and Adam HF (2013) Review: gelatin, sources, extraction and industrial applications. ACTA ScientiarumPolonorumTechnologiaAlimentaria, 12(2), Mohd Nazri AR, Shariffah Azzainurfina SK and Azlan J (2015). Extractions physicochemical characterizations and sensory. Borneo Science, Nik Aisyah NM, Huda N, Mat Easa A and Fazilah A (2014) Poultry as an alternative source of gelatin. Health and Environment Journal, 5(1), Norziah MS, Badii F and Howell NK (2013) Preparation and characterization of chicken skin gelatin as an alternative to mammalian gelatin. Food Hydrocolloids, 30(1), Park JW, Choe JH, Kim HW, Hwang KE, Yeo EJ, Kim HY, Choi YS, Lee SH and Kim CJ (2013) Effect of various extraction methods on quality characteristics of duck feet gelatin. Korean Journal for Food Science of Animal Resources, 33(2), Rahman MNA and Jamalullail SASK (2012) Extraction, physicochemical characterizations and sensory quality of chicken feet gelatin. Borneo Science, 30, Rasli HI and Sarbon NM (2015) Effects of different drying methods on the rheological, functional and structural properties of chicken skin gelatin compared to bovine gelatin. International Food Research Journal, 22(2), Ratnasari IF (2016). Physico-chemical characterization and skin gelatin rheology of four freshwater fish as alternative gelatin source. AACL Bioflux, 9(6), Rafieian F, Keramat J and Shahedi M (2015) Physicochemical properties of gelatin extracted from chicken deboner residue. LWT - Food Science and Technology, 64(2), Sarbon NM, Badii F and Howell NK (2013) Preparation and characterization of chicken skin gelatin as an alternative to mammalian gelatin. Food Hydrocolloids, 30, Sebastian M (2014) Industrial gelatin manufacture-theory and practice. Retrieved from Theory_and_Practice on 30 January See SF, Hong PK, Ng KL, Wan Aida WM and Babji AS (2010) Physicochemical properties of gelatin extracted from skins of different freshwater fish species. International Research Journal Food, 17(3), Sompie M, Surtijono SE, Pontoh JHW and Lontaan NN (2015). The effects of acetic acid concentration and extraction temperature on physical and chemical properties of pigskin gelatin. Procedia Food Science, 3, Teng NY (2014). Physicochemical properties of pekin duck skin gelatin. Thesis of Bachelor of Technology, UniversitiSains Malaysia, Penang. Widyasari R and Rawdkuen S (2014) Extraction and characterization of gelatin from chicken feet by acid and ultrasound assisted extraction. Food and Applied Bioscience Journal, 2(1),
84 2.5 Calcium and phosphorus requirements of female Ayam Kampung MARDI (AKM) in pullet phases Introduction Siti Azimah Abdullah, Nur Imanina Mohd Ridwan Chee, Noraini Samat, Shamarina Shohaimi and Mohd Noor Hisham Mohd Nadzir Poultry production has an important in economic, social and cultural benefit and as role a nutrition supply in development country (Desalew Tadesse et al., 2013). Village chickens are the most common type of livestock in many rural areas (M Chibinga, 2016) and developing countries as a food source (Muhiye, 2007). Ayam Kampung MARDI (AKM) introduced at the Malaysia Agriculture, Horticulture and Agro-Tourism Exhibition (MAHA) The AKM slower growth rate in growth and production, poor laying ability and smaller egg size as compared to commercial breeds. It was to produce uniform in terms of body size, physical characteristics, growth and better laying chickens compared to the original breed. Calcium (Ca) and Phosphorus (P) is one of the key nutrients required for bone, egg quality, growth performance, layers and breeder. The Ca well over 90% found in the bone where it combines with P as second most important mineral element in bone, to from calcium phosphate crystals (Gordon & Roland, 1996) In feed nutrition other important element for body system including Na, Mg, Fe and Fi. In addition, phosphorus as essential component of almost all metabolic processes (McDonald et al., n.d.)the P content less than from Ca between 80 to 85% of the total phosphorus found in the bones function. Phosphates are used for metabolism and energy storage in formation of sugar phosphates and adenosine di- and tri- phosphates. Furthermore, P form part of a protein that contains phosphorus, nucleic acids and phospholipids (Driver, John Patrick, 1994). The chemical composition is also quite variable although it mainly consists of levels calcium and phosphorus in feed nutrition. In body skeleton allows an animal to stand and protects its internal organs system and tissues. The bone is living tissue and its structure is largely affected by the nature of stresses placed upon it. Village chicken as poultry have been developed for improved egg production or growth and meat production, the skeleton remains a potential in the physical support of heavier carcasses at ever younger ages (Applegate & Lilburn, 2000). The age AKM at Weeks 16 take a bone sample part of tibia right and left to compare content for quality and mineralized the bone. From the study, quality between right and left bone no significant different based on quality. In addition, the different levels of Ca and P between percentage low, medium and high have significant difference in bone 78
85 quality. The bone measurements such as weight, length, bone density and bone ash, have been used as indicators of bone status in the mineral nutrition of poultry. To our knowledge, a considerable amount of research has been conducted on the effect of feeding various Ca and P levels during pullet stages requirements. This experiment was conducted to investigate the effects of dietary Ca and P levels on bone quality. In addition, to compare tibia bone quality and mineralized content between right and left portion there have a difference or not. In this regard, the objective of the present study was to determine effect of difference level Ca and P in physical tibia bone quality and for part right or left bone have differences or not with pullet stages with AKM. Materials and methods The study preparation, sampling process, lab analysis and data analysing process conducted Malaysian Agricultural Research and Development Institute (MARDI) located at Serdang, Selangor. The department at MARDI is Livestock Science and Nutrition Program Research Centre Headquarters in Feed. The experimental design for this project is Complete Randomized Design (CRD) from Week 11 to 16. The treatment has 3 level Ca and P (Medium 0.90% (Ca) and 0.58% (P)), (High 1.15% (Ca) and 0.74% (P)) and (Low 0.75% (Ca) and 0.48% (P)). The percentage in diet based on recommended nutrients concentration levels (Lohmann Tierzucht, 2014)In this experiment have 9 cage and every cage have 13 bird per replicates, 39 bird per treatment, total bird is 117. Parameters measured are live weight (LW), bone quality by measuring the weight, dry matter (%), ash (%), length and density for both right and left tibia bone. The main sources of Ca are limestone and P is Dicalcium phosphate (DCP). Every treatment has similar ingredient for energy and protein but difference in level of Ca and P. Table1: Treatment level of Ca and P in chicken feed Stage Energy MJ/kg Pullet Protein (%) Treatment Ca (%) P (%) Low Medium High Before start the experiment on going for Proximate Analysis to determine feed nutrition content. The method of proximate analysis was implemented to determine the percentage of Dry Matter (DM), Ash, Crude Protein (CP), Crude Fibre (CF), Neutral Detergent Fibre (NDF), Acid Detergent Fibre (ADF), Ether Extract (EE). Samples take after slaughter with 6 bird per treatment were randomly selected and weighed (1.6kg- 1.8 kg). The sample part removes from the body and each sample were individually packed in polyethylene bags and stored at -20ᵒC prior to bone preparation. 79
86 Bone were cleaned of the adhering tissues and dried in the oven at 105 ᵒC for 24 h standard procedure according to AOAC Official Method Dry weights were recorded after cooling in a desiccator. The bone parameters including dry weight, length, density and ash were determined according to Zhang and Choon (1997). Dried tibiae were ashed in a muffle furnace at 600ᵒC for 24 h or overnight, cooled in desiccator before the weight were recorded for ash content. Data were analysed using the ANOVA using the general linear model (GLM), multiple comparison of means using Duncan method procedures of IBM SPSS Statistics. Results and discussion The result from study for difference part between right and left is no significant difference in bone weight, dry matter, length, density and ash. Levels Ca and P no significant difference between each treatment in bone weight, dry matter, length, density and ash. Table 2: Effect of levels dietary calcium and phosphorus on physical tibia bone quality. Values are means represent ± standard deviation Bone sample Right Left Ca and P levels Bone weight (g) Dry matter (g) Length (mm) Density (g/cm 3 ) Ash (%) Low ± ± ± ± ± 3.96 Medium ± ± ± ± ± 1.79 High ± ± ± ± ± 1.57 Low ± ± ± ± ± 2.94 Medium ± ± ± ± ± 1.77 High ± ± ± ± ± 2.20 Bone weight measurements between part of right and left tibia are presented in table 2. For the part between right or left no significant. In additio n, for the level Ca and P no significant between level low, medium and high. The mean each level between g to g for low and medium but level high achieve until g. In general terms, the weight of a specific ingredient come from either the moisture in the material from the dry matter (DM) portion. Dry matter refers to material remaining after removed of water, and moisture content reflects the amount of water present. For the right part have a high of value dry matter at level medium and high between 8.40 g. The left part no significant between level low 8.11 g, medium 8.17 g and high 12.81g. Dry matter physical bone quality for difference part right and left no significant difference. In bone quality for bone density is one of the most important factors to measure. In addition, bone density values are affected by many factors, such as age, sex, type of production, diet and management. From the result table 1 with difference part right or left no significant difference. For levels Ca and P no significant difference between low medium and high. High level Ca and P is the higher value for density. For 80
87 low and medium density value between 1.21 to 1.23 g/cm 3. Bone density also be measured using bone mineral composition, bone breaking and seedor index (Address, 2006). Skinner et al. (1991) reportrd on the effects of dietary protein, calcium and phosporus on tibia length and ash. However, effects from feed restriction and environment on long bone development (Bruno et al, 2000). The correlated can be found between increased bone ash, higher amount of availeble calcium and phytate phousphorus in the diet and incresed body weight gain (Hall et al., 2003). The result from table 1 in level bone ash no significant diffrence between levals Ca and P and part of bone right or left. There are physiologically distinct regions of a growing bone, each with its own unique developmental characteristics. The tibia particularly the epiphyseal end, has been extensively studied due to cellular sensitivity to numorus dietary deficiencies. The significant differences between long bones in ter ms of mineralization, there have been few reports since that have specifically addressed age and body weight relationships with comprehensive long bone development (Dilworth & Day, 1965) Conclusion As a conclusion in study effect of level Ca and P in dietary with physical bone quality no significant difference between each level low, medium and high. For the part between right or left no significant difference during study in pullet stage with AKM. The calcium and phosphorus are important mineral in body system for growth performance, egg quality, bone mineralization, and nutrient utilization. For this study are important to determine the exact Ca and P requirements in feeds for AKM to avoid overfed or malnutrition in growth Acknowledgement We would like to thank Department of Biology, Faculty Science, Universiti Putra Malaysia UPM Serdang and Feed and Nutrition programme (LS4) Livestock Science Research Centre Headquarters MARDI, Persiaran MARDI-UPM Serdang. References Applegate, T. J., & Lilburn, M. S. (2000). Growth of the Femur and Tibia of a Commercial Broiler Line 1, (1991), Dilworth, B. E. N. C., & Day, E. J. (1965). Effect of Varying Dietary Calcium : Phosphorus Ratios on Tibia and Femur Composition of the Chick 1, (1960), Driver, J. P. (n.d.). Performance And Bone Quality Of The Modern Broiler Chicken, (1994). Gordon, R. W., & Roland, D. A. (1996). The Influence Of Dietary Calcium And Protein On Third Cycle Hens, (12). Hall, L. E., Shirley, R. B., Bakalli, R. I., Aggrey, S. E., Pesti, G. M., & Edwards, H. M. (2003). Power of Two Methods for the Estimation of Bone Ash of Broilers 1, Lohmann Tierzucht. (2014). Lohmann Brown-Lite Layers. McDonald, P., Edwards, R. A., Greenhalgh, J. F. D., Morgan, C. A., Sinclair, L. A., & Wilkinson, R. G. (n.d.). Animal Nutrition Seventh Edition. 81
88 2.6 An assessment of reproductive and stress hormone and their relation with reproductive behaviour of captive female Rusa unicolor (Sambar deer) Junaidi Omar, Geetha Annavi, Abd Wahid Haron, Wan Noor Fitri Wan Jaafar, Anna Aryani Amir and Mohd Noor Hisham Mohd Nadzir Introduction Peninsular Malaysia is undergoing a tremendous encroachment and land development which results in the rainforest environment being changed drastically. Therefore, there is urgent need to constantly manage the existing wildlife and habitats, to sustain, protect, preserve and propagate wildlife species. (Zaaba et al. 1991). Apart from habitat encroachment, illegal hunting also caused the decreasing population of local species including the Malayan Tiger (Panthera tigris jacksoni). Currently, the Malayan tiger subspecies which was first formally recognized in 2004 after genetic tests is listed as Endangered by the IUCN Red List. The Department of Wildlife and National Parks of Peninsular Malaysia (DWNP) believe the status may have to be changed to Critically Endangered given the recent estimates. According to the Ministry of Water, Land and Natural Resources, to date, the Malayan tiger is less than 200 in the wild population. The main reasons are illegal trade and poaching due to high demand in the black market. In between year 2013 to 2018 has reported number of poachers saw significantly increased with 98 locals and 64 non-locals. 3,500 snares were cleared. Another threat facing the Malayan tiger is a decline in tiger prey, pointing especially to a loss of Sambar deer to hunting and snares. In Malaysia, tiger prey populations appear to be declining. Species of Sambar deer among the favourite by local for hunting and being poached at all time. (Zaaba et al. 1991). Sambar deer has lost more than 50% of its habitat range, currently only a quarter is protected. Recommended stated in IUCN Red List as Endangered (Kawanishi et al., 2014). Ex situ conservation efforts i.e, captive breeding are being taken by government to boost Sambar deer numbers in captivity and then reintroduce in the wild to support a higher number of tigers, consistent with the goal of our National Tiger Conservation Action Plan to increase tiger numbers. The reproductive success of Sambar deers and their welfare management practices in captivity are important components for effective captive breeding programmes. DWNP has set up three breeding centres for Sambar deer at Sungkai in Perak, Jenderak in Pahang and Gua Musang in Kelantan (Habsah, 1985; Pan & Sabri, 1989). Since DWNP has implemented a captive breeding programme, efforts must be focused on the reintroduction programme. It is crucial to assess the effectiveness of this programme (Mohammad, Shukor, Mohd & Mohd, 2001). Environment factors have significant impact on natural behaviour of animals (Kchan, 2014) especially the reproductive state, which can be affected by both daily activity and space use of the animal (Mahdive, 1984). Environmental surroundings that changes 82
89 rapidly may also triggered an increment of cortisol (an example of glucocorticoids) secretion rates which lead to phsycological stress responses in animal (Wingfield et al. 1958, Ficinero, 2002). Changes in the social environment especially through social conflicts even within their own species will intensity affect their physiological stress (Goymann et al Franceschini et al. 2007, Kuo Jong & Lai, 2011) could lead to significant impact on their natural reproductive and stress behaviour in both captivity and wild habitat. A study conducted in Zoo Melaka concluded that Sambar deer spot less time interacting with conspecies (Sun and Rahman, 1989). Unfortunately, throughout their study they were not being able to observe any mating as they are known to be shy. Many other species placed in captivity and continuously shown exhibit abnormal behaviour due to having poor health problem, repeative stereotypic behaviour and breeding difficulties. (Clubb and Massion, 2002, Mason et. al, 2007) due to the increasing number of visitors and restrictive enclosure space (Hosey, 2005). However, there is no study yet to determine whether these factors are affecting the conservation and welfare of Sambar deer. The study of Sambar deer by traditional field methods is also difficult due to therapy, cryptic and nocturnal behaviour, solitary social structure and preference to inhabit deep tropical forest (Marine, 2003). Recent advances non-invasive measurements (Karsley and Dehirhard, 2014 Narbeth et. al, 2014), Bahringer and Deschiner 2017) of reproductive and stress hormones via faeces samples reflect the endocrine behavioural stress which can provide an alternative way to study the relationship of reproductive and physiological stress responses with their behaviour (Sheriff et. al, 2011: Cook, 2012). Responses to stressors are complex and context dependent and therefore a combination of different measurements of (physiological and behavioural) for assessment stress and reproductive behaviour should be considered. Stress in mammals is a complex and multistage syndrome that is orchestrated by the sympathetic nervous system and glucocorticoids, a class of steroid hormones (Sapolsky, 2001). A common practical technique for assessing the stress response in animals is to monitor adrenocortical activity by measuring glucocorticoids and their metabolite s in blood, saliva and body excretions. The measurement of glucocorticoid metabolites excreted in the faeces allows for collection and analysis without handling the animals. This is especially important in large mammals and endangered species where repeate d capture and handling is not possible. Another advantage of faecal analysis is that it minimizes interference with natural behaviours. Animals can be observed through binoculars from a distance, defecation locations noted, and samples collected after they have moved away. Although there are many advantages, there are also several confounding factors that need to be considered and minimized when applying this technique in wildlife field studies and in investigating conservation issues (Millspaugh & Washburn, 2004; Palme, 2005; Touma & Palme, 2005; Keay et al., 2006). 83
90 Faecal endocrinology has important applications for wildlife conservation because it facilitates the non-invasive monitoring of adrenal activity in wild animal populations (Möstl and Palme, 2002; Sheriff et al., 2011; Wasser et al., 2000; Watson et al., 2013). The concentration of faecal glucocorticoid metabolites (fgcm) is a reliable indicator of biologically active ( free ) glucocorticoid metabolites circulating in an animal body over a period of time and, importantly, wildlife faeces are easier to collect than alternative biological samples such as blood, saliva, or urine (Möstl and Palme, 2002; Touma and Palme, 2005). Non-invasive endocrinology testing using faecal samples or another method (e.g. hair, feathers and scales) is a fast-growing research field (Brown, 2000; Ganswindt et al., 2012; Hodges, 2005). The ability to carry out continuous health monitoring on free ranging wildlife without the need for capture is an attractive prospect for wildlife conservation and management. Discussion This study will be conducted by using non-invasive faecal sampling to obtain hormonal profiles without the animal being sedated or restrained and it has not been tested in captive Sambar deer. This will be the advantage of this research. A non-invasive method will be measured by using a faecal sample to determine the assessment of the stress hormone to relate with the reproductive behaviour. Faecal samples offer the advantage that they can be collected easily. In faecal samples, circulating hormone levels are intergrated over a certain period and represent the cumulative secretion of hormones. (Palmae, 2012). However, diminutive information reported at present, regarding reproductive traits of this subspecies in Peninsular Malaysia. Therefore, the aims of this study are to access and manuscript the reproductive and stress hormones in captive female Sambar deer by using faeces and to correlate with their behavioural patterns for a better understanding and significance of captive breeding management programmes. Furthermore, it is expected the sexual activity and the circumstance being under stress in captivity can be forecast by associating hormonal and behavioural data. In addition, this will help for enhancement welfare captive management plan as well as wildlife exsitu programmes. Conclusion Conservation of Sambar deer is extremely important especially now that the species has been listed as Vulnerable by the IUCN. The study on the reproductive and stress hormone patterns with the animal s physiology and reproductive behaviour are essential for the sustainability management of this species both in the natural habitat as well as in captive environment. It is expected, the reproductive and stress hormonal practise can be predicted via behaviour pattern for future breeding programme and welfare under captivity. This assessment will be useful to the understanding of the 84
91 important and significant role of Sambar deer towards biodiversity and ecological value as well as to provide an approaching idea about the focal prey for our endangered national iconic species, the Malayan tiger. Acknowledgments The research was supported by the Management and staffs of Zoo Negara Malaysia. Authors gratefully acknowledge the Department of Zoology and the Department of Veterinary Hospital for providing facilities for the research. Thanks to the Director, Curator, Veterinarians and Supervisors. The help by the Zoo Keepers are also acknowledged. References Arumugam KA, Luan LQ, WNW Ibrahim, MM Toh, CD Buesching and Annavi G (2018). Influence of enclosure conditions and visitors on the behaviour of captive Malayan tapir (Tapirus indicus): Implication for ex situ management and conservation; International journal of scientific and research publications (IJSRP) 8 (7) (ISSN: ) Epel E, Horgan K, Stone A, Greenberg J, Hayaki J, Kingston S, Whisman M and Brownell K, (2000) Cortisol reactivity, stress and personality as predictors of stress -induced eating among women (submitted for publication). Epel E, Lapidus R, McEwen B and Brownell K. (2001) Stress may add bite to appetite in women: a laboratory study of stress-induced cortisol and eating behavior. Psychoneuroendocrinology, 26(1) Forsyth DM, McLeod, SR, Scroggie MP and White MD (2009) Modelling the abundance of wildlife using field surveys and GIS: non-native sambar deer (Cervus unicolor) in the Yarra Ranges, South-eastern Australia. Wildlife Research, 36(3), 231. Franceschini MD, Rubenstein DI, Low B and Romero LM (2008) Fecal glucocorticoid metabolite analysis as an indicator of stress during translocation and acclimation in an endangered large mammal, the Grevy s zebra. Animal Conservation, 11(4) Habsah M (1984) Sambar deer biology data collected from seven states of Peninsular Malaysia during hunting seasons, October to November 1982 and J. Wildl. Parks, 3, Hellhammer DH, Wüst S, and Kudielka BM (2009) Salivary cortisol as a biomarker in stress research. Psychoneuroendocrinology, 34(2), Huber S, Palme R and Arnold W (2003) Effects of season, sex and sample collection on concentrations of fecal cortisol metabolites in red deer (Cervus elephus). General and Comparative Endocrinology, 130, IUCN (2019) IUCN redlist of threatened species, Version , 85
92 Kawanishi K (2008) Questioning the sustainability of legal hunting of deer and pig in Peninsular Malaysia. Unpublished report submitted to the Department of Wildlife and National Parks. Kawanishi K, and M Sunquist (2004) Conservation status of tigers in a primary rainforest of Peninsular Malaysia. Biological Conservation, 120(3), Kawanishi K, GR Clements, M Gumal, G Goldthrope, Y Mohd Nawayai, and DSK Sharma (2013) Using BAD for good: how best available data facilitated a precautionary policy change to improve protection of the prey of the tiger Panthera tigris in Malaysia. Oryx 47(3): Keay JM, Jatinder S, Gaunt, MC and Kaur T (2006) Fecal glucocorticoids and their metabolites as indicators of stress in various mammalian species: A literature review. J. Zoo Wildl. Med. 37, Khan M, KM (1971) The distribution of large animals in Taman Negara. Malay. Nat. J. 24: Lane J. (2006) Can non-invasive glucocorticoid measures been used as reliable indicators of stress in animals? Anim. Welfare, 15, Laws N, Ganswindt A, Heistermann M, Harris M, Harris S, and Sherwin C (2007) A case study: Fecal corticosteroid and behavior as indicators of welfar e during relocation of an Asian elephant. Journal of Applied Animal Welfare Science, 10, Matousek RH, Dobkin PL, and Pruessner J (2010) Cortisol as a marker for improvement in mindfulness-based stress reduction. Complementary Therapies in Clinical Practice, 16(1), Mauget R, Mauget C, Dubost G, Charron F, Courcoul A and Rodier A (2007) Non-invasive assessment of reproductive status in Chinese water deer (Hydropotes inermis): Correlation with sexual behaviour. Mammalian Biology - Zeitschrift Für Säugetierkunde, 72(1), Putranto HD, Kusuda S and Doi O (2005) The compatibility between musth and estrus in the reproductive cycle of Asiatic elephants by non-invasive measurement. In: Indonesian student meeting. Nagoya University, Japan, 1-2 September 2005 Putranto HD, Soetrisno E and Nurmeiliasari (2008) Reproductive physiology of sambar deer (Cervus unicolor equinus), Bengkulu endemic ruminant. LPPM Universitas Bengkulu, Indonesia. [Indonesian] sambar deer (Cervus unicolor) in East Kalimantan. Biodiversitas, 6(1): Putranto HD, Soetrisno E, Nurmeiliasari, Zueni A and Gibson B (2010) Recognition of seasonal effect on captive Sumatran sambar deer reproductive cyclicity and sexual behaviours. Biodiversitas, 11: Rajagopal T, Archunan G, and Sekar M. (2011) Impact of zoo visitors on the fecal cortisol levels and behaviour of endangered species: Indian blackbuck antelope (Cervicapra l.). Journal of Applied Animal Welfare Science, 14(1), Schmidt AM, Hess DL, Schmidt MJ and Lewis CR (1993) Serum concentrations of oestradiol and progesterone and frequency of sexual behaviour during the normal estrous cycle in the snow leopard (Panthera uncia). J Reprod. Fertil. 98:
93 Schmidt AM, Hess DL, Schmidt MJ, Smith RC and Lewis CR (1988) Serum concentrations of oestradiol and progesterone and sexual behaviour during the normal oestrus cycle in the leopard (Panthera pardus). JReprod Fertil 82, Sekar M, Rajagopal T, and Archunan G (2008) Influence of zoo visitor presence on the behaviour of captive Indian gaur (Bos gaurus gaurus) in a Zoological Park. Journal of Applied Animal Welfare Science, 11(4), Sekar M, Rajagopal, T, and Archunan G (2008) Influence of zoo visitor presence on the behavior of captive Indian gaur (Bos gaurus gaurus) in a zoological park. Journal of Applied Animal Welfare Science, 11, Semiadi G (2002) Tropical and non-tropical deer farming potency. Ps Ilmu Hayati IPB, Bogor. [Indonesian] Semiadi G and Nugraha RTP (2004) Tropical deer management. LIPI, Bogor. [Indonesian] Semiadi G, Muir PD and Barry TN (1994) General biology of sambar deer (Cervus unicolor) in captivity. New Zealand J Agric Res 37, Semiadi G, Muir PD, Barry TN, Veltman CJ and Hodgson J (1993) Grazing pattern of sambar deer (Cervus unicolor) and red deer (Cervus elaphus) in captivity. New Zealand J Agric Res 36, She-Jin L, Lin Y, Yu-qing L, Yan Y, Guo-Hong C and Wan-Hong W (2007) The effect of visitor density on the behavior of the captive fallow deer (Dama dama). Res J Anim Sci 1. 3, Soetrisno E, Putranto HD and Nurmeiliasari (2009) Reproductive physiology of sambar deer (Cervus unicolor equinus), Bengkulu endemic ruminant. LPPM Universitas Bengkulu, Indonesia. [Indonesian] Timmins R, Kawanishi K, Giman B, Lynam A, Chan B, Steinmetz R, Sagar Baral, H and Samba Kumar N (2015) Rusa unicolor. The IUCN Red List of Threatened Species 2015, Van Mourik S (1986) Reproductive performance and maternal behaviour in farmed rusa deer (Rusa timorensis). Applied Animal Behaviour Science, 15, 2, Van Mourik S (1986) Reproductive performance and maternal behaviour in farmed Rusa deer (Cervus timorensis). Applied Animal Behaviour Science, 15(2), Van Mourik, S., Expression and relevance of dominance in farmed Rusa deer (Cervus (Rusa) tirnorensis). Appl. Anim. Behav. Sci., 14, Zaaba ZA, A Mohd Tajuddin, AR Mustafa and Y Ebil (1991) Large Mammals in Peninsular Malaysia. The Status of Nature Conservation in Malaysia. Malayan Nature Society. Petaling Jaya, Malaysia
94 2.7 The effect of different concentration of livestock fertilizers on growth performances of Azolla pinnata Introduction Mohammad Fitri Rimi Hamidan, Anis Ibtisam Mohd Nazri, Habsah Bidin, Noraini Samat and Mohd Noor Hisham Mohd Nadzir The demand for goat, cow and broiler meat especially in Malaysia keep increasing and sustainable supplies of these meats are very crucial. Thus, persistence of fodder resources availability in rearing the livestock able to sustain the production of animal`s product. Unfortunately, fodder resources are another aspect that draw greater concerns among the farmer to raise their livestock for a sustainable production due of the urbanization and high cost of commercial animal feed. Urbanization has leads to less availability of pastureland for animal (Banu & Fazal, 2016). Hence, these will cause shortage of fodder as the farmers cannot cultivate feed crop for their livestock. The alternative ways to overcome those problems is by using Azolla pinnata that is the most economical friendly, have a rapid production and efficient feed substitution (Tamizhkumaran & Rao, 2016). Yet, it has great potential in order to produce fodder to livestock. Morphology of Azolla pinnata Morphologically, A. pinnata is small free-floating fern that known as mosquito fern usually grows in stagnant water bodies thus it was suitable to be cultivated in ponds, pit, and tanks (Becking, 1979). This plant where able to produce fresh weight up to 600 g after 10 days. The body of this tiny aquatic macrophyte can be divided into three parts which is leaves, stem and roots. The leaves were measured approximately 1-2 millimeters ( Global Invasive Species Database, 2018) with an overlapping arrangement and the stem is often called the rhizome and the root a feathery appearance in the water (Jacono, 2016). In addition, its leave cavity had become a host for one species of cyanobacteria called Anabaena azollae (Hove & Lejeune, 2002) that capable in nitrogen-fixing from air (Punita & Soma, 2015). These relationships give great advantage to this plant in their composition of protein (Kamalasanana Pillai et al., 2005). Nutritional compositions of Azolla Pinnata The nutrition composition is very crucial to be tested first on feed crop before been introduce in animal diet, this due to the animals nutrition requirement might be vary among different species such as poultry, cattle, goat and swine. Therefore, when the nutrition content of the feed crop is low these leads to malnutrition as they do not meet an enough requirement for their body to function well (Fernandez, 2017). A. pinnata 88
95 has been reported to consist high content of protein including an essential amino acid such as Lysine to promote growth of animal and their live performance. Moreover, this plant also has been identify growing with rich of vitamin such vitamin A, B12, Beta - Carotene and mineral (Kamalasanana Pillai et al., 2005). Therefore, Aziz (2006) had suggested that Azolla is one of the excellent fodder resources in livestock feeding diet. In other hand, the variation had been reported in several studies in the nutrition composition of A. pinnata which is from study that been done by Singh and Subudhi (1978), Anand Titus and Geetha Pereira (2007), Alalade and Iyayi (2006) and Balaji et al., (2009) is presented in the Table 1. Table 1: The nutritional composition on dry matter basis of A. pinnata Nutritional Composition Singh and Subudhi (1978) Alalade and Iyayi (2006) 89 Anand Titus and Geetha Pereira (2007) Balaji et al., (2009) Nutritional value (%) Crude protein 24.3% 21.4% 20% - 25% 24.5% Crude fiber 9.1% 12.7% % Ether extract 3.6% 2.7% 3% - 3.5% 3.7% Total ash 10.5% 16.2% - 17% Mineral (%) Calcium 0.4% - 1.0% 1.16% 0.45% % 2.14% Phosphorus 0.5% - 0.9% 1.29% 0.15% - 11% 0.44% (Source: Bolka, 2011) Cultivation using organic fertilizer Cultivation of the feed crop is very important to sustain fo dder supply to support in livestock industry. Utilization of chemical fertilizer such as Triple Super Phosphate (TSF) able to speed up the crop growth and development (Singh & Singh, 1987). But it has cause serious pollution into water resources (Wu, 2017) and yet, it will increase production cost due to the pricy of the fertilizer. Therefore, the farmer tends to apply organic fertilizer such as cow manure, goat manure and chicken manure to their crop (Mahadi et al., 2013). Materials and methods This study was conducted from March 2018 until September 2018 and has been located at MARDI Serdang for cultivation and sampling. Next, data of plant performance was calculated at department of Biology, UPM while nutritional analysis were done at Feed Chemistry Laboratory of Livestock Science Research Centre, MARDI Serdang. The study was started with cultivation of Azolla pinnata at approximately 152m 2 plot by using 15 pieces 200L plastic tank with arrangement according to Randomized Complete Block Design (RCBD) experimental design. There were 3 types of organic fertilizers been used in this experiment which is collected from MARDI s goats and chicken housing units and the small holder beef farm at Sg. Ramal, Kajang. All the animal s
96 manure was dried at 60 C for 48 hours using Force-air drying oven before it s been grinded into <1mm size using electric mash grinder. Then, all grinded animal manure was weighed into 50 g, 100 g, 150 g, 200 g, and 250 g which coincides with their treatment. The cultivation of Azolla was carried out for 14 days using 1 meter (L) 0.66 meter (W) in size plastic tank. Approximately 132 L of water was filled 2 days before diluting mash of animal manure with an initial 10 kg inoculum of fresh Azolla. As a treatment, the weighted animal manures were diluted into the water according to treatment T1, T2, T3, T4 and T5 which is 50 g, 100 g, 150 g, 200 g and 250 g, respectively. It was stirred until evenly distributed in the water. The temperature and ph were monitored using YST water quality meter while the growth rate of A. pinnata was measured using simple quadrat technique. Both parameters were daily monitored and recorded. Harvesting was conducted on day-14 after cultivation. The sieve container was used to drain out water from the harvested plant before it been weighted for fresh yield recording. Next, the fresh Azolla were placed into the aluminium container and been dried into force-air drying oven at 60 C for 72 hours (Ooi, Iqbal, & Ismail, 2012). The dried Azolla were cooled into the desiccator before being weighted using digital weight balanced. Doubling time and the relative growth rate of Azolla were being calculated by using the formula that had been described by Subudhi and Watanabe (1981). Next, the dried sample of Azolla was ground using Waring Commercial Blender about <1 mm and to make it suitable for proximate and fiber component analysis (Kavya, 2014, p. 27; Ooi et al., 2012). Proximate analysis has been conducted to determine a total dry matter, crude protein, crude fiber, ether extract and inorganic matter of all the treated A. pinnata. The procedure was done according to AOAC (2005) procedure. Meanwhile, fiber component such as NDF and ADF were identified using Van Soest s method (1981). All data were analyzed by using IBM SPSS Statistics 23. Two-way ANOVA test was conducted to analyze the mean of the parameter with two independent factor which is three type of dung manure (goat, chicken, cow) and five different concentration of dung (50 g, 100 g, 150 g, 200 g, and 250 g) were compared using ANOVA and Post Hoc determination by Duncan. Results and discussion From the data obtained during the 14-days observation, relative growth rate of A. pinnata cultured in 200 g and 250 g of goat manure dilution were significantly high than other treatment as showed at Table 2. This could be attributed with the study performed by Nordiah, Sidik, Muta Harah, Wan Hazma (2012) which has highlighting the correlation of nutrient composition from different type of water source with the growth of A. pinnata. There also had reported the growth performance of A. pinnata in different type of water source show a vary increase in plant biomass as this due to the nutrient content that present in the water. 90
97 This perception was supported with Setiawati et al. (2018) through her study that proving that the environment condition might lead to some variation of Azolla growth performance, therefore it might cause differences in growth rate of A. pinnata. Table 2: The total fresh weight of the Azolla pinnata for all treatments Treatment (s) Chicken Manure (g) c Cow Dung (g) c Goat Dung (g) d 50 g 460±0.47 a 589±0.03 a 2000±0.31 a 100 g 789±0.03 ab 748±0.03 ab 2400±0.20 ab 150 g 922±0.04 ab 790±0.03 ab 2600±0.12 ab 200 g 860±0.05 b 884±0.04 b 2800±0.12 b 250 g 1211±0.12 b 1020±0.01 b 2800±0.12 b a, b Means with different superscripts within rows were significantly different (p<0.05), c,d Means with different superscripts within columns were significantly different. Meanwhile, propagation was measured by time taken as the plant were doubling on the water surface. The shorten time will indicate the fastest doubling time and the higher biomass will be produced. Table 3: The doubling time of the Azolla pinnata for all treatments Treatment (s) Chicken manure Cow dung (days) c Goat dung (days) d (days) c 50 g 2.97±0.79 a 3.27±0.18 a 2.37±0.26 a 100 g 2.97±0.09 ab 3.03±0.18 ab 2.23±0.13 ab 150 g 2.86±0.15 ab 2.98±0.12 ab 2.18±0.06 ab 200 g 2.91±0.18 ab 2.88±0.13 ab 2.14±0.06 ab 250 g 2.66±0.25 b 2.88±0.13 b 2.14±0.06 b a,b Means with different superscripts within rows were significantly different (p <0.05), c,d Means with different superscripts within columns were significantly different. This study has identified that utilization of goat manure was a best manure in producing A. pinnata compared with chicken and cow manures. 200 gram was an optimum dosage due to the insignificant changes despite using of 250 gram of goat manure as in the table 3. However, the significant different between type of manures can be related with report by Barker, Hodges and Walls (2002) which has scientifically analyze content of NPK element in goat manure compared to broiler and cow manure. A. pinnata able to survive even though in low nitrogen as it has symbiotically interacted with Anabeana azollae in fixing nitrogen from environment. (Mayashree, et al., 2017). However, phosphorous which is identified as a limitation because it required to be converted into an anion phosphate for plant absorption purpose. Basically, high availability of phosphate will be produced high biomass production of Azolla as it related to the animal s diet (Mowa, 2018). 91
98 Conclusion This study has been conducted to evaluate the growth performance of A. pinnata under different types of manure and concentrations. The aim of this study is to facilitate the farmers by suggesting the most suitable fertilizer that can be used to cultivate the A. pinnata over short period of time, whereby a sustainable Azolla crop production can be achieved especially in Malaysia. Based on our finding, A. pinnata shows an excellent growth performance under treatment of goat dung manure at concentration 200 g and 250 g, whereby, at this concentration the A. pinnata give the fastest rate to propagate and double from the initial value. Furthermore, this study could be suggested to farmers to use goat dung at concentration of 200 g or 250 g as the fertilizer in cultivation of A. pinnata. High production yield can be achieved with minimum cost by switch pelleted food to A. pinnata in livestock diet. References Aziz, A. (2012). New Method of Large-scale Production of Azolla pinnata var. pinnata R. Brown: A Multipurpose Crop. International Journal of Applied Agricultural Research, 7(1), 1-9. Anand, T., & Geeta, N.P. (2007). Azolla as a Biofertilizer in Coffee Plantations. I Need Coffee. Htm., Alalade, O.A. & Iyayi, E.A. (2006). Chemical composition and the feeding value of Azolla (Azolla pinnata) meal for Egg-Type Chicks. International Journal of Poultry Science, 5(2), A.O.A.C. (2005) Official Methods of Analysis. AOAC, Arlington, VA, USA. Banu, N., & Fazal, S. (2016). Livelihood and Wellbeing in the Urban Fringe. Cham: Springer International Publishing. Becking, J.H. (1979). Environmental requirements of Azolla for the use of tropical rice production. International Rice Research Institute. Los Banos. Leguna, phillipines, pp Balaji, K., Jalaludeen, A., Churchil, R.R., Peethambaran, P.A., & Senthil Kumar, S. (2009). Effect of dietary inclusion of Azolla (Azolla pinnata) on production performance of broiler chicken. Indian Journal poultry Sciences, 44(2), Bolka, P.C. (2011). Nutritional evalution of Azolla (Azolla pinnata) in broilers and layers, Ph.D Thesis Karnataka Veterinary Animal and Fisheries Sciences University, Bidar, Berker J.C., Hodges S.C. and Walls F.R. (2002). Livestock manure production rates and nutrient content. North Carolina agricultural chemical manual. Retrive from Wu, Y. (2017). Photobioreactor-Wetland system remove organic pollutants and nutrients. Periphyton, Fernandez, M.L.P. (2017). Animal nutrition: the importance of feeding a balanced diet. Retrieve from Wu, Y. (2017). Photobioreactor-Wetland system remove organic pollutants and nutrients. Periphyton, Global Invasive Species Database. (2018). Species profile: Azolla pinnata. Retrieve from, Wu, Y. (2017). Photobioreactor-Wetland system remove organic pollutants and nutrients. Periphyton, Hove, C.V., & Lejeune, A. (2002). The Azolla-Anabaena Symbiosis. Retrieve from Wu, Y. (2017). Photobioreactor-Wetland system remove organic pollutants and nutrients. Periphyton,
99 Jacono, C. (2016). Taking a second look at floating ferns. Aquatics magazine, 38(2), Kamalasanana Pillai, P., Premalatha, S. & Rajamony, S. (2005). Azolla: a sustainable feed for livestock. Leisa Magazine, 21(3). Kavya, K. (2014). Nutritional Evaluation of Azolla (Azolla pinnata) and Its Supplementary Effect On In Vitro Digestibility of Crop Residues And Total Mixed Ration. (Master thesis), Sciences University, Nandinagar, Bidar. Mahadi, M. A., Dadari, S. A., Tanimu, B., Kuchinda, N. C., Sharifai, A.I., & Bature, M.S. (2013). Effects of weed control and cow dung manure on Growth Performance of Quality Protein Maize in Samaru, Zaria, Nigeria. Nigerian Journal of Basic and Applied Science, 21(2), Mayashree B. Syiem, Arvind Kumar Singh, Amar Nath Rai, (2017). N2-Fixing Cyanobacterial Systems as Biofertilizer, Chapter Agro-Environmental Sustainability, springer.com pp Mowa, E. (2015). Organic manure for vegetable production under hydroponic conditions in arid Namibia. International Science & Technology Journal of Namibia, 5, Nordiah, B., Muta Harah, Z., Japar Sidik, B. and Wan Hazma, W.N. (2012). Azolla pinnata Growth Performance in Different Water Source. Pakistan Journal of Biological Sciences, 15(13), Ooi, D. J., Iqbal, S., & Ismail, M. (2012). Proximate composition, nutritional attributes and mineral composition of Peperomia pellucida L. (ketumpangan air) grown in Malaysia. Molecules, 17(9), Punita, S. P., & K. M. Soma, (2015). Capacity of Azolla pinnata var. imbricata to absorb heavy metals and fluorides from the wastewater of oil and petroleum refining industry at Vadodara. International Peer. Reviewed Referred Journal, 2(1), Singh, A.L., & Singh, P.K. (1987). The use of Azolla pinnata isolates as Organic Nitrogen sources for lowland rice. Experimental Agriculture, 23(2), Subudhi, B.P.R., & Singh, P.K. (1978). Utilization of Azolla in poultry feed. Indian Farming, 27, Setiawan, M.R., Damayani, M., Herdiyantoro, D., & Suryatmana, P., Anggraini, D., Khumairah, F.H., Rahim, D.M., & Hossain, A. (2018). The Application Dosage of Azolla pinnata in Fresh and Powder Form as Organic Fertilizer on Soil Chemical properties, Growth and Yield of Rice Plant. AIP Conference Proceedings. Tamizhkumaran, J. and Rao, S.V.N. (2016). Why Cultivation of Azolla as Cattle Feed Not Sustainable. Research Article, Wu,. (2017). Photobioreactor-Wetland system remove organic pollutants and nutrients. Periphyton,
100 2.8 Feed intake, digestibility and growth performance of female goats fed feeding Napier grass supplemented with Gliricidia sepium Lim Whay Chuin, Azrul Fakimin Mat Ghazali, Adam Kamil Hamirudin, Mohd Hafiz Ibrahim, Shamarina Shohaimi, Muhamad Hazim Nazli, Mohd Tarmizi Ishak and Mohd Noor Hisham Mohd Nadzir Introduction In Malaysia, natural or cultivated forages plays a very important role in livestock nutrition (Najim, Amin, Karim, & Mei, 2015). Amongst the forages, Napier grass plays a significant role in ruminant feeding which is a multi-purpose crop and widely used as silage, rotational pastures and as soil-improving crop in semitropical and tropical region (Kidder, 2004). The Napier grass shows a high value in dry matter, crude fiber, detergent fiber and low in crude protein (CP). However, protein has contributing at least 13.24% of livestock industry including ruminant, poultry and agriculture (Parish & Rhinehart, 2008; Pothidee, Allen, & Hudson, 1999; Rana, Siriwardena, & Hasan, 2009 ). Furthermore, the reduced pasture area urged farmers to rely more on concentrates than roughage thus increasing the production cost (Rahman, Nakagawa, Abdullah, Embong, & Akashi, 2014). Thus, silage-making is one of the alternative solutions especially to keep forage available as the main source of feed with produce a stable feed with a high recovery of dry matter, energy, and highly digestible nutrients compared with the fresh crop (Dunière, Sindou, Chaucheyras-Durand, Chevallier, & Thévenot- Sergentet, 2013; Kung, Shaver, Grant, & Schmidt, 2018). In addition, Archimède, González García, Despois, Etienne, and Alexandre (2010) concluded that gliricidia forage may bea viable alternative to replace conventional energy and protein supplements in animal diets. Silage is fermented and high-moisture stored fodder (Wood, 2012; Nizami, Korres, & Murphy, 2009; Cowan, 2000) and has been traditionally used to ensure satisfactory preservation of the crops for dry season and winter feeding in Europe (Kung, Stokes, & Lin, 2003). Zailan, Yaakub and Juson (2018) reported a significant increase of CP content from 8.13% to 9.26% after ensiling process. A local study in goats showed that substitution of the Napier grass with corn silage improved the weight gain, feed intake and digestibility (Khaing, Loh, Ghizan, Halim, & Samsudin, 2015). In additio n, the concentrate requirement can be reduced by corn silage inclusion into the ration (Keady, Gordon, & Moss, 2013). Napier grass is commonly ensiled with different types of legumes and forages to enhance the nutritive value of the diet feed to the dairy animals. Gliricidia leaves are cheap and readily available sources of protein (Hao & Ledin, 2001). Supplementation of Gliricidia sepium in silo can increase the nutritive value of the silage and have proven to show positive results according to National Fo rage Testing Association (1987). In addition, foliage from tree legumes such as Leucaena leucocephala or known as white lead tree and Gliricidia sepium can be used as 94
101 supplement to Napier Grass fodder by means of improvising the live weight gain of young cattle, the dry matter intake, and lactation performance of dairy cows (Abdulrazak, Muinga, Thorpe, & Ørskov,1997). It is essential to provide better diet due to poorer quality of fresh Napier grass and its silage due to high water content (Mendieta-Araica, Spörndly, Reyes-Sánchez, & Spörndly, 2011). Nowadays, nutritionists have been searching for natural strategies with low cost and easy application in order to improve animal performance (Durmic & Blache 2012). Therefore, the study was designed to evaluate the nutritive value of different types of diet to enhance growth performance in female goats. Material and methods Experimental animals and feeding treatment Nine non-pregnant female goats with range live weight (LW) approximately kg to kg and age ranged between 24 months to 60 months old were obtained from the flock at the Ladang 16, UPM. In a completely randomized design using three triplicates, the does were allotted into three treatments: Treatment 1 serves as control composed of 100% fresh Napier grass (N); Treatment 2 is 100% Napier grass prepared as silage (SN); Treatment 3 is a mixture of 85% Napier grass silage and 15% Gliricidia sepium leaves prepared as silage (MIX). Each animal was housed in single pent which sized 4ft x 4ft as recommended by UPM Code of Practice for The Care & Use of Animals for Scientific Purposes (IAUCUC, UPM.) The Napier was harvested from Ladang 16, UPM chopped by using mechanical chopper then fed freshly to the animals. Gliricidia sepium leaves were collected at Ladang 2, UPM. The mechanically chopped Napier grass and Gliricidia sepium leaves were undergone 3-weeks fermentation and fed to animals. The amount of Napier grass given to animals was 10% of animal liveweight based on dry matter (DM). The does were fed 3% of their body weights with the silage. Fresh water was supplied daily. The goats were fed to those treatments for 14 days adaption period before the commencement of 56-days feeding trial. Analytical procedure To determine the nutrient composition on each variety, representative feed samples (200 g each) were taken from each treatment group. Approximately 100g of faecal sample were collected directly from anus of each animal and kept in seal bag. Both feed and faecal samples were oven-dried at 60 C for 48 hours, ground to pass a 1-mm mesh screen sieve and stored for chemical analysis. The nutritive values were determined by FOSS DS2500 Near Infrared Spectroscopy (NIRS) with additional calibration from the fodder samples analysed using standard laboratory procedure. The amount of crude protein (CP) was measured and calculated (N x 6.25) (AOAC, 1990). While the neutral detergent fibre (NDF) and acid detergent fibre (ADF) were determined using FOSS 95
102 FiberCap 2023 System (ISO13906, 2008). Feed intake was determined on the following day by weighing the remnants and subtracting it from the feed served. Representative sample from the orts was obtained for chemical composition analysis. During the feeding trial, the liveweight (LW) was measured once weekly before the morning feed was offered. The average of LW gain daily was calculated by dividing the initial and final LW differences by total number of experimental days (56) days. Feed conversion ratio (FCR) is the ratio between feed intake and LW gain. Nutrient digestibility was calculated by dividing the differences between the feed and faecal composition values with the feed nutritive value, then converted into percentage values. Statistical analysis Data were statistically evaluated using an analysis of variance procedure using one-way ANOVA. Differences in P<0.05 were significant and all results in the text were stated as Mean values ± Standard error of means (S.E.M). Results and discussion Even though there is no statistically difference of final liveweight (LW) between treatment groups, goats fed mixture of 85% Napier silage and 15% Gliricidia sepium silage (MIX) had the lowest final LW. This perhaps is linked with the introduction period of the new types of feed. New feeds should have introduced gradually over period of days or weeks (Khaing et al., 2015). However, these goats showed the highest total weight gain (TWG) and daily weight gain (Table 1). The fermentation process softens the hard part of Napier grass and become easily eaten. The quality of feed was also improved with the odour of Gliricidia sepium silage able to attract the female goats. In addition, the feed conversion ratio (FCR) of MIX were observed insignificantly higher than those fed with 100% fresh Napier grass (N) and 100% Napier silage (SN) which indicated the mixture of 85% Napier grass and 15% Gliricidia sepium silage could be an efficient feeding strategy to increase palatability of goats. Table 1: The growth performance of goats fed with the experimental diets Types of diet Item N SN MIX Initial LW (kg) 26.5 ± 6.08 a 31.7 ± 4.36 a 24.0 ± 6.00 a Final LW (kg) 30.6 ± 6.00 a 35.0 ± 4.36 a 28.7 ± 6.27 a Total weight gain (TWG) (kg) 4.1 ± 0.60 a 3.3 ± 0.00 a 4.7 ± 0.76 a Daily weight gain (g/day) 70.0 ± a 60.0 ± 0.00 a 80.0 ± a Daily dry matter intake (DMI) (g/day) 6.67 ± 0.70 a 2.82 ± 0.21 b 2.30 ± 0.19 c Feed conversion ratio (FCR) 4.20 a 4.20 a 5.00 a All analyses are Mean ± Standard error of means (S.E.M.) of N = 3. Means with different superscript letters in each parameter are significantly different (P.05) using One -way 96
103 ANOVA. N 100% fresh Napier grass, SN 100% Napier grass silage, MIX 85% Napier grass silage + 15% Gliricidia sepium leaves silage. The quality of forage is indicated by the nutrient digestibility of goats as presented in Table 2. Dry matter digestibility (DMD) was enhanced by the mixture of ensiled grasses (p > 0.05). The DMD ranged from the least (58.35%) in N to the highest (67.38%) in MIX (p > 0.05). The least DMD at 58.35% in diet of N was attributed to the high fibre content. Percentage fibre composition is a function of cutting intervals of Napier grass and may have effects on DMD. A decrease on dry matter digestibility with increasing age of cutting for the grass (Bamikole, Akinsoyinu, Ezenwa, Babayemi, Akinlade, & Adewumi, 2004). The highest ADF digestibility (41.19%) was observed for the MIX (p < 0.05). Hard stem parts of Napier grass had refused by the female goats and counted as feed refusal. The feed intake of female goats increased slowly because of this (Table 1). The hard part of stem became soft upon three-weeks fermentation process. It eases the chewing and increases palatability of female goats. There is a trend of higher crude protein digestibility (p > 0.05) of SN and MIX than N showed the increased palatability of female goats. Lower CP digestibility N might have promoted ammonia-n concentrations in rumen fluid which limited the growth of cellulolitic bacteria (Satter and Slyter, 1974). The feeding treatment of MIX showed high digestibility of NDF (p > 0.05) and ADF (p < 0.05) due to the high amount of fermentable carbohydrate in silage. Table 2: Apparent digestibility (%) of chemical composition by goats fed different diets Types of diet Item N SN MIX DM ± 7.48 a ± 8.94 a ± a CP ± 3.79 a ± 4.56 a ± 6.31 a OM ± a ± a ± 6.71 a NDF 3.90 ± 3.35 a 1.89 ± 1.47 a 2.88 ± 1.68 a ADF ± 0.00 a ± 5.73 b ± 6.79 c ADL ± 5.03 a ± 5.68 a ± 7.52 a All analyses are Mean ± Standard error of means (S.E.M.) of N = 3. Means with different superscript letters in each parameter are significantly different (P.05) using One-way ANOVA. N 100% fresh Napier grass, SN 100% Napier grass silage, MIX 85% Napier grass silage + 15% Gliricidia sepium leaves silage, DM dry matter, CP crude protein, OM organic matter, NDF neutral detergent fibre, ADF acid detergent fibre, ADL acid detergent lignin. Chemical composition of all feeding treatments is presented in Table 3. Crude protein (CP) content in MIX was evidently higher than that of N due to a high protein content in the Gliricidia sepium and total N concentration (Richards, Brown, Ruegsegger, and Bates, 1994). The amount of dry matter (DM) in grazing grass is important as it act as an indicator of the total amount of nutrients that are available to the animal. Dry matter can affect the adequate for the ruminants it can affect their performance. The fresh Napier grass contains the highest DM percentage (p < 0.05) because of does not undergo fermented process that affect the DM percent in the sample. The feeding treatment of MIX was stated the lowest DM percentage (p < 0.05) due to the ensiling process that affect the DM percentage in the forage sample. However, this feeding 97
104 treatment had the highest organic matter (OM) percentage which is important because can affect body weight and products such as milk. On the other hand, the MIX was lower especially in ADF (p < 0.05) and ADL (p > 0.05) than that of N. This might due to the age of forage which always contribute a significant role in the nutrient composition (Ajayi, babayemi and Taiwo, 2007) and the supplementation of Gliricidia sepium during ensiling process. The highest NDF percentage of MIX may due to late maturity of Napier grass during harvesting (Bamikole et al., 2004). However, the relatively low ADL as obtained for MIX in this study may be desirable as source of energy. Table 3: Chemical composition (%) of dietary treatments Types of diet Item N SN MIX DM ± 0.47 a ± 1.15 b ± 1.23 c CP 7.10 ± 0.32 a 7.27 ± 0.30 b 7.38 ± 0.55 c OM ± 1.34a ± 1.26a ± 1.83b NDF ± 3.04 a 68.21±1.43 b ± 2.19 c ADF ± 1.31 a ± 1.98 b ± 1.76 c ADL ± 1.09 a ± 1.70 a ± 3.09 a All analyses are Mean ± Standard error of means (S.E.M.) of N = 56. Means with different superscript letters in each parameter are significantly different (P.05) using One-way ANOVA. N 100% fresh Napier grass, SN 100% Napier grass silage, MIX 85% Napier grass silage + 15% Gliricidia sepium leaves silage, DM dry matter, CP crude protein, OM organic matter, NDF neutral detergent fibre, ADF acid detergent fibre, ADL acid detergent lignin. Conclusion The association of Napier grass with silage of legumes; Gliricidia sepium improved the texture and nutritive values in pasture fed to the goats. Thus, it able to improve the feed intake (palatability), digestibility and growth performance of goats. Acknowledgements This research was assisted by laboratory assistants of the Faculty of Agriculture, Institute of Tropical Agriculture and staff of Ladang 16, Universiti Putra Malaysia. References Abdulrazak, S. A., Muinga, R. W., Thorpe, W., & Ørskov, E. R. (1997). Supplementation with Gliricidia sepium and Leucaena leucocephala on voluntary food intake, digestibility, rumen fermentation and live weight of crossbred steers offered Ze a mays stover. Livestock Production Science, 49(1), Ajayi, F.T., Babayemi, O.J., Taiwo, A.A. (2007). Effects of Stylosanthes guianensis and Aeschynomene histrix on the yield, proximate composition and in-situ dry matter and crude protein degradation of Panicum maximum (Ntchisi). Livestock Res. Rural Dev. Volume 19, Article #32. 98
105 AOAC (1990). Official methods of analysis.15th ed. Association of Analytical Chemist Washington, DC. pp Archimède, H., González García, E., Despois, P., Etienne, T., & Alexandre, G. (2010). Substitution of corn and soybean with green banana fruits and Gliricidia sepium forage in sheep fed hay based diets: effects on intake, digestion and growth. Journal of animal physiology and animal nutrition, 94(1), Bamikole, M.A., Akinsoyinu, A.O., Ezenwa, I., Babayemi, O.J., Akinlade, J. & Adewumi, M.K. (2004). Effect of six-weekly harvests on the yield, chemical composition and dry matter degradability of Panicum maximum and Stylosanthes hamata in Nigeria. Grass Forage Sci. 59: Cowan, T. (2000). Use of ensiled forages in large-scale animal production systems. FAO Plant Production and Protection Papers, Dunière, L., Sindou, J., Chaucheyras-Durand, F., Chevallier, I., & Thévenot-Sergentet, D. (2013). Silage processing and strategies to prevent persistence of undesirable microorganisms. Animal Feed Science and Technology, 182(1-4), Durmic, Z. & Blache, D. (2012). Bioactive plants and plant products: effects on animal function, health and welfare. Animal Feed Science and Technology 176, Hao, N.V.; Ledin, I., Performance of growing goats fed Gliricidia maculata. Small Rumin. Res., 39: ISO13906, Animal feeding stuffs - Determination of acid detergent fibre (ADF) and acid detergent lignin (ADL) contents. Karr-Lilienthal, L. K., Grieshop, C. M., Merchen, N. R., Mahan, D. C., & Fahey, G. C. (2004). Chemical composition and protein quality comparisons of soybeans and soybean meals from five leading soybean-producing countries. Journal of Agricultural and Food Chemistry, 52(20), Keady, T.W. J., Gordon, A.W.,& Moss, B.W., Effects of replacing grass silage with maize silages differing in inclusion level and maturity on the performance, meat quality and concentrate-sparing effect of beef cattle. Animal, 7, Khaing, K. T., Loh, T. C., Ghizan, S., Halim, R. A., & Samsudin, A. A. (2015). Feed intake, growth performance and digestibility in goats fed whole corn plant silage and Napier grass. Malaysian Journal of Animal Science, 18(1), Kung Jr, L., Shaver, R. D., Grant, R. J., & Schmidt, R. J. (2018). Silage review: Interpretation of chemical, microbial, and organoleptic components of silages. Journal of dairy science, 101(5), Kung, L., Stokes, M. R., & Lin, C. J. (2003). Silage additives. Agronomy, 42, Mendieta-Araica, B., Spörndly, E., Reyes-Sánchez, N., & Spörndly, R. (2011). Feeding Moringa oleifera fresh or ensiled to dairy cows effects on milk yield and milk flavor. Tropical animal health and production, 43(5), Najim, A., Amin, M. R., Karim, S. M. R.,& Mei, S. J., Small Holder Farmers Preferences in Feeding Cattle in ECER Region, Malaysia. IOSR Journal of Agriculture and Veterinary Science, 8, NFTA (1987) Gliricidia sepium (JACQ) WALP: Management and Improvement. Nitrogen Fixing Tree Association, Proceedings of Workshop at CATIE, NFTA Special Publication , pp 255. Nizami, A. S., Korres, N. E., & Murphy, J. D. (2009). Review of the integrated process for the production of grass biomethane. Environmental Science & Technology, 43(22),
106 Parish, J. A., & Rhinehart, J. D. (2008). Fiber in beef cattle diets. Pothidee, A., Allen, A. J., & Hudson, D. (1999). Impacts of Corn and Soybean Meal Price Changes on the Demand and Supply of US Broilers (No ). R. W. Kidder. (2004) Composition and digestible nutrient content of Napier grass leaves. Journal of Agricultural Research. Vol. 70 (No. 3). Rahman, M.M., Nakagawa, T., Abdullah, R. B., Embong, W. K.W., and Akashi, R.. (2014). Feed intake and growth performance of goats supplemented with soy waste, Pesquisa Agropecuária Brasileira, 49, Rana, K. J., Siriwardena, S., & Hasan, M. R. (2009). Impact of rising feed ingredient prices on aquafeeds and aquaculture production (No. 541). Food and Agriculture Organization of the United Nations (FAO). Richards, D. E., Brown, W. F., Ruegsegger, G., Bates, D. B. (1994). Replacement value of tree legumes for concentrates in forage-based diets. I. Replacement value of Gliricidia sepium for growing goats. Animal Feed Science and Technology, 46(1-2): Satter, L. D.; Slyter, L. L Effect of ammonia concentration on rumen microbial production in vitro. British Journal of Nutrition, 32: Wood, B. J. (2012). Microbiology of fermented foods. Springer Science & Business Media. Zalian, M. Z., Yaakub, H., & Juson, S. (2018). Yield and nutritive quality of Napier (Pennisetum purpureum) cultivars as fresh and ensiled fodder. J. Anim. Plant Sci, 28,
107 2.9 Divergent loci in natural populations of Gadus chalcogrammus, walleye Pollock Nadiatul Hafiza Hassan, Yoshihisa Suyama, Yu Matsuki and Masakado Kawata Introduction Elucidating the process and driving factors underlying genetic differentiation is an important challenge in ecology and evolution. In marine fish species especially migratory species, population differentiation is weak due to high level of gene flow and migration of marine species may be restricted by a number of factors including gradients of salinity, temperature, oceanic currents and other factors. Gadus chalcogrammus has widespread geographical distributions and exploits different ecological niches from extremely low temperature to variable ocean temperature. Populations from latitudinal gradient provide natural replications to study the evolutionary response towards the environmental gradients. A microsatelliteassociated DNA sequencing method, MIG-seq was applied to study the genetic structures and divergent loci in G. chalcogrammus from Bering Sea and Japans ocean. A total of 160 SNP loci were obtained from the adopted method and population divergence and structuring were observed in both populations. The FST values confirmed the genetic break between the populations (FST: ). The evidence of outlier SNPs enhanced the dramatic divergence between Bering Sea and Japan oceans populations (FST: ). A correlation study of allele frequencies at each SNP locus with environmental parameters showed the occurrence of two divergent SNP loci, which might respond to an ocean temperature and salinity gradients in the populations. Further investigation by BLAST were positioned the loci near to a gene that play a vital role in transcription of major histocompatibility (MHC) gene, an evolutionary conserved gene in adaptive immune system in vertebrates, which might explain adaptive selection occurred on the gene. Materials and methods We sampled 6 and 1 local populations of G. chalcogrammus in Japans ocean and Bering Sea, respectively, during spawning and pre-spawning seasons (n=181). The muscle tissues were preserved in 95% of alcohol and total genomic DNA was extracted using DNeasy Tissue Kit according to manufacturer s protocol (Qiagen Hilden, Germany). To quantify genetic variation across the populations, genomewide SNPs using multiplexed intersimple sequence repeats (ISSRs) genotyping by sequencing (MIG-seq) (Suyama & Matsuki, 2015). The MIG-libraries were prepared from single end sequencing according to Suyama and Matsuki (2015) and was sequenced using Illumina Miseq (Illumina, San Diego, Ca, USA). Low quality of reads from raw sequencing data were removed suing FASTX toolkit. First SNP appeared on the sequence tags was used for population analysis to avoid linkage between SNP loci. The program Stacks 1.20 (Catchen et al. 101

108 2011) identified 160 SNPs loci for G. chalcogrammus populations. The loci were further used to assess the genetic heterogeneity and divergent loci that were correspond to natural selection in pollock populations. Four methods were used to scan for signature of divergent loci, which based on FST genome scan analysis and associative method of allele frequencies and environmental variables. Results and discussion The genetic structure of G. chalcogrammus was carried out using STRUCTURE as depicted in Figure 1 and the clustering was consistent with the FST between populations. The significant genetic heterogeneity was showed in 160 SNP loci of G. Chalcogrammus populations. Eventhough, pairwise estimates of FST were in higher magnitude than those reported in other marine species, but the results corroborated previous findings of significant population differentiation in the Japans ocean that those in Bering sea (Suda et al., 2017; Liu et al., 2016; Grant et al. 2010). Figure 1: Genetic structure of G. chalcogrammus using STRUCTURE (Pritchard et al., 2000) based on 160 SNP loci. Red, blue and green represent the proporations of inferred ancestry from 2 populations; Bering Sea and Japans Ocean. Genome scans of 160 SNP loci using multiple platforms have revealed three diverg ent SNP loci associate with temperature and salinity gradient in localities of G. chalcogrammus (Figure 2). BLAST-searched of divergent SNP loci against Atlantic cod have located two loci near to the ZXDC gene, a known gene which encoded for protein that is important in assisting transcription of histocompatibility complex (MHC I and II) gene. The MHC is conserved adaptive gene existed in vertebrate immune system and cod was reported the first species to lost MHC II gene (Malmstrøm et al., 2016; Djikstra et al., 2013; Star et al. 2011). The two divergent SNP loci showed the significant allele frequency clines in Bering Sea population owing its properties as a distinct population from others (result is not showed). 102

109 Figure 2: Venn diagram illustrating the overlap of divergent SNP loci identified by multiples genome scan platforms. Conclusion Despite the limited number of SNP loci, this study was able to identified adaptive genetic structure and divergent loc in natural populations of G. chalcogrammus. The identified divergent SNP loci were hypothesized to strongly correlate with temperature and salinity of the oceans, with two loci may have possible association with transcription of MHC gene in T. chalcogrammus. Acknowledgments The authors would like to thank Tohoku National Fisheries Research Institute and FRA research vessel crews of Wakataku Maru for assistance with sample collection. This project was supported by research grants from Tohoku Ecosystems-Associated Marine Sciences (TEAMS) to Masakado Kawata. References Catchen JM, Amores A, Hohenlohe PA, Cresko WA and Postlethwait JH (2011) Stacks: building and genotyping loci de novo from short-read sequences. G3 Genes Genomes Genetics, 1, Dijkstra JM, Grimholt U, Leong J, Koop BF and Hashimoto K (2013) Comprehensive analysis of MHC class II genes in teleost fish genomes reveals dispensability of the peptide-loading DM system in a large part of vertebrates. BMC Evolutionary Biology, 13(1), 260. Grant WS, Spies I and Canino MF (2010) Shifting-balance stock structure in North Pacific walleye pollock (T. chalcogramma). ICES Journal of Marine Science, 67,
110 Liu BJ, Zhang BD, Xue DX, Gao TX and Liu JX (2016) Population structure and adaptive divergence in a high gene flow marine fish: the small yellow croaker (Larimichthys polyactis). Plos One, 11(4), e Malmstrøm M, Matschiner M, Tørresen OK, Star B, Snipen LG, Hansen TF et al (2016) Evolution of the immune system influences speciation rates in teleost fishes. Nature Genetics, 48, Pritchard JK, Stephens M and Donnelly P (2000) Inference of population structure using multilocus genotype data. Genetics, 155(2), Star, B., Nederbragt, AJ, Jentoft S, Grimholt U, Malmstrom M et al (2011) The genome sequence of Atlantic cod reveals a unique immune system. Nature, 477, Suda A, Nagata N, Sato A, Narimatsu Y, Nadiatul HH and Kawata M (2017), Genetic variation and local differences in Pacific cod Gadus macrocephalus around Japan. Journal of Fish Biology, 90, Suyama Y and Matsuki Y (2015) MIG-seq: an effective PCR-based method for genomewide single-nucleotide polymorphism genotyping using the next-generation sequencing platform. Scientific Reports, 5,
111 2.10 Behavioural and hormonal study of captive Sambar deer (Rusa unicolor) at Ladang 16, Universiti Putra Malaysia Noorazemah Mohd Fuzi, Kushaal Selvarajah, Mohd Noor Hisham Mohd Nadzir and Geetha Annavi Introduction Sambar deer (Rusa unicolor) are classified under Cervidae family, which distributed throughout Southeast Asia region (Leslie D. M., 2011). Their habitats ranging from tropical dry forests, seasonal moist evergreen forests, subtropical mixed forests to tropical rainforests. Sambar deer are mostly nocturnal and living alone or in a very small group as they are more solitary in their way compare to the other species of deer. It is listed as vulnerable by International Union for Conservation of Nature (IUCN) in 2015 (Timmins et al., 2015). In Peninsula Malaysia, the number of Sambar deer is decreasing drastically as they are known to be hunted illegally in their natural habitat for food and trading (Kawanishi et al., 2014). Sambar deer is the key prey of Panthera tigris or Malayan Tiger, thus it becomes the population determinant of Malayan Tiger (Sunquist, 2010). Information regarding reproductive activity and associated behaviour are important for the progress of management strategies of this species in captivity. However, such information is still lacking. Thus, this study was conducted to determine the solitary and social behaviours of Sambar deer, to measure the level of reproductive hormone (progesterone and estradiol) in faeces of females Sambar deer and to find the correlation between behaviour with reproductive hormone of female Sambar deer. This study on both behavioural and hormonal activities of Sambar deer is essential to help to increase in the number of this species in captive breeding centres to continue the survival of both the Malayan Tiger and Sambar deer for a balance ecosystem. Materials and methods Study area This study was conducted at Ladang 16, Universiti Putra Malaysia (GPS coordinates [lat, long] 2.987, ). The Sambar deer were housed in an approximately 10 m x 8 m paddock surrounded by 2 m high of enclosure (Figure 1). Figure 1: Paddock of Sambar deer 105
112 Behaviour recording Two adult males and two adult females were selected for this study and they were identified by tags on their ear with different colours. Both females have their own fawn, however, the behavioural activity of the fawns was not observed. Daily observations commenced at 0900 to 1700 hours from Monday to Thursday. Behavioural study was divided into two sessions, where first observation was carried out between 0900 a nd 1200 and the second session was at In this study, direct observation was conducted for a total of 120 hours where each subject was observed for 6 hours per week for 5 weeks between June and July Behavioural study was conducted using focal sampling method. All the subjects were observed for the same sampling period and interval. The focal sampling method was used by observing one deer per day throughout each session for a sampling period of 10 minutes with 5 minutes interval following Altmann (1974). Different types of behaviour exhibited by subjects as per described in ethogram (Table 1) was recorded on recording sheet. The deer were observed from outside of the paddock in order to avoid any disruption in their behaviour due to the presence of the observer. As for night observations, four camera traps were deployed surrounding Sambar deer paddock (Figure 1). All the cameras were set to record between 1800 and 0900 from Monday to Thursday. Both female and male can be differentiated as they have a different physical characteristic. For night observations, the frequency of the behaviour that was captured was note down per hour. Hormonal study Animals and management The two selected females which were subjected for behavioural observation in this study were healthy, non-pregnant Sambar deer between four and six years old with an average body weight 190 ± 2.90 kg. Both females were raised at the University s deer breeding unit. The females were given fresh grass of Pennisetum purpureum (Napier grass) on Monday and Tuesday and food pallet on Wednesday and Thursday. Faeces analysis The faeces were collected from Monday to Thursday. Fresh faeces of the females were collected the soonest as possible after defecation during the 5 minutes time in terval of behavioural observation and the samples kept in micro-centrifuge tube. The two females can be easily identified as they have different colour of ear tag and defecated at different places each time. The faeces than were kept in ice box before transported to Genetic Lab, Department of Biology, Faculty Science, UPM and stored at -20 o C until further procedures. The process of faeces extractions and the analysis of faeces steroid 106
113 metabolites followed the method in Palme (2013). Plasma estradiol and pro gesterone concentrations of each sample were measured using ELISA kit. The estradiol and progesterone assay specificity was 100% and their sensitivity were 6.2 pg/ml and ng/ml respectively. Table 1: Ethogram for sambar deer Types of behaviour Behaviour Code Description of behaviour Solitary Resting STD (S) Standing motionlessly STD (F) STD (C) STD (W) SIT (S) SIT (F) SIT (C) SIT (W) Standing while flipping ears Standing while mouth is moving (chewing) Standing while wiggling tails Body is lying down motionlessly Body is lying down while flipping ears Body is lying down while mouth is moving (chewing) Body is lying down while wiggling tails Locomotion L Trotting, running, walking, jumping Feeding and Drinking F&D Using tongue and incisors, licking and drinking Grooming G Licking and nibbling, scratching, rubbing Elimination E Defecating, urinating Social Sexual S Recognition Adornment RG A Sniffed and lick female's vulva, male followed female, male lick female's urine Sniffing, groomer position to lick mouth, back of head or antler wallow in mud, lay down body flat and move right or left on the ground, adorn its antlers Alarm AL Tail erected, head raises, ears are alert Vocalization V Bleating, mother-young relationship Data analysis The data were analysed in R Statistical Package Version and IBM SPSS Statistic 23. For R Statistical Package Version 3.0.3, the data were analysed in lme4 package using the glmer function and set generalised linear mixed-effects model (Bates et al., 2016) 107
114 and in MuMIn package using model averaging based on information criteria, AICc (Akaike s Information Criterion) (Barto n, 2016). The Y-axis represents the frequency of behaviours (Table 1) averaged per day for each individual. The random effects were individuals identification number and days. Temperature, humidity, sex and session were included as fixed effects. The temperature and humidity were standardised to a mean of zero and a standard deviation of two. By their AICc value, the models were ranked, and the top model had the lowest AICc value and only plausible model if the model ranked ( AICc) was 7) (Burnham et al., 2011). For IBM SPSS Statistic 23, the test that was used is T-test for day versus night observation. The data obtained from the ELISA plate reader was the raw data for both progesterone and estradiol hormones and was calculated by the formula by Palme (2005). Results and discussion Daytime behaviour observation Among the tested solitary and social behaviours (Table 1), only adornment was differed significantly with gender where the females had a higher a frequency than males (Figure 2). Adornment is where the deer just wallowing the body in the mud, lay down body flat and move right or left on the ground and adorn its antlers. Adornment behaviour can serve as thermoregulation process for Sambar deer (Aun and Rahman, 1989). Female usually have a higher fat content; therefore, it will tend to do the thermoregulation process more comparing to male. Female have a larger ratio of body surface to body mass thus a greater fat content has differences in resting body temperature and thermal responses (Kaciuba and Grucza, 2001). Therefore, thermoregulation process was higher in female than male and increased the adornment behaviour for females. The high temperature and the low humidity may probably be the reason as the thermoregulation of deer were served by wallowing and lay down body flat on the ground. Adornment behaviour was also related in deer to inhibit the external parasites growth on their body (Aun and Rahman, 1989). During this study, none of males had recorded to vocalise. Only females vocalised, and this can be related to mother-young relationship (as described in Table 1). The mother bleated to find the young and to assure whether the young is within a hearing range while the young bleated to solicit attention from the mother. From the observation, the vocalisation by females was mostly common in the morning. The mother tends to roam freely without their young surrounded the paddock in the morning. While the mother is roamed freely, the young are still asleep (Aun and Rahman, 1989). As the young wake up, they might want to assure where their mother is, and this might be the reason why the frequency of this behaviour was higher in the morning session compare to the afternoon session. 108
115 As for other behaviours, there were no significant differences with both sessions and gender. However, as the duration of this research was only limited for 5 weeks due to time constraint, the accurate results might not be obtained, and longer period of study needs to be done. Figure 2: Total number of adornment behaviour between male and female during daytime Day versus night behaviour observation For night observation, only solitary behaviour was caught on the camera traps that were set up surrounded the paddock. Table 2 shows the mean values for behaviour of Sambar deer during the day and night ± Standard error of mean (SEM). All of the behaviour on both day and night showed a significant difference (p<0.05). Sambar deer exhibited resting, locomotion and grooming behaviour at a higher frequency during the night time compared to the day time. As stated by Caboń Raczyńska et al. (1987), where the general activity pattern of deer during the day and night were active and several peaks in activity during the 24-h period showed that the behaviour of the Sambar deer were not constant all the time. Compared to locomotion and grooming, resting was the behaviour that mostly showed by the Sambar deer during the night compared to day. However, this was contradicted to the facts that Sambar deer was a nocturnal species. A previous study by Rice (1986) stated that in order to avoid predators, selection of behaviour may become the reason for the nocturnality for Sambar deer. Another reason might due to the changes of the environment thus changed the normal behaviour as supported with the statement of individuals in captivity no longer demonstrated appropriate reactions (McPhee and Carlstead, 2010). Growing up in a captive environment that is more restrictive than the wild can alter how an animal learns and change how it responds (McPhee and Carlstead, 2010). Feeding and drinking had a higher frequency during the day. Sambar deer ate and drank more during the day was because due to the fact that the food was provided by the keeper during the day and no other sources were available in the paddock. 109
116 Table 2: Behaviour of Sambar deer during the day and night Mean ± Standard error of mean Time Resting Locomotion Feeding & drinking Grooming Day Night Hormone study The mean concentrations level of progesterone was below 1 ng/g and estradiol was more than 1 ng/g. When the progesterone level was low, the estradiol level was high and vice versa. Progesterone level that falls below 1 ng/g shows that the females were in estrous state. From the hormone analysis females A and B were detected likely to be on oestrous for 15 and 22 continuous days respectively (Figure 3 and 4). The normal cycle of oestrous of a deer is 17 days and the concentration level of progesterone during oestrous for deer will be below 1 ng/g (Hafez et al. 2000). The results also were supported by previous study by Pereira et al. (2005), where it stated that steroid analysis of faeces is a good non-invasive method and practical to know the endocrine status of a deer. Figure 3: Concentration level of Progesterone and Estradiol for Female A 110
117 Figure 4: Concentration level of Progesterone and Estradiol for Female B Correlation between behaviour and reproductive hormone of female Sambar deer There was a negative correlation between social behaviour and progesterone level (r= 0.74, p<0.05). Low progesterone level shows that the deer was in estrous state and ready for mating. During mating, the females tend to show increase activities of social behaviour with males. This was supported by Adkins (2005), when females are in estrous, they do not fight males but will form social affiliations for mating. Pereira et al. (2005) also stated that there were significant correlations between fecal steroid hormones and reproductive behaviour of the deer. Conclusion Information regarding behavioural and reproductive activity is important for the progress of management strategies of species in captivity. For day observation, only adornment was differed significantly with gender where the females had a higher a frequency than males. The high temperature and the low humidity may probably be the reason as the thermoregulation of deer served by wallowing and lay down body flat on the ground. Besides, during this study, none of males had recorded to vocalise. Only females vocalised, and this can be related to mother-young relationship. As for other behaviours, there were no significant differences with both sessions and gender. In addition, the behaviour of feeding and drinking had a higher frequency during the day than night time. The possible reason for this because the food for the Sambar deer was given by the keeper during the day. For night observation, only solitary behaviour was caught on the camera traps that were set up surrounded the paddock and for night observation, they had a higher frequency of resting, locomotion and grooming compared to day observation. For hormone study, the reading of concentration level of progesterone was below 1 ng/g and concentration level of estradiol was more than 1 ng/g. There was a negative correlation between social behaviour and progesterone level. Low progesterone level shows that the deer was in estrous state and ready for mating. For future studies and recommendation, the behavioural study and hormonal 111
118 study need to be done in a longer period of time for better and accurate results. Addition of camera traps for both day and night observation also resulting in a better observation and data collection. It is also important to determine the accuracy of the hormone concentration to know exactly whether the female Sambar deer was on oestrous throughout the study. Acknowledgement We are grateful to the management officers of Ladang 16 for permitting us to study the behavior of Sambar deer. We thank all the keepers who help during field study. This study was approved by the Institutional Animal Care and Use Committee (IACUC) under reference number: UPM/IACUC/AUP-R042/2018, Universiti Putra Malaysia. References Altmann, J Observational study of behavior: sampling methods. Behaviour Aun, P.K. and Rahman, S.A Ethogram of captive Sambar deer (Cervus unicolor) at Zoo Melaka. Important Journal of Wildlife Park, Barto n, K Multi-model inference. R Package Version URL: CRAN.R-project.org web/packages/mumin. Bates, D., Maechler, M., Bolker, B. and Walker, S Linear mixed-effects models using 'Eigen' and S4. R Package Version URL: Burnham, K.P., Anderson, D.R. and Huyvaert, K.P AIC model selection and multimodel inference in behavioral ecology: some background, observations, and comparisons. Behavioral Ecology and Sociobiology 65: Caboń-Raczyńska, K., Krasińska, M., Krasiński, Z. A., & Wójcik, J. M Rhythm of daily activity and behavior of European bison in the Białowieża Forest in the period without snow cover. Acta theriologica, 32(21), Hafez, E.S.E., Jainudeen, M.R. and Rosnina,Y Hormones, growth factors and reproduction. In: Reproduction in farm animals, Kaciuba-Uscilko, H., and Grucza, R Gender differences in thermoregulation. Current Opinion in Clinical Nutrition & Metabolic Care, 4(6), Kawanishi, K., Rayan, D.M., Gumal, M.T. and Shepherd, C R Extinction process of the Sambar deer in Peninsular Malaysia. IUCN Deer Specialist Group Newsletter, Leslie, D.M Rusa unicolor (Artiodactyla: Cervidae). Mammalian Species, 43, McPhee, M.E. and Carlstead, K The importance of maintaining natural behaviors in captive mammals. Wild mammals in captivity: Principles and techniques for zoo management, 2,
119 Palme, R., Touma, C., Arias, N., Dominchin, M.F., and Lepschy, M Steroid extraction: get the best out of faecal samples. Wien Tierarztl Monatsschr 100(9-10), Pereira, R.J.G., Duarte, J.M.B. and Negrao, J.A Seasonal changes in fecal testosterone concentrations and their relationship to the reproductive behaviour, antler cycle and grouping patterns in free-ranging male Pampas deer. Theriogenology, Rice, C.G Observation on predators and preys at Eravikulam National Park, India. Journal of the Bombay National History Society 83(2): In: Biological abstract (2): AB-245 Sunquist, M What is a tiger? Ecology and behaviour. Tigers of the World, Timmins, R., Kawanishi, K., Giman, B, Lynam, A., Chan, B., Steinmetz, R., Sagar Baral, H. & Samba Kumar, N Rusa unicolor (errata version published in 2015). The IUCN Red List of Threatened Species 2015: e.t41790a
120 CHAPTER 3: PLANT PHYSIOLOGY 3.1 Taxonomic value of stomatal complexes in Shorea Roxb. (Dipterocarpaceae) Noraini Talip., Amirul-Aiman Ahmad Juhari, Ruzi Abdul Rahman and Hamidun Bunawan Introduction Surface distribution patterns of stomata based on their orientation and dispersion are found to be stable and hence could be taxonomically useful (Noraini & Cutler 2009). The developmental pattern of the stomatal complex shows absolute constancy in the majority of families (Van Cotthem 1970, 1973). The relationships discovered between some types of stomata are significant in the resolution of many taxonomic problems, such as establishing the position and size of taxa of various ranks and clarifying the relationships between different types of stomatal apparatus (Noraini & Cutler 2009). Metcalfe & Chalk (1950) reported that the stomata in the Dipterocarpaceae are confined to the lower surface, surrounded by more or less distinct subsidiary cells, the latter being particularly well-defined and parallel to the pore (rubiaceous or paracytic) in some Balanocarpus, Shorea and Vateria. The taxonomic problems in Shorea mostly involve identification and classification, exhibit continuous morphological variation at specific levels, the infrequent flowering and fruiting season makes the process of identification more difficult and complicated (Noraini 2006). The overall objective of this study was to determine whether stomatal anatomical characters in Shorea could be of taxonomic value in systematic and diagnostic investigations. Materials and methods Specimens were obtained from the Herbarium, Royal Botanic Gardens, Kew, Richmond, United Kingdom and the Herbarium, Forest Research Institute of Malaysia, Kepong, Malaysia and fresh specimens were from the arboretum and various forest reserves in Peninsular Malaysia. 23 species with 92 samples were collected, the leaves part were fixed, embedded and peeled followed the method described by Johansen (1940) and Sass (1958) with suitable modifications. All slides were photographed and observed using Leitz Diaphlan polarizing microscope and Reichert Polyvar 2 Microscope attach with a digital camera. Images were processed using Image Analysis and Adobe Photoshop software. Observation and measurement under scanning electron microscope follows Noraini (2006). Results and discussion The anatomical characters of stomata of Shorea species studied are presented in Table 1. The pattern of stomatal distribution in this present study was classified as scattered, 114
121 crowded or arranged in a more or less circular or semi-circular pattern. All the species examined are hypostomatic. Shorea found to have seven types of stomata, paracytic (Fig.1b, Fig.1d, Fig.1h, Fig.1e), staurocytic (Fig. 1d, Fig.1f, Fig.1i, Fig.1j), hexacytic (Fig.1d, Fig.1e), stauro-cyclocytic (Fig.1a. Fig.1c, Fig.1g), tetra-cyclocytic (Fig.1a, Fig.1g) and cyclocytic. There are some species of Shorea that have more than one type of stoma Table 1). Baas et al. (1982) called the presence of several types of stomata in a single taxon heterogenous as to type of stomata, some authors described them as stomatal polymorphism. Baranova (1992) suggested the use of the term of heter ostomatic for the occurrence of several types of stomata in a single leaf and the term homostomatic for taxa with a single type of stoma. Some Shorea species studied found to have homostomatic stomata (Table 1). Baranova (1992) and Carpenter (2005, 2006 ) noted that paracytic stomata, known as rubiaceous in earlier stomatal classifications, is regarded as probably primitive in both dicotyledones and monocotyledones. If this is so, S. atrinervosa, S. blumutensis, S. elliptica, S. hopeifolia, S. isoptera, S. maxima, S. maxwelliana and S. seminis have a primitive type of stoma. Stauro- and tetra-cyclocytic stomata are called intermediate stomata and may occur together in some species. Noraini & Cutler (2009) noted that the occurrence of intermediate and different types of stoma in one species or plant could have taxonomic and diagnostic value. All Shorea species investigated have elliptical guard cell pairs outline (Fig.2a-Fig.2o), stomatal sizes were measured directly under the scanning electron microscope and the results show that the stomata in many species are similar but some have larger or smaller stomata, some have very long and some have very short stomata. Rajagopal (1979) concluded that the stomata in monocotyledons often are very similar in size, whereas in dicotyledons the stomata are of multiple sizes. Ten to thirteen stomata of each species were measured and analyzed and the results are summarized in Table 2. For convenience, the size of stomata, described as small, medium or large, are bas ed on the length of the stomata. Relatively small stomata are stomata with a length of between 6 12 m, medium with length of between m and large with stomata with a length above 20 m (Table 3). Stomata in Shoreas are relatively small to medium and most f species have medium size stomata. However the stomata in S. beccariana are the largest compared with other stomata in Shorea, The smallest stomata are in S. seminis with a width of m and a length of 6 8 m. Micrographs of stomata also show an interesting feature that could have diagnostic value. For example, in S. macrophylla (Fig.2j), the lateral lobes have striae at right angles to the long axis of the stomata, whereas in in S. guiso (Fig.2h) these are tooth-like inner flanges. Another good example of a diagnostic character is in S. atrinervosa (Fig.2b), which has a circular, protruding stomatal rim. Resulting from these from these study, stomatal features as seen under scanning electron microscopy 115
122 together with stomatal length could be useful for authentification and identification purposes especially at species level. Table 1: Dimensions of stomata of Dipterocarpaceae. Species Length ( m) Width ( m) Type Guard pair cells outline Cuticular rim S. agamii 18(20)20 10(12)12 Tetra-cyclocytic, stauro Elliptic Narrow cyclocytic S. atrinervosa 13(15)15 8(8)10 Paracytic Elliptic Slightly domed S. beccariana 28(30)33 14(14)14 Cyclocytic Elliptic Domed S. blumutensis 13(20)20 12(15)15 Paracytic Elliptic Domed S. bracteolata 10(13)13 6(7)7 Tetra-cyclocytic and hexacytic Elliptic Narrow S. elliptica 13(13)15 8(10)10 Paracytic Elliptic Narrow S. gratissima 14(15)16 10(11)11 Stauro-cyclocytic Elliptic Narrow S. guiso 13(15)15 9(10)10 Staurocytic, Paracytic, Hexacytic Elliptic Domed S. hopeifolia 10(13)15 7(7)8 Paracytic Elliptic Domed S. isoptera 15(15)18 8(8)10 Paracytic Elliptic Domed S. kunstleri 20(20)20 6(6)8 Staurocytic Elliptic Domed S. laevis 18(20)20 15(18)18 Staurocytic Elliptic Domed S. lepidota 10(10)13 8(8)8 Staurocytic Elliptic Domed S. macroptera 15(15)16 8(8)10 Tetra-cyclocytic, Staurocyclocytic Elliptic Domed S. macrophylla 20(20)20 12(12)12 Cyclocytic Elliptic Domed S. maxima 14(15)16 8(10)10 Paracytic Circular Slightly domed S. maxwelliana 17(18)20 12(12)15 Paracytic Elliptic Domed S. ovalis 13(14)15 10(10)10 Staurocytic Elliptic Domed S. pauciflora 13(13)15 8(8)8 Staurocytic Elliptic Narrow S. parvifolia 15(17)17 8(8)10 Staurocytic Elliptic Domed S. platyclados 12(13)15 10(10)12 Staurocytic, Stauro-cyclocytic Elliptic Domed S. rubella 15(18)18 8(10)10 Staurocytic Elliptic Slightly domed S. seminis 10(10)12 10(10)10 Paracytic and staurocytic Elliptic Slightly domed S. siamensis 14(14)7 6(6)8 Staurocytic Elliptic Slightly domed S. singkawang 15(15)17 6(6)8 Staurocytic, tetracytic and Elliptic Narrow hexacytic S. smithiana 12(15)15 8(8)8 Staurocytic, Stauro-cyclocytic Elliptic Domed Note: Stomatal length and width was measured by considering the minima, maximum and common value in the majority of stomata, which is written as follows: minimum value of width or length (in brackets: the most common value of width or length of the majority of stomata) maximum value of width or length. For example; 13(14)17: 13 m is the lowest value, 14 m is the most common value in the majority of stomata and 17 m is the highest value. 116


")


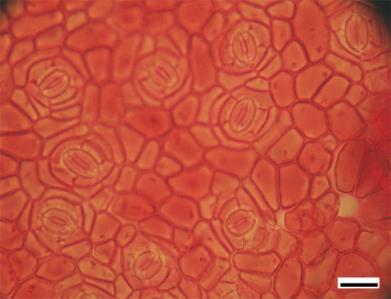
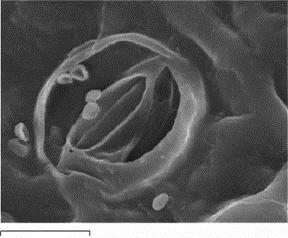


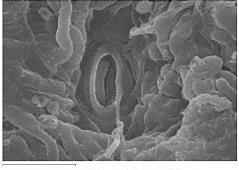


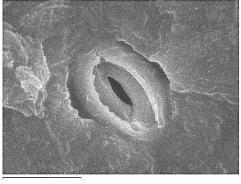

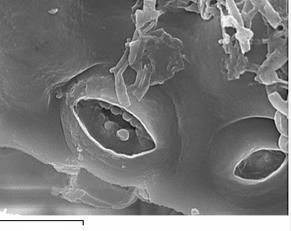
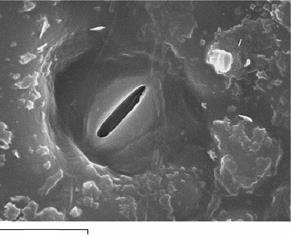


123 a b c d e f g h Figure 1: Abaxial epidermis of Shorea species. a) S. agamii, b) S. atrinervosa, e) S. gratissima, f) S. guiso, g) S. hopeifolia, h) S. lepidota, i) S. macroptera, j) S. maxima, k) S. ovalis, l) S. pauciflora. i j a b c d e f g h i j k l m n o Figure 2: Abaxial leaf surfaces showing stomata in Shorea species. a) S. agamii, b) S. atrinervosa, c) S. beccariana, d) S. bracteolata, e) S. guiso, f) S. isoptera, g) S. laevis, h) S. lepidota, i) S. macroptera, j) S. macrophylla. k) S. maxima, l) S. maxwelliana, m) S. pauciflora, n) S. platyclados, o) S. smithiana. Scale bar 10 µm. 117
124 Conclusion Shorea has seven types of stoma, with some species are homostomatic or heterostomatic. The stomata size in relatively small to medium in Shorea. All Shorea species investigated have elliptical guard cell pairs outline except circular in S. maxima thus diagnostic to this species. Other diagnostic characters found in this study are; lateral lobes with striae at right angles to the long axis of stomata in S. macrophylla, the tooth-like inner flanges in S. guiso, protruding stomatal rim in S. atrinervosa, narrow cuticular rim in S. singkawang and cyclocytic stomata in S. macrophylla. Findings in this study have shown taxonomic value of stomatal features in Shorea. Acknowledgement We are grateful to Grant GP-K and GUP for funding this research. References Baranova, M a. Principles of comparative stomatographic studies of flowering plants. The Botanical Review, 58 (1): Carpenter, K. J Stomatal architecture and evolution in basal angiosperms. American Journal of Botany, 92 (10): Carpenter, K. J Specialized structures in the leaf epidermis of basal angiosperms: morphology, distribution and homology. American Journal of Botany, 93 (5): Johansen, D.A Plant Microtechnique. McGraw-Hill, New York. Metcalfe, C.R. & Chalk, L Anatomy of the Dicotyledons: Leaves, Stem and Wood in Relation to Taxonomy with Notes on Economic Uses. Volume I. The Clarendon Press, Oxford. Noraini, T Systematic studies of Shorea, Hopea, Parashorea and Neobalanocarpus (Dipterocarpaceae) in Malaysia. PhD Thesis. University of Reading. Noraini, T. & Cutler, D.F Leaf Anatomical and Micromorphological Characters of Some Malaysian Parashorea (Dipterocarpaceae). Journal of Tropical Forest Science 21(2): Rajagopal, T Distributional patterns and taxonomic importance of foliar stomata. Indian Journal of Botany. 2 (1): Sass, J.E Botanical Microtechnique. Third edition. Iowa State University, Ames. Van Cotthem, W Stomatal types and systematics. Botanical Journal of the Linnean Society, 67 (1):
125 3.2 Inhibitory effect of lemongrass (Cymbopogon citratus) leaves and stem extracts against Fusarium proliferatum pathogen isolated from banana fruit Introduction Nur Baiti Abd Murad, Nur Ain Izzati Mohd Zainudin, Muskhazli Mustafa and Khozirah Shaari The National Geographic recognized bananas as the world s most popular fruit in 2017 and certainly, it is common in a diet of many Malaysian (Tumin and Ahmad Shaharudin, 2019). Besides being eaten raw, bananas are also the main ingredient in many of the nation s favorite tradition and modern foods. Malaysia had become a net exporter of bananas in 2017, where more than 20,000 MT of bananas have been exported which approximately 8% of estimated production with the price at RM 40.1 million. There could be a potential income prospect for the farmers and agropreneurs in Malaysia as the export has been increasing over the years. However, exporting bananas will depend on many factors such as the ability to produce constant supply and high quality of the fruits. The average price of banana in the farms, the wholesale and retail have almost tripled from 2000 to The rising prices could be the consequence of various potential demand and supply related reasons, such as declining banana supply due to the incidence of diseases or pest and high production costs. Even some of the banana varieties have been exclusively planted for the exportation, the fruit quality still needs to be more improved in the future (Darvari et al., 2010) since bananas are always at high risk for fungal infection in the field and post-harvest. In the previous study, the most significant disease severity in banana fruits was caused by Fusarium proliferatum (Abd Murad et al., 2017). The fungus has started the infection at harvest stage and the first symptoms appear after packaging and shipping from the production center to the marketplaces. The infection might occur on the exposed tissue such as the crown part of the fruits with the presence of developed mycelia, followed by internal development in the softest tissue of the fruit such as peduncle area, hence, resulting in softening and blackening the whole fruits. There are many synthetic chemical treatments have been applied to control fruit rot disease in banana. However, utilization of these synthetic fungicides continuously may cause accumulation of toxic residuals in the fruit tissues leading to the development of resistance stage by the pathogenic fungi and eventually affecting human health and environment. Therefore, finding an effective alternative to naturally control this disease is increasing urgency. On the other side, as one of the tropical country, Malaysia has been 119
126 blessed with a diversity of plants with antimicrobial properties. Cymbopogon citratus, commonly known as lemongrass is one of them that can be found easily and abundantly throughout the country. Previously, it was reported that different type of C. citratus extracts showed several important therapeutic potentials such as antibacterial, antifungal, antitumoral, anticancer and insecticide activities (Zulfa et al., 2016). Lemongrass is well known to comprise numerous bioactive compounds reside in its essential oil and aqueous extract found to be useful in some health issues (Olorunnisola et al., 2014). Thus, this study was conducted to examine the antifungal activity of lemongrass extracts using a different type of extraction solvents against F. proliferatum. Materials and methods Plant material Cymbopogon citratus (lemongrass) was collected in a vegetable farm in Tanjong Karang, Selangor. The plants were collected using a hoe and cutter. The leaves and the stem part of the lemongrass were cleaned and kept separately until the next use. Fresh lemongrass leaves and stems extracts One hundred gram of lemongrass leaves and stem were blended in 1000 ml of sterile distilled water. The mixture was homogenized using a blender (Waring Commercial Blender, Waring Products) under high mode for 2 minutes. The extract was then filtered through four folds of sterile cheesecloths followed by a layer of sterile Whatman filter paper (No. 1). This extract was considered as 10% w/v concentration and was evaporated to dryness using freeze dryer to obtain the powdered extract. The powdered extract was kept at 4 C until consequent use (Nur Fatimma et al., 2018). Dried lemongrass leaves and stems extracts The freeze-dried lemongrass leaves and stem were ground and sieved. The powdery leaves and stem were then stored in airtight container respectively at 4 C. Thirty gram of leaves and stem powder were weighed and separately added into 300 ml of cold water, hot water, ethanol and hexane in Erlenmeyer flasks. These mixtures were considered as 10% w/v concentration and agitated in a rotary shaker at 150 rpm and 30 C for 24 hours. The extracts were filtered through four folds of sterile cheesecloths followed by a layer of sterile Whatman filter paper (No. 1). The solvents were evaporated to dryness using a rotary evaporator. The dried extracts were kept at 4 C until further analysis (Samsudin et al., 2018). 120
127 Source of fungal culture Fungal pathogen used in this study is F. proliferatum (B2433B) which is pathogenic to banana fruits. This culture was obtained from Mycology Laboratory of Department of Biology, Faculty of Science, Universiti Putra Malaysia. The fungus was cultured on potato dextrose agar (PDA). Screening of antifungal activity of lemongrass extracts against F. proliferatum Plant extracts were prepared in 10% dimethyl sulfoxide (DMSO) to a final concentration of 100 mg/ml and sterilized by filtering through syringe filter with 0.22 µm of pore size. The antifungal screening test was conducted by poisoned food method. The plant extracts were added to the PDA in Petri plate (90 mm) aseptically and allowed to solidify. A mycelial disc of 5 mm diameter of the pure culture from 7 days old culture was inoculated on the center of the medium by using (5 mm) cork borer and incubated at room temperature 25 ºC ± 2 ºC. The plates with 10% DMSO alone and 0.1% carbendazim were included as treatments, while plates with no plant extracts and other treatments served as controls. Five replicates were used and the whole experiment was repeated once in a completely randomized design (CRD). The mycelial growth was determined at day 7 after inoculation (Sundis & Baharuddin, 2012). Data collection The diameter of the inhibition zone was measured in each case of successive seven days. Percentage inhibition was calculated from data obtained by using the formula (Mondali et al., 2009): % FG = [(DC DR) / DC] x 100; where % FG = percentage of inhibition of fungi growth; DC = diameter of control; DR = diameter of test. Statistical analysis The experimental data were analysed using IBM SPSS Statistics 22 for Windows System. In vitro study of mycelial growth was measured in diameter (mm) with a data type being converted to percentage inhibition. The data were analysed using a one -way analysis of variance (ANOVA). Tukey s HSD test was used to find the significant difference among means at the probability level of p < 0.05 (Nur Fatimma et al., 2018). 121
128 Results and discussion The extracted plant using water, ethanol and hexane have been reported to have antifungal activity at various levels and show potential for the control of phytopathogenic fungi. The diversity of bio-constituents of the plant extracts may produce different responses in inhibiting the tested microorganisms, besides the other related factors including solubility, ph, volatility, diffusion characteristics in the culture medium and the type of tested microorganisms. The use of different extraction solvents suggested a biochemically different range of bioactive compounds from polar to non-polar (Cerqueira Sales et al., 2016; Samsuddin et al., 2018). The in vitro tests showed that the leaves and stem of lemongrass (Cymbopogon citratus) displayed antifungal activity against F. proliferatum. The results showed that different extract forms using different extraction solvents showed varied in their effectiveness in inhibiting fungi growth. Generally, the water and ethanol extracts showed good diffusion in the culture media due to their hydrophilic character, thus, making more bioactive chemical constituents available in the media compared to hexane extracts. Hot water dried stem extract (LSH) was significantly inhibited the mycelial growth of F. proliferatum pathogen as shown in Figure 1 when compared to both control and other treatments. Even though it did not show a highly significant inhibition effect compared to carbendazim, yet it was showing high potential inhibition effect to combat the growth of the pathogen amongst other extract forms. Culture plate treated with DMSO did not show any inhibition zone against the tested pathogen, thus, confirmed its application as a diluent for dried crude extracts has nothing to do with the extracts antifungal property. In addition, hexane extracts of both leaves and stem did not show any inhibition against the pathogen (Table 1). This perhaps, show the resistance of pathogens might rely on various virulence factors, and that different lemongrass parts extracted with different extraction solvents will produce different bioactive constituents which in turn can attack different aspects of pathogenicity. The data of this present study will provide an idea about the phytochemical nature of the extracts. The mycelial growth of F. proliferatum was inhibited in culture plates treated with hot water extract of lemongrass stem under in vitro condition. It showed the presence of some of the chemical constituents that possess antifungal properties. This finding is in agreement with the results of a previous study by Dwivedi and Sangeeta (2015), where the aqueous extract of C. citratus possess a high degree of antifungal activities against the Saprolegnia parasitica, Sclerotium rolfsii Sacc and inhibit the growth of Colletotrichum graminicola by 100% concentration. 122
129 Cymbopogon citratus was reported to consist of many organic compounds such as terpenoids but the major component is citral. According to Villalobos (2015), citral is a volatile compound and many plant volatiles exhibit anti-microbial and anti-herbivore activity, which aid as indirect plant defenses. It was able to damage the cell wall and membrane of Aspergillus flavus spores by entering the cell and causing further damage by interfering with DNA and mitochondrial processes as well as the aggregation of proteinlike molecules leading to metabolic disorder and eventually, lose the capacity of the spores to germinate. Citral also showed antifungal activity against several fungal species whic h cause severe postharvest diseases in fruits such as Colletotrichum musae, Colletotricum gloeosporioides, Penicillium digitatum and Fusarium subglutinans f. sp. ananas by altering the hyphae morphology of the fungi (Garcia et al., 2008). Cymbopogon citratus also contains active components such as alkaloids, tannins, flavonoids, terpenes, and phenolic compounds. Phenols and flavonoids are widely being reported can cause membrane disruption while alkaloids are thought to inhibit the growth of microorganisms by affecting their genetic materials (Zulfa et al., 2016). Table 1: Antifungal inhibitory effect of lemongrass extracts using poisoned food method against F. proliferatum pathogen isolate Treatments Inhibition of mycelial growth of (%) F. proliferatum Control LLF (cold water fresh leaves) e 0.00 a LLC (cold water dried leaves) c 0.00 a LLH (hot water dried leaves) c 0.00 a LLEtOH (ethanol dried leaves) bc 0.00 a LLHex (hexane dried leaves) 0.00 a 0.00 a LSF (cold water fresh stem) d 0.00 a LSC (cold water dried stem) bc 0.00 a LSH (hot water dried stem) f 0.00 a LSEtOH (ethanol dried stem) b 0.00 a LSHex (hexane dried stem) 0.00 a 0.00 a Carbendazim g 0.00 a DMSO 0.00 a 0.00 a A B C D E 123
 Culture plate treated with cold water fresh leaves extract (LLF); E) Culture plate treated with cold water dried leaves extract (LLC); F) Culture plate treated with hot water dried")
; J) Culture plate treated with cold water dried stem extract (LSC); K) Culture plate treated with hot water dried stem extract (LSH); L) Culture plate treated with ethanol")
130 F G H I J K L M Figure 1: Effect of different type of lemongrass extracts on F. proliferatum. A) Control culture plate; B) Culture plate treated with 10% DMSO alone; C) Culture plate treated with 0.1% carbendazim; D) Culture plate treated with cold water fresh leaves extract (LLF); E) Culture plate treated with cold water dried leaves extract (LLC); F) Culture plate treated with hot water dried leaves extract (LLH); G) Culture plate treated with ethanol dried leaves extract (LLEtOH); H) Culture plate treated with hexane dried leaves extract (LLHex); I) Culture plate treated with cold water fresh stem extract (LSF); J) Culture plate treated with cold water dried stem extract (LSC); K) Culture plate treated with hot water dried stem extract (LSH); L) Culture plate treated with ethanol dried stem extract (LSEtOH) and M) Culture plate treated with hexane dried stem extract (LSHex). Conclusion In conclusion, the potential of C. citratus stem extract to be used as a natural antifungal agent is recommendable as antifungal activity against F. proliferatum were demonstrated as well as its antifungal against several phytopathogenic fungi being reported previously. Further analyses on its minimum inhibitory concentration (MIC) are necessary; besides, the active constituents and possible inhibitory mechanisms of C. citratus extract would be interesting. The development of natural plant extracts and active compounds would be a great alternative to the synthetic chemical fungicide. 124
131 Acknowledgement This work was supported by the Fundamental Research Grant Scheme (grant no. FRGS/1/2018/STG03/UPM/02/12/ ) to Nur Ain Izzati M.Z. Nur Baiti A.M received a scholarship from the Graduate Research Fellowship (GRF), UPM. We would like to thank Mrs. Nor Hidayah Husain for technical assistance. References Abd Murad NB, Mohamed Nor NMI, Shohaimi S and Mohd Zainudin NAI (2017) Genetic diversity and pathogenicity of Fusarium species associated with fruit rot disease in banana across Peninsular Malaysia. Journal of Applied Microbiology, 123, Cerqueira Sales MD, Barcellos Costa H, Bueno Fernandes PM, Aires Ventura J and Dummer Meira D (2016) Antifungal activity of plant extracts with potential to control plant pathogens in pineapple. Asian Pacific Journal of Tropical Biomedicine, 6, Darvari FM, Sariah M, Puad MP and Maziah M (2010) Micropropagation of some Malaysian banana and plantain (Musa sp.) cultivars using male flowers. African Journal of Biotechnology, 9, Dwivedi SK and Sangeeta (2015) Efficacy of some medicinal plant extract agains t Fusarium oxysporum f. sp. ciceri causing chickpea wilt. Asian Journal of Crop Science, 7, Garcia R, Alves A, Santos M, Viegas Aquije G, Fernandes A, Dos Santos R, Ventura J and Fernandes P (2008) Antimicrobial activity and potential use of mono terpenes as tropical fruits preservatives. Brazilian Journal of Microbiology, 39, Mondali N, Mojumdar A, Chatterje S and Banerjee A (2009) Antifungal activities and chemical characterization of neem leaf extracts on the growth of some selected fungal species in vitro culture medium. Journal Application Science Environment Management, 13, Nur Fatimma A, Munirah MS, Sharifah Siti Maryam SAR, Najihah A and Nur Ain Izzati MZ (2018) Efficacy of Allium sativum extract as post-harvest treatment of fruit rot of mango. Plant Pathology and Quarantine, 8, Olorunnisola SK, Asiyanbi HT, Hammed AM and Simsek S (2014) An overview: Biological properties of lemongrass. International Food Research Journal, 21, Samsudin NIP, Lee HY, Chern PE, Ng CT, Panneerselvam L, Phang SY, Tan WT and Mahyudin NA (2018) In vitro antibacterial activity of crude medicinal plant extracts against ampicillin+penicillin-resistant Staphylococcus aureus. International Food Research Journal, 25, Sundis MA and Baharuddin S (2012) Inhibitory activity of plant extracts against microbes isolated from sick building. Health and the Environment Journal, 3,
132 Tumin AA and Ahmad Shaharudin AA (2019) Banana: The world s most popular fruit. Khazanah Research Institute, Villalobus MC (2015) Antioxidant activity and citral content of different tea preparations of the above-ground parts of lemongrass (Cymbopogon citratus Stapf.). Technical Report, Zulfa Z, Chia CT and Rukayadi Y (2016) In vitro antimicrobial activity of Cymbopogon citratus (lemongrass) extracts against selected foodborne pathogens. International Food Research Journal, 23,
133 3.3 Nutritional values of fresh and roasted Sacha inchi kernel and its cake Zarinah Zakaria, Farah Syimira Rasdi, Azmil Haizam Ahmad Tarmizi, Napisah Hussin, Norshazila Shahidan and Che Abdullah Abu Bakar Introduction Sacha inchi (Plukenetia volubilis L.), also named Inca peanut, wild peanut, Inca inchi or mountain peanut, is a plant of the Euphorbiaceae family, which grows in the Amazonian forest (Hamaker et al., 1992). In Malaysia, Rubber Industry Smallholders Development Authority (RISDA) introduced Sacha inchi for smallholders and farmers as an effort to increase their income as they will benefit from this plant which has a lifespan of 20 years. Perak, Pulau Pinang, Kedah and Perlis will be the pioneer of Sacha inchi plantation (MyMetro, 2017). The protein content of Sacha inchi (~27%) is similar to other oil seeds such as soybean, cottonseed and sunflower (Hamaker et al., 1992). Besides that, Gutiérrez et al. (2011) also reported that Sacha inchi seeds contain many valuable minerals mainly potassium ( mg/kg), magnesium (3210 mg/kg) and calcium (2406 mg/kg) making this seed suitable to be used in human diet for supplying these elements. Apart from this nutrient-rich seed, the oilseed cake was a by-product of oil extraction process. The pressedcake still contains various amounts of bioactive compounds such as free fatty acids, glycerides, phosphatides, sterols, tocopherols and protein fragments (Chirinos et al., 2013). As Sacha inchi kernel and its cake have many nutrients include protein, minerals and bioactive compounds, it might be concluded that this plant are nutritious as well as forming excellent sources of vegetable fats and protein. Common process applied to Sacha inchi kernel before consumption as a snack was roasting in order to eliminate astringent off-flavors and possible antinutritional factors (Cisneros et al., 2014). The by-product after oil extraction which is the pressed-cake will be disposed. However, the by-product might also contain some valuable nutrient and minerals that would be useful as functional food ingredient. Besides that, this plant has rarely been studied and the report regarding the nutritional composition of Sacha inchi kernel as well as its cake was limited. The significance of this study was the characterization of nutritional value of Sacha inchi kernel and its cake. Other than that, the reports regarding this newlyintroduced plant will increase as well as give impact towards society since it will generate income and creating new industry especially for farmers in Malaysia. Thus, the main objective in this study was to determine the proximate values and minerals content of Sacha inchi kernel and its cake. 127
134 Materials and methods Sacha inchi kernel and its cake were acquired from local producer in Bukit Payong, Terengganu, Malaysia. Hard shell was removed to obtain the fresh kernel. For roasted kernels, the fresh kernel was roasted at temperature 120 ºC for 10 minutes (Yossaporn et al., 2017). Meanwhile, Sacha inchi pressed-cake was obtained after oil extraction using mechanical cold press machine. The kernel and its cake were ground into powder and the n proceed for proximate and minerals analysis. Proximate analysis The moisture, ash, protein, fibre and fat contents of Sacha inchi kernel and its cake were determined according to the Association of Official Analytical Chemists (AOAC) method (AOAC, 2000). The nitrogen content was converted to protein by multiplying by a conversion factor of 5.3. Available carbohydrates were calculated by difference. The analysis of each sample was performed in triplicates. The proximate result was expressed in wet basis. Mineral analysis Mineral compositions of fresh and roasted Sacha inchi kernel and its cake was determined according to the method of Naozuka et al. (2011) with some modifications by using Thermo Scientific Inductively Coupled Plasma Optical Emission Spectrometry (ICP-OES) (Thermo Fisher Scientific, USA). Statistical analysis The experiments were performed in triplicates and the results were expressed as mean ± standard deviation. One-way analysis of variance (ANOVA) was conducted using SPSS software to determine the mean values among the samples. The statistical differences were determined at p < Results and discussion Table 1 showed the nutrients that were present in fresh and roasted Sacha inchi kernels in varied levels. The dominant nutrient content in Sacha inchi kernels were fibre, protein and fat. Both kernels have high content of fibre in the range of % so it has enough fibre for dietary nutrition which will help to maintain intestinal distention, reduce constipation, colon diseases and cancer as reported by Njoku et al. (2007). Besides, the kernels also have high protein content ranges from 26.62% to 27.33% which was 128
135 approximately like that reported by Hamaker et al. (1992) whereby the protein content is 27%. The protein content was higher than reported by Gutiérrez et al. (2011) with 24.7%. These percentages can be related to other oil seeds such as sesame (~25%), peanut (23% w/w) and sunflower (24% w/w) (Bodwell and Hopkins, 1985). Their high percentage (%) of protein will make them serve as a proper source of amino acids and protein for both man and animal and this value exceeded FAO recommended value (19.8%) (FAO, 2004). Moreover, proteins play important role in human body such as being used for the production of hormones, enzymes and blood plasma, acts as immune boosters as well as help in cell division and growth (Okeke & Elekwa, 2006). In addition, the percentage (%) of ash in the kernels ( %) indicates high inorganic matter that could be retained in the body and a reflection of mineral content preserved in the plant. Besides, Sacha inchi kernels contained high amount of fat in the range of 52.45% %. The high content of crude fat showed that the kernel is suitable to be used as functional food ingredient to produce more palatable food products because fats function to increase food palatability by absorbing and retaining the flavors (Okonkwo & Okafor, 2016). Table 1 also shows the calculated fatty acid for Sacha inchi kernel in the ranges of %. This is relatable with the finding by Maurer et al. (2012) that reported Sacha inchi oil is rich in alpha-linolenic and linoleic acids, approximately 50% and 34% respectively. The high concentration of alpha-linolenic acid making Sacha Inchi a good source of this essential fatty acid and also could be used as food supplement (Gutiérrez et al., 2011). Sacha inchi kernel contains a relatively low value of total carbohydrate in the range of % due to the high levels of fat and protein. The metabollizable energy (ME) of Sacha inchi kernel, calculated from the contents of fat, protein and carbohydrate, ranges from kj/100 g. ME has been defined as the amount of energy available for total (whole body) heat production at nitrogen and energy balance (Livesey, 2001). Energy-dense foods are generally described as those that are high in fat, sugar or starch (Kant, 2000; WHO, 2003). As the kernels has high content of fat, so it can be classified as an energy-dense food which will supply enough energy required by human body. As described in detail in the report of the most recent Expert Consultation on Energy in Human Nutrition (FAO, 2004), humans need food energy to cover the basal metabolic rate, the metabolic response to food, the energy cost of physical activities and accretion of new tissue during growth and pregnancy, as well as the production of milk during lactation. Based on results stated in Table 1, the moisture content of fresh and roasted Sacha inchi kernel were 5.24% and 2.90% respectively which is a bit low when compared with legumes which range between % (Arkroyed & Doughty, 1984). This shows that the kernels are very high in dry matter content which is an advantage because it reduces 129
136 microbial activities, prevent oxidation-reduction reaction, algae and fungi growth and increase their shelf life when properly stored (Okonkwo & Okafor, 2016). Table 1: Proximate analysis of Sacha inchi kernel Analysis Fresh kernel Roasted kernel Moisture (%) 5.24 ± 0.67 a 2.90 ± 0.60 b Ash (%) 2.38 ± 0.05 a 2.45 ± 0.02 a Protein (%) ± 0.14 a ± 0.16 b Fibre (%) ± 3.22 a ± 1.00 a Fat (%) ± 3.87 a ± 9.02 a Carbohydrate (%) ± 3.34 a ± 9.60 a Fatty acid (%) ± 3.09 a 42.17± 7.22 a Energy (kj/100 g) ± a ± a Values are mean ± standard deviation in triplicates determinations Values followed by different letter in same row are significantly different at p<0.05 *a calculated fatty acid (0.8 crude fat), *b calculated metabolizable energy (kj/100 g) [(protein 17) + (fat 37) + (carbohydrate 17)] (Ekeanyanwu & Ononogbu 2010) Proximate composition of fresh and roasted Sacha inchi cake were presented in Table 2. According to the results, protein was the largest amount in the cakes range from to 54.08%. The results were approximately similar with Rawdkuen et al. (2016) that reported the protein content of cakes from Plukenetia volubilis is 56.61%. The results also shown that there was a significant difference (p < 0.05) between fresh and roasted Sacha inchi cake in term of moisture, ash, protein, fat, carbohydrate, fatty acid and energy value. This result was in agreement with the findings of Wollgast & Anklam (2000) which stated that the difference in proximate composition might due to roasting process that alters the structure of some molecules including proteins. Moreover, based on Table 2, roasted cake has lower moisture content than fresh cake. This might due to the thermal treatment applied to foods which is roasting process that cause moisture evaporates to surrounding (Xu & Chang, 2008). The results of the mineral analysis in fresh and roasted Sacha inchi kernels were given in Table 3. It was observed that the major minerals found in fresh and roasted Sacha inch i kernel were potassium ( mg/kg), magnesium ( mg/kg) and calcium ( mg/kg). Minor amounts of sodium ( mg/kg), zinc ( mg/kg), chromium ( mg/kg), aluminium (
137 mg/kg), cadmium ( mg/kg), plumbum ( mg/kg) and nickel ( mg/kg) were also present in Sacha inchi kernels. Table 2: Proximate analysis of Sacha inchi kernel cake Analysis Fresh cake Roasted cake Moisture (%) 9.23 ± 0.02 a 8.11 ± 0.01 b Ash (%) 4.31 ± 0.01 a 4.87 ± 0.07 b Protein (%) ± 0.36 a ± 0.01 b Fibre (%) 2.62 ± 0.11 a 2.93 ± 1.06 a Fat (%) ± 0.01 a 9.48 ± 0.07 b Carbohydrate (%) ± 0.34 a ± 0.01 b Fatty acid (%) 9.87 ± 0.01 a 7.58 ± 0.06 b Energy (kj/100 g) ± 0.16 a ± 2.74 b Values are mean ± standard deviation in triplicates determinations Values followed by different letter in same row are significantly different at p<0.05 *a calculated fatty acid (0.8 crude fat), *b calculated metabolizable energy (kj/100 g) [(protein 17) + (fat 37) + (carbohydrate 17)] (Ekeanyanwu & Ononogbu 2010) The values for mineral found in Sacha inchi kernels were quite different compared to study by Gutiérrez et al. (2011) whereby the values were potassium ( mg/kg), magnesium (3210 mg/kg), calcium (2406 mg/kg), sodium (15.4 mg/kg) and zinc (49 mg/kg). The difference in the mineral composition were might due to soil composition as reported by Blackwood (2007). The results show that there was no significant difference (p > 0.05) in mineral composition of fresh and roasted Sacha inchi kernels indicates that the roasting process at 120 ºC does not affect the mineral content in the kernels. Minerals like potassium, magnesium, calcium, chromium and nickel provide many health benefits. Potassium is an important component of cell and body fluids and also aids in controlling heart rate and blood pressure while magnesium is required for ATP production and bone stability. Calcium plays essential role in blood clotting, muscle contraction, nerve transmission as well as bone and tooth formation (Freitas et al., 2010). Chromium were essential for metabolism of fats, carbohydrates and the synthesis of proteins while nickel play important roles in hormonal activity, lipid metabolism, activation of some enzymes as well as stabilisation of DNA and RNA (Nabrzyski, 2007; Grembecka & Szefer, 2011). 131
138 Table 3: Mineral analysis of Sacha inchi kernel Minerals (mg/kg) Fresh kernel Roasted kernel Sodium (Na) ± a ± a Potassium (K) ± a ± a Zinc (Zn) ± 5.88 a ± 8.99 a Magnesium (Mg) ± a ± a Calcium (Ca) ± a ± a Chromium (Cr) ± 0.51 a ± 2.40 a Aluminium (Al) ± a ± a Cadmium (Cd) 3.61 ± 0.30 a 3.41 ± 0.06 a Plumbum (Pb) ± 1.57 a ± 0.79 a Nickel (Ni) 4.76 ± 0.26 a 5.19 ± 0.19 a Values are mean ± standard deviation in triplicates determinations Values followed by different letter in same row are significantly different at p<0.05 Mineral contents of pressed-cake from fresh and roasted Sacha inchi kernels were shown in Table 4. Potassium was the highest element for both cakes ( mg/kg for fresh and mg/kg for roasted, respectively). Magnesium was the second abundant mineral in Sacha inchi cake ranges from to mg/kg. The next major element was calcium in the range of mg/kg. Other elements that present in Sacha inchi cakes were sodium, zinc, iron, chromium, aluminium, cadmium, plumbum and nickel. From Table 4, it shows that there was significant difference (p < 0.05) in sodium, iron, aluminium and cadmium value after roasting process. Meanwhile, no significant difference (p > 0.0 5) between both cakes in term of potassium, magnesium, calcium, zinc, chromium, plumbum and nickel. This may indicate that both cakes still contained high amount of minerals even after roasting process and hence can be a new functional food ingredients for the application in food industry. Conclusion Sacha inchi kernel contained major amounts of protein, fibre and fat which gave many beneficial effects to human body while Sacha inchi cake contained high amount of proteins. Both Sacha inchi kernel and cake contain major minerals like potassium, magnesium and calcium which had been reported to play essential role in human health. Roasting process applied to Sacha inchi kernels at 120 ºC gave effect to proximate and minerals composition 132
139 of fresh and roasted kernel as well as its cake. From the study, it is clear that Sacha inchi kernel and its by-product (cake) could be used in food industry because of an increasing tendency towards functional food products. Table 4: Mineral analysis of Sacha inchi kernel cake Minerals (mg/kg) Fresh cake Roasted cake Sodium (Na) ± 0.46 a ± b Potassium (K) ± a ± a Zinc (Zn) ± 7.12 a ± 1.67 a Iron (Fe) ± 6.64 a ± 0.37 b Magnesium (Mg) ± a ± a Calcium (Ca) ± a ± a Chromium (Cr) ± 0.04 a ± 0.90 a Aluminium (Al) ± 0.68 a ± 1.92 b Cadmium (Cd) 3.43 ± 0.01 a 3.96 ± 0.01 b Plumbum (Pb) ± 0.76 a ± 0.53 a Nickel (Ni) 4.92 ± 0.05 a 4.16 ± 0.29 a Values are mean ± standard deviation in triplicates determinations Values followed by different letter in same row are significantly different at p<0.05 Acknowledgements This research was supported by Fundamental Research Grant Scheme (FRGS/1/2018/STG01/UNISZA/03/1, RR258), Ministry of Higher Education Malaysia. Authors also would like to thank the Faculty of Bioresources and Food Industry as well as Research Management, Innovation & Commercialization Centre, RMIC UniSZA. References AOAC (2000) Official Methods of Analysis. 17th ed. Gaithersburg, Maryland, USA, AOAC International. Arkroyed WR and Doughty J (1984) Legumes in human nutrition food and agricultural organization. Nutrition studies publication, Atlanta, G. A., 19. Blackwood I. (2007) Mineral content of common ruminant stockfeeds, crops and pastures. NSW Department of Primary Industries (DPI). Primefact 522. Bodwell C and Hopkins D (1985) Nutritional characteristics of oilseed proteins. New 133
140 protein foods 5. Chirinos R, Zuloeta G, Pedreschi R, Mignolet E, Larondelle Y and Campos D (2013) Sacha inchi (Plukenetia volubilis): A seed source of polyunsaturated fatty acids, tocopherols, phytosterols, phenolic compounds and antioxidant capacity. Food Chemistry, 141, Cisneros FH, Paredes D, Arana A, Cisneros-Zevallos L (2014) Chemical composition, oxidative stability and antioxidant capacity of oil extracted from roasted seeds of Sacha-inchi (Plukenetia volubilis L.). Journal of Agricultural and Food Chemistry, 62(22), Ekeanyanwu RC and Ononogbu CI (2010) Nutritive Value of Nigerian Tigernut (Cyperus esculentus L.) Agricultural Journal, 5(5), FAO (2004) Energy in human nutrition. Report of a Joint FAO/WHO/UNU Expert Consultation. FAO Food and Nutrition Paper, No. 78. Rome. Freitas ST, Amarante CVT, Labavitch JM and Mitcham EJ (2010) Cellular approach to understand bitter pit development in apple fruit. Postharvest Biology and Technology, 57(1), Grembecka M and Szefer P (2011) Metals and metalloids in foods: essentiality, toxicity and applicability, in Medina DA and Laine AM (Eds.), Food quality: control, analysis and consumer concerns Hauppauge: Nova Science Publishers, Gutiérrez L, Rosadab L and Jiméneza A (2011) Chemical composition of Sacha Inchi (Plukenetia volubilis L.) seeds and characteristics of their lipid fraction. Grasas y Aceites, 62 (1), Hamaker BR, Valles C, Gilman R, Hardmeier RM, Clark D, Garcia HH, Gonzales AE, Kohlstad I, Castro M, Valdivia R, Rodriguez T and Lescano M (1992) Amino acid and fatty acid profiles of the Inca Peanut (Plukenetia Volubilis). Cereal Chemistry, 69, Kant AK (2000) Consumption of energy-dense, nutrient-poor foods by adult Americans: Nutritional and health implications. The Third National Health and Nutrition Examination Survey, American Journal of Clinical Nutrition, 72, Livesey G (2001) A perspective on food energy standards for nutrition labelling. British Journal of Nutrition, 85, Maurer NE, Hatta-Sakoda B, Pascual-Chagman G and Rodriguez-Saona LE (2012) Characterization and authentication of a novel vegetable source of omega -3 fatty acids, Sacha Inchi (Plukenetia volubilis L.) oil. Food Chemistry,134, MyMetro (2017) Sacha inchi tambah pendapatan pekebun. Downloaded from Accessed on 9 July Nabrzyski M (2007) Functional role of some minerals in foods. In Szefer P and Nriagu JO (Eds.), Mineral components in foods, London: CRC Press, Naozuka J, Vieira EC, Nascimento AN and Oliveira PV (2011) Elemental analysis of nuts and seeds by axially viewed ICP-OES. Food Chemistry, 124 (4),
141 Njoku OU, Boniface JAE, Obitte NC, Odimegwe DC and Ogbu HI (2007) Some nutriceutical potential of beniseed oil. International Journal of Applied Research in Natural Products, 4(5), Okeke CU and Elekwa I (2006) Proximate and preliminary phytochemical analyses of avocado pear Persea gratissima Gaertn. f. (family Lauraceae). Nigerian Journal of Botany, 19, Okonkwo SI and Okafor EC (2016) Determination of the Proximate Composition, Physicochemical Analysis and Characterization of Fatty Acid on the Seed and Oil of Gossypium Hirsutum, International Journal of Chemistry, 8(3), Rawdkuen S, Murdayanti D, Ketnawa S and Phongthai S (2016) Chemical properties and nutritional factors of pressed-cake from tea and sacha inchi seeds. Food Bioscience, 15, WHO (2003) Diet, Nutrition and the Prevention of Excess Weight Gain and Obesity. Report of a Joint WHO/FAO Expert Consultation. WHO Technical Report Series No Geneva. Wollgast J and Anklam E (2000) Polyphenols in chocolate: Is there a contribution to human health? Food Research International, 33, Xu B and Chang SKC (2008) Total phenolics, phenolic acids, isoflavones and antioxidant properties of yellow and black soybeans as affected by thermal processing. Journal of Agricultural and Food Chemistry, 56, Yossaporn P, Paweena R, Pittaya C and Pattaneeya P (2017) Biochemical and Antioxidative Properties of Unprocessed and Sterilized White and Black Sesame by-product from Northern Thailand. Current Research in Nutrition and Food Science Journal, 5(3),
142 3.4 Preliminary study on antioxidant activity and total flavonoid content in four Malaysian lichens Introduction N.S. Rosli, S. Zulkifly, N.A. Zaharudin, N.N.F. Mat Lazim and R. Go Lichens are mutualistic association of a fungus and algae. Lichens ability to yield various bioactive secondary metabolites has raised interest in pharmacology due to their antioxidant potential (Fernández-Moriano, Gómez-Serranillos & Crespo, 2016). These bioactives exert antioxidant effects by reacting with free radicals, chelating catalytic metals and scavenging oxygen in biological systems (Halliwell & Gutteridge, 1984). Free radicals can cause oxidative stress in humans which leads to many complications such as cardiovascular diseases, cancer and neurological disorders (Mena, Ortega, & Estrela, 2009; Valko et al., 2007). Previously, synthetic antioxidants were used to overcome the oxidative effects in humans. However, these synthetic antioxidants have severe side effects which can be detrimental for human health. Hence, natural antioxidants from lichens can be used as alternative in preventing and treating disease related to oxidative stress. Thus, utilization of the lichen potential as natural source of antioxidants should be explored.the objectives of this study are: (i) to determine the antioxidant activity by using DPPH analyses of acetone extracts of four types of lichen species (ii) to determine the total flavonoid compound (TFC) in the tested lichens species extracted by acetone and (iii) to determine the relationship between TFC on DPPH activity of all tested lichen species. Materials and methods DPPH Assay DPPH assay was conducted as described by Shimada et al. (1992). The antioxidant activity was expressed as activity of scavenging by extract compared to standard which was ascorbic acid. For standard preparation, 1mg/mL of ascorbic acid was prepared in methanol. 250mg/mL of stock solution of each lichen species was prepared in DMSO. The sample solution was diluted six times with DMSO to known concentration (100μg/mL 3.125μg/mL). As for the assay preparation, 20μL of 100mg/mL extract was added into 180μL of 84μg/mL of DPPH solution in 96-well plate. The plate was incubated at room temperature in the dark 136
143 for 1 hour. As for standard, the same step was repeated by replacing sample extract with ascorbic acid solution. Blank were prepared by adding 20 μl of DMSO into 180μL of DPPH solution. The scavenging activity was calculated from the absorbance of decolorization by doing spectrophotometry analysis at 540nm. The antioxidants activity was expressed as the half maximal inhibition concentration or known as EC50. Total flavonoid content (TFC) The estimation of total flavonoids in the lichen extracts were carried out using Zilic method (Zilic et al., 2011). Flavonoid compound standard (quercetin) was prepared at six different concentrations (200μg/ml 6.25μg/ml). Then, the preparation of assay to determine total flavonoids content was performed. Firstly, an amount of 20μL of 100mg/mL sample or standard flavonoid compound solution (quercetin) was mixed with distilled water. 0.3mL of 5% of sodium nitrite solution and 10% of aluminium chloride solution were added into the sample/standard after 5 minutes. Then, 2 ml of 1mol/L of sodium hydroxide solution was added and the solution was incubated for 15 minutes. After 15 minutes, the total flavonoid content of lichen extracts was estimated spectrophotometrically at 510nm. A yellow colour indicated the presence of flavonoid compound in the extracts. All experiments were performed in triplicates. Results and discussion Based on Table 1, Ramalina farinacea (3.25 ± 0.05, p<0.05) exhibited highest antioxidant activity against DPPH free radicals meanwhile Cladia aggregata ( ± 1.23) showed lowest antioxidant activity. These findings were in accordance with previous study where Ramalina lichen extracted with acetone showed highest potent of antioxidant among all studied species (Bulbotrix isidiza, Parmotrema tinctorum and C. aggregata) (Stanly et al., 2011) and Cladonia lichen (Gunasekaran, 2016). R. farinacea ( ± 3.33) has shown to have the highest TFC and Parmelia sp. (35.09 ± 0.40) showed lowest TFC among all tested species. Correlation between TFC and DPPH radical scavenging activity (expressed in EC50) for three lichen species suggested strong antioxidant activity of TFC. EC50 value of Parmelia sp., C. aggregata and R. farinacea lichens have shown to be highly correlated with TFC (r=-0.998, r= and r= respectively). However, Cladonia sp. showed low degree correlation between TFC and EC50 value (r=0.158) although showing high antioxidant activity. The high correlation of TFC and DPPH shows that the flavonoid content may contribute to the antioxidant activity. Past study found that flavonoid content exhibited antioxidant activity in lichens (Gunasekaran, 2016). 137
144 Table 1: DPPH (EC50) and TFC in each lichen species and correlation analysis between DPPH (EC50) and TFC of lichens Lichen species DPPH, EC50 (μg/ml) TFC (μg QE/mg) Correlation coefficient (r) p-value Ramalina farinacea 3.25 ± ± Cladonia sp ± ± Parmelia sp ± ± * Cladia aggregata ± ± Footnote: Correlation is significant at 0.05 level (2-tailed), Conclusion R. farinacea showed potent antioxidant activity with EC50 value of 3.25 ± 0.05μg/mL compared to the standard (ascorbic acid) with EC50 value of ± μg/mL. The study has shown that there was high antioxidant activity of Malaysian lichens contributed by flavonoid compounds. Further study could be conducted to characterize other lichen compounds as natural sources of antioxidants. Acknowledgement The authors would like to acknowledge Universiti Putra Malaysia for funding for this project. This project was financially supported by UPM PUTRA IPM grant (GP/2017/ ), UPM PUTRA IPM grant (GP-IPS/2018/ ) and FRGS (FRGS/1/2016/STG03/UPM/01/1). References Barry Halliwell & John M. C. Gutteridge (1984). Free Radicals in Biology and Medicine. Oxford University Press, USA. Fernández-Moriano, C., Gómez-Serranillos, M. P., & Crespo, A. (2016). Antioxidant potential of lichen species and their secondary metabolites. A systematic review. Pharmaceutical Biology, 54(1), Gunasekaran, S., Rajan, V. P., Ramanathan, S., Murugaiyah, V., Samsudin, M. W., & Din, L. B. (2016). Antibacterial and Antioxidant Activity of Lichens Usnea rubrotincta, Ramalina dumeticola, Cladonia verticillata and Their Chemical Constituents. Malaysian Journal of Analytical Sciences, 20 (1):1-3. Jayalakshmi, C. P., & Sharma, J. D. (1986). Effect of butylated hydroxyanisole (BHA) and butylated hydroxytoluene (BHT) on rat erythrocytes. Environmental Research, 41(1),
145 Mena, S., Ortega, A., & Estrela, J. M. (2009). Oxidative stress in environmental-induced carcinogenesis. Mutation Research/Genetic Toxicology and Environmental Mutagenesis, 674(1 2), Shimada, K., Fujikawa, K., Yahara, K., & Nakamura, T. (1992). Antioxidative properties of xanthan on the autoxidation of soybean oil in cyclodextrin emulsion. Journal of Agricultural and Food Chemistry, 40(6), Stanly, C., Mohamed, D., Ali, H., Keng, C. L., Boey, P.-L., Bhatt, A., Bhatt, A. (2011). Comparative evaluation of antioxidant activity and total phenolic content of selected lichen species from Malaysia. Journal of Pharmacy Research, 4(8), Valko, M., Leibfritz, D., Moncol, J., Cronin, M. T. D., Mazur, M., & Telser, J. (2007). Free radicals and antioxidants in normal physiological functions and human disease. The International Journal of Biochemistry & Cell Biology, 39, Žilić, S., Hadži-Tašković Šukalović, V., Dodig, D., Maksimović, V., Maksimović, M., & Basić, Z. (2011). Antioxidant activity of small grain cereals caused by phenolics and lipid soluble antioxidants. Journal of Cereal Science, 54(3),
146 Introduction 3.5 Isolation, growth and cellulose extraction of selected green algae N. A. S. Amdan and S. Zulkifly Algae are simple photosynthetic organisms that lack true roots, stems, leaves, and vascular tissues. In terms of morphology, algae are divided into two groups called microalgae and macroalgae. Algae celluloses are of higher quality than the plant cellulose, highly valued and have wide applications in various industries. Green algae contain more cellulose in comparison to red or brown algae. Four species of green algae were selected to study their growth and cellulose contents which are Scenedesmus sp., Chlorella vulgaris (microalgae), Cladophora sp. and Enteromorpha sp. (macroalgae). The microalgae were collected at Putrajaya lakes while the macroalgae were collected from Port Dickson. These algae were cultivated in the laboratory with enriched media and nutrients for growth. Each alga was cultured in 5 replicates using 250 ml conical flasks. This study had shown that cellulose content extracted from Cladophora sp. algae is significantly higher than other algal cellulose. Further research should be done in order to produce more cellulose from seaweeds or macroalgae. Materials and methods Four selected algae were collected at two sampling sites which are Putrajaya Lakes and Port Dickson. The Cladophora sp. and Enteromorpha sp. were collected at Port Dickson while the Scenedesmus sp. and Chlorella sp. were collected at Putrajaya lake. Each isolated algae species selected were cultured in 5 replicates, each. Bold Basal medium was used for growth of microalgae and SD11 medium for macroalgae. Optimum growth of algae, ph, and light intensity as well as chlorophyll contents for each alga were recorded. Extraction of chlorophyll from algae The extraction of chlorophyll from algae was done by using acetone. The reading was recorded by using spectrophotometer machine at three different wavelengths which were 630, 647 and 664 nm. The wavelength was used based on the formula of Jeffrey and Humprey (1975). Extraction of cellulose from algae After exponential growth of algae was achieved, algal cellulose was extracted from Cladophora sp., Scenedesmus sp., Enteromorpha sp. and Chlorella sp. Cellulose was extracted from the five replicates of a conical flask of each alga. The cellulose powder 140
147 was weighed, and data were recorded. The analysis was performed using SPSS (Statistics Package for Social Science) version 20. Result and discussion The measurements culture and growth of Chlorella vulgaris for 30 days The Chlorella vulgaris was incubated for 30 days for biomass production. The growth curve of Chlorella vulgaris through 30 days is shown in Figure 2. Figure 1: Chlorella vulgaris growth curve from day 5 until day 30. The growth curve of Chlorella sp. is sigmoid. There were four growth phases shown on the graph. According to growth curve of Chlorella sp., at day 5 until day 10 was the lag phase. Basically, after isolation, the alga was transferred into new culture medium. The growth does not increase rapidly because the cells need time to adjust. However, after the lag phase, the algae growth will increase until they reached the exponential phase. The cultures were in exponential phase in day 10 until day 15. Stationary phas e was reached after day 15 until day 20. In the exponential phases, the light intensity, temperature, and amount of nutrients affected the growth rate. Krishnan et al. (2015) reported that the algae started to multiply continuously and have an increment in biomass because of high amount of nutrients in the medium. Therefore, the growth of algae for Chlorella sp. were the highest during the exponential phases until day 20. Next, in stationary phases the growth rate decreases until reached zero, however, the population still increased. Based on Krishnan et al. (2015) the cell division of algae are equal with the death cell of algae during stationary phase. However, the algae reached the death phases on day 20 onwards. In death phases, the cell division was lower than the death rate of the algae. The population of algae starts to decrease. This is supported by Zuka, McConnel, and Farag (2012) which said that the 141
148 lysis phase is due to depleted of nutrients, limited of oxygen, ph disturbance, overheating and contamination occur. The growth culture of Scenedesmus sp The measurements culture and growth of Scenedesmus sp. for 30 days The Scenedesmus sp. was incubated for 30 days for biomass production. Figure 3 shows the growth curve of Scenedesmus sp. for 30 days. Figure 2: Scenedesmus sp. growth curve from day 5 until day 30. Four growth phases were shown on the graph. The grow curve of Scenedesmus sp. was similar in pattern with the growth curve of Chlorella sp. From this research, Scenedesmus sp. has shown to have an increase in population growth on day 25 until 30. Possible explanation is contamination due to aeration problems. However, due to a blockage of algae at the glass tube connection, aeration was stunted, and making algae suspended at the bottom of the flask. Or that, possibly, during the transfer of flasks, some media must have been introduced to the culture. The dry weight, cellulose biomass, and ph growth from different types of algae Based on Figure 3, the highest mean biomass of cellulose (gram) was extracted from Cladophora sp. ( g), followed by Enteromorpha sp. ( g), Scenedesmus sp. ( g), and Chlorella sp. The lowest mean value biomass of cellulose was collected from Chlorella sp. ( g). However, there were 3-5 replicates collected by each different types of algae. Thus, the highest cellulose contents were recorded by Cladophora sp. for replicate 2 was at ( g) and the lowest was extracted by Scenedesmus sp. for replicate 2 at ( g). In this experiment, cellulose contents were also extracted from four selected algae. The biomass of algae collected was extracted after exponential growth, in stationary phase to obtain the optimal cellulose in each alga. Cellulose is an essential element that can be 142


149 found in the cell wall of algae and have many applications in various industries. The algal cellulose was chosen for industrial applications because these algae cellulose production requires less energy, less cost to produce and does not pollute the environment in comparison from plant cellulose. Figure 3: Type of algae (Chlorella sp., Scenedesmus sp., Cladophora sp. and Enteromorpha sp.) against the biomass cellulose content (gram) A B C D E Figure 4: The observation of cellulose under 100x magnification by using Dino-Eye (Microscope Eye-Piece Camera). A) Cellulose extracted from Enteromorpha sp.; B) 143
Lesson Overview. Biodiversity. Lesson Overview. 6.3 Biodiversity
 Lesson Overview 6.3 6.3 Objectives Define biodiversity and explain its value. Identify current threats to biodiversity. Describe how biodiversity can be preserved. THINK ABOUT IT From multicolored coral
Ecosystems and Food Webs
 Ecosystems and Food Webs How do AIS affect our lakes? Background Information All things on the planet both living and nonliving interact. An Ecosystem is defined as the set of elements, living and nonliving,
AP Biology Unit I: Ecological Interactions
 AP Biology Unit I: Ecological Interactions Essential knowledge 1.C.1: Speciation and extinction have occurred throughout the Earth s history. Species extinction rates are rapid at times of ecological stress.
AP Environmental Science 2010 Free-Response Questions
 AP Environmental Science 2010 Free-Response Questions The College Board The College Board is a not-for-profit membership association whose mission is to connect students to college success and opportunity.
www.irishseedsavers.ie Natural surface water on earth includes lakes, ponds, streams, rivers, estuaries, seas and oceans.
 www.irishseedsavers.ie POND LIFE FACT SHEET Natural surface water on earth includes lakes, ponds, streams, rivers, estuaries, seas and oceans. A pond is a small body of fresh water shallow enough for sunlight
Section 3: Trophic Structures
 Marine Conservation Science and Policy Service learning Program Trophic Structure refers to the way in which organisms utilize food resources and hence where energy transfer occurs within an ecosystem.
Biology Keystone (PA Core) Quiz Ecology - (BIO.B.4.1.1 ) Ecological Organization, (BIO.B.4.1.2 ) Ecosystem Characteristics, (BIO.B.4.2.
 Quiz Ecology - (BIO.B.4.1.1 ) Ecological Organization, (BIO.B.4.1.2 ) Ecosystem Characteristics, (BIO.B.4.2.") Biology Keystone (PA Core) Quiz Ecology - (BIO.B.4.1.1 ) Ecological Organization, (BIO.B.4.1.2 ) Ecosystem Characteristics, (BIO.B.4.2.1 ) Energy Flow 1) Student Name: Teacher Name: Jared George Date:
Biology Keystone (PA Core) Quiz Ecology - (BIO.B.4.1.1 ) Ecological Organization, (BIO.B.4.1.2 ) Ecosystem Characteristics, (BIO.B.4.2.1 ) Energy Flow 1) Student Name: Teacher Name: Jared George Date:
THE ECOSYSTEM - Biomes
 Biomes The Ecosystem - Biomes Side 2 THE ECOSYSTEM - Biomes By the end of this topic you should be able to:- SYLLABUS STATEMENT ASSESSMENT STATEMENT CHECK NOTES 2.4 BIOMES 2.4.1 Define the term biome.
Broken Arrow Public Schools AP Environmental Science Objectives Revised 11-19-08
 1 st six weeks 1 Identify questions and problems that can be answered through scientific investigation. 2 Design and conduct scientific investigations to answer questions about the world by creating hypotheses;
Practice Questions 1: Evolution
 Practice Questions 1: Evolution 1. Which concept is best illustrated in the flowchart below? A. natural selection B. genetic manipulation C. dynamic equilibrium D. material cycles 2. The diagram below
Date of Commencement: January, 2004 Duration: One Year Status: Ongoing. Objectives
 Development of a computer based Health Management Information System (HMIS) in Rajasthan using Geographical Information System- R. C. Sharma, Vinod Joshi and Manju Singhi Date of Commencement: January,
Interactions between rodent borne diseases and climate, and the risks for public and animal health
 Interactions between rodent borne diseases and climate, and the risks for public and animal health Mare Lõhmus Climate centrum / SMS / KMF National Veterinary Institute Uppsala, Sweden The source of many
ARIMNet 2 Call 2014-15
 Coordination of the Agricultural Research In the Mediterranean Area Call i text ARIMNet 2 Call 2014-15 SUBMISSION Pre-proposal by December 1 st, 2014 Full Proposal by May 11 th 2015 on http://arimnet-call.eu/
Position Statement regarding Offshore Wind Proposals on Lake Huron. Lake Huron Centre for Coastal Conservation
 Position Statement regarding Offshore Wind Proposals on Lake Huron Lake Huron Centre for Coastal Conservation June 2010 Lake Huron Centre for Coastal Conservation (LHCCC) Corporate Position related to:
A Method of Population Estimation: Mark & Recapture
 Biology 103 A Method of Population Estimation: Mark & Recapture Objectives: 1. Learn one method used by wildlife biologists to estimate population size of wild animals. 2. Learn how sampling size effects
Climate Change: A Local Focus on a Global Issue Newfoundland and Labrador Curriculum Links 2010-2011
 Climate Change: A Local Focus on a Global Issue Newfoundland and Labrador Curriculum Links 2010-2011 HEALTH Kindergarten: Grade 1: Grade 2: Know that litter can spoil the environment. Grade 3: Grade 4:
NOTE TO TEACHER: It is appropriate to introduce the mitochondria (where energy is made) as a major structure common to all cells.
 as a major structure common to all cells.") 5.2.1 Recall the cell as the smallest unit of life and identify its major structures (including cell membrane, cytoplasm, nucleus, and vacuole). Taxonomy level: 1.1 and 1.2-A Remember Factual Knowledge
5.2.1 Recall the cell as the smallest unit of life and identify its major structures (including cell membrane, cytoplasm, nucleus, and vacuole). Taxonomy level: 1.1 and 1.2-A Remember Factual Knowledge
Chapter 3 Communities, Biomes, and Ecosystems
 Communities, Biomes, and Ecosystems Section 1: Community Ecology Section 2: Terrestrial Biomes Section 3: Aquatic Ecosystems Click on a lesson name to select. 3.1 Community Ecology Communities A biological
Technology For Adaptation. Forestry Conservation Management. Dr. Javier Aliaga Lordemann
 Technology For Adaptation. Forestry Conservation Management Dr. Javier Aliaga Lordemann Forests has more carbon store than the currently carbon free atmosphere. By contrast, are important sources of emissions
Kacy Blackham Fall, 2002. Introductory Lesson: Grade Level: 10 th
 Kacy Blackham Fall, 2002 Introductory Lesson: The Interdependence of Birds and the Great Salt Lake Ecosystem Abstract: Students will participate in the Checks and Balances game. This game will allow the
Lesson 3: Fish Life Cycle
 Lesson 3: Fish Life Cycle Activity: Diagram fish life cycle. Grade level: 4-8 Subjects: Science, social studies Setting: Classroom Duration: 50 minutes Key Terms: Fry, life cycle, life history, spawn,
Principles of Ecology
 2 Principles of Ecology section 1 Organisms and Their Relationships Before You Read On the lines below, list the organisms that you have encountered today. You share the same environment with these organisms.
CORPORATE POLICY STATEMENT NO. 12 MANAGEMENT OF PEST ANIMALS
 1. OBJECTIVE CORPORATE POLICY STATEMENT NO. 12 MANAGEMENT OF PEST ANIMALS August 2015 To provide direction and guidance for the management of pest animals on lands and waters managed by the Department
Clean, Drain, Dry! Activity
 Clean, Drain, Dry! Activity Students participate in hands on activity that demonstrates the ways in which aquatic plants and other nuisance species may be accidentally introduced or spread to new locations.
REVIEW UNIT 10: ECOLOGY SAMPLE QUESTIONS
 Period Date REVIEW UNIT 10: ECOLOGY SAMPLE QUESTIONS A. Sample Multiple Choice Questions Complete the multiple choice questions to review this unit. 1. All of the following are density-dependent factors
STUDY GUIDE ECOLOGY. CHAPTER 21: Populations 1. An overview of ecology. Ecology is the study of interactions between organisms and their environment.
 STUDY GUIDE ECOLOGY CHAPTER 21: Populations 1. An overview of ecology. Ecology is the study of interactions between organisms and their environment. 2. A Hierarchy of interactions: cells tissues organs
Biodiversity Concepts
 Biodiversity Concepts WHAT IS BIODIVERSITY? Biodiversity is the variety of life on Earth. For any kind of animal or plant each individual is not exactly the same as any other; nor are species or ecosystems.
Research to improve the use and conservation of agricultural biodiversity for smallholder farmers
 Research to improve the use and conservation of agricultural biodiversity for smallholder farmers Agricultural biodiversity the variability of crops and their wild relatives, trees, animals, arthropods,
Human Impacts on the World Ocean
 This website would like to remind you: Your browser (Safari 7) is out of date. Update your browser for more security, comfort and the best experience on this site. lesson Human Impacts on the World Ocean
Sustainability Considerations for Developing an Aquatic Invertebrate & Fish Collection Plan
 Approved by the AZA Board of Directors on January 12, 2016 Sustainability Considerations for Developing an Aquatic Invertebrate & Fish Collection Plan AZA Position The Association of Zoos and Aquariums
The concepts developed in this standard include the following: Oceans cover about 70% of the surface of the Earth.
 Name Date Grade 5 SOL 5.6 Review Oceans Made by SOLpass - www.solpass.org solpass100@comcast.net Reproduction is permitted for SOLpass subscribers only. The concepts developed in this standard include
WATER HARVESTING AND AQUACULTURE FOR RURAL DEVELOPMENT INTRODUCTION TO AQUACULTURE
 WATER HARVESTING AND AQUACULTURE FOR RURAL DEVELOPMENT INTRODUCTION TO AQUACULTURE 2 INTERNATIONAL CENTER FOR AQUACULTURE AND AQUATIC ENVIRONMENTS AUBURN UNIVERSITY 3 INTRODUCTION More than one-fourth
Guidelines for Degraded Landscape Management (Deliverable #16) September 30, 2013
 September 30, 2013") Biodiversity and Agricultural Commodities Program BACP-Rainforest Alliance Grant-015 ( Applying sustainable cocoa practices through agroforestry in community forest areas as a tool for achieving biodiversity
Biodiversity and Agricultural Commodities Program BACP-Rainforest Alliance Grant-015 ( Applying sustainable cocoa practices through agroforestry in community forest areas as a tool for achieving biodiversity
Postgraduate Institute of Agriculture University of Peradeniya Sri Lanka. Key Words: Macrobrachium rosenbergii, Male: female ratio, Salinity level.
 Tropical Agricultural Research Vol. 22 (4): 410-415 (2011) Short communication Determination of Optimum Male: Female Ratio and Salinity Level for Larval Production of Macrobrachium rosenbergii (De Man
Pond Vocabulary Words and Meanings
 Pond Vocabulary Words and Meanings Adapt: to adjust to a use or situation Aquatic: from or in the water Bacteria: tiny organisms, too small to be seen with the naked eye Carnivore: an animal that eats
Kakapo Recovery Plan 1996-2005
 Kakapo Recovery Plan 1996-2005 Threatened Species Recovery Plan No.21 Kakapo Management Group Department of Conservation P.O. Box 10-420 Wellington New Zealand CONTENTS 1. Background 5 2. Distribution
Facts on biodiversity
 Facts on biodiversity What is biodiversity? Biological diversity (biodiversity) comprises diversity of species and habitats as well as the genetic diversity within the individual species of fauna and flora.
3. Which relationship can correctly be inferred from the data presented in the graphs below?
 1. Recent evidence indicates that lakes in large areas of New York State are being affected by acid rain. The major effect of acid rain in the lakes is (1) an increase in game fish population levels (3)
EIGHTH SESSION OF THE OPEN WORKING GROUP ON SUSTAINABLE DEVELOPMENT GOALS
 EIGHTH SESSION OF THE OPEN WORKING GROUP ON SUSTAINABLE DEVELOPMENT GOALS New Zealand intervention in segment on Oceans and Seas Stephanie Lee, Chargé d'affaires a.i. 4 February 2014 Check against delivery
Doing Business, Small & Medium Enterprise Support and Information Access
 Doing Business, Small & Medium Enterprise Support and Information Access Vietnam, a nation of 92 million people, aspires to be more fully integrated into the global economy and community and an industrialized
The need for longitudinal study of the dual roles of insects as pests and food resources in agroecosystems
 THE H. R. MacCARTHY LECTURE COMMITTEE IS PLEASED TO PRESENT THE 15 TH ANNUAL H. R. MacCARTHY PEST MANAGEMENT LECTURE ENTITLED The need for longitudinal study of the dual roles of insects as pests and food
How To Plan A Buffer Zone
 Backyard Buffers Protecting Habitat and Water Quality What is a buffer? A buffer (also called a riparian buffer area or zone) is the strip of natural vegetation along the bank of a stream, lake or other
Oregon. Climate Change Adaptation Framework
 Oregon Climate Change Adaptation Framework Oregon Environmental Quality Commission Climate Change Adaptation Framework Presentation at a glance: Purposes of the framework Participating agencies Climate
Global Ecology and Wildlife Conservation
 Vaughan Centre for Lifelong Learning Part-Time Certificate of Higher Education in Global Ecology and Wildlife Conservation Delivered via Distance Learning FAQs What are the aims of the course? This course
Chapter 1 Key Themes in Environmental Science
 Key Themes in Environmental Science Case Study: Shrimp, Mangroves, and Pickup Trucks This case study highlights the plight of a small farmer in Thailand in the shrimp farming business. He makes his living
Importance of Wildlife
 Importance of Wildlife The wildlife comprises all living organism (plants, animals, microorganisms) in their natural habitats which are neither cultivated or domesticated nor tamed. But in its strictest
PRIORITISING PESTS FOR COORDINATED CONTROL PROGRAMS: THE SOUTH AUSTRALIAN APPROACH
 PRIORITISING PESTS FOR COORDINATED CONTROL PROGRAMS: THE SOUTH AUSTRALIAN APPROACH John Virtue, Mark Williams and David Peacock Biosecurity SA, Department of Primary Industries and Regions South Australia
Using Aerial Photography to Measure Habitat Changes. Method
 Then and Now Using Aerial Photography to Measure Habitat Changes Method Subject Areas: environmental education, science, social studies Conceptual Framework Topic References: HIIIB, HIIIB1, HIIIB2, HIIIB3,
ECOSYSTEM RESPONSES. reflect
 reflect There is a saying, No man is an island, which means that people need one another in order to survive. Everyone on Earth is interconnected in some way. This is not only true of human beings, but
ENDANGERED AND THREATENED
 ENDANGERED AND THREATENED Understand how species in the Sonoran Desert Region may become endangered or threatened and what is being done to protect them. ARIZONA SCIENCE STANDARDS SC03-S4C3-03&04, SC08-S1C3-07,
Amherst County Public Schools. AP Environmental Science Curriculum Pacing Guide. College Board AP Environmental Science Site
 Amherst County Public Schools AP Environmental Science Curriculum Pacing Guide College Board AP Environmental Science Site REV: 8/12 1 st 9 weeks AP Objectives Energy Resources and Consumption A. Energy
One Major Six Concentrations. Department of Environmental Conservation University of Massachusetts Amherst
 One Major Six Concentrations Natural Resources Conservation Undergraduate Major Department of Environmental Conservation University of Massachusetts Amherst Conserving Earth s biological diversity and
Guidelines for Animal Disease Control
 Guidelines for Animal Disease Control 1. Introduction and objectives The guidelines are intended to help countries identify priorities, objectives and the desired goal of disease control programmes. Disease
Importance of forestry reserves to the regulation of water quality and microalgae structure of temporary ponds in Burkina Faso (West Africa)
") Importance of forestry reserves to the regulation of water quality and microalgae structure of temporary ponds in Burkina Faso (West Africa) Bilassé ZONGO, Frédéric ZONGO and Joseph I. BOUSSIM Laboratory
Importance of forestry reserves to the regulation of water quality and microalgae structure of temporary ponds in Burkina Faso (West Africa) Bilassé ZONGO, Frédéric ZONGO and Joseph I. BOUSSIM Laboratory
APPENDIX B: COMMON AND SCIENTIFIC NAMES OF IDAHO SPECIES OF GREATEST CONSERVATION NEED.
 APPENDIX B: COMMON AND SCIENTIFIC NAMES OF IDAHO SPECIES OF GREATEST CONSERVATION NEED. How to Read the Lists. Within these lists, species are listed phylogenetically by class. In cases where phylogeny
Farming. In the Standard Grade Geography exam there are three types of farming you need to know about arable, livestock and mixed.
 Types of Farming In the Standard Grade Geography exam there are three types of farming you need to know about arable, livestock and mixed. Arable farms are ones where the main way of making money is by
Ecosystem Services in the Greater Houston Region. A case study analysis and recommendations for policy initiatives
 Ecosystem Services in the Greater Houston Region A case study analysis and recommendations for policy initiatives Ecosystem Services Ecosystems provide services through their natural processes that we
RESTORATION AND ENHANCEMENT OF SOUTHERN CALIFORNIA LAGOONS
 RESTORATION AND ENHANCEMENT OF SOUTHERN CALIFORNIA LAGOONS by Hany Elwany, Ph.D. Scripps Institution of Oceanography Headwaters to Oceans Conference 25 October 2003 CE Ref #03-22 San Diego County Lagoons
Extinction; Lecture-8
 I. introduction Definition Current extinction Genetic drift Extinction; Lecture-8 II. 3 types of extinction 1. background 2. mass 3. stochastic III. 5 periods of mass IV. human caused 1. on land and in
Unique reproductive strategies have developed to ensure maximum reproductive success.
 Animal Reproductive Strategies The ultimate goal of each species is to produce the maximum number of surviving offspring using the least amount of energy. This is called the reproductive effort. Asexual
A Functional Classification System for Marine Protected Areas in the United States
 A Functional Classification System for Marine Protected Areas in the United States The U.S. Classification System: An Objective Approach for Understanding the Purpose and Effects of MPAs as an Ecosystem
9.0 PUBLIC HEALTH (MOSQUITO ABATEMENT)
") 9.0 PUBLIC HEALTH (MOSQUITO ABATEMENT) This chapter analyzes the public health effects of the project, particularly with regard to mosquito abatement. The chapter discusses historical and existing efforts
9.0 PUBLIC HEALTH (MOSQUITO ABATEMENT) This chapter analyzes the public health effects of the project, particularly with regard to mosquito abatement. The chapter discusses historical and existing efforts
GCSE BITESIZE Examinations
 GCSE BITESIZE Examinations General Certificate of Secondary Education AQA SCIENCE A BLY1B Unit Biology B1b (Evolution and Environment) AQA BIOLOGY Unit Biology B1b (Evolution and Environment) FOUNDATION
Plants, like all other living organisms have basic needs: a source of nutrition (food),
,") LEARNING FROM LEAVES: A LOOK AT LEAF SIZE Grades 3 6 I. Introduction Plants, like all other living organisms have basic needs: a source of nutrition (food), water, space in which to live, air, and optimal
LEARNING FROM LEAVES: A LOOK AT LEAF SIZE Grades 3 6 I. Introduction Plants, like all other living organisms have basic needs: a source of nutrition (food), water, space in which to live, air, and optimal
Section 5.1 Food chains and food webs
 Section 5.1 Food chains and food webs The ultimate source of energy in an ecosystem comes from sunlight This energy is converted to an organic form using photosynthesis which is then passed between organisms
POLICY ON THE RELOCATION OF WILDLIFE
 State of New Jersey Department of Environmental Protection Mail Code 501-03 Division of Fish and Wildlife PO Box 420 / 501 East State Street Trenton, NJ 08625-0420 POLICY ON THE RELOCATION OF WILDLIFE
The Norwegian ecosystem-based management plan for the Barents Sea and sea areas off the Lofoten Islands. The Barents Sea
 The Norwegian ecosystem-based management plan for the Barents Sea and sea areas off the Lofoten Islands By: Dr. Erik Olsen, Research Scientist The Barents Sea Continental shelf sea Average depth 230m Area
Biology 3998 Seminar II. How To Give a TERRIBLE PowerPoint Presentation
 Biology 3998 Seminar II How To Give a TERRIBLE PowerPoint Presentation How to Give a TERRIBLE PowerPoint Presentation [Don t use a summary slide to keep the audience oriented throughout the presentation]
Appendix B: Cost Estimates
 Appendix B: Estimates This appendix presents the estimated costs of the monitoring and supplemental research components presented in Section 3 of this document. A 20% quality assurance and quality control
Use this diagram of a food web to answer questions 1 through 5.
 North arolina Testing Program EO iology Sample Items Goal 4 Use this diagram of a food web to answer questions 1 through 5. coyotes 3. If these organisms were arranged in a food pyramid, which organism
BIOSECURITY PROCEDURES IN POULTRY PRODUCTION
 1 Annex VII CHAPTER 6.4. BIOSECURITY PROCEDURES IN POULTRY PRODUCTION Article 6.4.1. Introduction This chapter provides recommended biosecurity procedures in poultry production and is not specifically
Climate Change Long Term Trends and their Implications for Emergency Management August 2011
 Climate Change Long Term Trends and their Implications for Emergency Management August 2011 Overview A significant amount of existing research indicates that the world s climate is changing. Emergency
France s biodiversity at risk
 France s biodiversity at risk A call for action France hosts a large proportion of the species that are threatened at the European level, and has the important responsibility for protecting these species
Virginia Tech Degree Proposal B.S. in Fish and Wildlife Conservation, FWC (CIP: 03.0601)
") Virginia Tech Degree Proposal B.S. in Fish and Wildlife Conservation, FWC (CIP: 03.0601) Type of degree action: New Spinoff Revision Discontinuance Program description Faculty in the Department of Fish
Virginia Tech Degree Proposal B.S. in Fish and Wildlife Conservation, FWC (CIP: 03.0601) Type of degree action: New Spinoff Revision Discontinuance Program description Faculty in the Department of Fish
CIESIN Columbia University
 Conference on Climate Change and Official Statistics Oslo, Norway, 14-16 April 2008 The Role of Spatial Data Infrastructure in Integrating Climate Change Information with a Focus on Monitoring Observed
Forest Management Guidelines for the Protection of Four-toed and Spotted Salamander Populations Carol Hall & Bruce Carlson May 2004
 Forest Management Guidelines for the Protection of Four-toed and Spotted Salamander Populations Carol Hall & Bruce Carlson May 2004 Salamander Natural History Four-toed Salamanders: The Four-toed Salamander,
Name That Adaptation. Background: Link to the Plan Read Section 5 (Whooping Crane Ecology and Biology) in the Management Plan
 in the Management Plan") Summary Students will explore structural, physiological, and behavioral adaptations of whooping cranes. Objectives: Students will be able to: Define an adaptation Describe several whooping crane adaptations
Summary Students will explore structural, physiological, and behavioral adaptations of whooping cranes. Objectives: Students will be able to: Define an adaptation Describe several whooping crane adaptations
WATER: ENVIRONMENTAL SCIENCE Syllabus
 WATER: ENVIRONMENTAL SCIENCE Syllabus Course Title Water: Environmental Science Course Description Central to all ecosystems, water is essential to life as we know it. It shapes our planet on every level,
SCIENCE ADVICE FROM THE RISK ASSESSMENT OF THE INVASIVE BLOODY RED SHRIMP (HEMIMYSIS ANOMALA) IN CANADA
 IN CANADA") Canadian Science Advisory Secretariat Science Advisory Report 2009/078 SCIENCE ADVICE FROM THE RISK ASSESSMENT OF THE INVASIVE BLOODY RED SHRIMP (HEMIMYSIS ANOMALA) IN CANADA Photo credit: Kelly Bowen,
Canadian Science Advisory Secretariat Science Advisory Report 2009/078 SCIENCE ADVICE FROM THE RISK ASSESSMENT OF THE INVASIVE BLOODY RED SHRIMP (HEMIMYSIS ANOMALA) IN CANADA Photo credit: Kelly Bowen,
PLANET EARTH: Seasonal Forests
 PLANET EARTH: Seasonal Forests Teacher s Guide Grade Level: 6-8 Running Time: 42 minutes Program Description Investigate temperate forests and find some of the most elusive creatures and welladapted plant
FOR TEACHERS ONLY The University of the State of New York REGENTS HIGH SCHOOL EXAMINATION
 FOR TEACHERS ONLY The University of the State of New York REGENTS HIGH SCHOOL EXAMINATION LIVING ENVIRONMENT Wednesday, August 12, 2015 12:30 to 3:30 p.m., only SCORING KEY AND RATING GUIDE Directions
Sustainability and Wildlife Conservation Updates: the Malaysian Perspectives
 Sustainability and Wildlife Conservation Updates: the Malaysian Perspectives MPOC Reach & Remind Friends of the Industry Seminar: Challenges and Opportunities in 2012 Royale Chulan Hotel 16 January 2012
Pest Control Methods and Tips
 Waterway Technote Pest animals Contents Benefits of animal pest control 1 Common pest animal species found in riparian areas and control methods 2 Protecting plants from animal pests 3 Regional pest specific
The interface between wild boar and extensive pig production:
 The interface between wild boar and extensive pig production: implications for the spread of ASF in Eastern Europe Sergei Khomenko, PhD Disease ecology & wildlife Specialist, FAO HQ Epidemiological cycle
CHAPTER 20 COMMUNITY ECOLOGY
 CHAPTER 20 COMMUNITY ECOLOGY MULTIPLE CHOICE 1. The relationship between a predator and its prey is best illustrated by a. a snake eating a bird. c. a lion eating a zebra. b. a fox eating a mouse. d. a
Green Infrastructure Case Study Template
 Green Infrastructure Case Study Template The aim of the exercise is to provide information on how the elements of the Green Infrastructure Strategy are implemented at national level and to provide case
9.3.7 Advice December 2014
 9.3.7 Advice December 2014 ECOREGION STOCK Widely distributed and migratory stocks European eel Advice for 2015 The status of eel remains critical and ICES advises that all anthropogenic mortality (e.g.
HLPE report on Nutrition and Food Systems
 HLPE report on Nutrition and Food Systems e-consultation on an Issues Note proposed by the HLPE Steering Committee From 9 December 2015 to 15 February 2016 Short Summary by the HLPE Secretariat 1 There
Grassland Food Webs: Teacher Notes
 Grassland Food Webs: Teacher Notes Alan Henderson ecosystem Objectives After completing this activity students will be able to: Create a food web and identify producers and consumers. Assign organisms
The IPCC Special Report on Managing the Risks of Extreme Events and Disasters to Advance Climate Change Adaptation
 The IPCC Special Report on Managing the Risks of Extreme Events and Disasters to Advance Climate Change Adaptation A changing climate leads to changes in extreme weather and climate events 2 How do changes
Status of the World s Soil Resources
 5 December 2015 Status of the World s Soil Resources The Intergovernmental Technical Panel on Soils (ITPS), the main scientific advisory body to the Global Soil Partnership (GSP) hosted by the Food and
1.2 The Biosphere and Energy
 1.2 The Biosphere and Energy All activities require a source of energy a fuel. For example, to sustain a campfire, you need to keep it supplied with wood. To reach a destination by car, you need to have
Unit 4 - Shelter. Plants
 Unit 4 - Shelter Shelter is one of the elements of survival, along with food and water. Shelter offers people safety and security. Often a person s shelter is a reflection of their personal habitat. Outside
Policy & Management Applications of Blue Carbon. fact SHEET
 Policy & Management Applications of Blue Carbon fact SHEET Policy & Management Applications of Blue Carbon Coastal Blue Carbon - An Important Wetland Ecosystem Service Coastal Blue Carbon refers to the
Ecosystem perspective on ORs & OCTs
 Workshop on the Application of an Ecosystem Approach for development of Sustainable Aquaculture in Europe s Outermost Regions and Overseas Countries and Territories Session 3: Stakeholders presentations
Introduction to Integrated Pest Management. John C. Wise, Ph.D. Michigan State University MSU Trevor Nichols Research Complex
 Introduction to Integrated Pest Management John C. Wise, Ph.D. Michigan State University MSU Trevor Nichols Research Complex What is Integrated Pest Management? Integrated Pest Management (IPM) New concept;
Integrated Pest Management
 Chapter 2 Integrated Pest Management In This Chapter Keywords After learning the information in this chapter, you will be able to: 1. Define Integrated Pest Management (IPM). 2. List and describe the 5
ON THE RELOCATIO Division of
 New Jersey Department off Environmental Protection Division of Fish and Wildlife Mail l Code 501-03 PO Box 4200 / 501 East State St Trenton, NJ 08625-0420 POLICY ON THE RELOCATIO ON OF WILDLIFE As the
Global Water Resources
 Global Water Resources Highlights from assessment activities over the past two decades, which are used to establish present and future water trends, reveal that: 1. Freshwater resources are unevenly distributed,
Ecology Module B, Anchor 4
 Ecology Module B, Anchor 4 Key Concepts: - The biological influences on organisms are called biotic factors. The physical components of an ecosystem are called abiotic factors. - Primary producers are