An introduction to OBJECTIVE ASSESSMENT OF IMAGE QUALITY. Harrison H. Barrett University of Arizona Tucson, AZ
|
|
|
- Giles Buddy Daniel
- 7 years ago
- Views:
Transcription
1 An introduction to OBJECTIVE ASSESSMENT OF IMAGE QUALITY Harrison H. Barrett University of Arizona Tucson, AZ

2 Outline! Approaches to image quality! Why not fidelity?! Basic premises of the task-based approach! Classification tasks Figures of merit Observers Computational issues Examples from current research! Estimation tasks Figures of merit Estimation methods! Summary, challenges for the future

3 Approaches from the literature Preference Potter Stewart s method Structured preference (panels, check lists) Fidelity measures The best image is the one that looks the most like the object (By what measure?) Perceptual difference measures Information content The best image is the one that gives the most information (Information about what? To whom?)
 Perceptual difference measures Information content The best image is the one that")
4 It s obvious...
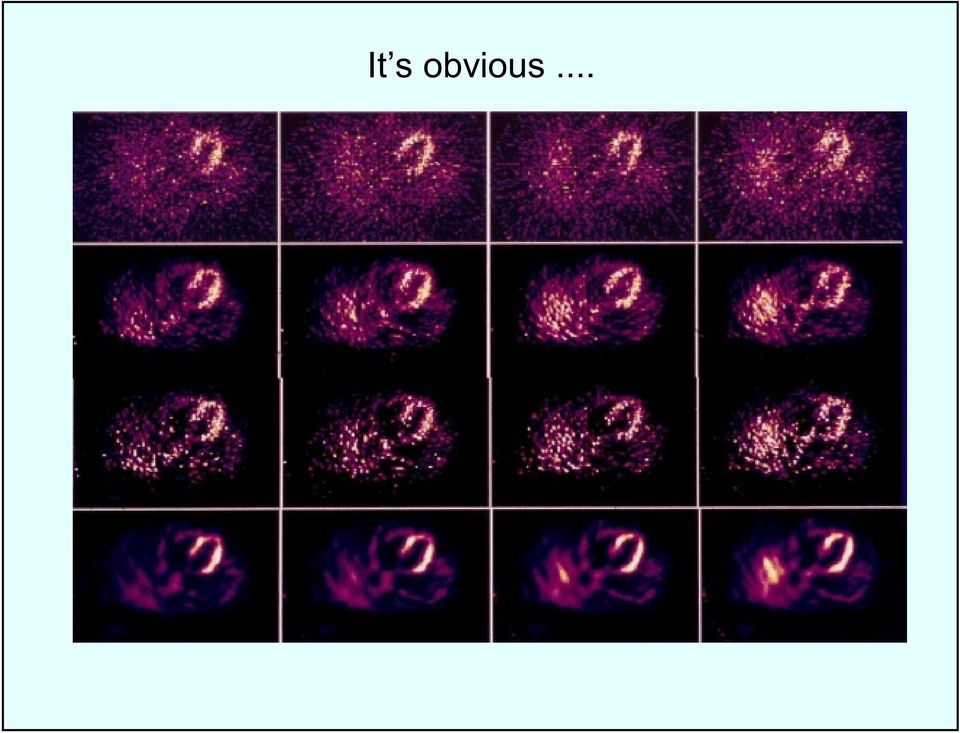
5 ... isn t it? (Hint: The good one is always on the right!)

6 Is fidelity a virtue? If we think the best image is the one that looks most like the object, then......mean-square error is a good figure of merit Problem: Objects are functions Digital images are discrete vectors How do you compare them?

7 Three ways to make object and image commensurable: Discretize the object Interpolate the image to a function Ignore the problem and do a simulation

8 Three ways to define mean-square error: Spatial average for one image object image 2 Average over noise realizations object image 2 noise Average over noise realizations and object class 2 object image noise object

9 3 ways of making object and image commensurable 3 ways of defining squared error = 9 definitions of MSE AND THEY GIVE VERY DIFFERENT ANSWERS

10 OTHER PROBLEMS WITH FIDELITY METRICS Sensitive to small changes in scale or orientation Sensitive to trivial grey-level mappings Insensitive to tradeoffs between noise and blur Very different images can have same MSE

11 Five Lenas, one MSE! Z. Wang, A. C. Bovik and L. Lu, IEEE International Conference on Acoustics, Speech, & Signal Processing, May 2002.

12 The actual object Lena Soderberg

13 But the biggest problem with MSE is that it is independent of what you want to do with the image

14 BASIC PREMISE OF OBJECTIVE ASSESSMENT A definition of image quality must specify: The task What information do you want from the image? The observer How will you extract the information? Object and image statistics What set of objects are you looking at? What is the measurement noise?

15 TASKS CLASSIFICATION (outcome is a label for each image) Signal detection Discrimination Pattern recognition ESTIMATION (outcome is one or more numbers) Absolute brightness, changes in brightness Integral over a region of interest Mensuration Localization Image reconstruction?

16 IMPORTANCE OF OBJECT AND IMAGE STATISTICS IN SIGNAL DETECTION Signal detection performance degrades with more Poisson noise (top to bottom) or more structure in object background (left to right). Work of Jannick Rolland
.")
17 OBSERVERS FOR CLASSIFICATION TASKS HUMANS IDEAL (BAYESIAN) OBSERVER IDEAL LINEAR OBSERVER (HOTELLING OBSERVER) MODEL OBSERVERS THAT PREDICT HUMAN PERFORMANCE (ANTHROPOMORPHIC)

18 Binary (two-alternative) classification tasks Example: signal detection True-positive fraction (TPF) = probability of detection False-positive fraction (FPF) = false-alarm rate Key points: There is always some decision threshold for detection there is always a tradeoff between TPF and FPF

19 The receiver operating characteristic (ROC) Different points on the ROC curve are generated by applying different decision thresholds to some test statistic Ideal system (for a binary detection task): True-positive fraction = 1 False-positive fraction = 0 Area under the curve (AUC) = 1 Worthless system: AUC = 0.5 AUC is a figure of merit for detection
 = 1 Worthless system: AUC = 0.")
20 USING AUC TO COMPARE SYSTEMS System A is better than B, and B is better than C (for this particular detection task and observer)

21 HUMAN OBSERVERS Performance on binary classification tasks can be measured by psychophysical experiments Results can be plotted as ROC curves Area under the ROC curve can be used as FOM
22 PROBLEMS WITH HUMAN OBSERVERS Psychophysical studies are time-consuming and difficult to control Many observers and images are required for good statistical accuracy Tests of statistical significance are controversial ALTERNATIVE: Mathematical model observers Ideal Hotelling Anthropomorphic
23 One that: WHAT IS THE IDEAL OBSERVER? Maximizes area under the ROC curve Maximizes true-positive fraction at any specified false-positive fraction Minimizes Bayes risk Neat result: By any of these criteria, the test statistic is always the likelihood ratio
24 THE LIKELIHOOD RATIO H 0 = null hypothesis (e.g., signal absent) H = alternative hypothesis (e.g., signal present) 1 Points on ROC curve for ideal observer are generated by comparing (g) to different thresholds
25 DIFFICULTIES WITH THE IDEAL OBSERVER Requires immense amount of prior knowledge (huge-dimensional PDFs) Usually a nonlinear function of the image data Difficult to compute except for a few textbook cases Not obviously related to humans or other practical observers
26 NEW COMPUTATIONAL TOOLS FOR IDEAL OBSERVER Likelihood-generating function All statistical properties of LR in one scalar function! Realistic but tractable object models Analytic forms for object statistics Characteristic functionals Propagate object statistics through noisy, low-resolution imaging systems Markov-chain Monte Carlo Dimensionality reduction with minimal information loss Channelized ideal observer
27 STATISTICAL MODELS FOR RANDOM OBJECTS These simulations look very much like real medical images, but their complete statistics are known analytically to all orders! Question: Can we do the same for astronomy?
28 THE HOTELLING OBSERVER Harold Hotelling Has full knowledge of the mean vectors and covariance matrices Uses that knowledge to compute an optimum linear discriminant t(g) = wg t Maximizes a detectability measure called the Hotelling trace or Hotelling SNR Also maximizes AUC if t(g) is normally distributed
29 COMPUTATIONAL ISSUES Good news Hotelling doesn t need image PDFs Bad news It does need image covariance matrix Worse news You gotta invert it!
30 Hotelling observer, signal-known-exactly (SKE) task Basic equations boil down to: t(g) = w t g w = K -1 s 2 t -1 SNR = s K s s = signal vector K = covariance matrix
31 Basic problem at a glance: SNR = sk 2 t Example from tomography: -1 s detector, 64 projection angles 6 s has 10 elements 6 6 K is a matrix 12 K has 10 elements!
32 MEGALOPINAKOPHOBIA Megalopinakophobia (m g -l p n -k f b - ) n. 1. Fear of large matrices. 2. Abnormality characterized by excessive fondness for Fourier methods. 3. Fear of large paintings [< Gk. megas, great + pinakas, matrix or painting + phobos, fear ] (Courtesy of Georgios Kastis)
33 WHAT TO DO INSTEAD OF HUGE MATRIX INVERSIONS: Use decomposition of the covariance: K = K + K noise obj Use simulated noise-free images to estimate K obj Solve for Hotelling template iteratively Fiete et al., J. Opt. Soc. Am., 1987 Use matrix-inversion lemma Reduces N N problem to J J, where N = number of pixels, J = number of image samples Use Neumann series for K -1 Reduce dimensionality by judicious feature extraction Barrett et al., Proc. SPIE 3340, 1998
34 ANTHROPOMORPHIC MODEL OBSERVERS (MODELS THAT PREDICT HUMAN PERFORMANCE) USUALLY LINEAR OBSERVERS INCORPORATE SPATIAL-FREQUENCY CHANNELS David Hubel Torsten Wiesel REQUIRE INTERNAL NOISE TO ACCOUNT FOR HUMAN UNCERTAINTIES OTHERWISE IDEAL!
35 Why do we use anthropomorphic models? Basic perceptual studies Compare psychophysical studies with model, gain insights into human observers Objective assessment of imaging hardware Computationally simpler than ideal or Hotelling Faster and more accurate than psychophysical Assessment of processing algorithms and displays Ideal or Hotelling observer gives no information about algorithms Purpose of algorithm or display is to match the raw data to the characteristics of the human observer
36 VALIDATION OF HUMAN OBSERVER MODELS Artificial backgrounds Phantoms Real clinical images Procedure: Generate many images Estimate low-dimensional covariance on channel outputs Compute Hotelling SNR Compare to psychophysical studies
37 Abbey et al., J. Opt. Soc. Am. A, 2001 Regularization study (Variation of filter cutoff) Exposure-time study (Trades off Poisson and anatomical noise) Anatomical-slope study (Varies fractal dimension of anatomical background) Model observer: Channelized Hotelling Observer (CHO) with and without internal noise (Myers et al., JOSA A, 1987)
38
39 ESTIMATION TASKS f(r) = object distribution {f(r)} = parameter of interest g = data vector g = {f(r)} + n f(r) = f meas(r) + f null(r) where f null(r) = 0 {f(r)}is estimable if and only if {f(r)} = {f meas(r)} For estimable parameters, can define bias, variance, MSE Pixel values are almost never estimable
40 MAXIMUM-LIKELIHOOD ESTIMATES For an estimable parameter, can define bias, variance, MSE Cramer-Rao bound defines minimum achievable variance Estimator that achieves this bound is efficient ML estimate is: Asymptotically unbiased Asymptotically efficient Efficient if an efficient estimator exists But ML estimate uses no prior information
41 FIGURES OF MERIT FOR ESTIMATION # MSE of ML estimator # Cramer-Rao bound # Fisher information # Bayes risk
42 CONCLUSIONS Logical definitions of image quality must specify the task and observer as well as object and image statistics Anthropomorphic or real human observers should be used to evaluate algorithms and displays Ideal or ideal-linear observers should be used to evaluate imaging hardware on detection tasks Estimation task performance meaningful only for estimable params. Computation of observer performance is challenging, but methodology is developing rapidly Realism in system and object modeling is paramount The ultimate goal is full system optimization
Example: Credit card default, we may be more interested in predicting the probabilty of a default than classifying individuals as default or not.
 Statistical Learning: Chapter 4 Classification 4.1 Introduction Supervised learning with a categorical (Qualitative) response Notation: - Feature vector X, - qualitative response Y, taking values in C
STA 4273H: Statistical Machine Learning
 STA 4273H: Statistical Machine Learning Russ Salakhutdinov Department of Statistics! rsalakhu@utstat.toronto.edu! http://www.cs.toronto.edu/~rsalakhu/ Lecture 6 Three Approaches to Classification Construct
Exploiting A Constellation of Narrowband RF Sensors to Detect and Track Moving Targets
 Exploiting A Constellation of Narrowband RF Sensors to Detect and Track Moving Targets Chris Kreucher a, J. Webster Stayman b, Ben Shapo a, and Mark Stuff c a Integrity Applications Incorporated 900 Victors
MACHINE LEARNING IN HIGH ENERGY PHYSICS
 MACHINE LEARNING IN HIGH ENERGY PHYSICS LECTURE #1 Alex Rogozhnikov, 2015 INTRO NOTES 4 days two lectures, two practice seminars every day this is introductory track to machine learning kaggle competition!
CCNY. BME I5100: Biomedical Signal Processing. Linear Discrimination. Lucas C. Parra Biomedical Engineering Department City College of New York
 BME I5100: Biomedical Signal Processing Linear Discrimination Lucas C. Parra Biomedical Engineering Department CCNY 1 Schedule Week 1: Introduction Linear, stationary, normal - the stuff biology is not
Advanced Signal Processing and Digital Noise Reduction
 Advanced Signal Processing and Digital Noise Reduction Saeed V. Vaseghi Queen's University of Belfast UK WILEY HTEUBNER A Partnership between John Wiley & Sons and B. G. Teubner Publishers Chichester New
Assessment. Presenter: Yupu Zhang, Guoliang Jin, Tuo Wang Computer Vision 2008 Fall
 Automatic Photo Quality Assessment Presenter: Yupu Zhang, Guoliang Jin, Tuo Wang Computer Vision 2008 Fall Estimating i the photorealism of images: Distinguishing i i paintings from photographs h Florin
COMPARISON OF OBJECT BASED AND PIXEL BASED CLASSIFICATION OF HIGH RESOLUTION SATELLITE IMAGES USING ARTIFICIAL NEURAL NETWORKS
 COMPARISON OF OBJECT BASED AND PIXEL BASED CLASSIFICATION OF HIGH RESOLUTION SATELLITE IMAGES USING ARTIFICIAL NEURAL NETWORKS B.K. Mohan and S. N. Ladha Centre for Studies in Resources Engineering IIT
Lecture 8: Signal Detection and Noise Assumption
 ECE 83 Fall Statistical Signal Processing instructor: R. Nowak, scribe: Feng Ju Lecture 8: Signal Detection and Noise Assumption Signal Detection : X = W H : X = S + W where W N(, σ I n n and S = [s, s,...,
STATISTICA Formula Guide: Logistic Regression. Table of Contents
 : Table of Contents... 1 Overview of Model... 1 Dispersion... 2 Parameterization... 3 Sigma-Restricted Model... 3 Overparameterized Model... 4 Reference Coding... 4 Model Summary (Summary Tab)... 5 Summary
Kristine L. Bell and Harry L. Van Trees. Center of Excellence in C 3 I George Mason University Fairfax, VA 22030-4444, USA kbell@gmu.edu, hlv@gmu.
 POSERIOR CRAMÉR-RAO BOUND FOR RACKING ARGE BEARING Kristine L. Bell and Harry L. Van rees Center of Excellence in C 3 I George Mason University Fairfax, VA 22030-4444, USA bell@gmu.edu, hlv@gmu.edu ABSRAC
Data Mining - Evaluation of Classifiers
 Data Mining - Evaluation of Classifiers Lecturer: JERZY STEFANOWSKI Institute of Computing Sciences Poznan University of Technology Poznan, Poland Lecture 4 SE Master Course 2008/2009 revised for 2010
Modelling, Extraction and Description of Intrinsic Cues of High Resolution Satellite Images: Independent Component Analysis based approaches
 Modelling, Extraction and Description of Intrinsic Cues of High Resolution Satellite Images: Independent Component Analysis based approaches PhD Thesis by Payam Birjandi Director: Prof. Mihai Datcu Problematic
Analecta Vol. 8, No. 2 ISSN 2064-7964
 EXPERIMENTAL APPLICATIONS OF ARTIFICIAL NEURAL NETWORKS IN ENGINEERING PROCESSING SYSTEM S. Dadvandipour Institute of Information Engineering, University of Miskolc, Egyetemváros, 3515, Miskolc, Hungary,
Algorithms for the resizing of binary and grayscale images using a logical transform
 Algorithms for the resizing of binary and grayscale images using a logical transform Ethan E. Danahy* a, Sos S. Agaian b, Karen A. Panetta a a Dept. of Electrical and Computer Eng., Tufts University, 161
Data, Measurements, Features
 Data, Measurements, Features Middle East Technical University Dep. of Computer Engineering 2009 compiled by V. Atalay What do you think of when someone says Data? We might abstract the idea that data are
Linear Classification. Volker Tresp Summer 2015
 Linear Classification Volker Tresp Summer 2015 1 Classification Classification is the central task of pattern recognition Sensors supply information about an object: to which class do the object belong
Statistics Graduate Courses
 Statistics Graduate Courses STAT 7002--Topics in Statistics-Biological/Physical/Mathematics (cr.arr.).organized study of selected topics. Subjects and earnable credit may vary from semester to semester.
Computational Optical Imaging - Optique Numerique. -- Deconvolution --
 Computational Optical Imaging - Optique Numerique -- Deconvolution -- Winter 2014 Ivo Ihrke Deconvolution Ivo Ihrke Outline Deconvolution Theory example 1D deconvolution Fourier method Algebraic method
The effect of mismatched recording conditions on human and automatic speaker recognition in forensic applications
 Forensic Science International 146S (2004) S95 S99 www.elsevier.com/locate/forsciint The effect of mismatched recording conditions on human and automatic speaker recognition in forensic applications A.
Component Ordering in Independent Component Analysis Based on Data Power
 Component Ordering in Independent Component Analysis Based on Data Power Anne Hendrikse Raymond Veldhuis University of Twente University of Twente Fac. EEMCS, Signals and Systems Group Fac. EEMCS, Signals
Cross Validation. Dr. Thomas Jensen Expedia.com
 Cross Validation Dr. Thomas Jensen Expedia.com About Me PhD from ETH Used to be a statistician at Link, now Senior Business Analyst at Expedia Manage a database with 720,000 Hotels that are not on contract
Enhancing the SNR of the Fiber Optic Rotation Sensor using the LMS Algorithm
 1 Enhancing the SNR of the Fiber Optic Rotation Sensor using the LMS Algorithm Hani Mehrpouyan, Student Member, IEEE, Department of Electrical and Computer Engineering Queen s University, Kingston, Ontario,
EM Clustering Approach for Multi-Dimensional Analysis of Big Data Set
 EM Clustering Approach for Multi-Dimensional Analysis of Big Data Set Amhmed A. Bhih School of Electrical and Electronic Engineering Princy Johnson School of Electrical and Electronic Engineering Martin
PATTERN RECOGNITION AND MACHINE LEARNING CHAPTER 4: LINEAR MODELS FOR CLASSIFICATION
 PATTERN RECOGNITION AND MACHINE LEARNING CHAPTER 4: LINEAR MODELS FOR CLASSIFICATION Introduction In the previous chapter, we explored a class of regression models having particularly simple analytical
Applications to Data Smoothing and Image Processing I
 Applications to Data Smoothing and Image Processing I MA 348 Kurt Bryan Signals and Images Let t denote time and consider a signal a(t) on some time interval, say t. We ll assume that the signal a(t) is
Classification Problems
 Classification Read Chapter 4 in the text by Bishop, except omit Sections 4.1.6, 4.1.7, 4.2.4, 4.3.3, 4.3.5, 4.3.6, 4.4, and 4.5. Also, review sections 1.5.1, 1.5.2, 1.5.3, and 1.5.4. Classification Problems
Signal Detection. Outline. Detection Theory. Example Applications of Detection Theory
 Outline Signal Detection M. Sami Fadali Professor of lectrical ngineering University of Nevada, Reno Hypothesis testing. Neyman-Pearson (NP) detector for a known signal in white Gaussian noise (WGN). Matched
Image Compression through DCT and Huffman Coding Technique
 International Journal of Current Engineering and Technology E-ISSN 2277 4106, P-ISSN 2347 5161 2015 INPRESSCO, All Rights Reserved Available at http://inpressco.com/category/ijcet Research Article Rahul
2DI36 Statistics. 2DI36 Part II (Chapter 7 of MR)
") 2DI36 Statistics 2DI36 Part II (Chapter 7 of MR) What Have we Done so Far? Last time we introduced the concept of a dataset and seen how we can represent it in various ways But, how did this dataset came
2DI36 Statistics 2DI36 Part II (Chapter 7 of MR) What Have we Done so Far? Last time we introduced the concept of a dataset and seen how we can represent it in various ways But, how did this dataset came
Methodologies for Evaluation of Standalone CAD System Performance
 Methodologies for Evaluation of Standalone CAD System Performance DB DSFM DCMS OSEL DESE DP DIAM Berkman Sahiner, PhD USFDA/CDRH/OSEL/DIAM AAPM CAD Subcommittee in Diagnostic Imaging CAD: CADe and CADx
Logistic Regression. Vibhav Gogate The University of Texas at Dallas. Some Slides from Carlos Guestrin, Luke Zettlemoyer and Dan Weld.
 Logistic Regression Vibhav Gogate The University of Texas at Dallas Some Slides from Carlos Guestrin, Luke Zettlemoyer and Dan Weld. Generative vs. Discriminative Classifiers Want to Learn: h:x Y X features
VARIANCE REDUCTION TECHNIQUES FOR IMPLICIT MONTE CARLO SIMULATIONS
 VARIANCE REDUCTION TECHNIQUES FOR IMPLICIT MONTE CARLO SIMULATIONS An Undergraduate Research Scholars Thesis by JACOB TAYLOR LANDMAN Submitted to Honors and Undergraduate Research Texas A&M University
Bayesian Machine Learning (ML): Modeling And Inference in Big Data. Zhuhua Cai Google, Rice University caizhua@gmail.com
: Modeling And Inference in Big Data. Zhuhua Cai Google, Rice University caizhua@gmail.com") Bayesian Machine Learning (ML): Modeling And Inference in Big Data Zhuhua Cai Google Rice University caizhua@gmail.com 1 Syllabus Bayesian ML Concepts (Today) Bayesian ML on MapReduce (Next morning) Bayesian
Bayesian Machine Learning (ML): Modeling And Inference in Big Data Zhuhua Cai Google Rice University caizhua@gmail.com 1 Syllabus Bayesian ML Concepts (Today) Bayesian ML on MapReduce (Next morning) Bayesian
Environmental Remote Sensing GEOG 2021
 Environmental Remote Sensing GEOG 2021 Lecture 4 Image classification 2 Purpose categorising data data abstraction / simplification data interpretation mapping for land cover mapping use land cover class
Measuring Line Edge Roughness: Fluctuations in Uncertainty
 Tutor6.doc: Version 5/6/08 T h e L i t h o g r a p h y E x p e r t (August 008) Measuring Line Edge Roughness: Fluctuations in Uncertainty Line edge roughness () is the deviation of a feature edge (as
The Fundamentals of MTF, Wiener Spectra, and DQE. Motivation
 The Fundamentals of MTF, Wiener Spectra, and DQE Robert M Nishikawa Kurt Rossmann Laboratories for Radiologic Image Research Department of Radiology, The University of Chicago Motivation Goal of radiology:
11 Linear and Quadratic Discriminant Analysis, Logistic Regression, and Partial Least Squares Regression
 Frank C Porter and Ilya Narsky: Statistical Analysis Techniques in Particle Physics Chap. c11 2013/9/9 page 221 le-tex 221 11 Linear and Quadratic Discriminant Analysis, Logistic Regression, and Partial
Chapter 6. The stacking ensemble approach
 82 This chapter proposes the stacking ensemble approach for combining different data mining classifiers to get better performance. Other combination techniques like voting, bagging etc are also described
Detection Sensitivity and Response Bias
 Detection Sensitivity and Response Bias Lewis O. Harvey, Jr. Department of Psychology University of Colorado Boulder, Colorado The Brain (Observable) Stimulus System (Observable) Response System (Observable)
Parallel Data Selection Based on Neurodynamic Optimization in the Era of Big Data
 Parallel Data Selection Based on Neurodynamic Optimization in the Era of Big Data Jun Wang Department of Mechanical and Automation Engineering The Chinese University of Hong Kong Shatin, New Territories,
Auxiliary Variables in Mixture Modeling: 3-Step Approaches Using Mplus
 Auxiliary Variables in Mixture Modeling: 3-Step Approaches Using Mplus Tihomir Asparouhov and Bengt Muthén Mplus Web Notes: No. 15 Version 8, August 5, 2014 1 Abstract This paper discusses alternatives
VEHICLE TRACKING USING ACOUSTIC AND VIDEO SENSORS
 VEHICLE TRACKING USING ACOUSTIC AND VIDEO SENSORS Aswin C Sankaranayanan, Qinfen Zheng, Rama Chellappa University of Maryland College Park, MD - 277 {aswch, qinfen, rama}@cfar.umd.edu Volkan Cevher, James
Predict Influencers in the Social Network
 Predict Influencers in the Social Network Ruishan Liu, Yang Zhao and Liuyu Zhou Email: rliu2, yzhao2, lyzhou@stanford.edu Department of Electrical Engineering, Stanford University Abstract Given two persons
Norbert Schuff Professor of Radiology VA Medical Center and UCSF Norbert.schuff@ucsf.edu
 Norbert Schuff Professor of Radiology Medical Center and UCSF Norbert.schuff@ucsf.edu Medical Imaging Informatics 2012, N.Schuff Course # 170.03 Slide 1/67 Overview Definitions Role of Segmentation Segmentation
Image Compression and Decompression using Adaptive Interpolation
 Image Compression and Decompression using Adaptive Interpolation SUNILBHOOSHAN 1,SHIPRASHARMA 2 Jaypee University of Information Technology 1 Electronicsand Communication EngineeringDepartment 2 ComputerScience
Object Recognition and Template Matching
 Object Recognition and Template Matching Template Matching A template is a small image (sub-image) The goal is to find occurrences of this template in a larger image That is, you want to find matches of
Lecture 14. Point Spread Function (PSF)
") Lecture 14 Point Spread Function (PSF), Modulation Transfer Function (MTF), Signal-to-noise Ratio (SNR), Contrast-to-noise Ratio (CNR), and Receiver Operating Curves (ROC) Point Spread Function (PSF) Recollect
Lecture 14 Point Spread Function (PSF), Modulation Transfer Function (MTF), Signal-to-noise Ratio (SNR), Contrast-to-noise Ratio (CNR), and Receiver Operating Curves (ROC) Point Spread Function (PSF) Recollect
Assessment of Camera Phone Distortion and Implications for Watermarking
 Assessment of Camera Phone Distortion and Implications for Watermarking Aparna Gurijala, Alastair Reed and Eric Evans Digimarc Corporation, 9405 SW Gemini Drive, Beaverton, OR 97008, USA 1. INTRODUCTION
Another Look at Sensitivity of Bayesian Networks to Imprecise Probabilities
 Another Look at Sensitivity of Bayesian Networks to Imprecise Probabilities Oscar Kipersztok Mathematics and Computing Technology Phantom Works, The Boeing Company P.O.Box 3707, MC: 7L-44 Seattle, WA 98124
The Scientific Data Mining Process
 Chapter 4 The Scientific Data Mining Process When I use a word, Humpty Dumpty said, in rather a scornful tone, it means just what I choose it to mean neither more nor less. Lewis Carroll [87, p. 214] In
Java Modules for Time Series Analysis
 Java Modules for Time Series Analysis Agenda Clustering Non-normal distributions Multifactor modeling Implied ratings Time series prediction 1. Clustering + Cluster 1 Synthetic Clustering + Time series
Question 2 Naïve Bayes (16 points)
") Question 2 Naïve Bayes (16 points) About 2/3 of your email is spam so you downloaded an open source spam filter based on word occurrences that uses the Naive Bayes classifier. Assume you collected the
Question 2 Naïve Bayes (16 points) About 2/3 of your email is spam so you downloaded an open source spam filter based on word occurrences that uses the Naive Bayes classifier. Assume you collected the
Determining optimal window size for texture feature extraction methods
 IX Spanish Symposium on Pattern Recognition and Image Analysis, Castellon, Spain, May 2001, vol.2, 237-242, ISBN: 84-8021-351-5. Determining optimal window size for texture feature extraction methods Domènec
Spatial Statistics Chapter 3 Basics of areal data and areal data modeling
 Spatial Statistics Chapter 3 Basics of areal data and areal data modeling Recall areal data also known as lattice data are data Y (s), s D where D is a discrete index set. This usually corresponds to data
PHASE ESTIMATION ALGORITHM FOR FREQUENCY HOPPED BINARY PSK AND DPSK WAVEFORMS WITH SMALL NUMBER OF REFERENCE SYMBOLS
 PHASE ESTIMATION ALGORITHM FOR FREQUENCY HOPPED BINARY PSK AND DPSK WAVEFORMS WITH SMALL NUM OF REFERENCE SYMBOLS Benjamin R. Wiederholt The MITRE Corporation Bedford, MA and Mario A. Blanco The MITRE
CHAPTER 8 FACTOR EXTRACTION BY MATRIX FACTORING TECHNIQUES. From Exploratory Factor Analysis Ledyard R Tucker and Robert C.
 CHAPTER 8 FACTOR EXTRACTION BY MATRIX FACTORING TECHNIQUES From Exploratory Factor Analysis Ledyard R Tucker and Robert C MacCallum 1997 180 CHAPTER 8 FACTOR EXTRACTION BY MATRIX FACTORING TECHNIQUES In
Monte Carlo testing with Big Data
 Monte Carlo testing with Big Data Patrick Rubin-Delanchy University of Bristol & Heilbronn Institute for Mathematical Research Joint work with: Axel Gandy (Imperial College London) with contributions from:
A General Framework for Mining Concept-Drifting Data Streams with Skewed Distributions
 A General Framework for Mining Concept-Drifting Data Streams with Skewed Distributions Jing Gao Wei Fan Jiawei Han Philip S. Yu University of Illinois at Urbana-Champaign IBM T. J. Watson Research Center
Time Domain and Frequency Domain Techniques For Multi Shaker Time Waveform Replication
 Time Domain and Frequency Domain Techniques For Multi Shaker Time Waveform Replication Thomas Reilly Data Physics Corporation 1741 Technology Drive, Suite 260 San Jose, CA 95110 (408) 216-8440 This paper
Communication on the Grassmann Manifold: A Geometric Approach to the Noncoherent Multiple-Antenna Channel
 IEEE TRANSACTIONS ON INFORMATION THEORY, VOL. 48, NO. 2, FEBRUARY 2002 359 Communication on the Grassmann Manifold: A Geometric Approach to the Noncoherent Multiple-Antenna Channel Lizhong Zheng, Student
Variations of Statistical Models
 38. Statistics 1 38. STATISTICS Revised September 2013 by G. Cowan (RHUL). This chapter gives an overview of statistical methods used in high-energy physics. In statistics, we are interested in using a
Automated Stellar Classification for Large Surveys with EKF and RBF Neural Networks
 Chin. J. Astron. Astrophys. Vol. 5 (2005), No. 2, 203 210 (http:/www.chjaa.org) Chinese Journal of Astronomy and Astrophysics Automated Stellar Classification for Large Surveys with EKF and RBF Neural
1. Classification problems
 Neural and Evolutionary Computing. Lab 1: Classification problems Machine Learning test data repository Weka data mining platform Introduction Scilab 1. Classification problems The main aim of a classification
APPM4720/5720: Fast algorithms for big data. Gunnar Martinsson The University of Colorado at Boulder
 APPM4720/5720: Fast algorithms for big data Gunnar Martinsson The University of Colorado at Boulder Course objectives: The purpose of this course is to teach efficient algorithms for processing very large
Supporting Online Material for
 www.sciencemag.org/cgi/content/full/313/5786/504/dc1 Supporting Online Material for Reducing the Dimensionality of Data with Neural Networks G. E. Hinton* and R. R. Salakhutdinov *To whom correspondence
MUSICAL INSTRUMENT FAMILY CLASSIFICATION
 MUSICAL INSTRUMENT FAMILY CLASSIFICATION Ricardo A. Garcia Media Lab, Massachusetts Institute of Technology 0 Ames Street Room E5-40, Cambridge, MA 039 USA PH: 67-53-0 FAX: 67-58-664 e-mail: rago @ media.
Nonlinear Iterative Partial Least Squares Method
 Numerical Methods for Determining Principal Component Analysis Abstract Factors Béchu, S., Richard-Plouet, M., Fernandez, V., Walton, J., and Fairley, N. (2016) Developments in numerical treatments for
CHAPTER VII CONCLUSIONS
 CHAPTER VII CONCLUSIONS To do successful research, you don t need to know everything, you just need to know of one thing that isn t known. -Arthur Schawlow In this chapter, we provide the summery of the
Supervised Learning (Big Data Analytics)
") Supervised Learning (Big Data Analytics) Vibhav Gogate Department of Computer Science The University of Texas at Dallas Practical advice Goal of Big Data Analytics Uncover patterns in Data. Can be used
Supervised Learning (Big Data Analytics) Vibhav Gogate Department of Computer Science The University of Texas at Dallas Practical advice Goal of Big Data Analytics Uncover patterns in Data. Can be used
Low-resolution Image Processing based on FPGA
 Abstract Research Journal of Recent Sciences ISSN 2277-2502. Low-resolution Image Processing based on FPGA Mahshid Aghania Kiau, Islamic Azad university of Karaj, IRAN Available online at: www.isca.in,
The Wondrous World of fmri statistics
 Outline The Wondrous World of fmri statistics FMRI data and Statistics course, Leiden, 11-3-2008 The General Linear Model Overview of fmri data analysis steps fmri timeseries Modeling effects of interest
High Quality Image Magnification using Cross-Scale Self-Similarity
 High Quality Image Magnification using Cross-Scale Self-Similarity André Gooßen 1, Arne Ehlers 1, Thomas Pralow 2, Rolf-Rainer Grigat 1 1 Vision Systems, Hamburg University of Technology, D-21079 Hamburg
Machine Learning Final Project Spam Email Filtering
 Machine Learning Final Project Spam Email Filtering March 2013 Shahar Yifrah Guy Lev Table of Content 1. OVERVIEW... 3 2. DATASET... 3 2.1 SOURCE... 3 2.2 CREATION OF TRAINING AND TEST SETS... 4 2.3 FEATURE
MATHEMATICAL METHODS OF STATISTICS
 MATHEMATICAL METHODS OF STATISTICS By HARALD CRAMER TROFESSOK IN THE UNIVERSITY OF STOCKHOLM Princeton PRINCETON UNIVERSITY PRESS 1946 TABLE OF CONTENTS. First Part. MATHEMATICAL INTRODUCTION. CHAPTERS
Neovision2 Performance Evaluation Protocol
 Neovision2 Performance Evaluation Protocol Version 3.0 4/16/2012 Public Release Prepared by Rajmadhan Ekambaram rajmadhan@mail.usf.edu Dmitry Goldgof, Ph.D. goldgof@cse.usf.edu Rangachar Kasturi, Ph.D.
Ericsson T18s Voice Dialing Simulator
 Ericsson T18s Voice Dialing Simulator Mauricio Aracena Kovacevic, Anna Dehlbom, Jakob Ekeberg, Guillaume Gariazzo, Eric Lästh and Vanessa Troncoso Dept. of Signals Sensors and Systems Royal Institute of
Probabilistic Methods for Time-Series Analysis
 Probabilistic Methods for Time-Series Analysis 2 Contents 1 Analysis of Changepoint Models 1 1.1 Introduction................................ 1 1.1.1 Model and Notation....................... 2 1.1.2 Example:
Health Care and Life Sciences
 Sensitivity, Specificity, Accuracy, Associated Confidence Interval and ROC Analysis with Practical SAS Implementations Wen Zhu 1, Nancy Zeng 2, Ning Wang 2 1 K&L consulting services, Inc, Fort Washington,
1816 IEEE TRANSACTIONS ON IMAGE PROCESSING, VOL. 15, NO. 7, JULY 2006. Principal Components Null Space Analysis for Image and Video Classification
 1816 IEEE TRANSACTIONS ON IMAGE PROCESSING, VOL. 15, NO. 7, JULY 2006 Principal Components Null Space Analysis for Image and Video Classification Namrata Vaswani, Member, IEEE, and Rama Chellappa, Fellow,
SAS Software to Fit the Generalized Linear Model
 SAS Software to Fit the Generalized Linear Model Gordon Johnston, SAS Institute Inc., Cary, NC Abstract In recent years, the class of generalized linear models has gained popularity as a statistical modeling
Bootstrapping Big Data
 Bootstrapping Big Data Ariel Kleiner Ameet Talwalkar Purnamrita Sarkar Michael I. Jordan Computer Science Division University of California, Berkeley {akleiner, ameet, psarkar, jordan}@eecs.berkeley.edu
NCSS Statistical Software Principal Components Regression. In ordinary least squares, the regression coefficients are estimated using the formula ( )
") Chapter 340 Principal Components Regression Introduction is a technique for analyzing multiple regression data that suffer from multicollinearity. When multicollinearity occurs, least squares estimates
Chapter 340 Principal Components Regression Introduction is a technique for analyzing multiple regression data that suffer from multicollinearity. When multicollinearity occurs, least squares estimates
Imputing Missing Data using SAS
 ABSTRACT Paper 3295-2015 Imputing Missing Data using SAS Christopher Yim, California Polytechnic State University, San Luis Obispo Missing data is an unfortunate reality of statistics. However, there are
SAS Certificate Applied Statistics and SAS Programming
 SAS Certificate Applied Statistics and SAS Programming SAS Certificate Applied Statistics and Advanced SAS Programming Brigham Young University Department of Statistics offers an Applied Statistics and
Method for detecting software anomalies based on recurrence plot analysis
 Journal of Theoretical and Applied Computer Science Vol. 6, No. 1, 2012, pp. 3-12 ISSN 2299-2634 http://www.jtacs.org Method for detecting software anomalies based on recurrence plot analysis Michał Mosdorf
Stability of the LMS Adaptive Filter by Means of a State Equation
 Stability of the LMS Adaptive Filter by Means of a State Equation Vítor H. Nascimento and Ali H. Sayed Electrical Engineering Department University of California Los Angeles, CA 90095 Abstract This work
New Work Item for ISO 3534-5 Predictive Analytics (Initial Notes and Thoughts) Introduction
 Introduction") Introduction New Work Item for ISO 3534-5 Predictive Analytics (Initial Notes and Thoughts) Predictive analytics encompasses the body of statistical knowledge supporting the analysis of massive data sets.
Introduction New Work Item for ISO 3534-5 Predictive Analytics (Initial Notes and Thoughts) Predictive analytics encompasses the body of statistical knowledge supporting the analysis of massive data sets.
RF Network Analyzer Basics
 RF Network Analyzer Basics A tutorial, information and overview about the basics of the RF Network Analyzer. What is a Network Analyzer and how to use them, to include the Scalar Network Analyzer (SNA),
What mathematical optimization can, and cannot, do for biologists. Steven Kelk Department of Knowledge Engineering (DKE) Maastricht University, NL
 Maastricht University, NL") What mathematical optimization can, and cannot, do for biologists Steven Kelk Department of Knowledge Engineering (DKE) Maastricht University, NL Introduction There is no shortage of literature about the
What mathematical optimization can, and cannot, do for biologists Steven Kelk Department of Knowledge Engineering (DKE) Maastricht University, NL Introduction There is no shortage of literature about the
Review Jeopardy. Blue vs. Orange. Review Jeopardy
 Review Jeopardy Blue vs. Orange Review Jeopardy Jeopardy Round Lectures 0-3 Jeopardy Round $200 How could I measure how far apart (i.e. how different) two observations, y 1 and y 2, are from each other?
Performance Metrics for Graph Mining Tasks
 Performance Metrics for Graph Mining Tasks 1 Outline Introduction to Performance Metrics Supervised Learning Performance Metrics Unsupervised Learning Performance Metrics Optimizing Metrics Statistical
EFFICIENT DATA PRE-PROCESSING FOR DATA MINING
 EFFICIENT DATA PRE-PROCESSING FOR DATA MINING USING NEURAL NETWORKS JothiKumar.R 1, Sivabalan.R.V 2 1 Research scholar, Noorul Islam University, Nagercoil, India Assistant Professor, Adhiparasakthi College
A secure face tracking system
 International Journal of Information & Computation Technology. ISSN 0974-2239 Volume 4, Number 10 (2014), pp. 959-964 International Research Publications House http://www. irphouse.com A secure face tracking
Part 4 fitting with energy loss and multiple scattering non gaussian uncertainties outliers
 Part 4 fitting with energy loss and multiple scattering non gaussian uncertainties outliers material intersections to treat material effects in track fit, locate material 'intersections' along particle
APPLICATION OF DATA MINING TECHNIQUES FOR DIRECT MARKETING. Anatoli Nachev
 86 ITHEA APPLICATION OF DATA MINING TECHNIQUES FOR DIRECT MARKETING Anatoli Nachev Abstract: This paper presents a case study of data mining modeling techniques for direct marketing. It focuses to three
PTE505: Inverse Modeling for Subsurface Flow Data Integration (3 Units)
") PTE505: Inverse Modeling for Subsurface Flow Data Integration (3 Units) Instructor: Behnam Jafarpour, Mork Family Department of Chemical Engineering and Material Science Petroleum Engineering, HED 313,
PTE505: Inverse Modeling for Subsurface Flow Data Integration (3 Units) Instructor: Behnam Jafarpour, Mork Family Department of Chemical Engineering and Material Science Petroleum Engineering, HED 313,
Subspace Analysis and Optimization for AAM Based Face Alignment
 Subspace Analysis and Optimization for AAM Based Face Alignment Ming Zhao Chun Chen College of Computer Science Zhejiang University Hangzhou, 310027, P.R.China zhaoming1999@zju.edu.cn Stan Z. Li Microsoft
CS 591.03 Introduction to Data Mining Instructor: Abdullah Mueen
 CS 591.03 Introduction to Data Mining Instructor: Abdullah Mueen LECTURE 3: DATA TRANSFORMATION AND DIMENSIONALITY REDUCTION Chapter 3: Data Preprocessing Data Preprocessing: An Overview Data Quality Major
Software and Hardware Solutions for Accurate Data and Profitable Operations. Miguel J. Donald J. Chmielewski Contributor. DuyQuang Nguyen Tanth
 Smart Process Plants Software and Hardware Solutions for Accurate Data and Profitable Operations Miguel J. Bagajewicz, Ph.D. University of Oklahoma Donald J. Chmielewski Contributor DuyQuang Nguyen Tanth