State Report. Prepared by. December Page 1
|
|
|
- Sophie Goodman
- 8 years ago
- Views:
Transcription
1 State of Florida 2011 Debt Affordability Report Prepared by The Division of Bond Finance December 2011 Page 1

2 TABLE OF CONTENTS Executive Summary... 1 Introduction... 4 Composition of Outstanding Florida Debt... 6 Growth in State Debt... 9 Growth in Annual Debt Service Expected Debt Issuance Projected Debt Service Long-Run Revenue Forecasts Benchmark Debt Ratio Change in Debt Capacity Debt Ratio Comparison Level of Reserves Review of Credit Ratings Conclusion Page i

3 TABLES AND CHARTS Figure 1: Direct Debt Outstanding by Program... 6 Figure 2: Direct Debt Outstanding by Type and Program... 7 Figure 3: Total Indirect State Debt... 8 Figure 4: Total Indirect State Debt by Program... 8 Figure 5: Historical Total Direct Debt Outstanding, Fiscal Years 2001 through Figure 6: Annual New Money Debt Issuance Figure 7: Historical Net Tax-Supported Debt Service, Fiscal Years 2001 through Figure 8: Net Tax-Supported Existing Debt Service Requirements, Next Ten Years Figure 9: Existing and Proposed DBF Cash Availability Payments, Fiscal Years 2012 through Figure 10: Projected Debt Issuance by Program, Fiscal Years 2012 through Figure 11: Projected Annual Debt Service, Next Ten Years Figure 12: Projected Revenue Available for State Tax-Supported Debt Figure 13: Revenues Available for Debt Service Figure 14: Historical and Projected Benchmark Debt Ratio Figure 15: Benchmark Debt Ratio Projection Figure 16: Debt Capacity Analysis Ten-Year Projection, 6% Target; 7% Cap Figure 17: 2010 Comparison of Florida to Peer Group and National Medians Figure 18: 2010 Comparison of Florida to Ten Most Populous States Figure 19: Comparison of Peer Group Debt and Pension Liabilities as a Percent of GDP Figure 20: General Fund Reserves Figure 21: General Fund Plus Trust Fund Reserves Figure 22: State of Florida General Obligation Credit Ratings Page ii

4 EXECUTIVE SUMMARY The purpose of the 2011 Debt Affordability Report is to review changes in the State s debt position that occurred over the last year and revise projections used to measure the financial impact of changes in revenues and future debt issuance. The 2011 Debt Affordability Report has been prepared as required by Section , Florida Statutes. Debt Outstanding: Total State direct debt outstanding was $27.7 billion at June 30, 2011, approximately $500 million less than the prior fiscal year. Net tax-supported debt for programs supported by State tax revenues or tax-like revenues totaled $23.0 billion, and self-supporting debt, representing debt secured by revenues generated from operating bond-financed facilities, totaled $4.7 billion. Additionally, indirect State debt at June 30, 2011 was approximately $16.0 billion. Indirect debt is either not secured by traditional State revenues or is an obligation of a legal entity other than the State. Indirect debt has become a much more significant part of the State s overall debt profile due to borrowings by insurance-related entities such as Citizens Property Insurance Corporation and the Florida Hurricane Catastrophe Fund Finance Corporation; however, indirect debt is not a component of State debt ratios or the debt affordability analysis. Estimated Debt Issuance: Approximately $4.9 billion of debt is projected to be issued over the next ten years for all of the State s currently authorized financing programs, which is the lowest level of projected issuance since 1999 when the first Debt Affordability Report was prepared. This estimate is approximately $2.2 billion or 31% less than last year s projected debt issuance and is the third consecutive year of significant decreases in expected issuance. The decline is due to discontinued borrowing for acquiring conservation land, less Public Education Capital Outlay borrowing as lower gross receipts tax collections limit debt capacity for this program, and less borrowing for transportation over the projection period. Expected debt issuance also does not include additional obligations for Public/Private Partnership (P3) projects as there is no basis for anticipating these transactions. Estimated Annual Debt Service Requirements: Debt service payments totaled $2.2 billion in Fiscal Year Annual debt service requirements for Fiscal Year 2011 increased by $109 million over the prior fiscal year. As expected, the increase in annual debt service resulted from the carrying charges of a full year s debt service on $2.5 billion of debt issued in Fiscal Year Based on projected bond issuance, annual debt service payments are estimated to remain at approximately $2.2 billion in Fiscal Year 2012 and increase to $2.3 billion in Fiscal Year Reserves: One of the most important indicators of a government s financial strength is its general fund reserves. In Fiscal Year 2011, reserves were used to minimize spending reductions, decreasing the State s year-end General Fund Reserve balance. The combined balance of the Budget Stabilization Fund and the General Fund (collectively referred to herein as General Fund Reserves ) were $1.0 billion or 4.6% of general revenues at June 30, 2011, slightly under the 5% considered adequate by rating agencies. General Fund Reserves are expected to increase at the end of Fiscal Year 2012 to $1.4 billion, or 6.2% of general revenues, however, any use of reserves to fund projected deficits will reduce the year-end balance. Trust Fund balances have served as an Page 1

5 additional source of reserves, augmenting the State s financial flexibility. Adequate reserves have been critical in providing the financial flexibility to react to declining revenues and are an important factor in maintaining the State s ratings. Revenue Projections: Revenues available for debt service in Fiscal Year 2011 of $29.6 billion were $1.3 billion more than Fiscal Year The increase in revenues was due to a stabilizing economy with growth in base revenues, primarily sales taxes. However, the last three Revenue Estimating Conferences have revised forecasts downward, and Fiscal Years 2012 and 2013 include more modest year-over-year growth of $500 million and $900 million, respectively. The Revenue Estimating Conferences will meet in January 2012 to update revenue forecasts, and revisions to the projected benchmark debt ratio will be made accordingly. Debt Ratios: The State s benchmark debt ratio of debt service to revenues available to pay debt service has increased slightly over the past year from 7.39% for Fiscal Year 2010 to 7.46% for Fiscal Year The slight increase in the benchmark debt ratio reflects the offsetting effects of increases in revenues and debt service, i.e., revenues increased by $1.3 billion and annual debt service increased by $109 million. The benchmark debt ratio is still projected to exceed the 7% policy cap through Fiscal Year Following Fiscal Year 2013, the projected improvement reflects increased revenues available to pay debt service and decreased projected debt issuance. The benchmark debt ratio could increase if revenues do not grow as anticipated or additional debt is authorized. The benchmark debt ratio is projected to drop in 2014 and approach the 6% policy target due to a significant reduction ($265 million) in annual debt service resulting from the final maturity of Preservation 2000 bonds. A comparison of 2010 debt ratios to national and peer group averages indicate that Florida s debt ratios are generally higher than the national average but lower than the peer group averages for all but the benchmark debt ratio. Despite improvement in the State s ranking in the ten-state peer group over the last ten years, it remains in the middle of the peer group. The State moved from second to fourth highest for the ratio of debt service to revenues within the peer group, remained fifth highest in debt per capita, and sixth highest for debt as a percentage of personal income. Additionally, when pension liabilities are combined with long-term debt, the State ranks seventh highest in the peer group. Debt Capacity: Based upon the current revenue projections and existing borrowing plans, there is no debt capacity available within the 7% policy cap until Fiscal Year Debt capacity is not available until 2014 when annual debt service declines substantially due to the retirement of Preservation 2000 bonds. The estimated debt capacity available within the 7% policy cap in 2014 is $4.8 billion. The debt capacity available over the next ten years within the 7% policy cap is approximately $19.3 billion. Capacity will not become available within the 6% target until The amount and timing of debt capacity available will change based on future revenue projections and debt issuance. Page 2

6 Overview of the State s Credit Ratings: The State maintained its credit ratings during the past year. Standard and Poor s returned the Outlook on the State s General Obligation rating to stable from negative and maintained its AAA rating. Fitch Ratings affirmed the State s rating at AAA, retaining the negative outlook while Moody s Investors Service affirmed the State s rating of Aa1 with a stable outlook. The State s conservative financial and budgeting practices and adequate reserves continue to be recognized as credit strengths. Over the near term, rating agencies will monitor Florida s economic recovery compared to other states. In addition, analysts will focus on how the lagging economic growth affects revenue projections and the State s ability to restore and maintain adequate reserves, balance the budget, and continue to responsibly fund the pension system. Page 3

7 INTRODUCTION In 1999, the Governor and Cabinet, acting as Governing Board of the Division of Bond Finance, requested that staff prepare a Debt Affordability Study. The primary purpose of the study was to provide policymakers with a basis for assessing the impact of bond programs on the State s fiscal position, enabling them to make informed decisions regarding financing proposals and capital spending priorities. A secondary goal was to provide a methodology for measuring, monitoring, and managing the State s debt, thereby protecting, and perhaps enhancing, Florida s bond ratings. The Debt Affordability Study resulted in the development of a financial model that measures the impact of changes in two variables: (1) the State s annual debt service payments; and (2) the amount of revenues available for debt service payments. The analysis compares the State s current debt position to relevant industry standards and evaluates the impact of issuing additional debt, as well as changes in the economic climate reflected in current revenue forecasts, on the State s debt position. During the 2001 Legislative Session, the Legislature adopted the debt affordability analysis by enacting Section , Florida Statutes. The statute requires the annual preparation and delivery of the debt affordability analysis to the President of the Senate, Speaker of the House and the chair of each appropriation committee and, among other things, designates debt service to revenues as the benchmark debt ratio. Additionally, the Legislature created a 6% benchmark debt ratio target and 7% cap as policy guidelines for calculating estimated debt capacity. Additional debt that would cause the benchmark debt ratio to exceed the 6% target may be issued only if the Legislature determines that the authorization and issuance of such additional debt are in the best interest of the State. Additional debt that would cause the benchmark debt ratio to exceed 7% may be issued only if the Legislature determines that such additional debt is necessary to address a critical state emergency. The 2011 Debt Affordability Report ( Report ) has been prepared to satisfy the requirements of Section , Florida Statues. The purpose of the Report is to review changes in the State s debt position over the past year and revise the projections of the benchmark debt ratio to evaluate the financial impact of future debt issuance and changing economic conditions reflected in current revenue estimates. Performing the debt affordability analysis enables the State to monitor changes in its debt position. The Report also provides information regarding current revenue estimates, which enables the State to anticipate and include changing economic conditions in its future borrowing plans. The essence of the Report is the revision of projected debt ratios for three factors: (1) actual debt issuance and repayments over the last year; (2) expected future debt issuance over the next 10 years; and (3) revised revenue forecasts by the Revenue Estimating Conference. The revised debt ratios are compared with national averages and Florida s ten-state peer group. Additionally, the revised benchmark debt ratio is evaluated vis-a-vis the 6% target and the 7% cap. Lastly, the target benchmark debt ratio of 6% and 7% cap are used to calculate anticipated future debt capacity available within the respective guidelines. Page 4

8 The information generated by this analysis is provided to the Governing Board of the Division of Bond Finance and to the Governor s Office of Policy and Budget for their use in connection with formulating the Governor s Budget Recommendations. The analysis will be updated as Revenue Estimating Conference forecasts are revised so that State policymakers and the Legislature will have the latest information available when making critical decisions regarding borrowing during the appropriations process. In addition, the Legislature can request the Division of Bond Finance to conduct an analysis of the long-term financial impact when considering any proposed new financing initiatives. Information generated by this analysis include important aspects for policymakers to consider when making future borrowing decisions as these choices can affect the long-term fiscal health of the State. Page 5

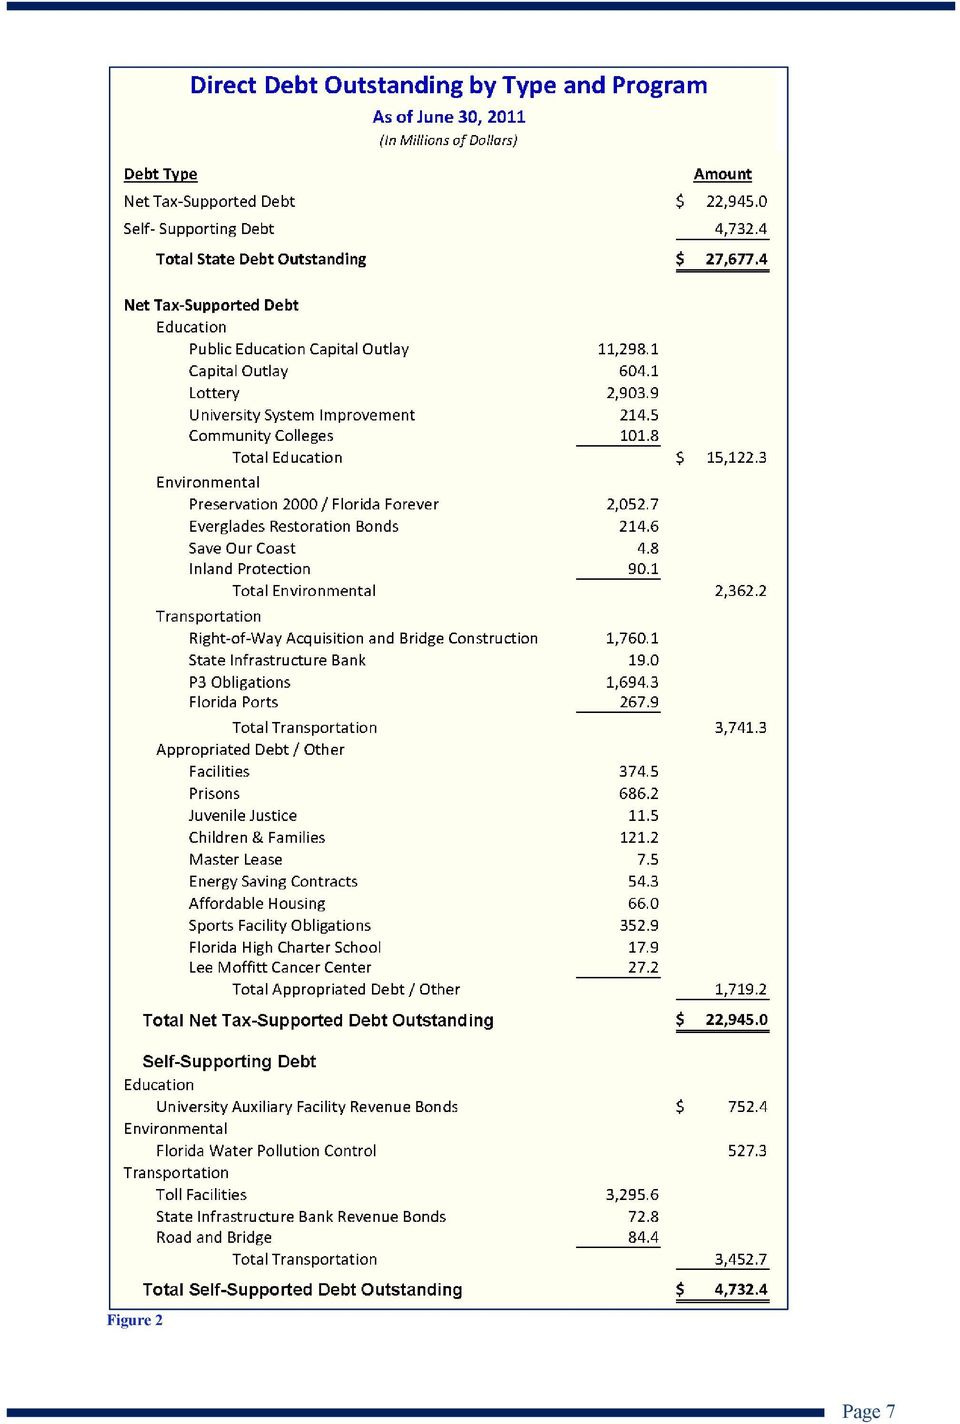
9 COMPOSITION OF OUTSTANDING FLORIDA DEBT Figure 1 The State of Florida had $27.7 billion in total direct debt outstanding at June 30, 2011, $500 million less than the previous year-end. Figure 1 illustrates the State s investment in bond financed infrastructure by program area. Educational facilities are the largest investment financed with bonds, with $15.9 billion or 57% of total debt outstanding devoted to school construction. Included in this amount are bonds outstanding for the State s largest bond program, Public Education Capital Outlay (PECO), which accounts for $11.3 billion, followed by the Lottery bond program with $2.9 billion of debt outstanding. Transportation infrastructure, consisting primarily of toll roads financed with bonds, is the second largest investment at $7.2 billion, which includes combined amounts outstanding for Florida s Turnpike and the State s Expressway Authorities of approximately $3.2 billion. Contributing to the next largest portion of transportation debt are Right-of-Way Acquisition and Bridge Construction bonds and P3 long-term obligations, with $1.8 billion of debt outstanding for each program. The third largest investment financed with bonds has been for conservation land acquisition, with $2.3 billion of bonds outstanding for the Preservation 2000/Florida Forever and Everglades Restoration bond programs. As shown in Figure 2, the $27.7 billion of direct debt outstanding at June 30, 2011 consisted of net tax-supported debt totaling $23.0 billion and self-supporting debt of $4.7 billion. Net tax-supported debt consists of debt secured by state tax revenue or tax-like revenue. Self-supporting debt is secured by revenues generated from operating the facilities financed with bonds. Toll facilities, including the Turnpike and other Expressway Authority bond programs, are the primary self-supporting programs with outstanding debt. The remaining self-supporting debt relates to university auxiliary enterprises such as dormitories and parking facilities and the water pollution control revolving loan program that provides low interest rate loans to local governments. Page 6
, which accounts for $11.")
10 Figure 2 Page 7
11 In addition to direct debt, the State also has indirect debt. Indirect debt is debt that is either not secured by traditional State revenues or is the obligation of a legal entity other than the State. Although in some cases indirect debt may represent a financial burden on Florida s citizenry, e.g., assessments to service Florida Hurricane Catastrophe Fund Finance Corporation (the CAT Fund ) and Citizens Property Insurance Corporation ( Citizens ) debt, indirect debt is not included in the State s debt ratios or the analysis of the State s debt burden. Figure 3 Indirect debt of the State totaled approximately $16.0 billion at June 30, 2011, $400 million less than the previous year-end. Figures 3 and 4 set forth the State s indirect debt by program. Special purpose, quasi-governmental insurance entities represented $9.9 billion or 62% of total indirect debt. At June 30, 2011, liquidity debt outstanding was $3.8 billion for Citizens and $3.5 billion for the CAT Fund, and post-event debt secured by assessments totaled $2.6 billion for both Citizens and the CAT Fund, combined. Rating agencies are considering the impact of potential future hurricane costs and insurance entity assessments in their analyses of the State s ratings. The Florida Housing Finance Corporation, which administers the State s housing programs, had $3.6 billion of debt outstanding or 22% of the total. University direct support organizations followed with $1.7 billion or 11% of the indirect debt. Figure 4 Page 8

12 GROWTH IN STATE DEBT Trends in debt are an important tool to evaluate debt levels over time. Figure 5 illustrates the growth in total State direct debt from Fiscal Year 2001 through Figure 5 Over the last ten years, the State made substantial investments in infrastructure for education, transportation, and acquiring conservation lands in order to address the requirements of a growing population. As a result, total State direct debt has increased by $9.4 billion from $18.3 billion at June 30, 2001 to $27.7 billion at June 30, The net increase was primarily due to the issuance of PECO bonds ($4.0 billion), Lottery bonds ($1.7 billion), Public/Private Partnership ( P3 ) obligations ($1.8 billion), toll road bonds ($1.2 billion), and Right-of-Way bonds ($900 million). Total direct debt declined by approximately $500 million in Fiscal Year 2011 from $28.2 billion at June 30, 2010 to $27.7 billion at June 30, 2011, reversing the long-term trend of increases. The decrease in total direct debt outstanding resulted from the principal amortization of debt of more than $1.4 billion exceeding new money issuance of approximately $900 million. The decrease in annual issuance was due to reduced PECO bonding for school construction and the discontinued borrowing for acquisition of conservation land. Self-supporting debt outstanding remained approximately the same at $4.7 billion, up from $4.6 billion from the prior year. The increase in self-supporting debt was primarily due to increased debt issued through the State revolving loan program for local government water pollution control projects. Page 9
, Lottery bonds ($1.7 billion), Public/Private Partnership ( P3 ) obligations ($1.8 billion), toll road bonds ($1.")
13 Set-forth below in Figure 6 is an illustration of annual debt issued over the last ten years, showing the significant decrease in new money bond issuance in Fiscal Year New money bond issuance in Fiscal Year 2011 of approximately $900 million was significantly less than the average annual bond issuance over the last ten years of $2.1 billion. Additionally, Fiscal Year 2011 new money issuance was less than one-third of the amounts issued in each of the last three fiscal years. Figure 6 Fiscal Year 2011 bond issuance included $13.0 million of additional Build America Bonds ( BABs ) bringing total BABs issued by the State to $1.6 billion prior to expiration of the program. BABs were authorized under the American Recovery and Reinvestment Act of 2009 and issued at taxable interest rates for which the Federal Government reimburses the issuer for 35% of the interest cost. The State expects to receive subsidy payments equal to 35% of the interest paid on each interest payment date of the BABs. Debt service is shown net of the BABs subsidy for purposes of this Report. BABs subsidy payments received in Fiscal Year 2011 totaled $33.4 million and will decrease annually over the life of the BABs bond issues. In addition to new money debt issuance during Fiscal Year 2011, the State issued $1.4 billion in refunding bonds: $1.4 billion for net tax-supported bond programs and $7 million for self-supporting bond programs. The refunding transactions were issued to reduce debt service payments by taking advantage of historically low interest rates. The refundings resulted in total debt service savings of $178 million and present value savings of $150 million. Fiscal Year 2011 debt service savings were $6 million, with average annual savings of $15 million thereafter. Page 10
 bringing total BABs issued by the State to $1.6 billion prior to expiration of the program.")
14 GROWTH IN ANNUAL DEBT SERVICE The State s annual debt service payments for existing net tax-supported debt is approximately $2.2 billion per year. The State s annual debt service requirements have increased by 69% over the last ten years, rising from approximately $1.3 billion in 2001 to approximately $2.2 billion in The increased annual debt service reflects growth in total debt outstanding over the same period. This is an important measure from a budgetary perspective because it indicates how much of the State s budget is obligated for paying debt service before providing for other essential government services. Although debt issuance was down during Fiscal Year 2011, annual debt service requirements increased by $109 million from $2.1 billion in 2010 to $2.2 billion in 2011, which is more than the $90 million ten-year average annual increase. As expected, the disproportionate increase in debt service in Fiscal Year 2011 reflected a full year s debt service on the debt issued in the prior fiscal year. The expected increase was reduced, however, by debt service savings totaling $30 million from refunding transactions executed during Fiscal Years 2010 and Figure 7 depicts the increase in annual debt service payments over the last ten years. Figure 7 Debt service for the next ten years on the State s existing net tax-supported debt is shown in Figure 8. The total annual payments consist of both principal and interest on outstanding debt. Payments for debt service on existing outstanding debt total $19.5 billion over the next ten years, with principal and interest payments of $11.7 billion and $7.9 billion, respectively. Annual debt service requirements of approximately $2.2 billion per year over the next two years, before declining to approximately $1.9 billion in 2014 through 2018, is indicative of the State s policy of using a level debt service structure. The decrease in annual debt service payments in 2014 of approximately $265 million is due to the final maturity of Preservation 2000 bonds. In Fiscal Year 2015, deferred payments on Public/Private Partnership (P3) arrangements begin to impact the level debt service payment structure. As more fully described below, mandatory long-term contractual payments required under the P3 arrangements are significantly deferred, deviating from the State s normal policy/practice of using a level debt structure. Page 11

15 Figure 8 Pursuant to Section , Florida Statutes, the Department of Transportation (DOT) has executed two agreements with private entities in order to advance the I-595 Corridor Improvement Project and the Port of Miami Tunnel Project. The aggregate annual payment of such obligations for P3 projects may not exceed 15% of funds available in the State Transportation Trust Fund (STTF) in any given year. The two existing P3 projects have combined project costs to the State of $1.8 billion with Availability Payments over the next 35 years totaling $3.5 billion. Availability Payments are mandatory scheduled payments that begin once construction is finished in Fiscal Years 2013 and 2014 and continue for 30 years. The I-595 Corridor Improvement Project is estimated to cost $1.3 billion and the Port of Miami Tunnel Project is estimated to cost $543 million. The maximum aggregate annual payment for these two long-term P3 projects is $170.5 million, which is approximately 3.6% of the funds available in the State Transportation Trust Fund. If this payment had been included as debt service for Fiscal Year 2011, the 2011 benchmark debt ratio would have increased by approximately 0.57%. The maximum annual payment under the statutory 15% cap is estimated to be approximately $705 million. If the State fully leveraged P3s up to the statutory cap, it would add an estimated $7 billion to the State s debt burden. The corresponding increase in the benchmark debt ratio would be approximately 2.4%. In addition to the two long-term P3 arrangements, DOT has used Design, Build, Finance contracts (DBF Contracts) to advance projects within its five-year workplan. The DBF Contracts accelerate projects but defer payments until moneys are available at a later point within the five-year workplan, similar to short-term debt. In Fiscal Year 2011, the cumulative cost of advancing the workplan through DBF Contracts amounts to $696 million in DOT short-term obligations payable from State Transportation Trust Fund (STTF) revenues. DOT has proposed future DBF Contracts totaling $435 million. Page 12

16 The total of existing and proposed DBF Contracts is $1.1 billion. The aggregate annual payments required under the DBF Contracts through Fiscal Year 2017 are shown in Figure 9 below. Figure 9 With the exception of the long-term P3 contracts entered into by DOT associated with the Miami Tunnel and the I-595 project, the obligations under DBF Contracts are excluded from the State s benchmark debt ratio analysis. The DBF Contract commitments are excluded from calculating the benchmark debt ratio because the payments balance within the current five-year workplan horizon and the commitments introduce near-term volatility in the State s benchmark debt ratio, impairing the usefulness of the debt affordability analysis as a long-term planning tool in managing the State s debt position. Going forward, DOT s use of P3 contracts will be monitored and analyzed to determine the effect on the State s benchmark debt ratio, with long-term P3s included as debt and DBF Contracts excluded. Page 13

17 EXPECTED DEBT ISSUANCE Figure 10 Future debt issuance is based on information provided by various agencies receiving the proceeds of the bonds. Neither new bonding programs nor projections for the maximum amount statutorily authorized under some bonding programs (e.g., Florida Forever, GARVEE and Public/Private Partnerships for transportation) have been included in the expected issuance. As detailed in Figure 10 above, approximately $4.9 billion in new money debt is projected to be issued over the next ten years for all of the State s currently authorized financing programs. The projected issuance is down significantly ($2.2 billion) from the prior year s projection of $7.2 billion. This is the third year that expected issuance has declined: in Fiscal Year 2009, the legislature discontinued annual authorizations for the Florida Forever and Everglades Restoration programs; in Fiscal Year Fiscal Year 2010, DOT eliminated approximately $1.1 billion from its projected issuance of GARVEE bonds; and this year, expected PECO bond issuance was reduced by $1.7 billion due to declining gross receipts tax collections. Expected bond issuance is predominately for financing educational facilities (PECO) and, to a lesser extent, transportation infrastructure (Right-of-Way Acquisition and Bridge Construction). The decrease in expected issuance helps improve the projected benchmark debt ratio. Page 14
")
18 PROJECTED DEBT SERVICE Figure 11 Figure 11 shows existing debt service and the estimated annual debt service for the projected bond issuances over the next ten fiscal years. Based on existing debt service and expected bond issuance, annual debt service is expected to increase to approximately $2.2 billion in Fiscal Year 2012 and reach a maximum of $2.3 billion in Fiscal Year The final retirement of the Preservation 2000 bonds will cause a decline in the annual debt service requirement of approximately $265 million in Fiscal Year However, growth in annual debt service resumes in 2015 as projected debt issuance increases and mandatory payments begin on the P3 projects that were executed in Fiscal Years 2009 and Additionally, deferred payments under long-term P3 contracts are not fully reflected in the illustration because they increase over time and extend beyond the projection period. The projected debt service does not include DBF Contracts for accelerating DOT s five-year work program or for any additional P3 projects because they are not predictable. Page 15

19 LONG-RUN REVENUE FORECASTS Revenue available to pay debt service is one of the two variables used to calculate the benchmark debt ratio. Actual general revenue collections for Fiscal Year 2011 exceeded Fiscal Year 2010 collections by $1.0 billion or a 4.8% increase over the prior year. Changes in revenue estimates have a significant impact on the calculation of available debt capacity and are especially important given the State s dynamic economic environment. Since the December 2010 Debt Affordability Report, which utilized revenue estimates from the August 2010 Revenue Estimating Conference, revenue forecasts have been reduced three consecutive times based on a slower than anticipated pace of recovery. Collectively, general revenue estimates were reduced by $415 million or 1.8% for Fiscal Year 2011; $1.5 billion or 6.0% for Fiscal Year 2012; and $1.8 billion or 6.9% for Fiscal Year The October 2011 Revenue Estimating Conference lowered most elements of its near-term forecast. The Florida Office of Economic and Demographic Research anticipates the long-lasting housing market correction, historic levels of foreclosure activity, and still sluggish credit conditions will remain the predominant drags on Florida s economy in the near term. All of these factors will continue to make the recovery slow and protracted. The October 2011 Revenue Estimating Conference results have been used for purposes of this Report. Revenue forecasts are expected to be reviewed and revised by the January 2012 Revenue Estimating Conference. General revenues, as well as specific tax revenues pledged to various bond programs (such as gross receipts taxes pledged to the PECO bonds, motor fuel taxes pledged to Right-of-Way bonds, and dedicated percentages of documentary stamp tax collections pledged to the Florida Forever and Everglades Restoration bond programs) are available for debt service. Historical and short-term projections of revenues available for debt service by source are provided in Figure 12 below. The projection of revenues available for debt service reflects the adjustments in general revenues as well as changes in the forecasts of specific pledged revenues. Figure 12 Page 16

20 Total revenues available in Fiscal Year 2011 totaled $29.6 billion or $1.3 billion more than the Fiscal Year 2010 amount of $28.3 billion. General revenue collections were $1 billion more than the prior year. The current revenue forecast indicates an increase in available revenues in future years. The increase in available revenues results in an improvement in the expected benchmark debt ratio. Figure 13 Figure 13 sets forth a ten-year history and five-year estimate of revenues available to pay debt service. The declines in revenue collections from 2007 through 2009 due to a weak economy caused significant increases in the benchmark debt ratio. See Benchmark Debt Ratio herein. Over the past year, the economic environment showed indications of a gradual recovery. The projected benchmark debt ratio reflects the expected slower pace of improvement in the economy and corresponding revenue collections. Page 17

21 BENCHMARK DEBT RATIO The metric used for the benchmark in the debt affordability analysis is the ratio of debt service to revenues available to pay debt service. The policy guidelines established by the Legislature for the benchmark debt ratio include a 6% target and a 7% cap. Figure 14 tracks both the historical and projected benchmark debt ratio. From Fiscal Year 2001 through 2003 the ratio increased, exceeding the 6% target in Then, due to strong revenue growth, the benchmark debt ratio declined from Fiscal Year 2004 through The significant increase in the benchmark debt ratio from Fiscal Year 2006 through 2009 illustrates the combined impact of declining revenues and increasing debt service. The improvement reflected in Fiscal Year 2010 resulted from adding federal reimbursements for transportation to the revenue base and only a partial year of debt service for Fiscal Year 2010 issuances. The slight increase in the benchmark debt ratio for Fiscal Year 2011 is due to the offsetting effects from increased debt service and improved revenue collections. Figure 14 Shown in Figure 15, the projected benchmark debt ratio for the next ten years is based on the October 2011 revenue forecasts and expected debt issuance. The January 2012 Revenue Estimating Conference is expected to review the revenue forecast, and projections of the benchmark debt ratio will be affected accordingly. Figure 15 Page 18
22 The projected benchmark debt ratio exceeds the 7% policy cap through The ratio improves significantly in 2014 because of reduced debt service requirements resulting from the final payment on Preservation 2000 bonds and is projected to return to compliance with the 6% policy target. Overall, the projections reflect the offsetting impact of lower projected issuance, especially PECO bonds, and lower forecasted revenue collections. Projected bond issuance does not include a new authorization enacted by the 2008 Legislature totaling approximately $3.4 billion to extend the Florida Forever and Everglades Restoration programs or additional issuance for transportation infrastructure under P3 arrangements and the GARVEE program. The projected improvement in the benchmark debt ratio is dependent on realizing the revenue growth projected by the Revenue Estimating Conference and foregoing any new bond authorizations beyond those included in existing borrowing plans. Page 19
23 CHANGE IN DEBT CAPACITY The last step in the debt affordability analysis is to estimate future available debt capacity. Debt capacity, as presented in this report, is based on current issuance expectations and the October 2011 revenue projections. Debt capacity can change significantly due to changes in revenue estimates reflecting a changing economic environment. No debt capacity is available over the next two years because the benchmark debt ratio exceeds the 7% policy cap. Figure 16 Figure 16 shows that based on the 6% benchmark debt ratio target, the total bonding capacity over the next ten years will be $13.3 billion. As previously shown, expected debt issuance for the next ten fiscal years under existing programs is estimated to be approximately $4.9 billion. This leaves approximately $8.4 billion of debt capacity over the next ten years (a $1.2 billion increase in available debt capacity over last year s estimate), which can be attributable to decreased expected bond issuance. However, no capacity is available within the 6% target until No expected issuance has been assumed for the continuation of environmental programs authorized by the 2008 Legislature or additional issuance for the P3 and GARVEE transportation programs. Figure 16 also shows the additional capacity under the 7% cap for the benchmark debt ratio that could be available to address State infrastructure needs. Total debt capacity within the 7% cap over the next ten years is estimated to be $19.3 billion; however, as noted above, there is no debt capacity available over the next two years. Approximately $4.8 billion of debt capacity becomes available in 2014 when annual debt service significantly declines due to the retirement of Preservation 2000 bonds. Estimated debt capacity should be considered a scarce resource to be used sparingly to provide funding for critical State infrastructure needs. Once used, the capacity is not available again for twenty years. Page 20
24 DEBT RATIO COMPARISON There are three debt ratios used by the municipal bond market to evaluate a government s debt position: debt service to revenues; debt per capita; and debt to personal income. Comparisons of the State debt ratios to national and peer group medians are helpful because absolute values are not particularly useful without a basis for comparison. A more meaningful comparison is made by using a comparable peer group consisting of the ten most populous states. Figure 17 Florida s debt ratios are generally higher than the national averages but are consistent with the peer group averages. However the ten-state peer group comparison, as shown in Figure 17, indicates that Florida s benchmark ratio of debt service as a percentage of revenues is higher than the peer group average. Figure 18 Figure 18 details the Ten Most Populous State Peer Group Comparison for the three debt ratios. North Carolina is now the tenth populous state and has been added to the peer group going forward. As indicated above, Florida is in the middle of the peer group for debt per capita and net taxsupported debt as a percentage of personal income ratios. Florida s relative ranking improved over the past year for the benchmark ratio of debt service as a percentage of revenue, moving from second highest to fourth highest, being surpassed by Ohio and California. The State has remained fifth highest for debt per capita and sixth highest for debt as a percentage of personal income. Page 21
25 In recent years, there has been an increasing awareness of the financial challenge presented by defined benefit retirement systems. Some states have not responsibly funded these defined benefit systems, raising credit concerns by investors and rating agencies. Additionally, some governments have reduced or deferred the Annually Required Contributions (ARC) to their pension systems as a way to provide for budget relief, compounding the long-term funding issues. Due to the potential credit implications related to increasing pension liabilities, rating agencies have developed quantitative methodologies to evaluate a state s pension liabilities and integrate them into their credit analysis. The unfunded actuarially accrued liability (UAAL), whether it s combined with total debt outstanding or analyzed separately, is a widely accepted metric within the credit markets. One method to evaluate the affordability of a state s pension liabilities is to compare them to the size of a state s economy, which can be measured by gross domestic product (GDP). The comparison of Florida s pension liability as a percentage of GDP relative to the ten largest states is noted in Figure 19 below. Figure 19 As shown, Florida ranks in the middle of the group when including the pension UAAL together with outstanding debt compared to the State s GDP. Notably, Florida s combined debt and pension liabilities of $41 billion fall well below the average amount of $54 billion for the largest states, illustrating Florida s well funded pension system as well as conservative management of the State s long-term debt. Rating agencies have given Florida positive marks for responsibly funding its pension system and modifying benefits to manage the liability over the long term. Although excluded from Figure 19 above, rating agencies are also considering the impact of other post employment benefits (OPEB) on a state s debt profile. Going forward, this liability may also become a standard component of a state s debt profile. However, the treatment of OPEB liabilities may evolve differently than that of pension liabilities as no generally accepted convention has been developed for evaluating the long term financial impact and in many instances OPEB is not a constitutional or contractual obligation. Page 22
26 LEVEL OF RESERVES An important measure of financial health and ability to respond to unforeseen financial challenges is the level of general fund reserves. The State s General Fund combined with the Budget Stabilization Fund are collectively referred to herein as the General Fund Reserves. The following Figure 20 shows the level of the State s General Fund Reserves over the last ten fiscal years. Figure 20 also shows the projected year-end General Fund Reserve balance for the current fiscal year. Historically, Florida s level of reserves resulted from conservative financial management practices and has been cited by credit rating agencies as a credit strength. The traditional measure used by credit analysts, investors and rating agencies is the ratio of general fund balance to general revenues expressed as a percentage. Figure 20 Florida s General Fund Reserves increased substantially between Fiscal Years 2003 and 2006 to an extraordinarily high level of $6.1 billion or 22.5% of general revenues. The growth in reserves significantly strengthened the State s financial position and was cited as a credit strength in State rating upgrades in early The increase in the General Fund Reserve balances for Fiscal Year 2010 follows three consecutive annual declines from 2007 through 2009 when reserves were used to minimize spending reductions from declining revenue collections. Balancing the Fiscal Year 2010 budget by incorporating several revenue enhancements and federal stimulus moneys resulted in an improved level of reserves for Fiscal Year However, reserves were subsequently used in Fiscal Year 2011, which decreased the General Fund Reserve balance at June 30, The State ended Fiscal Year 2011 with General Fund Reserves of $1.0 billion or 4.6% of general revenues. The adopted General Fund budget for the current fiscal year did not contemplate use of General Fund Reserves and included the first transfer to start replenishing the Budget Stabilization Fund. The level of reserves is projected to increase to $1.4 billion or 6.2% of general fund revenues at the end of Fiscal Year The year-end balance will likely be reduced due to the use of reserves to fund projected deficits. Year-end deficits are currently estimated at $177 million. Favorably, the projected level of reserves as a percentage of revenues at June 30, 2012 is expected to surpass the 5% considered adequate by rating agencies. Page 23
27 Trust fund balances that could be considered a reserve, such as moneys in the Lawton Chiles Endowment Fund and other trust fund balances, had not been included in measuring the State s reserves prior to The State has historically created trust funds and dedicated specified revenues for particular purposes. Well over half of the State s budget is comprised of trust funded programs and activities. Established budgetary practices identify trust fund balances that are available and can be used for other purposes. In fact, the Legislature has routinely redirected available trust fund balances to supplement the general fund budget during periods of economic weakness to offset declining revenue collections. Therefore, including trust fund balances in the reserve analysis provides for a more realistic picture of the State s financial flexibility. Figure 21 below shows the impact of including trust funds in the reserve analysis over the last ten years. Figure 21 Including trust fund balances augments the General Fund Reserve and better reflects the State s true financial flexibility available from reserves. Total reserves (including trust fund balances) were considered strong by rating agencies at $3.4 billion or 15% of general revenues at June 30, Overall, the adopted budget for the current fiscal year both changes the relative composition of reserves and reduces total reserves. While General Fund Reserves are expected to increase over the prior fiscal year, trust fund balances are expected to decline, reducing total reserves at the end of Fiscal Year 2012 to $2.95 billion or a still healthy 12.7% of general revenues. Page 24
28 REVIEW OF CREDIT RATINGS The State s credit rating is a rating agency s assessment of the willingness and ability to timely repay debt obligations. Credit ratings play an integral role in the municipal bond market and are one factor that affects the State s cost of funds on debt offerings. Each rating agency considers four primary factors in its analysis: governance, debt and liability profile, budget and financial management, and economic indicators. Each agency assesses the four factors on a quantitative and qualitative basis relative to the state s peers within its rating category. Despite the standardization of credit factors, each are evaluated slightly differently based on the agency s published criteria. During fiscal year ended June 30, 2011, the three major rating agencies, Fitch Ratings (Fitch), Moody s Investors Service (Moody s) and Standard and Poor s Rating Services (S&P) each affirmed the State s AAA, Aa1, and AAA, respective, general obligation ratings. Fitch and Moody s affirmed their Figure 22 respective negative and stable outlooks on the ratings, while S&P returned the outlook to stable from negative. The revised outlook indicates S&P s opinion that Florida s long term economic and financial profile has stabilized following the precipitous decline in revenue and housing activity resulting from the Great Recession. Other credit strengths echoed by the rating agencies include: sound and conservative financial management practices, well-funded pensions, maintenance of adequate reserves, and a large, service-based economy. In addition, these strengths are bolstered by legislative changes to the pension system to contain future liabilities, adoption of a balanced budget following the phase out of the American Recovery and Reinvestment Act stimulus funding, and commitment to rebuilding the Budget Stabilization Fund following its depletion. Rating analysts also note the State s ongoing credit challenges related to a lagging economic recovery including high unemployment, a severely weakened housing market, and a slower rate of population in-migration and how each may affect growth in major General Fund financial resources. Going forward, the agencies will pay particularly close attention to how Florida s pace of economic recovery compares to other states in the U.S. as well as in the southeastern region and the State s ability to meet revenue projections and rebuild financial reserves, which are significant factors to the overall rating analysis. In addition, rating analysts have focused attention on the State s budget and its relationship to federal spending due to the potential cuts in State funding that may result from efforts to reduce the federal deficit. In the end, Florida s credit ratings remain vulnerable should further economic weakness occur affecting financial resources and the State s ability to restore and bolster reserves, balance the budget without the use of one-time revenues, and keep pace with the modest economic recovery occurring in other states. Page 25
29 CONCLUSION Total direct debt outstanding declined by approximately $500 million in Fiscal Year 2011 from $28.2 billion at June 30, 2010 to $27.7 billion at June 30, 2011, reversing the long-term trend of increases. The decrease in direct debt outstanding occurred because the principal amortization of approximately $1.4 billion of debt exceeded new money issuance of approximately $900 million. Indirect debt outstanding also declined during Fiscal Year 2011, down approximately $400 million to a total of $16.0 billion at June 30, Expected future debt issuance under existing programs over the next ten years totals $4.9 billion and is the lowest level of projected issuance since 1999 when the first Debt Affordability Report was released. The decrease in expected issuance resulted from curtailed PECO bonding and discontinued borrowing for conservation land acquisition. The projected debt issuance does not include any amounts for the issuance of environmental bonds, P3 projects or GARVEE bonds. Florida s debt is considered moderate and is manageable at the current level. Although outstanding debt decreased, annual debt service requirements on net-tax supported debt increased by $109 million (5.2%) to $2.2 billion for Fiscal Year The increase is attributable to the full year s debt service on bonds issued in Fiscal Year Annual debt service requirements are projected to increase by 3% to approximately $2.3 billion in Fiscal Year 2013, before declining to approximately $1.9 billion in 2014 due to the final maturity of Preservation 2000 bonds. Future debt service reflects the State s policy of level debt structure with the exception of the P3 arrangements which defer and back-load required payments. Revenues available for debt service in Fiscal Year 2011 totaled $29.6 billion, $1.3 billion more than Fiscal Year However, the economic recovery has been slower and more protracted than originally anticipated, resulting in reduced revenue forecasts by the last three Revenue Estimating Conferences. Revenue collections are still projected to increase, but with more modest year-overyear growth of $500 million and $900 million in Fiscal Years 2012 and 2013, respectively. The Revenue Estimating Conference will meet in January 2012 to update and revise revenue forecasts. Reserves are critical and provide the financial flexibility necessary to address financial uncertainties. In Fiscal Year 2011, General Fund Reserves declined to $1.0 billion or 4.6% of general fund revenues at June 30, 2011, slightly less than the 5% considered adequate by rating agency criteria. General Fund Reserves are projected to increase during the current fiscal year to $1.4 billion or 6.2% of general fund revenues; however, any use of reserves to fund projected deficits will reduce the projected year-end balance. Trust fund balances are also a form of reserves that the State has used to balance the general fund budget during periods of revenue weakness. Including trust fund balances augments the General Fund Reserve and better reflects the State s level of financial flexibility. Total reserves, including trust fund balances, were considered strong by rating agencies at $3.4 billion or 15% of general revenues at June 30, Trust fund balances are expected to decrease during the current fiscal year, reducing total reserves to a projected $3.0 billion at June 30, Page 26
State Debt Management Update. Office of the State Treasurer January 8, 2014
 State Debt Management Update Office of the State Treasurer January 8, 2014 0 0 Highlights from 2013, Concerns and Priorities for 2014 2 0 Highlights from 2013 2013 Session: Worked with Committees to review
GENERA L OBLIGATION DEBT SERVICE SUMMARY
 GENERA L OBLIGATION DEBT SERVICE SUMMARY General Obligation debt is secured by and payable from the receipts of annual ad valorem taxes, within legal limits, on taxable property within the City. The City
FITCH RATES $1B MARYLAND GOS 'AAA'; OUTLOOK STABLE
 FITCH RATES $1B MARYLAND GOS 'AAA'; OUTLOOK STABLE Fitch Ratings-New York-26 May 2016: Fitch Ratings has assigned an 'AAA' rating to $1.036 billion in State of Maryland general obligation (GO) bonds, state
FITCH RATES METROPOLITAN WATER RECLAMATION DIST OF GREATER CHICAGO, IL GOS 'AAA'; OUTLOOK STABLE
 FITCH RATES METROPOLITAN WATER RECLAMATION DIST OF GREATER CHICAGO, IL GOS 'AAA'; OUTLOOK STABLE Fitch Ratings-New York-03 December 2014: Fitch Ratings has assigned an 'AAA' rating to the following Metropolitan
New Jersey Transportation Trust Fund Authority Fiscal Year 2016 Financial Plan
 New Jersey Transportation Trust Fund Authority Fiscal Year 2016 Financial Plan Plan for Financing Anticipated NJDOT/NJT Capital Program Outlays for Fiscal Year 2016 NEW JERSEY TRANSPORTATION TRUST FUND
T H E C A B I N E T S T A T E O F F L O R I D A. Representing: DEPARTMENT OF VETERANS AFFAIRS GULF REGIONAL AIRSPACE STRATEGIC INITIATIVE
 T H E C A B I N E T S T A T E O F F L O R I D A Representing: DEPARTMENT OF VETERANS AFFAIRS GULF REGIONAL AIRSPACE STRATEGIC INITIATIVE BOARD OF TRUSTEES DEPARTMENT OF HIGHWAY SAFETY AND MOTOR VEHICLES
2008/09 Financial Management Strategy
 2008/09 Financial Management Strategy Report on outcomes For more information visit www.manitoba.ca R e p o r t o n O u t c o m e s / 1 Report on Outcomes Budget 2008 set out the second Financial Management
City of Philadelphia Debt Management Policy December 2009
 City of Philadelphia Debt Management Policy December 2009 I. INTRODUCTION While the issuance of debt is often an appropriate method of financing capital projects and major equipment acquisition, it needs
State of North Carolina
 State of North Carolina Debt Affordability Study February 1, 2015 Debt Affordability Advisory Committee Department of State Treasurer 325 North Salisbury Street Raleigh, NC 27603-1385 Phone: 919-508-5176
COMMONWEALTH OF PUERTO RICO QUARTERLY REPORT DATED JULY 17, 2014 00163411; 1
 COMMONWEALTH OF PUERTO RICO QUARTERLY REPORT DATED JULY 17, 2014 00163411; 1 Table of Contents Page No. INTRODUCTION... 1 RISK FACTORS... 3 RECENT DEVELOPMENTS... 18 FISCAL CONDITION... 25 THE ECONOMY...
Appendix. Debt Position and Debt Management
 Appendix Debt Position and Debt Management BUDGET '97 BUILDING ALBERTA TOGETHER Table of Contents Debt Position and Debt Management... 349 The Consolidated Balance Sheet and Net Debt... 350 Liabilities...
State of Arkansas Construction Assistance Revolving Loan Fund Program
 Independent Auditor s Report and Financial Statements Contents Independent Auditor s Report... 1 Management s Discussion and Analysis... 4 Financial Statements Statements of Net Position... 9 Statements
State of North Carolina
 State of North Carolina Debt Affordability Study January 25, 2016 Debt Affordability Advisory Committee Department of State Treasurer 3200 Atlantic Avenue Raleigh, NC 27604 Phone: 919-814-3807 STATE OF
June, 2015 DEBT MANAGEMENT PLAN COUNTY OF ELKO, NEVADA
 June, 2015 DEBT MANAGEMENT PLAN COUNTY OF ELKO, NEVADA Introduction The County of Elko (the "County") has a Capital Improvement Plan (CIP) which is a multi-year planning document that identifies and prioritizes
Debt Management. Debt Management
 Debt Management Capital Expenditures vs. Current Expenditures Local government expenditures can be broadly categorized as either current or capital. Generally, current expenditures are related to ongoing
September 21, 2015 Investor Conference Call. Bi-Monthly Credit Review
 September 21, 2015 Investor Conference Call Bi-Monthly Credit Review Disclaimer This presentation has been prepared by the Commonwealth of Massachusetts to provide summary information relative to the general
Province of Newfoundland and Labrador. Public Accounts Volume I Consolidated Summary Financial Statements
 Province of Newfoundland and Labrador Public Accounts Volume I Consolidated Summary Financial Statements FOR THE YEAR ENDED MARCH 31, 2011 Province of Newfoundland and Labrador Public Accounts Volume I
CITY OF MIAMI, FLORIDA DEBT MANAGEMENT PROCEDURES MANUAL
 CITY OF MIAMI, FLORIDA DEBT MANAGEMENT PROCEDURES MANUAL OVERVIEW This Procedures Manual has been drafted to assist in the development of goals, procedures for implementation and standards for reporting
LONG TERM OBLIGATION (LTO) FINANCING POLICY A Strategy for the Acquisition or Replacement of City Assets
 FINANCING POLICY A Strategy for the Acquisition or Replacement of City Assets") PURPOSE CITY OF LINDSBORG LONG TERM OBLIGATION (LTO) FINANCING POLICY A Strategy for the Acquisition or Replacement of City Assets The Long-Term Obligation Financing (LTO) Policy Statement sets forth comprehensive
PURPOSE CITY OF LINDSBORG LONG TERM OBLIGATION (LTO) FINANCING POLICY A Strategy for the Acquisition or Replacement of City Assets The Long-Term Obligation Financing (LTO) Policy Statement sets forth comprehensive
City of Missoula Debt Management. Major Bond Issues. Outstanding Debt DEBT MANAGEMENT. City of Missoula FY 2015 Annual Budget Page I - 1
 City of Missoula Debt Management Debt in a governmental entity is an effective financial management tool. Active debt management provides fiscal advantages to the City of Missoula and its citizens. Debt
State of Arkansas Safe Drinking Water Revolving Loan Fund Program
 Accountants Report and Financial Statements June 30, 2007 and 2006 June 30, 2007 and 2006 Contents Independent Accountants Report on Financial Statements and Supplementary Information... 1 Management s
State of Arkansas Construction Assistance Revolving Loan Fund Program
 Auditor s Report and Financial Statements Contents Independent Auditor s Report... 1 Management s Discussion and Analysis... 4 Financial Statements Statements of Net Position... 9 Statements of Revenues,
UNITED STATES SECURITIES AND EXCHANGE COMMISSION WASHINGTON, D.C. 20549 FORM 10-Q
 UNITED STATES SECURITIES AND EXCHANGE COMMISSION WASHINGTON, D.C. 20549 FORM 10-Q (Mark One) QUARTERLY REPORT PURSUANT TO SECTION 13 OR 15(d) OF THE SECURITIES EXCHANGE ACT OF 1934 For the quarterly period
State Cashflow Management
 Informational Paper 77 State Cashflow Management Wisconsin Legislative Fiscal Bureau January, 2009 State Cashflow Management Prepared by Dave Loppnow Wisconsin Legislative Fiscal Bureau One East Main,
Finance Work Program Budget. FTC Workshop
 Finance Work Program Budget FTC Workshop March 2010 Today s Presentation Basic Concepts Funding Sources Estimating Resources Finance Plan/Cash Forecast Cash Flow vs. Commitment Funding Priorities Work
SECTION 7 DEBT MANAGEMENT POLICY LAS VEGAS VALLEY WATER DISTRICT FISCAL YEAR 2015-16 OPERATING AND CAPITAL BUDGET
 SECTION 7 DEBT MANAGEMENT POLICY LAS VEGAS VALLEY WATER DISTRICT FISCAL YEAR 2015-16 OPERATING AND CAPITAL BUDGET In Accordance With NRS 350.013 June 30, 2015 7-1 Table of Contents Introduction... 7-3
DEBT MANAGEMENT POLICY ANNUAL UPDATE HUMBOLDT COUNTY, NEVADA
 DEBT MANAGEMENT POLICY ANNUAL UPDATE HUMBOLDT COUNTY, NEVADA July, 2015 TABLE OF CONTENTS I. INTRODUCTION 1 II. ABILITY TO AFFORD EXISTING GENERAL OBLIGATION DEBT, AUTHORIZED FUTURE GENERAL OBLIGATION
Community Unit School District 220 4:40 Page 1 of 5
 Page 1 of 5 DEBT MANAGEMENT The policies set forth in this Debt Management Policy (the Policy ) have been developed to provide guidelines relative to the issuance, sale, statutory compliance, and investment
Virginia State University Policies Manual. Title: Debt Management Guidelines and Procedures Policy: 1500
 Purpose a. To provide guidance to Virginia State University in undertaking long-term debt obligations benefiting the University. b. To provide a structured framework for the issuance of long-term debt
Debt Management Policy
 Debt Management Policy Introduction One of the keys to sound financial management is the development of a debt policy. This need is recognized by bond rating agencies, and development of a debt policy
March 14, 2014. RE: Regional Wastewater Reclamation Department Fiscal Year 2014 Financial Plan
 REGIONAL WASTEWATER RECLAMATION ADVISORY COMMITTEE 201 NORTH STONE AVENUE TUCSON, ARIZONA 857011207 March 14, 2014 The Honorable Chair and Members Pima County Board of Supervisors 130 West Congress Street,
TOWN OF PROSPECT, CONNECTICUT
 BASIC FINANCIAL STATEMENTS AND SUPPLEMENTARY INFORMATION FOR THE YEAR ENDED JUNE 30, 2015 ANNUAL REPORT FOR THE YEAR ENDED JUNE 30, 2015 Table of Contents Independent Auditor's Report 4 Management's Discussion
REPORT OF THE MAINE STATE REVENUE FORECASTING COMMITTEE
 REPORT OF THE MAINE STATE REVENUE FORECASTING COMMITTEE December 2013 Michael Allen, Chair Associate Commissioner for Tax Policy James Breece University of Maine System Melissa Gott State Budget Officer
Mecklenburg County, North Carolina Debt Policy
 Mecklenburg County, North Carolina Debt Policy Introduction Mecklenburg County recognizes that one of the keys to sound financial management is a debt policy. These benefits are recognized by bond rating
MML Bay State Life Insurance Company Management s Discussion and Analysis Of the 2005 Financial Condition and Results of Operations
 MML Bay State Life Insurance Company Management s Discussion and Analysis Of the 2005 Financial Condition and Results of Operations General Management s Discussion and Analysis of Financial Condition and
b. provide guidelines to control the overall debt management process so that all liabilities are managed in accordance with stated objectives;
 Policy 6.085 Debt Management 1. Purpose The purpose of this Policy is to establish guidance for the issuance and management of the debt of the School District. Such debt includes short-term and long-term
FY 2017 EXECUTIVE SUPPLEMENTAL BUDGET MULTI-YEAR FINANCIAL PLAN
 28th Legislature 2016 A CASE OF INFLATED REVENUES AND UNDERESTIMATED EXPENDITURES This report provides a comprehensive review of the FY 2017 Executive Supplemental Budget: Multi-Year Financial Summary
Overview of State Debt. Department of Legislative Services Office of Policy Analysis Annapolis, Maryland
 Overview of State Debt Department of Legislative Services Office of Policy Analysis Annapolis, Maryland December 16, 2011 What Are Bonds? Bonds are the most common, but not the only, form of debt. Capital
Strategy. Appendix A Debt. History and Background. Purpose of Review
 Appendix A Debt Strategy History and Background During the late I 980s and the early I 990s, the City of Winnipeg incurred significant debt for capital purposes. In the mid-i 990s, the cost to service
ADMINISTRATIVE REGULATION AR: 6.03 DATE APPROVED September 10, 2002 ORIGINATING DEPARTMENT:
 ADMINISTRATIVE REGULATION AR: 6.03 DATE APPROVED September 10, 2002 SUBJECT: ORIGINATING DEPARTMENT: Debt Management Policy Office of Management & Budget Page 1 of 8 I. PURPOSE: The County recognizes the
City of San Diego General Fund Reserve Benchmark and Review
 OFFICE OF THE INDEPENDENT BUDGET ANALYST REPORT Date Issued: September 20, 2012 IBA Report Number: 12-37 Budget and Finance Committee Date: September 26, 2012 Item Number: 5 City of San Diego General Fund
New Issue: MOODY'S: CITY OF SAN DIEGO'S SUBORDINATED WATER REVENUE REFUNDING BONDS RATED Aa3
 New Issue: MOODY'S: CITY OF SAN DIEGO'S SUBORDINATED WATER REVENUE REFUNDING BONDS RATED Aa3 Global Credit Research - 27 Mar 2012 SENIOR LIEN BONDS' Aa2 RATING AFFIRMED SAN DIEGO PUBLIC FACILITIES FINANCING
CITY OF ALEXANDRIA, VIRGINIA FINANCIAL MANAGEMENT SELF-ASSESSMENT USING STANDARD AND POORS RATING CRITERIA. June 2009
 CITY OF ALEXANDRIA, VIRGINIA FINANCIAL MANAGEMENT SELF-ASSESSMENT USING STANDARD AND POORS RATING CRITERIA June 2009 Revenue and Expenditure Assumptions Are the organization s financial assumptions and
INDIANA BOND BANK. (A Component Unit of the State of Indiana)
") Financial Statements with Supplementary Information (A COMPONENT UNIT OF THE STATE OF INDIANA) Table of Contents Independent Auditors Report 1 Page(s) Management s Discussion and Analysis 2 7 Financial
Financial Statements with Supplementary Information (A COMPONENT UNIT OF THE STATE OF INDIANA) Table of Contents Independent Auditors Report 1 Page(s) Management s Discussion and Analysis 2 7 Financial
University of Vermont Debt Policy
 University of Vermont As Adopted by the Board of Trustees September 2004, revised November 2005, Revised, November 2006, Revised, December 2007, Reaffirmed, December 2008, Revised, October 2009 Revised,
Fitch stated that Nationwide Life s risk-adjusted capitalization is considered strong relative to its peers.
 Rating Action: Nationwide (Affirmed) On August 25, Fitch Ratings affirmed the A (Strong) insurer financial strength ratings of Nationwide Life Insurance Co. (Nationwide Life). The rating outlook is stable.
Table of Contents. Interest Expense and Income 185.32 Why do financing accounts borrow from Treasury? 185.33 Why do financing accounts earn interest?
 SECTION 185 FEDERAL CREDIT Table of Contents General Information 185.1 Does this section apply to me? 185.2 What background information must I know? 185.3 What special terms must I know? 185.4 Are there
PART II STATE DEBT SERVICE
 PART II STATE DEBT SERVICE STATE DEBT SERVICE AND FINANCING AGREEMENT PAYMENTS DEBT SERVICE APPROPRIATIONS FOR 2006-07 The 2006-07 recommended debt service appropriations meet all of the State s potential
Debt Reduction Plan 2005 Debt Reduction and the Offshore Offset Agreement
 Debt Reduction Plan 2005 Debt Reduction and the Offshore Offset Agreement Honourable Peter Christie Minister of Finance April 28, 2005 Contents Summary..................................1 Introduction...............................3
Many directors of public enterprises
 Management & Careers The Finance Director s Role in Helping Public Enterprises Look their Best By Bryan A. Mantz Finance directors of public enterprises face special challenges; developing expertise in
Public Education Capital Outlay
 106 N. Bronough Street Tallahassee, FL 32301 www.floridataxwatch.org Phone: (850) 222-5052 Fax: (850) 222-7476 Florida TaxWatch Center for Educational Performance and Accountability Public Education Capital
Westmoreland Reports First Quarter 2016 Results and Affirms Full-year Guidance
 News Release Westmoreland Reports First Quarter 2016 Results and Affirms Full-year Guidance Englewood, CO May 10, 2016 - Westmoreland Coal Company (NasdaqGM:WLB) today reported financial results for the
STATE OF CONNECTICUT CLEAN WATER FUND - DRINKING WATER FEDERAL REVOLVING LOAN ACCOUNT (STATE REVOLVING FUND)
") STATE OF CONNECTICUT CLEAN WATER FUND - DRINKING WATER FEDERAL REVOLVING LOAN ACCOUNT (STATE REVOLVING FUND) AUDIT REPORTS AND SCHEDULES IN ACCORDANCE WITH OMB CIRCULAR A-133 June 30, 2014 and 2013 STATE
STATE OF CONNECTICUT CLEAN WATER FUND - DRINKING WATER FEDERAL REVOLVING LOAN ACCOUNT (STATE REVOLVING FUND) AUDIT REPORTS AND SCHEDULES IN ACCORDANCE WITH OMB CIRCULAR A-133 June 30, 2014 and 2013 STATE
Operating Budget Data
 X00A00 Public Debt REVISED Operating Budget Data ($ in Thousands) FY 13 FY 14 FY 15 FY 14-15 % Change Actual Working Allowance Change Prior Year General Fund $0 $83,000 $195,000 $112,000 134.9% Adjusted
General Obligation Limited Tax
 New Issue: Moody's assigns Baa1 rating to the City of Mansfield's (OH) $2.3 million Various Purpose Refunding Bonds (General Obligation - Limited Tax), Series 2013; negative outlook removed Global Credit
City and County of Denver Financial Sustainability and Benchmarking Project Enterprise Solutions Team
 City and County of Denver Financial Sustainability and Benchmarking Project Enterprise Solutions Team Nicole Archambeau Stephen Bandrowsky Conor Hess Dylan Proietti Danni Yan EXECUTIVE SUMMARY The following
Fiscal Year 2014 Report on Debt Management and Notice of Debt Issuances to the Public Finance Management Board. September 2015
 Fiscal Year 2014 Report on Debt Management and Notice of Debt Issuances to the Public Finance Management Board September 2015 State of Rhode Island And Providence Plantations OFFICE OF THE GENERAL TREASURER
City of Mt. Angel. Comprehensive Financial Management Policies
 City of Mt. Angel Comprehensive Financial Management Policies May 2014 Table of Contents Section Description Page I. Purpose... 3 II. Objectives... 3 III. Management of Fiscal Policy... 4 IV. Accounting,
CITY OF AURORA, ILLINOIS POLICE PENSION FUND ANNUAL FINANCIAL REPORT. For the Year Ended December 31, 2014
 ANNUAL FINANCIAL REPORT For the Year Ended December 31, 2014 TABLE OF CONTENTS Page(s) INDEPENDENT AUDITOR S REPORT... 3-4 MANAGEMENT S DISCUSSION AND ANALYSIS... MD&A 1-5 BASIC FINANCIAL STATEMENTS Statement
Governor Nathan Deal
 DEBT MANAGEMENT PLAN Fiscal Year 2015 - FY 2019 Governor Nathan Deal STATE OF GEORGIA DEBT MANAGEMENT PLAN FY 2015 FY 2019 Georgia State Financing and Investment Commission Governor Nathan Deal, Chairman
Determination of Revenue Requirements for Municipal Utilities
 Determination of Revenue Requirements for Municipal Utilities Mark Beauchamp, CPA President Utility Financial Solutions Determination of Revenue Requirements 1. Cash Reserve Policy 2. Debt Coverage Ratio
Florida Hurricane Catastrophe Fund. Annual Report of Aggregate Net Probable Maximum Losses, Financing Options, and Potential Assessments
 Florida Hurricane Catastrophe Fund Annual Report of Aggregate Net Probable Maximum Losses, Financing Options, and Potential Assessments Table of Contents Purpose and Scope 3 Introduction 3 Aggregate Net
Excluding minimum taxes paid by S-Corporations, which are not part of the corporate kicker base. 2
 REVENUE OUTLOOK Revenue Summary Oregon s General Fund revenue growth slowed at the end of fiscal year 2015, as collections of personal income taxes dried up during May and June. Income taxes withheld out
City of Philadelphia Debt Management Policy August 2015
 City of Philadelphia Debt Management Policy August 2015 I. INTRODUCTION While the issuance of debt is often an appropriate method of financing capital projects and major equipment acquisition, it needs
ACTION ITEM EXECUTIVE SUMMARY
 F6 Office of the President TO THE MEMBERS OF THE COMMITTEE OF FINANCE: For Meeting of ACTION ITEM AUTHORIZATION TO RETIRE AND REFUND EXISTING TAX-EXEMPT DEBT OBLIGATIONS FOR THE CHILDREN S HOSPITAL OF
January 2015 State of Alaska State Bond Committee Debt Management Policies And State Debt Capacity
 January 2015 State of Alaska State Bond Committee Debt Management Policies And State Debt Capacity Page 1 of 26 TABLE OF CONTENTS Executive Summary Page 3 Introduction Page 5 Discussion of Credit Ratings
DEBT MANAGEMENT. Overview of Debt Management. Gallatin County Debt Management. Approved Bond Issues
 373 Gallatin County Debt Management Debt, in a governmental entity, is an effective financial management tool. Active debt management provides fiscal advantages to the County and its citizens. Debt can
Waste Management Announces Second Quarter Earnings
 FOR IMMEDIATE RELEASE Waste Management Announces Second Quarter Earnings Collection and Disposal Income from Operations Grows 3.4% HOUSTON July 26, 2012 Waste Management, Inc. (NYSE: WM) today announced
Arkansas Development Finance Authority, a Component Unit of the State of Arkansas
 Arkansas Development Finance Authority, a Component Unit of the State of Arkansas Combined Financial Statements and Additional Information for the Year Ended June 30, 2000, and Independent Auditors Report
Today s bond market is riskier and more volatile than in several generations. As
 Fixed Income Approach 2014 Volume 1 Executive Summary Today s bond market is riskier and more volatile than in several generations. As interest rates rise so does the anxiety of fixed income investors
Congressional Budget Office s Preliminary Analysis of President Obama s Fiscal Year 2012 Budget
 Congressional Budget Office s Preliminary Analysis of President Obama s Fiscal Year 2012 Budget SUMMARY The Congressional Budget Office s (CBO) Preliminary Analysis of the President s FY 2012 Budget released
DEUTSCHE ASSET & WEALTH MANAGEMENT REAL ESTATE OUTLOOK
 Research Report DEUTSCHE ASSET & WEALTH MANAGEMENT REAL ESTATE OUTLOOK Second Quarter 2013 Economic Outlook Business and consumer spending to drive recovery Quantitative easing beginning its expected unwinding
GUIDE TO INDICATORS OF FINANCIAL CONDITION
 GUIDE TO INDICATORS OF FINANCIAL CONDITION Janet Griesel Extension Associate John Leatherman Director, Associate Professor Office of Local Government Department of Agricultural Economics K-State Research
Bond Market Insights October 10, 2014
 Bond Market Insights October 10, 2014 by John Simms, CFA and Jerry Wiesner, CFA General Bond Market Treasury yields rose in September as prices fell. Yields in the belly of the curve (5- to 7-year maturities)
Be it enacted by the General Assembly of the State of Colorado:
 NOTE: This bill has been prepared for the signature of the appropriate legislative officers and the Governor. To determine whether the Governor has signed the bill or taken other action on it, please consult
SKAGIT COUNTY DEBT POLICY. Page 1 of 12
 SKAGIT COUNTY DEBT POLICY Page 1 of 12 SKAGIT COUNTY DEBT POLICY INDEX Page I. Roles and Responsibilities 3 II. Debt and Capital Planning 3-4 III. Credit Objectives 4-5 IV. Purpose, Type and Use of Debt
The New Florida Insurance Bill SB 130
 BILL: SB 130 The Florida Senate BILL ANALYSIS AND FISCAL IMPACT STATEMENT (This document is based on the provisions contained in the legislation as of the latest date listed below.) Prepared By: The Professional
University of Victoria Long Term Disability Plan for Faculty and Administrative and Academic Professional Staff ANNUAL REPORT
 University of Victoria Long Term Disability Plan for Faculty and Administrative and Academic Professional Staff ANNUAL REPORT YEAR ENDED MARCH 31, 2013 Contents Letter from the Chair 1 Governance and Service
Govemmel1t Development Bank for Puerto Rico (A Component Unit of the Commonwealth of Puerto Rico)
") Govemmel1t Development Bank for Puerto Rico (A Component Unit of the Commonwealth of Puerto Rico) Basic Financial Statements and Required Supplementary Information as of and for the Year Ended June 30,
Govemmel1t Development Bank for Puerto Rico (A Component Unit of the Commonwealth of Puerto Rico) Basic Financial Statements and Required Supplementary Information as of and for the Year Ended June 30,
ANNUAL DEBT GUIDE. Palm Beach County, Florida
 ANNUAL DEBT GUIDE Palm Beach County, Florida R EP A R ED B Y TH E C L ERK & C O MP TRO L L ER S O F F IC E F O R T H E F ISC AL Y EA R E N D ED S EP T EMB E R 30, 2009 PPREPARED BY THE CLERK & COMPTROLLER
DEBT MANAGEMENT. Capital vs. Current Expenditures
 DEBT MANAGEMENT Capital vs. Current Expenditures Local government expenditures can be broadly categorized as either current or capital. Generally, current expenditures are related to on-going operations
Puerto Rico s Economic and Fiscal Crisis
 Puerto Rico s Economic and Fiscal Crisis The Economic Situation is Challenging Puerto Rico has experienced a sharper recession than the rest of the United States, and the economy continues to contract.
FOR IMMEDIATE RELEASE November 7, 2013 MEDIA CONTACT: Lisa Gagnon 703-903-3385 INVESTOR CONTACT: Robin Phillips 571-382-4732
 FOR IMMEDIATE RELEASE MEDIA CONTACT: Lisa Gagnon 703-903-3385 INVESTOR CONTACT: Robin Phillips 571-382-4732 FREDDIE MAC REPORTS PRE-TAX INCOME OF $6.5 BILLION FOR THIRD QUARTER 2013 Release of Valuation
State Notes TOPICS OF LEGISLATIVE INTEREST Summer 2010
 Retirement Incentive and Pension Reform of the Michigan Public School Employees' Retirement System By Kathryn Summers, Chief Analyst Introduction On May 19, 2010, Governor Granholm signed into law Senate
Actual Nonmajor Special Revenue Funds --------------------------------------------------------- 34
 CONTENTS: FLORIDA DEPARTMENT OF EDUCATION SUPERINTENDENT S ANNUAL FINANCIAL REPORT (ESE 145) DISTRICT SCHOOL BOARD OF SUMTER COUNTY For the Fiscal Year Ended June 30, 2015 Return completed form to: Florida
WEST BASIN MUNICIPAL WATER DISTRICT Debt Management Policy Administrative Code Exhibit G January 2015
 1.0 Purpose The purpose of this Debt Management Policy ( Policy ) is to establish parameters and provide guidance as to the issuance, management, continuing evaluation of and reporting on all debt obligations.
Actuarial Report. on the CANADA STUDENT LOANS PROGRAM
 Actuarial Report on the CANADA STUDENT LOANS PROGRAM as at 31 July 2001 Office of the Superintendent of Financial Institutions Office of the Chief Actuary Bureau du surintendant des institutions financières
Current Ratio - General Fund
 Current Ratio - General Fund Are General Fund expenses able to be paid as they come due? Description: This measure is designed to focus on the liquidity position of the County s General Fund that has arisen
The 2016-17 Budget: The Governor s Proposition 2 Debt Proposal
 The 2016-17 Budget: The Governor s Proposition 2 Debt Proposal MAC TAYLOR LEGISLATIVE ANALYST FEBRUARY 2016 Summary Proposition 2 requires the state to pay down a minimum annual amount of state debts.
The Puerto Rico Municipal Borrowers Guide
 The Puerto Rico Municipal Borrowers Guide May 6, 2015 Information in this guide has been provided by Fidelity Capital Markets. This brief summary is for informational purposes only and is not intended
INDUSTRIAL-ALLIANCE LIFE INSURANCE COMPANY. FIRST QUARTER 2000 Consolidated Financial Statements (Non audited)
") INDUSTRIAL-ALLIANCE LIFE INSURANCE COMPANY FIRST QUARTER 2000 Consolidated Financial Statements (Non audited) March 31,2000 TABLE OF CONTENTS CONSOLIDATED INCOME 2 CONSOLIDATED CONTINUITY OF EQUITY 3 CONSOLIDATED
INDUSTRIAL-ALLIANCE LIFE INSURANCE COMPANY FIRST QUARTER 2000 Consolidated Financial Statements (Non audited) March 31,2000 TABLE OF CONTENTS CONSOLIDATED INCOME 2 CONSOLIDATED CONTINUITY OF EQUITY 3 CONSOLIDATED
DEBT MANAGEMENT POLICY
 Introduction New Hanover County recognizes that a formal debt policy is essential to effective financial management. Adherence to a debt management policy signals to rating agencies and the capital markets
FAU Finance Corporation (A component unit of Florida Atlantic University) Financial Report For the Year Ended June 30, 2014
 Financial Report For the Year Ended June 30, 2014") (A component unit of Florida Atlantic University) Financial Report For the Year Ended Contents Independent Auditor s Report on the Financial Statements 1 2 Management s Discussion and Analysis (unaudited)
(A component unit of Florida Atlantic University) Financial Report For the Year Ended Contents Independent Auditor s Report on the Financial Statements 1 2 Management s Discussion and Analysis (unaudited)
Operating Budget Data
 X00A00 Public Debt Operating Budget Data ($ in Thousands) FY 12 FY 13 FY 14 FY 13-14 % Change Actual Working Allowance Change Prior Year General Fund $0 $0 $101,000 $101,000 Adjusted General Fund $0 $0
FDIC. October 2, 2014. The Board of Directors MEMORANDUM TO: Diane Ellis Director FROM: Division of Insurance and Research
 m FDIC Federal Deposit Insurance Corporation 55017th Street NW, Washington, D.C. 20429-9990 Division of Insurance and Research October 2, 2014 MEMORANDUM TO: FROM: SUBJECT: The Board of Directors Diane
Each year, millions of Californians pursue degrees and certificates or enroll in courses
 Higher Education Each year, millions of Californians pursue degrees and certificates or enroll in courses to improve their knowledge and skills at the state s higher education institutions. More are connected
University of Kentucky
 University of Kentucky Debt Policy Purpose To fulfill its mission, the University of Kentucky must make ongoing strategic capital investments in academic, student life, healthcare, and other plant facilities
FINANCIAL REVIEW. 18 Selected Financial Data 20 Management s Discussion and Analysis of Financial Condition and Results of Operations
 2012 FINANCIAL REVIEW 18 Selected Financial Data 20 Management s Discussion and Analysis of Financial Condition and Results of Operations 82 Quantitative and Qualitative Disclosures About Market Risk 88
Other Postemployment Benefits: A Plain-Language Summary of GASB Statements No. 43 and No. 45
 Governmental Accounting Standards Board Other Postemployment Benefits: A Plain-Language Summary of GASB Statements No. 43 and No. 45 Please note: This document, prepared by the GASB staff, has not been
GASB s New Pension Standards
 Table of Contents BACKGROUND & OVERVIEW... 3 ACCOUNTING OVERVIEW... 3 SCOPE... 4 KEY PROVISIONS... 4 OVERVIEW... 4 TYPES OF BENEFIT PLANS & BENEFIT PLAN ARRANGEMENTS... 5 ACCOUNTING CHANGES... 6 CHANGES