THE LANDSCAPE OF RECESSION: UNEMPLOYMENT AND SAFETY NET SERVICES ACROSS URBAN AND SUBURBAN AMERICA Elizabeth Kneebone and Emily Garr
|
|
|
- Avis Brooks
- 8 years ago
- Views:
Transcription
1 THE LANDSCAPE OF RECESSION: UNEMPLOYMENT AND SAFETY NET SERVICES ACROSS URBAN AND SUBURBAN AMERICA Elizabeth Kneebone and Emily Garr March 2010 Findings An analysis of unemployment, initial Unemployment Insurance claims, and receipt of Supplementary Nutritional Assistance Program (SNAP, formerly known as food stamps) benefits in urban and suburban communities over the course of the Great Recession reveals that: Between December 2007 and December 2009, city and suburban unemployment rates in large metro areas increased by roughly the same degree (5.1 versus 4.8 percentage points, respectively). By December 2009, the gap between city and suburban unemployment rates was one percentage point (10.3 percent versus 9.3 percent) smaller than 24 months after the start of the first recession of the decade (1.7 percentage points) and the downturn in the early 1990s (2.2 percentage points). Western metro areas exhibited the greatest increases in city and suburban unemployment rates 5.8 and 5.6 percentage points over the two-year period ending in December of Increases in unemployment rates tilted more toward primary cities in Northeastern metro areas (a 5.3 percentage-point increase versus 4.2 percentage points in the suburbs), while suburbs saw slightly larger increases in the South (5.0 versus 4.4 percentage points). Initial Unemployment Insurance (UI) claims increased considerably between December 2007 and December 2009 in urban and suburban areas alike. The largest increases in requests for UI occurred in the first year of the downturn led by lower-density suburbs with new claims beginning to taper off between December of 2008 and SNAP receipt increased steeply and steadily between January 2008 and July 2009 across both urban and suburban counties. Urban counties remain home to the largest number of SNAP recipients, though suburban counties saw enrollment increase at a slightly faster pace during the downturn 36.1 percent compared to 29.4 percent in urban counties. Even as signs point to a tentative economic recovery for the nation, metropolitan areas throughout the country continue to struggle with high unemployment. Within these regions, the negative effects of this downturn as measured by changes in unemployment and demand for safety net services have been shared across cities and suburbs alike. Standardizing sub-state data collection and reporting across programs would better enable policymakers and service providers to effectively track indicators of recovery and need in the nation s largest labor markets.
. By December 2009, the gap between city and suburban unemployment rates was one percentage point (10.3 percent versus 9.")
2 Introduction Two years after the country entered the Great Recession, there are signs the national economy has slowly begun to recover. Thus far recovery has meant the return of economic growth, but not the return of jobs. And just as some communities have felt the downturn more than others, recovery has not and will not be shared equally across the nation s diverse metropolitan economies. 1 Within metropolitan areas, many communities continue to struggle with high unemployment and increasing economic and fiscal challenges, while at the same time poverty and the need for emergency and support services continue to rise. 2 Even under the best case scenario of a sustained and robust recovery, cities and suburbs throughout the nation will be dealing with the social and economic aftermath of such a deep and lengthy recession for some time to come. In light of these challenges, and in an effort to inform public- and private-sector responses to the recession and recovery within the nation s largest metropolitan areas, Landscape of Recession tracks leading indicators of poverty and need across cities and their surrounding suburban communities. This second edition analyzes unemployment trends by community type between December 2007 (the official start of the downturn) and December It also assesses new bouts of unemployment over the same time period by analyzing trends in initial Unemployment Insurance (UI) claims, and tracks participation in the Supplemental Nutrition Assistance Program (SNAP, also known as food stamps) between January 2008 and July Methodology The Landscape of Recession analyzes three key indicators across different metropolitan community types. Note that the community type analysis for Unemployment Insurance claims and the Supplemental Nutrition Assistance Program has changed since the July 2009 edition. Unemployment Levels and Rates Monthly data on unemployment come from the Local Area Unemployment Statistics program at the U.S. Bureau of Labor Statistics. The December 2009 estimates represent the most recent local-level data available at the time of publication. Note that monthly data at the city and county level are not seasonally adjusted. For comparisons over time, this analysis uses the U.S. Office of Management and Budget s 2007 definitions of metropolitan statistical areas across all years of data. Of the 100 largest metro areas based on revised 2007 population estimates, 99 are included in this analysis. (Honolulu is excluded because BLS does not report city data separate from the county.) Within these 99 metro areas, primary cities include the first city named in the official Office of Management and Budget metropolitan statistical area (MSA) name, and any other city in the MSA name that has a population of 100,000 or more. Using these criteria, there are 136 primary cities in the top 99 metro areas. Suburbs represent the remainder of the MSA outside the primary city or cities. In addition, suburban counties are also categorized into suburban types high density, mature, emerging, and exurban based on the share of the county (net of the primary city or cities) that is urbanized according to Census Initial Unemployment Insurance Claims We collected monthly county-level data on Unemployment Insurance (UI) claims through telephone interviews with state agencies. The number of claims reported represents any notice of unemployment filed (1) to request a determination of entitlement to and eligibility for compensation or (2) to begin a second or subsequent period of eligibility within a benefit year or 2

3 period of eligibility. These requests are categorized as initial claims. As such, they represent demand for UI benefits due to new spells of unemployment. They do not, however, represent the actual number of claimants who establish eligibility and ultimately receive UI benefits. Because states use different standards for reporting UI claims by county, not all county data collected are directly comparable. Of the 100 largest metro areas, we include the 72 metro areas for which we have comparable data (see Appendix B for a complete list). Because we cannot separate primary cities from the county data, we designate urban counties and compare trends in those counties to their suburban counterparts. Urban counties are those that had an urbanization rate of at least 95 percent in We identify 131 urban counties in the 100 largest metro areas, such as San Francisco County, CA; Cook County, IL; and Harris County, TX. Suburban counties are identified by type higher density or lower density based on the share of the county that is urbanized according to Census Supplemental Nutrition Assistance Program Receipt Data on Supplemental Nutrition Assistance Program (SNAP) participants come from the U.S. Department of Agriculture s Food and Nutrition Service (FNS). Every six months FNS compiles state-reported data on SNAP recipients at the project area level, which is generally the county. Project areas that do not conform to county boundaries are excluded from the analysis, leaving 77 of the top 100 metro areas with comparable data (see Appendix C for a complete list). Again, because city-level data are not available, we use the same methodology described above to designate urban and suburban counties within the 77 metro areas. Findings A. Between December 2007 and December 2009, city and suburban unemployment rates in large metro areas increased by roughly the same degree (5.1 versus 4.8 percentage points, respectively). Between the onset of downturn in December 2007 and the end of 2009, the unemployed population in 99 of the largest metro areas increased by nearly 5 million workers. That increase translated into a doubling of the unemployment rate (i.e., share of people in the labor force who are unemployed) from 4.7 percent in December of 2007 to 9.6 percent in December The growth in metropolitan unemployment was shared nearly equally across cities and suburbs, more so than in the previous two downturns (Figure 1). The first year of the Great Recession saw the unemployment rate increase by 2.4 and 2.3 percentage points in cities and suburbs, respectively, while the second year brought slightly larger margins as the downturn deepened (2.8 percentage points in cities and 2.5 percentage points in suburbs). Though the gap between city and suburban unemployment rates widened slightly over the two years similar to the past two recessions the disparity was still notably narrower by the end of 2009 than in the early 2000s and 1990s. In December 2009, only one percentage point separated city and suburban unemployment rates (10.3 percent versus 9.3 percent), versus 1.7 percentage points in March 2003, and 2.2 percentage points in July This underscores not only the more similar unemployment profile of cities and suburbs at the inception of the Great Recession, but also the extent to which suburbs have borne the brunt of this downturn alongside cities. 3
.")
4 4
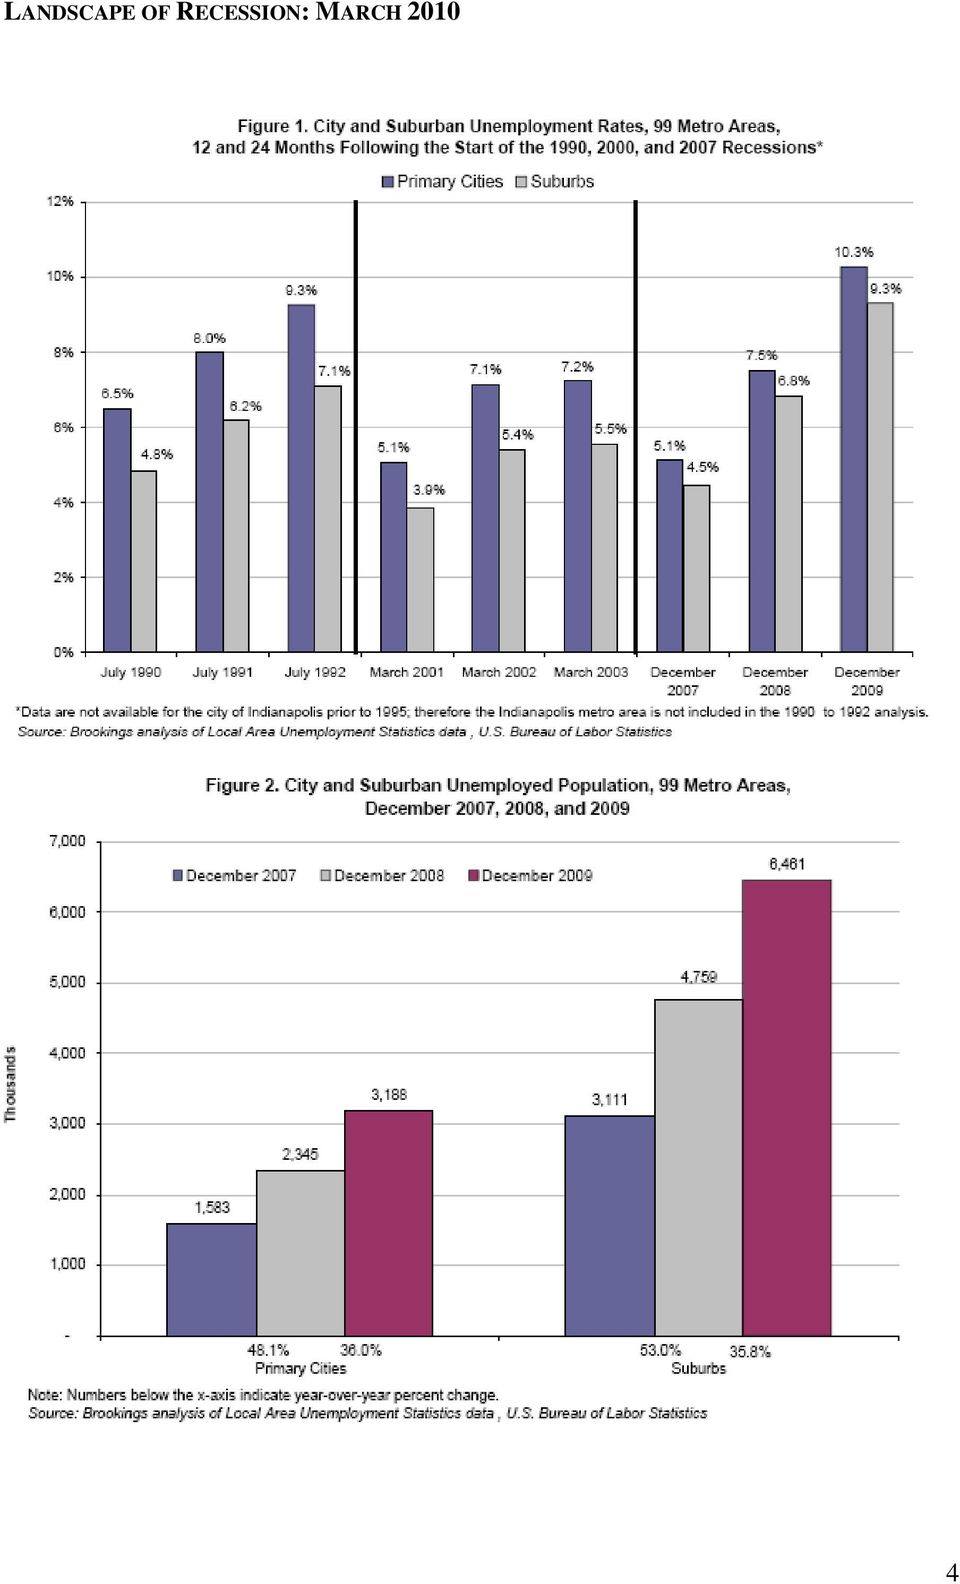
5 The shared burden of this recession is further illustrated by the growth of the unemployed population over the course of the downturn (Figure 2). Between December 2007 and 2009, suburbs slightly outpaced their primary cities for increases in the number of unemployed workers 108 percent compared to 101 percent. The disparity was largest in the first year of the recession, while the second year brought roughly equal rates of growth in the city and suburban unemployed. The faster pace of suburban unemployment growth in the first year may reflect the early onset of the downturn in more decentralized industries, like real estate and construction, and the longer-running trend of job losses in the auto manufacturing industry. In addition, the slowing of the suburban rate in the second year may also reflect the fact that fewer people are moving into lower-density exurbs and emerging suburbs, while many larger urban cores are seeing less out-migration than in recent years. 5 Disaggregating the suburban unemployment trends also reveals some variation across different types of suburbs. The greatest increases in the unemployment rate were seen in typically fartherflung mature and emerging suburbs, though the unemployment rate roughly doubled in each type of suburb between December 2007 and December 2009 (Table 1). At the same time, high density and mature suburbs experienced above-average increases in the total number of unemployed over this time period (111 and 109 percent, respectively), while lower-density emerging suburbs and exurbs lagged slightly behind. It should be noted, however, that exurbs retained the highest unemployment rate among suburban types each December. 6 5

6 B. Western metro areas exhibited the greatest increases in city and suburban unemployment rates 5.8 and 5.6 percentage points over the two-year period ending in December of Regional trends reveal the varied impact of the downturn as it deepened and spread over time (Table 2). The West saw the biggest increases in city and suburban unemployment overall (5.8 and 5.6 percentage points, respectively), but the biggest single-year increases in Western unemployment occurred in the first year of the recession, while the other regions (with the exception of Northeast suburbs) saw larger upticks in unemployment in the following year. Again, this likely reflects the early timing of the housing market collapse, which hit Sun Belt metro areas in the West and in Florida particularly hard, while unemployment increases in other regions grew as the recession deepened into the second year and spread to other industries. Western metro areas overtook the Midwest for highest primary city unemployment rates in December However, the second year of the recession brought larger unemployment hikes to Northeastern and Midwestern cities, so that by December 2009 primary cities in the Midwest and West were tied for highest unemployment rate at 11.1 percent. Among suburbs, those in Western metro areas exhibited the largest increases in unemployment rates in both years of the recession, reaching a combined 10.4 percent by December While unemployment rates increased by nearly the same magnitude in Western metro areas over the two-year period, unemployment increases in the Northeast, and to some extent in the Midwest, tilted more toward primary cities whereas suburbs saw relatively larger unemployment increases in the South. 6
 saw larger upticks in unemployment in the following year.")
7 The unemployment situation in individual metro areas bears out these regional trends (Table 3 A and B). Sun Belt metro areas in the South and West (e.g., Cape Coral, Riverside, Lakeland, Las Vegas) were among those suffering the greatest increases in city and suburban unemployment rates. Metro areas in these regions, along with Midwestern auto manufacturing metro areas, also make the list for highest unemployment rates in December 2009 in primary cities (e.g., Detroit, Stockton, Youngstown) and suburbs (e.g., Modesto, Bakersfield). In contrast, metro areas that have sustained relatively lower unemployment increases over the course of the downturn (e.g., Omaha, Oklahoma City) also make the list of cities and suburbs with the lowest unemployment rates in December
 and suburbs (e.")
8 C. Initial Unemployment Insurance (UI) claims increased considerably between December 2007 and December 2009 in urban and suburban areas alike. Unemployment Insurance is a safety net program that provides workers who have lost their jobs with a temporary source of income as they look for new employment. Initial claims for UI reflect the number of people who have entered a new spell of unemployment and have requested UI assistance, not necessarily those who have been deemed eligible to receive benefits. Therefore, these data provide a snapshot of the demand for income assistance from recently unemployed workers. In the first year of the recession, new bouts of unemployment as measured by initial UI claims rose significantly regardless of community type (Figure 3). Within 72 of the largest metro areas for which data are available, lower-density suburbs saw the greatest uptick in UI claims between December 2007 and 2008 (88 percent), while higher-density suburbs and urban counties experienced nearly equal rates of growth in UI claims that year (74 percent and 73 percent, respectively). In the second year of the recession requests for UI began to decline, though initial UI claims remained well above December 2007 levels. While lower-density suburbs experienced the largest increases in the previous year, they also exhibited the greatest drop in UI claims over the second year (-20 percent). Meanwhile, urban counties showed the smallest decline in UI claims over the second year of the recession (-11 percent). It may be a positive signal that initial UI claims declined slightly over the second year of the recession, but it bears noting what these numbers do not reflect. The UI data reported here do not include workers who have exhausted their regular UI benefits and are now receiving extended UI benefits for longer spells of unemployment. On average, workers are now unemployed for longer 8

9 compared to the start of the recession: The median number of weeks spent unemployed increased from eight (8) in December of 2007 to 20 in December 2009, and the share of workers out of a job for 27 weeks or more rose from 17 percent to 40 percent over that same time period. 7 Likewise, more workers are now considered underemployed : In December 2009, the underemployment rate in the U.S. passed 17 percent, up from 8.7 percent two years earlier. 8 Notably, part-time, and temporary workers, along with the self-employed, are not typically eligible for UI benefits, and thus may not request assistance when faced with a new bout of unemployment. It is not clear how extended bouts of unemployment and ineligibility for UI distribute across different types of metropolitan communities. Nonetheless, initial UI claims provide valuable insight into the level of demand for safety net assistance due to unemployment, but represent only one indicator of a community s unemployment situation. D. SNAP receipt increased steeply and steadily between January 2008 and July 2009 across both urban and suburban counties. The Supplemental Nutrition Assistance Program (formerly known as food stamps) helps lowincome families and individuals purchase food. Since shortly after the onset of the Great Recession, urban and suburban communities alike have seen the number of residents turning to this federal program for help climb steadily over time (Figure 4). In the 77 large metro areas for which comparable data are available, suburban counties whether higher- or lower-density saw SNAP receipt increase at a faster pace than in urban counties (roughly 36 percent versus 29 percent between January 2008 and July 2009). For urban and higher-density counties, the largest six-month increase occurred between January and July of 9

10 2009, while lower-density suburbs saw their largest period of growth slightly earlier in the recession. However, urban counties remain home to a significantly larger share of metropolitan food stamp recipients overall. These enrollment data provide a first-order indication of possible differences in participation rates across community types. SNAP is generally available to those with gross incomes equal to 130 percent of the federal poverty level. Roughly 67 percent of SNAP recipients live in urban counties, 18 percent in higher-density suburbs, and 15 percent in lower-density suburbs. The distribution of residents in the income range for SNAP is similar though not equal; according to data from the 2008 American Community Survey about 65 percent of people with incomes under 125 percent of the poverty line live in urban counties, 18 percent live in higher-density suburbs, and 17 percent live in lower-density counties. These statistics suggest at least the possibility of under-enrollment in nutrition assistance in outer suburban areas. Do they point to real differences in eligibility, different attitudes toward support services, or a gap in knowledge or accessibility in suburban communities? These remain important questions for policymakers and service providers. Conclusion Even as signs point to a tentative economic recovery for the nation, it is clear that cities and suburbs alike continue to struggle with high unemployment. And though the data show a leveling off of new claims for Unemployment Insurance, we should not overlook the fact that on average Americans are spending longer stretches unemployed now than at the start of the recession just as more workers are underemployed than two-years ago. With increasing unemployment and economic distress has come an increase in the number of people turning to safety net services like food stamps in both urban and suburban communities. However, suburban households struggling with worsening economic situations may not be connecting to these services to the extent to which they are eligible. Though not all communities throughout the country are facing these challenges to the same extent, cities and suburbs are likely to continue grappling with these issues for some time to come, especially those that are slower to recover. As we continue to track these trends throughout the recovery, it has become increasingly clear that reliable, timely, and comparable data are needed to effectively monitor and respond to these trends. The data currently available have played an important role in capturing the intra-metropolitan dynamics of these trends. However, because there are not uniform reporting procedures across programs for sub-state data (e.g., levels of geography and time periods for which data are public are not necessarily uniform across states), it is difficult to get a comprehensive picture of comparable trends across our country s major labor markets. Standardizing reporting requirements and making comparable sub-state data publicly available on a regular basis would give policymakers and service providers better information as they navigate a thus far tentative and uneven recovery. 1 The Metropolitan Policy Program at Brookings, MetroMonitor: Tracking Economic Recession and Recovery in America s 100 Largest Metro Areas (Washington: Brookings Institution, March 2010). 2 Elizabeth Kneebone and Emily Garr, The Suburbanization of Poverty: Trends in Metropolitan America, 2000 to 2008 (Washington: Brookings Institution, 2010). 10

11 3 After subtracting the primary city(ies), high density suburbs are those counties that were at least 95 percent urbanized according to Census Mature suburbs are 75 to 95 percent urbanized, emerging suburbs are 25 to 75 percent urbanized, and exurbs are less than 25 percent urbanized. 4 Higher-density suburbs are counties that were 75 to 95 percent urbanized, and lower-density suburbs had urbanization rates of less than 75 percent in William Frey, The Great American Migration Slow Down: Regional and Metropolitan Dimensions (Washington: Brookings Institution, 2009). 6 The experience of exurbs from December to December differs from the findings of the previous edition of the Landscape of Recession, which looked at May unemployment figures and found that exurbs led for increases in unemployment among suburban types. In part, these differences underscore the seasonal sensitivity of the exurban employment cycle. In analyzing monthly unemployment data that have not been seasonally adjusted, exurban communities prove to be most variable. In the winter months, exurban unemployment surpasses primary city unemployment rates, whereas in summer months exurbs dip below other suburban types for unemployment. The types of jobs that tend to locate in exurban communities including agricultural and construction jobs, which are more seasonal in nature help explain these trends. 7 Brookings Institution analysis of U.S. Bureau of Labor Statistics data. 8 Underemployment is a measure of labor underutilization and includes discouraged workers, marginally unemployed workers, and those working part-time for economic reasons (i.e. would prefer to be working full-time). As of 2008, the Bureau of Labor Statistics reports this measure in quarterly moving averages, at the state level. Comparable data are not available for metropolitan areas. 11
.")
12 Acknowledgments The authors thank Alan Berube for his guidance on this project, Kelsey Merrick for her research assistance, the many state agencies who generously shared their data on Unemployment Insurance claims, and the USDA Food and Nutrition Service for providing data on county-level SNAP participation. The Metropolitan Policy Program at Brookings thanks the Ford Foundation for its generous support of the program s research on city and suburban poverty, the Annie E. Casey Foundation for its support of the program s research on low-income working families, and the John D. and Catherine T. MacArthur Foundation, the George Gund Foundation, and the Heinz Endowments for their general support of the program. For More Information Elizabeth Kneebone Senior Research Analyst Metropolitan Policy Program at Brookings (202) ekneebone@brookings.edu Emily Garr Senior Research Assistant Metropolitan Policy Program at Brookings (202) egarr@brookings.edu For General Information Metropolitan Policy Program at Brookings (202)

13 13

14 14
Employment Recovery in Urban Areas following the Great Recession
 Employment Recovery in Urban Areas following the Great Recession Ryan Howley Economist Bureau of Labor Statistics, Washington, DC Toby Paterson Economist Employment Security Department, Washington State
Rural America At A Glance
 United States Department of Agriculture Rural America At A Glance 2014 Edition Overview While the U.S. economy is now in its sixth year of recovery from the Great Recession of 2007-09, its performance
Supply and Demand Conditions for Electricians. An Update of Labor Market and Electrician Program Data. December 2013
 Supply and Demand Conditions for Electricians An Update of Labor Market and Electrician Program Data December 2013 Prepared by: Mohamed Mourssi-Alfash, Ph.D. Research Analyst (651) 259-7416 Mohamed.mourssi@state.mn.us
Brief 1 The State of North Carolina: Jobs, Poverty and Family. Jeannine Sato, Center for Child and Family Policy
 Brief 1 The State of North Carolina: Jobs, Poverty and Family Jeannine Sato, Center for Child and Family Policy The connection among jobs, poverty and family well-being is well established. Research shows
CENTER FOR LABOR MARKET STUDIES
 The Complete Breakdown in the High Schoolto Work Transition of Young, Non College Enrolled High School Graduates in the U.S.; The Need for an Immediate National Policy Response Prepared by: Andrew Sum
Truman Policy Research Harry S Truman School of Public Affairs
 Truman Policy Research Harry S Truman School of Public Affairs Kansas City Metro Hunger Atlas 1 December February 2008 2011 Jill Lucht, Jordan Dawdy, Colleen Heflin, Sandy Rikoon, Matt Foulkes, Joan Hermsen,
Policy Analysis Report
 CITY AND COUNTY OF SAN FRANCISCO BOARD OF SUPERVISORS BUDGET AND LEGISLATIVE ANALYST 1390 Market Street, Suite 1150, San Francisco, CA 94102 (415) 552-9292 FAX (415) 252-0461 Policy Analysis Report To:
Left Behind: DC s Economic Recovery Is Not Reaching All Residents By Ed Lazere and Marco Guzman 1
 An Affiliate of the Center on Budget and Policy Priorities 820 First Street NE, Suite 460 Washington, DC 20002 (202) 408-1080 Fax (202) 408-8173 www.dcfpi.org Left Behind: DC s Economic Recovery Is Not
CONGRESS OF THE UNITED STATES CONGRESSIONAL BUDGET OFFICE CBO. The Distribution of Household Income and Federal Taxes, 2008 and 2009
 CONGRESS OF THE UNITED STATES CONGRESSIONAL BUDGET OFFICE Percent 70 The Distribution of Household Income and Federal Taxes, 2008 and 2009 60 50 Before-Tax Income Federal Taxes Top 1 Percent 40 30 20 81st
The Labor Market Problems of Massachusetts Workers in the Recovery from the Great Recession: The Great Socioeconomic Divergence
 The Labor Market Problems of Massachusetts Workers in the Recovery from the Great Recession: The Great Socioeconomic Divergence Prepared by: Andrew Sum Ishwar Khatiwada Walter McHugh Center for Labor Market
Recovery Performance
 Mountain Monitor Tracking Economic Recession and Recovery in the Intermountain West s Metropolitan Areas Kenan Fikri and Mark Muro June 2013 Economic recovery gained strength across the major metro areas
UNEMPLOYMENT AMONG YOUNG WORKERS
 May 2010 UNDERSTANDING THE ECONOMY : UNEMPLOYMENT AMONG YOUNG WORKERS A REPORT BY THE U.S. CONGRESS JOINT ECONOMIC COMMITTEE REPRESENTATIVE CAROLYN B. MALONEY, CHAIR Executive Summary Although the economy
Recession in North Carolina
 recession and recovery in north carolina: a data snapshot, 2007 12 August 2012 daniel p. gitterman, peter a. coclanis, and john quinterno 2 executive summary The Great Recession has altered North Carolina
The workforce in the United States is
 A Great Recession Brief Older Workers, Retirement, and the Great Recession October 212 The Russell Sage Foundation and The Stanford Center on Poverty and Inequality Richard W. Johnson, The Urban Institute
Regional Profile Labor Force, Employment and Unemployment in Region 5
 Regional Profile Labor Force, Employment and Unemployment in Region 5 For questions regarding content, please contact Brian Rooney at Brian.T.Rooney@state.or.us, (541) 686-7703 www.workinginoregon.org
GAO. UNEMPLOYMENT INSURANCE Receipt of Benefits Has Declined, with Continued Disparities for Low-Wage and Part-Time Workers
 GAO For Release on Delivery Expected at 1:00 p.m. EDT Wednesday, September 19, 2007 United States Government Accountability Office Testimony Before the Subcommittee on Income Security and Family Support,
THE STATE OF THE ECONOMY
 THE STATE OF THE ECONOMY CARLY HARRISON Portland State University Following data revisions, the economy continues to grow steadily, but slowly, in line with expectations. Gross domestic product has increased,
MetroMonitor Tracking Economic Recession and Recovery in America s 100 Largest Metropolitan Areas
 MetroMonitor Tracking Economic Recession and Recovery in America s 100 Largest Metropolitan Areas Howard Wial and Siddharth Kulkarni March 2012 National economic indicators suggest that the economic recovery,
820 First Street NE, Suite 510 Washington, DC 20002. Tel: 202-408-1080 Fax: 202-408-1056. center@cbpp.org www.cbpp.org.
 820 First Street NE, Suite 510 Washington, DC 20002 Tel: 202-408-1080 Fax: 202-408-1056 center@cbpp.org www.cbpp.org January 5, 2011 DESPITE DEEP RECESSION AND HIGH UNEMPLOYMENT, GOVERNMENT EFFORTS INCLUDING
Supply and Demand Conditions for Electricians. An Update of Labor Market and Electrician Program Data. November, 2009
 Supply and Demand Conditions for Electricians An Update of Labor Market and Electrician Program Data November, 2009 Prepared by Bruce Steuernagel, Labor Market Analyst Office of the Chancellor Minnesota
Changes in Health Insurance Coverage in the Great Recession, 2007-2010 John Holahan and Vicki Chen The Urban Institute Executive Summary
 I S S U E P A P E R kaiser commission on medicaid and the uninsured Changes in Health Insurance Coverage in the Great Recession, 2007-2010 John Holahan and Vicki Chen The Urban Institute Executive Summary
Adecade into the 21st century, Michigan s longbruised
 Michigan League FOR Human Services December 2010 Michigan's Economy Continues to Cause Pain: Communities of Color Take a Harder Hit Adecade into the 21st century, Michigan s longbruised economy continues
For Immediate Release
 Household Income Trends May 2015 Issued July 2015 Gordon Green and John Coder Sentier Research, LLC For Immediate Release 1 Household Income Trends May 2015 Note This report on median household income
Housing Markets in Six Metropolitan Areas and their Main Central Cities
 Housing Markets in Six Metropolitan Areas and their Main Central Cities Rolf Pendall Director, Metropolitan Housing and Communities Policy Center, The Urban Institute Housing issues and opportunities at
PRESS RELEASE. Home Prices Grew at Twice the Rate of Inflation in 2014 According to the S&P/Case-Shiller Home Price Indices
 Home Prices Grew at Twice the Rate of Inflation in 2014 According to the S&P/Case-Shiller Home Price Indices New York, February 24, 2015 today released the latest results for the S&P/Case-Shiller Home
Profile of Rural Health Insurance Coverage
 Profile of Rural Health Insurance Coverage A Chartbook R H R C Rural Health Research & Policy Centers Funded by the Federal Office of Rural Health Policy www.ruralhealthresearch.org UNIVERSITY OF SOUTHERN
September 14, 2011. Several facts stand out from the new Census data:
 820 First Street NE, Suite 510 Washington, DC 20002 Tel: 202-408-1080 Fax: 202-408-1056 center@cbpp.org www.cbpp.org September 14, 2011 POVERTY RATE SECOND-HIGHEST IN 45 YEARS; RECORD NUMBERS LACKED HEALTH
New York State Employment Trends
 New York State Employment Trends August 2015 Thomas P. DiNapoli New York State Comptroller Prepared by the Office of Budget and Policy Analysis Additional copies of this report may be obtained from: Office
A Portrait of Seattle s Low-Income Working Population
 A Portrait of Seattle s Low-Income Working Population December 2011 Support provided by the City of Seattle Office of Economic Development 1 INTRODUCTION The Great Recession, now over two years gone, has
Florida s Great Cost Shift: How Higher Education Cuts Undermine Its Future Middle Class
 Florida s Great Cost Shift: How Higher Education Cuts Undermine Its Future Middle Class J ust as a postsecondary education has become essential for getting a decent job and entering the middle class, it
UNIVERSITY WORKS. 2014 employment report
 UNIVERSITY WORKS 2014 employment report Empirical data shows Ontario university graduates have the best labour market outcomes. A university education leads to success. UNIVERSITY grads get jobs University
Impact of the recession
 Regional Trends 43 21/11 Impact of the recession By Cecilia Campos, Alistair Dent, Robert Fry and Alice Reid, Office for National Statistics Abstract This report looks at the impact that the most recent
USING CURRENT POPULATION SURVEY DATA TO EXAMINE SCHOOL ADMINISTRATORS CAREERS
 Appendix D USING CURRENT POPULATION SURVEY DATA TO EXAMINE SCHOOL ADMINISTRATORS CAREERS The Current Population Survey (CPS) is a monthly household survey conducted by the Bureau of the Census for the
THE GROWING COST OF HEALTH INSURANCE COVERAGE HEALTH CARE COSTS AND SPENDING IN NEW YORK STATE
 S E C T I O N THE GROWING COST OF HEALTH INSURANCE COVERAGE 18 The Growing Cost of Health Insurance Coverage New York s large employers contribute higher shares of premium costs than employers in any other
A Project of the ASU College of Public Programs Debra Friedman, Dean
 GREATER PHOENIX FORWARD Sustaining and Enhancing the Human-Services Infrastructure This section provided as an excerpt of the larger publication available at copp.asu.edu A Project of the ASU College of
ADP Annual Health Benefits Report
 ADP RESEARCH INSTITUTE ADP Annual Health Benefits Report 2014 Benchmarks and Trends for Large Organizations Table of Contents Executive Summary... 2 About This Study... 4 Section One: Participation in
The primary purpose of a tax system is to support public goods and services. State and local taxes
 Issue Brief UPDATED APRIL 2015 BY WILLIAM CHEN Who Pays Taxes in California? The primary purpose of a tax system is to support public goods and services. State and local taxes are the way that Californians
The recession of 2007 2009, a
 Employment outlook: Labor force projections to : a more slowly growing workforce The projected labor force growth over the next 10 years will be affected by the aging of the baby-boom generation; as a
The Student Debt Review
 New America Education Policy Program February 2014 Policy Brief The Student Debt Review Analyzing the State of Undergraduate Student Borrowing Ben Miller 2 The Student Debt Review About the Author Ben
Lloyd Potter is the Texas State Demographer and the Director of the Texas State Data Center based at the University of Texas at San Antonio.
 Lloyd Potter is the Texas State Demographer and the Director of the Texas State Data Center based at the University of Texas at San Antonio. 1 2 Texas population in 2014 was just under 27 million and was
On March 11, 2010, President Barack
 U.S. Department of Commerce International Trade Administration Introduction Exports Support American Jobs Updated measure will quantify progress as global economy recovers. On March 11, 21, President Barack
Higher Education Employment Report
 Higher Education Employment Report First Quarter 2015 / Published May 2015 Executive Summary The number of jobs in higher education noticeably declined in 2015. This is in contrast to the past two years
Long Island is rapidly losing its lead in private health care coverage. That distinctive mark of middle class success - private
 RESEARCH REPORT Regional Labor Review Fall 1998 Long Island s Ailing Health Care Benefits by Niev Duffy Long Island is rapidly losing its lead in private health care coverage. That distinctive mark of
Non Farm Payroll Employment Developments among States during the Great Recession and Jobless Recovery
 Non Farm Payroll Employment Developments among States during the Great Recession and Jobless Recovery Prepared by: Paul E. Harrington and Neeta P. Fogg Center for Labor Markets and Policy, Drexel University
The Nonprofit Sector in Brief 2014
 CENTER ON NONPROFITS AND PHILANTHROPY The Nonprofit Sector in Brief 2014 Public Charities, Giving, and Volunteering Brice S. McKeever and Sarah L. Pettijohn October 2014 This brief highlights trends in
MBA Forecast Commentary Joel Kan, jkan@mba.org
 MBA Forecast Commentary Joel Kan, jkan@mba.org Weak First Quarter, But Growth Expected to Recover MBA Economic and Mortgage Finance Commentary: May 2015 Broad economic growth in the US got off to a slow
The goal is to transform data into information, and information into insight. Carly Fiorina
 DEMOGRAPHICS & DATA The goal is to transform data into information, and information into insight. Carly Fiorina 11 MILWAUKEE CITYWIDE POLICY PLAN This chapter presents data and trends in the city s population
Summary. Abbas P. Grammy 1 Professor of Economics California State University, Bakersfield
 The State of the Economy: Kern County, California Summary Abbas P. Grammy 1 Professor of Economics California State University, Bakersfield Kern County households follow national trends. They turned less
Sources of Health Insurance and Characteristics of the Uninsured: Analysis of the March 2010 Current Population Survey
 September 2010 No. 347 Sources of Health Insurance and Characteristics of the Uninsured: Analysis of the March 2010 Current Population Survey By Paul Fronstin, Employee Benefit Research Institute LATEST
Sources of Health Insurance and Characteristics of the Uninsured: Analysis of the March 2012 Current Population Survey
 September 2012 No. 376 Sources of Health Insurance and Characteristics of the Uninsured: Analysis of the March 2012 Current Population Survey By Paul Fronstin, Ph.D., Employee Benefit Research Institute
Women and Men in the Recovery: Where the Jobs Are Women Recover Jobs Lost in Recession in Year Five
 IWPR #C426 November 2014 Women and Men in the Recovery: Where the Jobs Are Women Recover Jobs Lost in Recession in Year Five Heidi Hartmann, Ph.D., Elyse Shaw, and Rachel O Connor Overview While the number
Women s Participation in Education and the Workforce. Council of Economic Advisers
 Women s Participation in Education and the Workforce Council of Economic Advisers Updated October 14, 214 Executive Summary Over the past forty years, women have made substantial gains in the workforce
ANTHONY P. CARNEVALE TAMARA JAYASUNDERA BAN CHEAH THE COLLEGE ADVANTAGE: WEATHERING THE ECONOMIC STORM EXECUTIVE SUMMARY
 ANTHONY P. CARNEVALE TAMARA JAYASUNDERA BAN CHEAH THE COLLEGE ADVANTAGE: WEATHERING THE ECONOMIC STORM EXECUTIVE SUMMARY CII THE COLLEGE ADVANTAGE: WEATHERING THE ECONOMIC STORM EXECUTIVE SUMMARY W hen
Making Michigan s Workforce Competitive in the New Economy Increasing the Number of Young Adults with College Degrees July 2009
 Making Michigan s Workforce Competitive in the New Economy Increasing the Number of Young Adults with College Degrees July 2009 Nationally there are 8.4 million 25-34 year olds who have some college experience
HUD PD&R WORKING PAPER 10-01 U.S. Rental Housing Characteristics: Supply, Vacancy, and Affordability. By Rob Collinson and Ben Winter January 2010
 HUD PD&R WORKING PAPER 10-01 U.S. Rental Housing Characteristics: Supply, Vacancy, and Affordability By Rob Collinson and Ben Winter January 2010 Abstract The aim of this working paper is to document key
A Comparative Analysis of Income Statistics for the District of Columbia
 Occasional Studies A Comparative Analysis of Income Statistics for the District of Columbia ACS Income Estimates vs. DC Individual Income Tax Data Jayron Lashgari Office of Revenue Analysis Office of the
Table of Contents. A. Aggregate Jobs Effects...3. B. Jobs Effects of the Components of the Recovery Package...5. C. The Timing of Job Creation...
 1 Table of Contents A. Aggregate Jobs Effects...3 B. Jobs Effects of the Components of the Recovery Package...5 C. The Timing of Job Creation...7 D. Breakdown by Industry...7 E. Effects on Different Demographic
Maryland s Job Growth Continues to Lag in 2014 State behind national growth rates for fourth consecutive year
 Maryland s Job Growth Continues to Lag in 2014 State behind national growth rates for fourth consecutive year Job growth in Maryland continued to lag the U.S. in 2014 for the fourth consecutive year. Moreover,
The long-term projections of federal revenues and
 APPENDIX B Changes in s Long-Term Projections Since July 214 The long-term projections of federal revenues and outlays presented in this report are generally similar to the ones that the Congressional
Demographic Trends Driving the Hispanic Consumer Market James W. Gillula and Tabitha Bailey*
 Demographic Trends Driving the Hispanic Consumer Market James W. Gillula and Tabitha Bailey* The rapid growth of the U.S. Hispanic population has captured the attention of most major retailers and consumer
Trends In Long-term Unemployment
 MARCH 2015 Trends In Long-term Unemployment Karen Kosanovich and Eleni Theodossiou Sherman Long-term unemployment reached historically high levels following the Great Recession of 2007 2009. Both the number
In 1992, the US Congress authorized the Moving to Opportunity (MTO) housing voucher
 housing voucher") A Driving Factor in Moving to Opportunity EVELYN BLUMENBERG AND GREGORY PIERCE In 1992, the US Congress authorized the Moving to Opportunity (MTO) housing voucher program to operate in five large metropolitan
A Driving Factor in Moving to Opportunity EVELYN BLUMENBERG AND GREGORY PIERCE In 1992, the US Congress authorized the Moving to Opportunity (MTO) housing voucher program to operate in five large metropolitan
METRO ATLANTA STILL AMONG FASTEST-GROWING IN NATION
 October 2012 Despite the dour economic news of the past few years, metro Atlanta remains the key economic driver of the Southeast. But, as with all metro areas, challenges abound. One of those challenges
How To Study The Trends In Higher Education In California
 RAND Trends in the California Higher Education Sector and Its Environment Cathy Krop, Stephen Carroll, Carlos Rivera DRU-1622IET January 1997 Prepared for the California Education Roundtable lnstititute
30 7 TH STREET, S UITE 350 MEMORANDUM
 OFFICE OF THE CHANCELLOR WELLS FARGO PLACE ph 651.201.1800 30 7 TH STREET, S UITE 350 fx 651.297.5550 ST. PAUL, MN 55101-7804 www.mnscu.edu DATE: September 15, 2011 MEMORANDUM TO: FROM: Presidents, Chief
Race Matters. Household Asset Poverty by Race in North Carolina. Child Poverty by County
 Race Matters Children of color are more likely to grow up in both income poverty and asset poverty. This double burden creates a difficult barrier for children to overcome. As adults, children of color
Underutilization in U.S. Labor Markets
 EMBARGOED UNTIL Thursday, February 6, 2014 at 5:45 PM Eastern Time OR UPON DELIVERY Underutilization in U.S. Labor Markets Eric S. Rosengren President & Chief Executive Officer Federal Reserve Bank of
OVERVIEW. local offices. 1 Future plans for the FPI program in FY2001 are to conduct an electronic referral pilot at one of the DHS
 FRAUD PREVENTION INVESTIGATIONS FY 00 COST BENEFIT ANALYSIS OIG 00-0322 NOVEMBER 2000 EXECUTIVE SUMMARY...Pg. i The program s goal is to prevent ineligible persons from receiving welfare, thereby saving
What Can We Learn by Disaggregating the Unemployment-Vacancy Relationship?
 What Can We Learn by Disaggregating the Unemployment-Vacancy Relationship? No. 1- Rand Ghayad and William Dickens Abstract: The Beveridge curve the empirical relationship between unemployment and job vacancies
SAN DIEGO S ROAD TO RECOVERY
 SAN DIEGO S ROAD TO RECOVERY June 2012 Like all American cities, San Diego suffered from the 2008 financial crisis and ensuing recession. Gradual and positive trends in unemployment, real estate, tourism
SalarieS of chemists fall
 ACS news SalarieS of chemists fall Unemployment reaches new heights in 2009 as recession hits profession hard The economic recession has taken its toll on chemists. Despite holding up fairly well in previous
LEE BUSI N ESS SCHOOL UNITED STATES QUARTERLY ECONOMIC FORECAST. U.S. Economic Growth to Accelerate. Chart 1. Growth Rate of U.S.
 CENTER FOR BUSINESS & ECONOMIC RESEARCH LEE BUSI N ESS SCHOOL UNITED STATES QUARTERLY ECONOMIC FORECAST O U.S. Economic Growth to Accelerate ver the past few years, U.S. economic activity has remained
Pew Study: American Middle Class is Steadily Shrinking
 Pew Study: American Middle Class is Steadily Shrinking December 23, 2015 by Gary D. Halbert of ProFutures Investments IN THIS ISSUE: 1. Pew Research: American Middle Class is Steadily Shrinking 2. Pew
College Enrollment Hits All-Time High, Fueled by Community College Surge
 Enrollment Hits All-Time High, Fueled by Community Surge FOR RELEASE: OCTOBER 29, 2009 Paul Taylor, Project Director Richard Fry, Senior Researcher Wendy Wang, Research Associate Daniel Dockterman, Research
Population. William Sander Professor of Economics at DePaul University and Consultant to the Federal Reserve Bank of Chicago
 Population William Sander Professor of Economics at DePaul University and Consultant to the Federal Reserve Bank of Chicago Trends Many large cities in the U.S. started to decline in the 1950s both absolutely
By Melissa S. Kearney, Brad Hershbein, and Elisa Jácome The Hamilton Project
 PROFILES OF CHANGE: EMPLOYMENT, EARNINGS, AND OCCUPATIONS FROM 1990-2013 April 20, 2015 By Melissa S. Kearney, Brad Hershbein, and Elisa Jácome The Hamilton Project There has been tremendous focus in recent
HUD PD&R Housing Market Profiles
 Chicago-Joliet-Naperville, Illinois-Indiana-Wisconsin Quick Facts About Chicago-Joliet-Naperville By Gabriel A. Labovitz Current sales market conditions: soft. Current apartment market conditions: balanced.
THE NONPROFIT SECTOR IN BRIEF:
 URBAN INSTITUTE THE NONPROFIT SECTOR IN BRIEF: Public Charities, Giving, and Volunteering, 2013 Sarah L. Pettijohn This brief highlights trends in the number and finances of 501(c)(3) public charities
Counting for Dollars: Cape Coral, FL
 Counting for Dollars: Cape Coral, FL Federal Assistance Programs that Distributed Funds in the Cape Coral-Fort Myers, FL Metropolitan Area on the Basis of Census-Related Statistics, Fiscal Year 2008 This
When Will the U.S. Job Market Recover?
 March 2012 In this newsletter, we focus on the U.S. job market. The economic recovery post-2008 is often referred to as a "jobless recovery" given the persistently high unemployment rate. In this paper
In 2009, higher poverty rates were clear among racial/ethnic minority
 Translating Research Into Practice How Low-Income Minorities Get By in Retirement: Poverty Levels and s Zachary D. Gassoumis, Karen D. Lincoln and William A. Vega Summary In 2009, higher poverty rates
State of Working Colorado 2015-16. Michelle Webster S. Casey O Donnell. Colorado Center on Law & Policy
 State of Working Colorado 2015-16 Michelle Webster S. Casey O Donnell Colorado Center on Law & Policy cclponline.org State of Working Colorado 2015-16 Colorado Center on Law & Policy 789 Sherman St., Suite
Forecasts of the Registered Nurse Workforce in California. September 29, 2009
 Forecasts of the Registered Nurse Workforce in California September 29, 2009 Conducted for the California Board of Registered Nursing Joanne Spetz, PhD Center for California Health Workforce Studies University
Nonprofit Fundraising 2010 - Change in the Number of Companies
 The 2010 Nonprofit Fundra aising Survey Funds Raised in 20100 Compared with 2009 March 2011 The Nonprof fit Research Collaborative With special thanks to the representatives of 1,845 charitable organizations
Analysis of JOLTS Research Estimates by Size of Firm
 Analysis of JOLTS Research Estimates by Size of Firm Katherine Bauer Klemmer 1 1 U.S. Bureau of Labor Statistics, 2 Massachusetts Ave. NE, Washington DC 2212 Abstract The Job Openings and Labor Turnover
TEXAS MANUFACTURING EXPANDS BUT AT A SLOWER PACE
 ust 25, 2014 TEXAS MANUFACTURING EXPANDS BUT AT A SLOWER PACE For this month's survey, manufacturers were asked supplemental questions on health care costs and the impact of the Affordable Care Act. Texas
FRBSF ECONOMIC LETTER
 FRBSF ECONOMIC LETTER 14- July 7, 14 Slow Business Start-ups and the Job Recovery BY LIZ LADERMAN AND SYLVAIN LEDUC Start-ups typically create jobs so fast at the beginning of recoveries that even a modest
GAO SCHOOL FINANCE. Per-Pupil Spending Differences between Selected Inner City and Suburban Schools Varied by Metropolitan Area
 GAO United States General Accounting Office Report to the Ranking Minority Member, Committee on Ways and Means, House of Representatives December 2002 SCHOOL FINANCE Per-Pupil Spending Differences between
The State of Working New York 2012: Disappointingly Weak Recovery
 The State of Working New York 2012: Disappointingly Weak Recovery A Fiscal Policy Institute Report www.fiscalpolicy.org September 2, 2012 Highlights After three years of tepid recovery from the Great Recession
How To Calculate College Enrollment In The United States
 EDUCATION POLICY BRIEF May 2008 The Nelson A. Rockefeller Institute of Government The public policy research arm of the State University of New York The States and Their Community Colleges Every state
Minnesota Hospitals: Uncompensated Care, Community Benefits, and the Value of Tax Exemptions
 Minnesota Hospitals: Uncompensated Care, Community Benefits, and the Value of Tax Exemptions Minnesota Department of Health January, 2007 Division of Health Policy Health Economics Program PO Box 64882
The Japanese economy?
 The Japanese economy? Franz Waldenberger Japan Center and Munich School of Management --University Munich LMU waldenberger@bwl.lmu.de 1 Outline 2 1. GDP economic recovery 2. GDP per head two lost decades
Certificate Production and the Race toward Higher Degree Attainment December 2010
 State Higher Education Executive Officers Certificate Production and the Race toward Higher Degree Attainment December 2010 ----- A report from the State Higher Education Executive Officers utilizing the
LEE BUSI N ESS SCHOOL SOUTHERN NEVADA QUARTERLY ECONOMIC FORECAST. Southern Nevada Economy to Continue Growth in 2014 and 2015
 CENTER FOR BUSINESS & ECONOMIC RESEARCH LEE BUSI N ESS SCHOOL SOUTHERN NEVADA QUARTERLY ECONOMIC FORECAST Quarter 2 2014 Southern Nevada Economy to Continue Growth in 2014 and 2015 S ince the end of the
2011 research report. Comparative Analysis of Prince George s Nonprofit Sector
 2011 research report Comparative Analysis of Prince George s Nonprofit Sector Nonprofi ts mission is to strengthen, educate, and engage nonprofi t organizations so they can successfully achieve their missions.
Tracking Report. Medical Bill Problems Steady for U.S. Families, 2007-2010 MEDICAL BILL PROBLEMS STABILIZE AS CONSUMERS CUT CARE
 I N S U R A N C E C O V E R A G E & C O S T S Tracking Report RESULTS FROM THE HEALTH TRACKING HOUSEHOLD SURVEY NO. 28 DECEMBER 2011 Medical Bill Problems Steady for U.S. Families, 2007-2010 By Anna Sommers
PROFILE OF CHANGES IN COLORADO PUBLIC SCHOOL FUNDING
 PROFILE OF CHANGES IN COLORADO PUBLIC SCHOOL FUNDING 988-89 TO 998-99 Prepared for THE COLORADO SCHOOL FINANCE PROJECT Colorado Association of School Boards Colorado Association of School Executives Colorado
Trends in Higher Education Series. Trends in College Pricing
 Trends in Higher Education Series Trends in College Pricing 2006 Introduction This report, based on the College Board s Annual Survey of Colleges, provides up-to-date information on tuition and other expenses
Characteristics of Minnesota Business, 2007. All Firms Firms with Paid Employees Firms without Paid Employees. Number of Paid Employees
 Open for Business Women own one in four businesses in Minnesota, but the number of womenowned firms in the state grew at a surprisingly slow pace in the five years leading up to the recession. If you follow