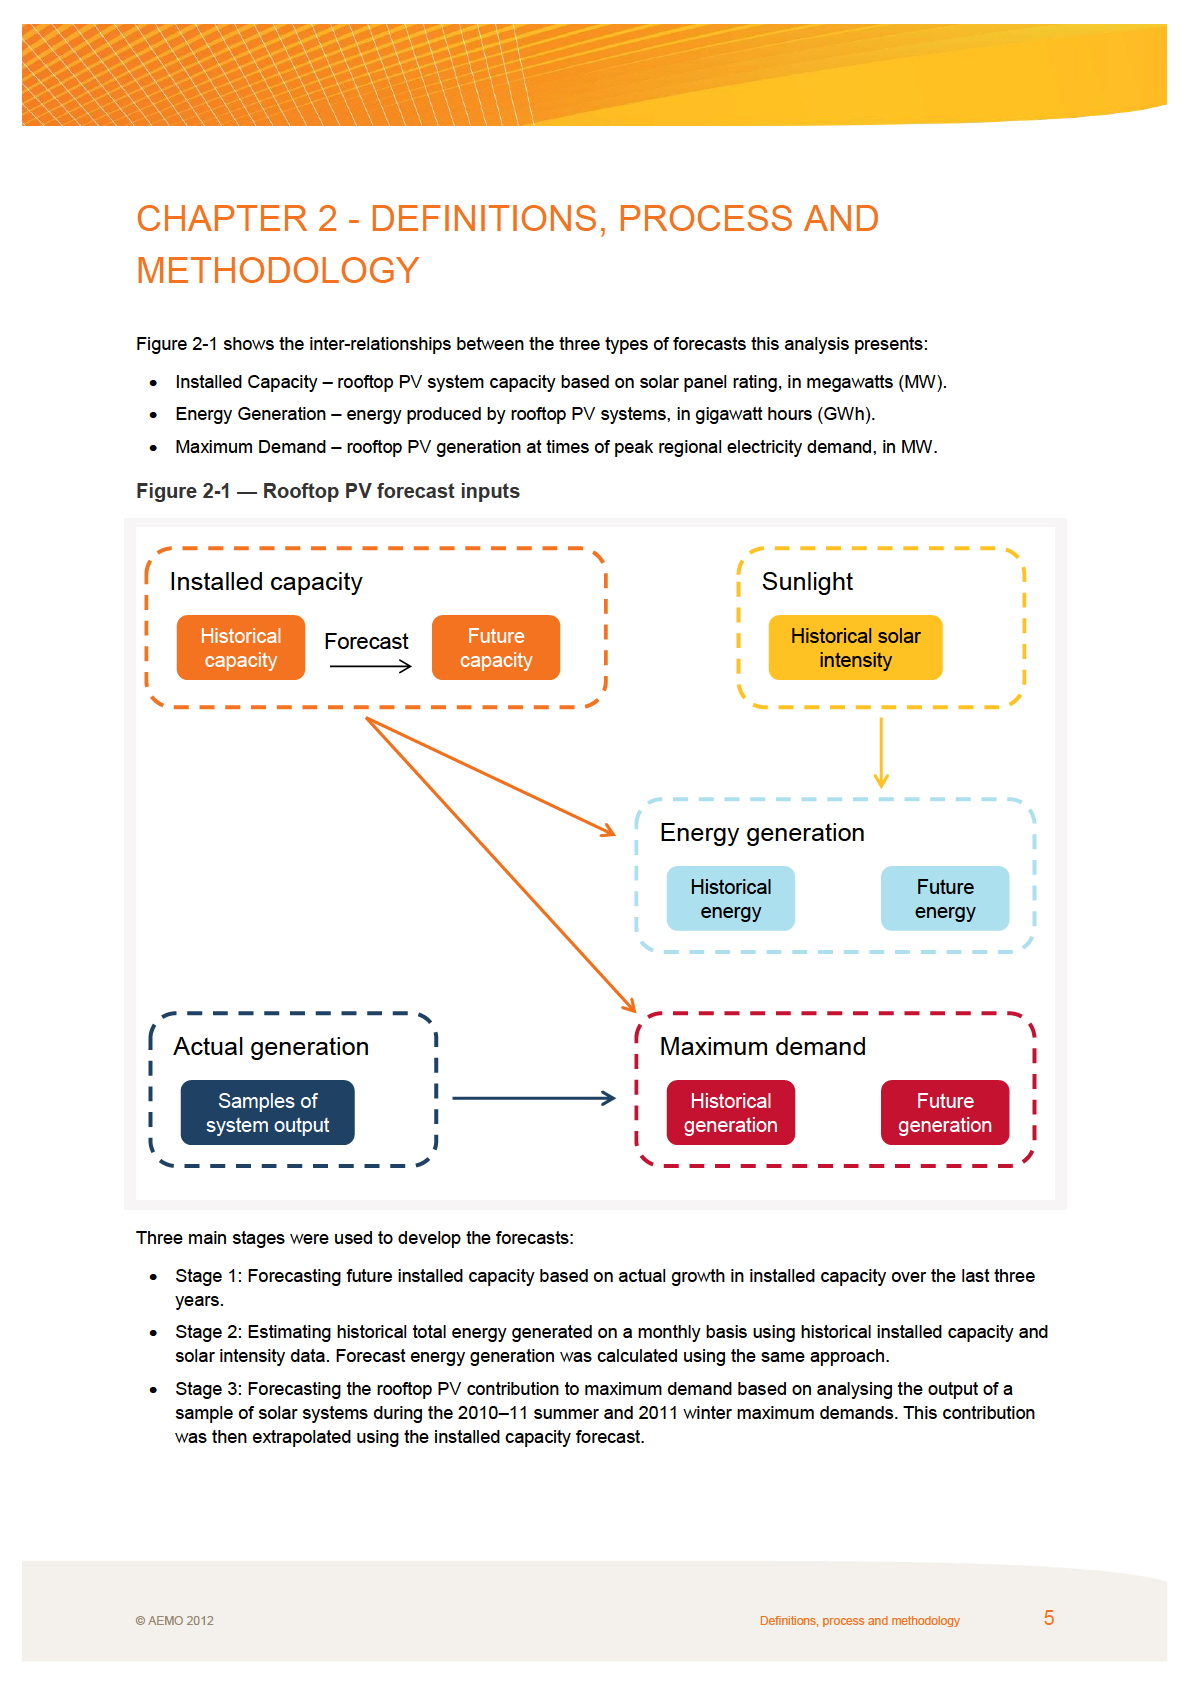
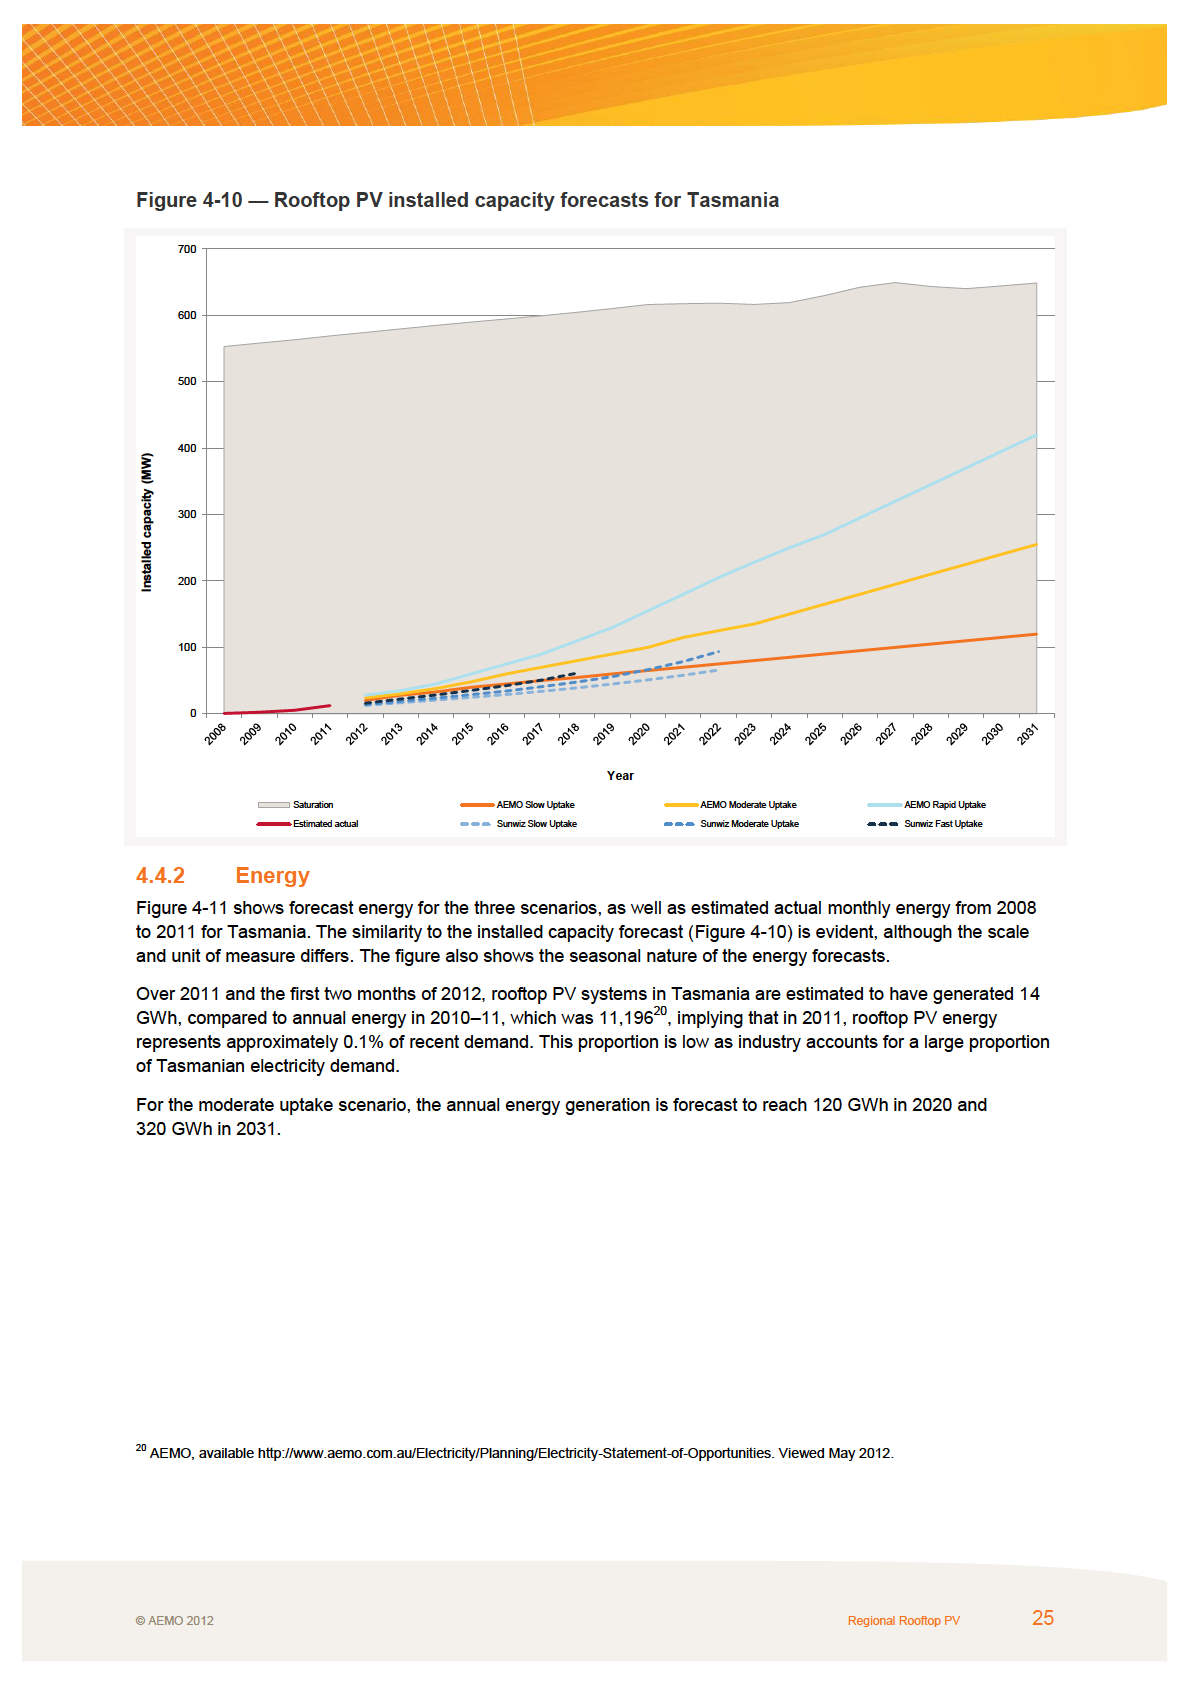
EXECUTIVE SUMMARY. Key observations. AEMO to include rooftop PV generation in annual forecasting reports
|
|
|
- Priscilla Powers
- 8 years ago
- Views:
Transcription

1
2
3 EXECUTIVE SUMMARY Key observations The key observations for rooftop PV forecasts detailed in this report are: The NEM has experienced a rapid uptake of rooftop PV over the last four years, with total estimated installed capacity rising from 23 MW in 2008 to an estimated 1,450 MW by the end of February PV energy produced in 2011 is estimated at 1,200 GWh, or 0.6% of annual energy. This means it is already at an observable level in the NEM, and while there has been no significant operational impact on the wholesale market, this has the potential to occur if capacity starts to impact investments in the network and/or large scale generation. Forecast increases in system installations are expected to offset a large amount of energy that would have otherwise been provided by the NEM. Installed capacity is forecast to reach 5,100 MW by 2020 and almost 12,000 MW by 2031 (based on a moderate growth scenario). Rooftop PV uptake is expected to be relatively restrained to 2017 (averaging 320 MW per year for the moderate scenario), due mainly to a reduction or withdrawal in feed-in tariffs, and decreased demand from installations. From 2018 to 2025 uptake is expected to accelerate, with growth forecast to average 620 MW per year (moderate scenario) and 1,130 MW per year (rapid scenario). From 2026 to 2031 uptake continues to increase further as incentives continue to increase, growth for new dwellings continues, and installations on existing dwellings start to slow. In the mainland regions, summer maximum demand typically occurs in the late afternoon, when rooftop PV generation is declining from its midday peak and is operating at an estimated 28% 38% of capacity. Maximum demand in Tasmania typically occurs on a winter evening, when rooftop PV generation is negligible. AEMO to include rooftop PV generation in annual forecasting reports Given its current and forecast growth, AEMO will now publish its analysis of existing and forecast levels of rooftop PV (installed capacity, annual energy generation and the impact on maximum demand) in its annual forecasting reports. This will comprise one input of the improved forecasting process which will see AEMO publish annual energy and maximum demand electricity forecasts for each NEM region by 30 June 2012, with the aim of making the overall process more transparent and of even more value to stakeholders. This rooftop PV report provides a NEM-wide summary of rooftop PV growth to date and possible capacity growth over the next 20 years, but it is clear that robust estimates require consistent, detailed, national data. To achieve this, AEMO is seeking increased collaboration with industry and has set up a new six-monthly process to gather the requisite data. In this report, forecast growth to 2031 is considered under three uptake scenarios: slow (driven by small electricity price increases and PV price reductions, and no government incentives); moderate (moderate electricity price increases and PV price reductions, and moderate government incentives); and rapid (large electricity price increases and PV price reductions, and significant government incentives). Implications including the effect that increased rooftop PV penetration and any cross-subsidy arrangements might have on retail electricity prices have not been analysed. AEMO 2012 Executive summary iii
4
5 CONTENTS EXECUTIVE SUMMARY III CHAPTER 1 - INTRODUCTION National Electricity Forecasting Definition of rooftop PV Impact on demand forecasting Modelling electricity demand Content of paper Future work 4 CHAPTER 2 - DEFINITIONS, PROCESS AND METHODOLOGY Drivers of rooftop PV uptake Rooftop PV scenarios Mapping rooftop PV scenarios Forecasting installed capacity Future economic payback Barriers to uptake Saturation capacity Estimating rooftop PV energy generation Rooftop PV generation at times of maximum demand 10 CHAPTER 3 - ROOFTOP PV IN THE NEM Installed capacity Historical analysis AEMO installed capacity forecast Energy 12 CHAPTER 4 - REGIONAL ROOFTOP PV New South Wales (and the Australian Capital Territory) Installed capacity Energy Maximum demand Queensland Installed capacity Energy Maximum demand South Australia Installed capacity Energy Maximum demand Tasmania Installed Capacity 24 AEMO 2012 Contents v

6
7 TABLES Table 2-1 Drivers and mapping of rooftop PV scenarios 6 Table 2-2 Simple payback periods by year of installation 8 Table D-1 Scope of non-aemo rooftop PV forecasts for Australia D-3 Table D-2 Reference list of non-aemo rooftop PV forecasts for Australia D-4 FIGURES Figure 1-1 AEMO s National Electricity Forecasting 2 Figure 2-1 Rooftop PV forecast inputs 5 Figure 2-2 Mapping scenarios for National Electricity Forecasting 7 Figure 3-1 Rooftop PV installed capacity forecasts for the NEM 12 Figure 3-2 Rooftop PV energy forecasts for the NEM 13 Figure 4-1 Rooftop PV installed capacity forecasts for New South Wales (and the Australian Capital Territory) 16 Figure 4-2 Rooftop PV energy forecasts for New South Wales (and the Australian Capital Territory) 17 Figure 4-3 Summer maximum demand forecasts for New South Wales (and the Australian Capital Territory) 18 Figure 4-4 Rooftop PV installed capacity forecasts for Queensland 19 Figure 4-5 Rooftop PV energy forecasts for Queensland 20 Figure 4-6 Summer maximum demand forecasts for Queensland 21 Figure 4-7 Rooftop PV installed capacity forecasts for South Australia 22 Figure 4-8 Rooftop PV energy generation forecasts for South Australia 23 Figure 4-9 Summer maximum demand forecasts for South Australia 24 Figure 4-10 Rooftop PV installed capacity forecasts for Tasmania 25 Figure 4-11 Rooftop PV energy generation forecasts for Tasmania 26 Figure 4-12 Rooftop PV installed capacity forecasts for Victoria 27 Figure 4-13 Rooftop PV energy generation forecasts for Victoria 28 Figure 4-14 Summer maximum demand forecasts for Victoria 29 Figure B-1 Daily energy generation from a 1 kw system by capital city B-2 Figure B-2 Historical monthly solar intensity B-3 Figure B-3 Monthly contribution of annual energy in Melbourne B-4 Figure B-4 Sample generation data from PVOutput.org B-5 Figure B-5 Comparison between adjusted AEMO estimates and sample systems in Melbourne B-6 Figure C-1 Daily average summer rooftop PV generation curve for New South Wales (and the Australian Capital Territory) C-1 Figure C-2 Daily average summer rooftop PV generation curve for Queensland C-2 Figure C-3 Daily average summer rooftop PV generation curve for South Australia C-3 Figure C-4 Daily average winter rooftop PV generation curve for Tasmania C-4 Figure C-5 Daily average summer rooftop PV generation curve for Victoria C-5 Figure D-1 Comparison of AEMO and non-aemo rooftop PV installed capacity forecasts for the NEM D-2 AEMO 2012 Tables vii
8
9 CHAPTER 1 - INTRODUCTION 1.1 National Electricity Forecasting AEMO has changed the way it develops and publishes demand forecasts for the electricity industry. AEMO is for the first time developing an independent set of electricity demand forecasts for each of the five NEM regions. AEMO is ideally positioned to undertake this project and to lead collaboration with industry to ensure that representative and reliable forecasts are produced on a consistent basis across all NEM regions. These forecasts are used for both operational purposes, including the calculation of marginal loss factors, and as a key input into AEMO s national transmission planning role. It is therefore necessary for AEMO to know how these forecasts are developed, and to ensure forecasting processes and assumptions are consistent across regions, to make certain they are suitable for purpose. This contrasts with in the past, AEMO published demand forecasts in a series of AEMO publications, namely the Electricity Statement of Opportunities (ESOO), the Victorian Annual Planning Report (VAPR), and the South Australian Supply and Demand Outlook (SASDO). AEMO developed demand forecasts for South Australia and Victoria, whilst the regional transmission network service providers (TNSPs) developed demand forecasts for the remaining three regions in the National Electricity Market (NEM), namely Queensland, New South Wales (including the Australian Capital Territory), and Tasmania. Through this new approach to increase the transparency of the forecasting process and to stimulate discussion with members of the electricity industry, AEMO intends to publish five information papers and reports: Economic Outlook Information Paper AEMO s assessment of the work undertaken by the National Institute of Economic and Industry Research (NIEIR). Rooftop PV Information Paper Quantifying the impact of rooftop photovoltaic (PV) on the electricity market NEM Demand Review Information Paper A review of NEM demand. Forecasting Methodology Information Paper A description of the AEMO modelling process used to develop demand forecasts National Electricity Forecasting Report (NEFR) The main forecasting report presenting new electricity demand forecasts for the five NEM regions. Figure 1-1 shows how all the work behind the forecasts comes together and how we publish it this year. As this is the first time that AEMO has developed these electricity forecasts across the NEM, there is still work to be done to improve the way AEMO forecasts. Over the next couple of years, AEMO will continue to improve the data, modelling, and interpretation that underpin these forecasts, and engage with industry on an ongoing basis to ensure an open and transparent process. AEMO 2012 Introduction 1

10
11 from alternative generation. When estimating historical demand or forecasting future demand, it is important to account for the contribution made by rooftop PV systems. There has been a strong uptake of rooftop PV systems in the past few years to meet growing demand for electricity generated by renewable resources. AEMO has found that by not accounting for the contribution rooftop PV makes to historical demand data, consumer demand may be underestimated. In comparison, by not accounting for the contribution rooftop PV makes to demand forecasts, the future requirements of off-site electricity generation may be overestimated. This paper forecasts the uptake of rooftop PV and its impact on electricity demand for the 20-year outlook period from 2012 to The forecasts do not differentiate PV generation by the tariff received. The analysis presented in this paper will form part of the of the electricity forecasts which will be published in the June 2012 forecasting report, and this is explained further in the next section Modelling electricity demand AEMO s demand forecasts are dependent in the long-run on economic variables and short run seasonal variations in the weather. For each of the five NEM regions, the modelling process involves: Developing models based on historical relationships between electricity usage and demographic, economic and weather input variables. Using models to predict the future path of electricity usage based on input variables defined according to various scenarios. Adjusting the projected electricity usage trends to account for expected changes in large spot loads, energy efficiency measures, rooftop PV generation, electric vehicle charging, network losses and generator auxiliary loads to produce the published annual energy forecasts and understand how much of this demand will be served by the NEM. Determining the frequency distribution of maximum demand by using the annual energy forecasts as a key input into the half-hourly models that represent time and weather-based variation. A detailed explanation of this modelling process will be provided alongside the forecasting report due for release in June Content of paper Chapter 1, Introduction, provides background information and summarises the impact of rooftop PV forecasts on demand. Chapter 2, Definitions, processes and methodology, provides a description of drivers, scenarios and a short overview of the approach used to develop rooftop PV estimates discussed in subsequent chapters. Chapter 3, Rooftop PV in the NEM, presents estimates for installed capacity and annual energy generation for the NEM. Chapter 4, Regional rooftop PV, presents estimates for installed capacity, annual energy generation and maximum demand for each of the five NEM regions. Appendix A, Data sources, outlines the data sources used to undertake the analysis discussed in this information paper. Appendix B, Methodology, provides further discussion of the methodology used to undertake the analysis discussed in this information paper. Appendix C, Regional rooftop PV generation curves, presents average summer/winter rooftop PV daily generation curves for each of the five NEM regions. Appendix D, Non-AEMO rooftop PV capacity forecasts, presents recent non-aemo rooftop PV forecasts and compares them to the AEMO forecasts presented in this information paper. AEMO 2012 Introduction 3
12
13

14

15

16
17 The scenarios do not differentiate between current feed-in regimes applicable in each state. Also, the retail electricity price forecasts do not apply the full price rises set by regulators for several states. For these reasons, the simple payback results should be considered indicative only, and may not be accurate for the first few years of the outlook period. Household and business sensitivity to the payback period is not known. However, it seems likely that payback periods approaching 10 years will be unattractive, as the system s inverter may need to be replaced around this time. On the other hand, payback periods of 3 years or less may even entice households and businesses with short investment horizons, such as renters Barriers to uptake Physical constraints within distribution networks can limit uptake volume. For example, to feed excess energy into the distribution network, rooftop PV systems must generate power at a higher voltage than in the street. If several systems do this simultaneously, this raises the street voltage. If the street voltage exceeds the threshold of a rooftop PV system, it will shut down and the system s owner will be deprived of expected revenue. Anecdotal reports indicate that to prevent this, some distribution businesses are already imposing restrictions on the size of rooftop PV connections. However, alleviating this constraint involves distribution network augmentation. In the future, household electricity storage could also play a role. Analysis of physical limitations is beyond the scope of this report. For forecasting purposes it is assumed they may delay installations in some localities, but will not affect overall uptake across the NEM. Another potential barrier is the ability of the solar industry to service the rate of uptake. Given the industry s track record during the rapid expansion of the last two years, this is not expected to be a problem Saturation capacity Forecasting installed capacity requires information about the extent of suitable roof space for rooftop PV installation. The AEMO forecast accounts for all systems that offset consumption behind-the-meter, with the majority being rooftop installations. There are three major assumptions about saturation: 7 The average system size per dwelling is 3.5 kw. The number of suitable dwellings in NEM regions at the last census (2006) was estimated to be the number of occupied, detached houses, plus 30% of other dwelling types, with an additional allowance for commercial installations. The uptake rate (even at saturation) is only 75%. Saturation capacity was then calculated as the total number of suitable dwellings multiplied by the 75% uptake rate and the 3.5 kw average, resulting in a saturation capacity of 17,841 MW for the NEM in AEMO used the forecast number of households to calculate saturation capacity forecasts for the outlook period. 8 The 2006 saturation capacity was multiplied by the household growth ratio since 2006, resulting in capacities of 21,339 MW in 2022 and 22,922 MW in 2031 for the NEM. These estimates will be revised as more comprehensive rooftop PV saturation studies become available. 7 Refer to Appendix B. 8 AEMO Economic Outlook, electronic information, MC05 scenario. AEMO 2012 Definitions, process and methodology 9

18
19 CHAPTER 3 - ROOFTOP PV IN THE NEM This chapter presents information about estimates of rooftop PV uptake. This is the first time AEMO has undertaken a study of this type, and the methodology will continue to develop. However, this first step has provided insight into the current setting of rooftop PV and its impact on the NEM. The historical and forecast estimates for the NEM are an aggregation of each of the five NEM regions. A discussion at the region level is provided in the next chapter. 3.1 Installed capacity AEMO independently studied rooftop PV to understand the current and forecast impact of rooftop PV on the NEM. Other organisations have also estimated the future uptake of rooftop PV, producing a diverse range of views. For information about these alternative forecasts for rooftop PV and a comparison with AEMO s forecasts see Appendix D. The analysis discussed in this section forms the basis for AEMO s energy forecast calculations Historical analysis The historical data used in the analysis of installed capacity was collected from the distribution businesses and the Clean Energy Regulator (CER). 9 There are discrepancies between these two data sources, in particular an inherent lag in the CER data, which can take up to 12 months to be published. Until the start of 2010, the level of rooftop PV uptake in the NEM was too small to make a material impact on overall electricity demand. The number of installations rose dramatically in 2010 and 2011, reaching an estimated capacity of 1,450 MW at the end of February This increase was largely driven by improved payback of rooftop PV systems, due to incentives such as state government feed-in tariffs, falling system prices, and rising retail electricity tariffs. The estimated average rate of uptake in 2010 and 2011 was 28 MW and 74 MW per month, respectively AEMO installed capacity forecast For the NEM as a whole, uptake to 2017 is expected to be relatively restrained, averaging 320 MW per year under the moderate uptake scenario. This rate is slower than the estimated uptake in 2010, and is influenced by two main factors: Feed-in tariffs in most states have been withdrawn or reduced, lowering economic payback. Demand has been reduced by installations brought forward to 2011 to beat rebate cut-off dates. 10 From 2018 to 2025, economic payback is expected to improve strongly, with innovative financing reducing the problem of up-front payment, and commercial buildings joining the trend. The moderate uptake scenario sees this accelerate, averaging 620 MW per year, while the rapid uptake scenario forecasts new installations to average 1,130 MW per year. The slow uptake scenario misses out on this phase, suppressed by relatively poor payback. From 2026 to 2031, payback is expected to improve. Uptake is forecast to continue strongly for newly-built dwellings, and for upgrades or replacements of existing systems. Fresh installations on existing dwellings may start to slow, as the most suitable dwellings have already been taken by earlier installations. Growth may slow in 9 The Office of the Renewable Energy Regulator (ORER) was amalgamated into the Clean Energy Regulator on April 2, The STC solar multiplier is due to fall from 3 to 2 on 1 July 2012, and from 2 to 1 on 1 July AEMO 2012 Rooftop PV in the NEM 11

20
21
22
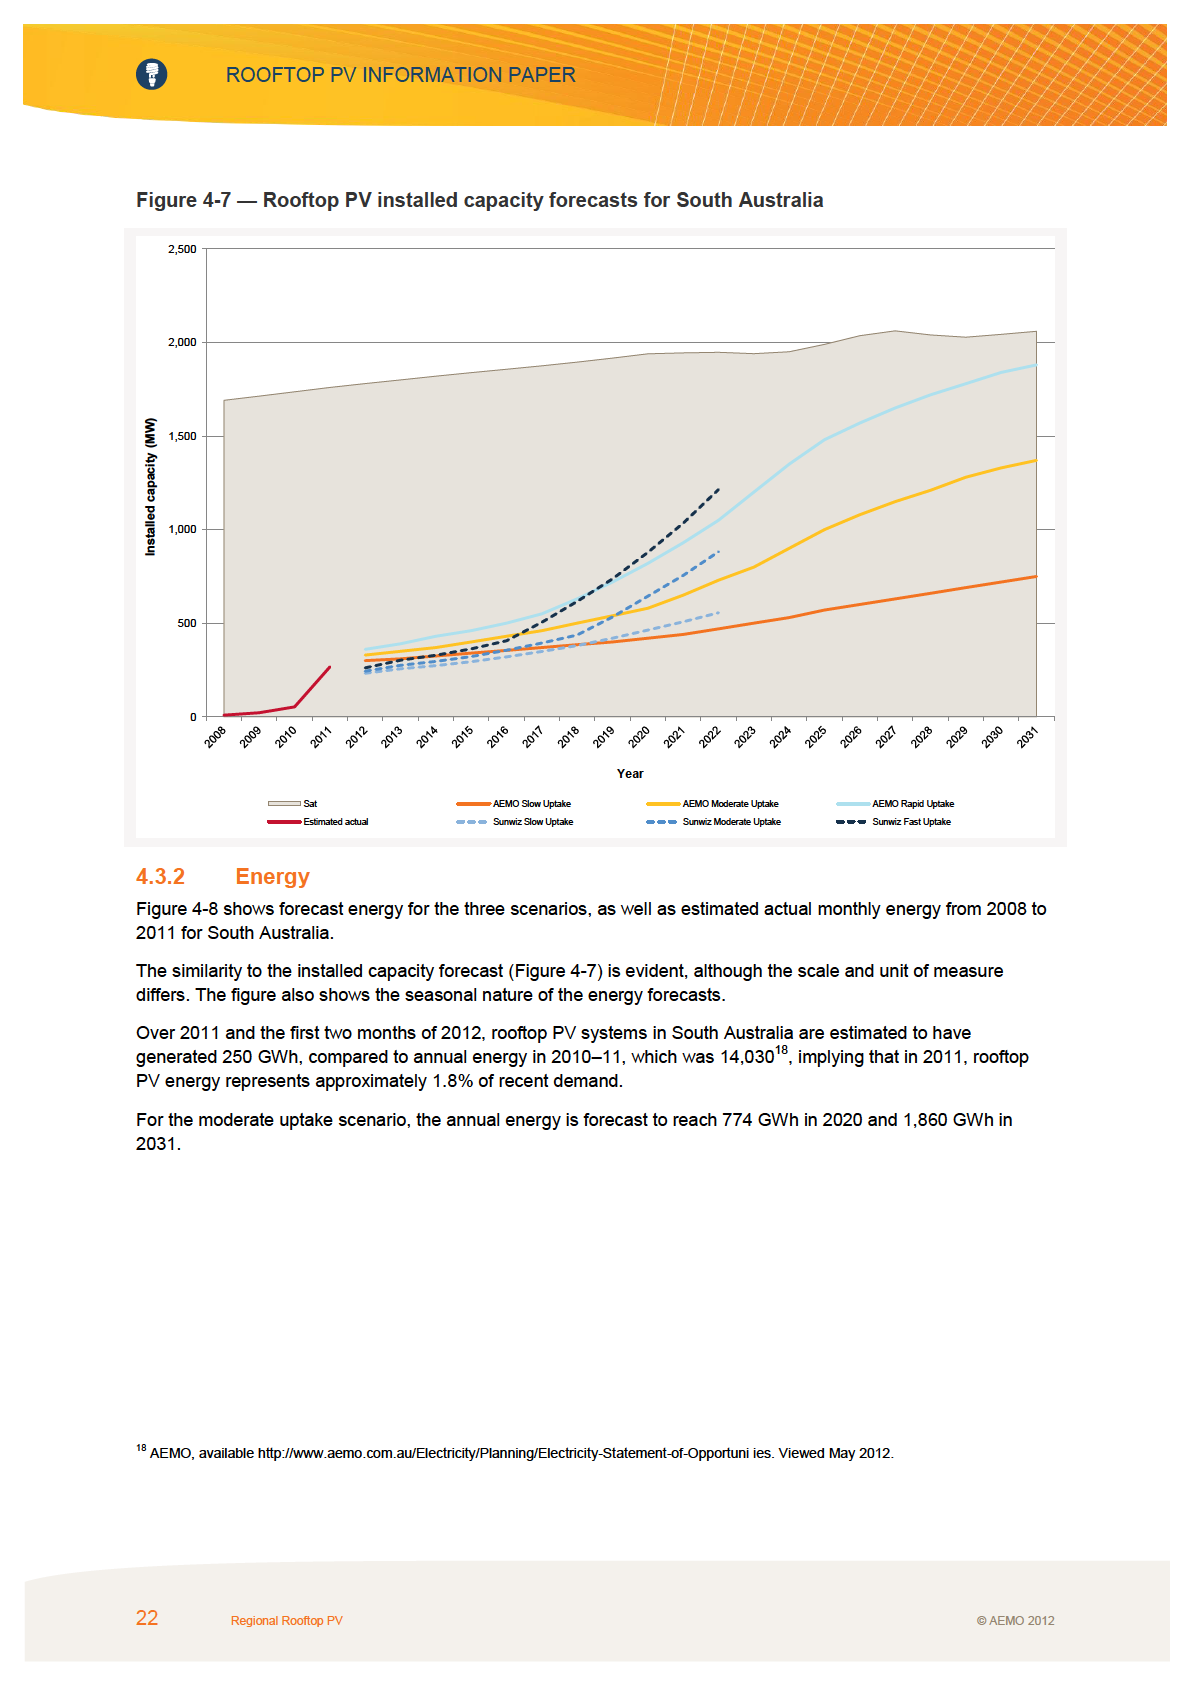
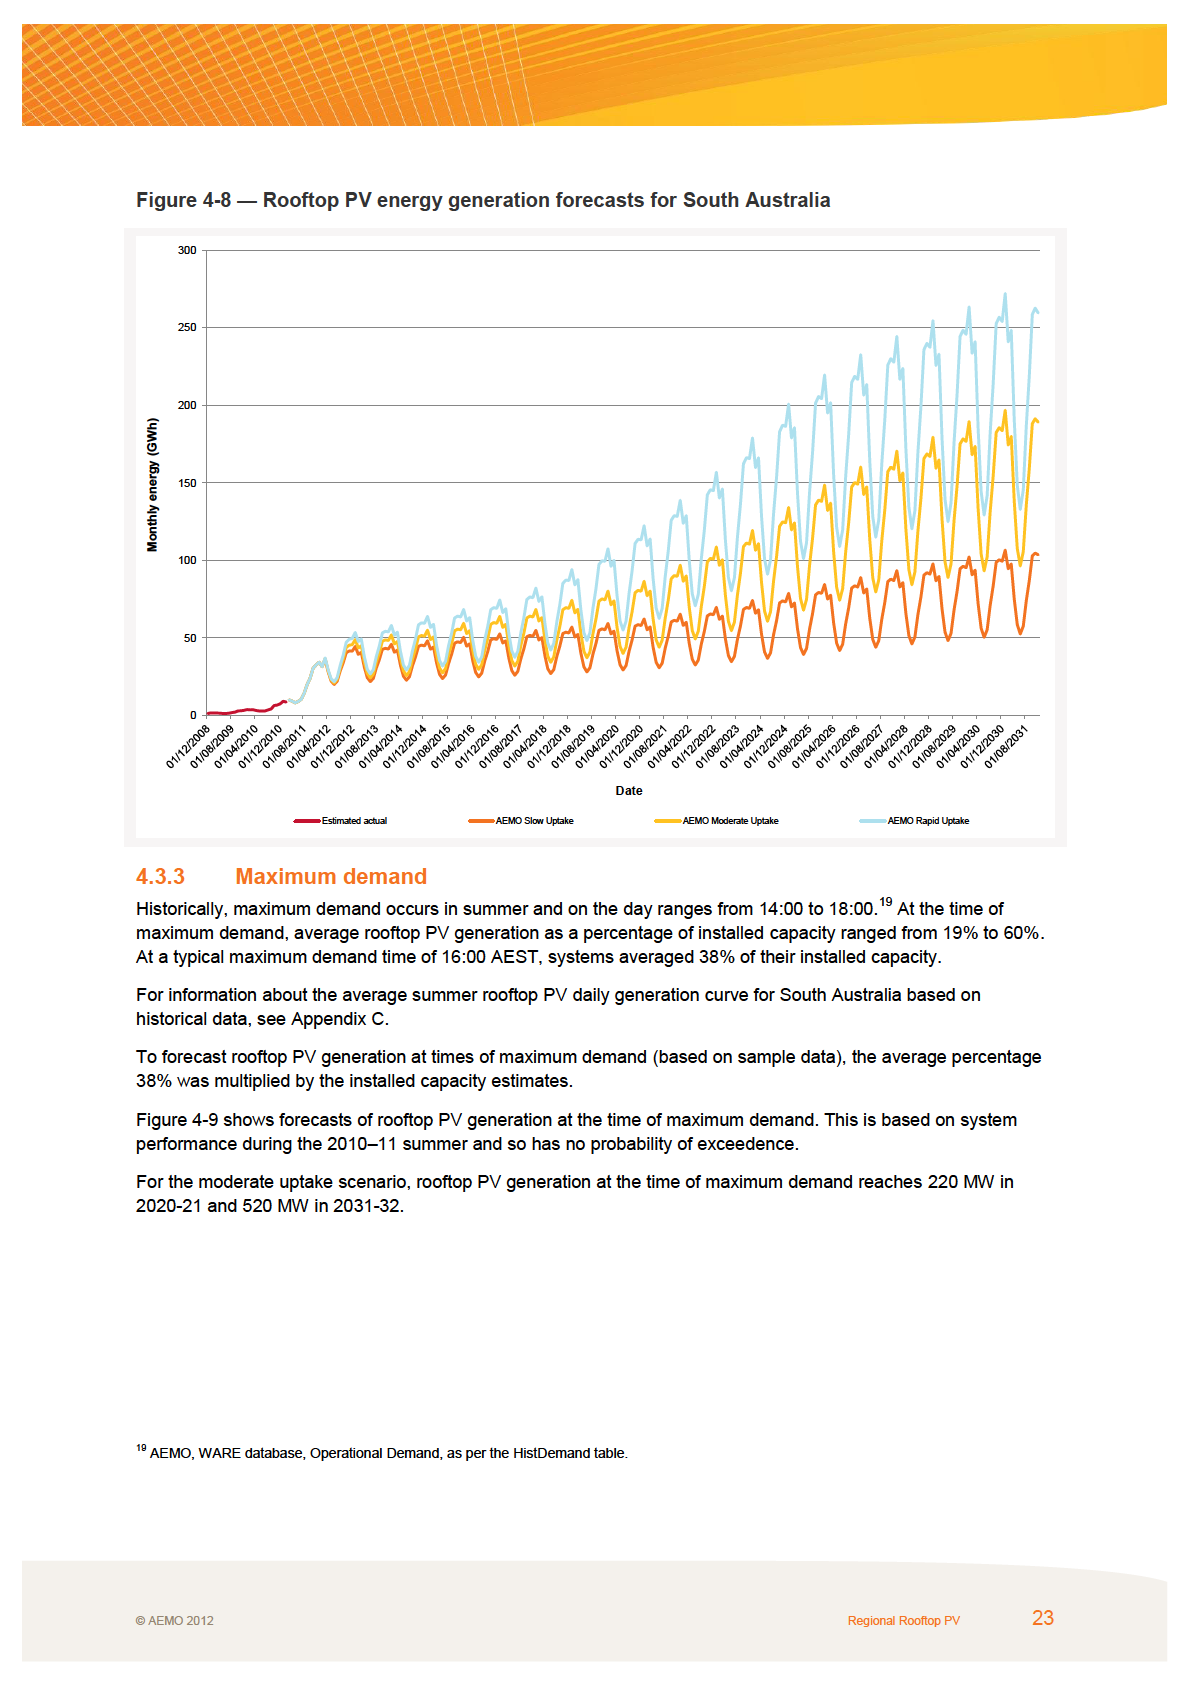
23 CHAPTER 4 - REGIONAL ROOFTOP PV This chapter provides information about historical and forecast installed capacity estimates for rooftop PV in each region. Providing an initial overall picture of rooftop PV, additional data mining work is required to develop the results. Installed capacity is defined as the installed rooftop PV s rated panel capacity. 4.1 New South Wales (and the Australian Capital Territory) Installed capacity The forecasts use historical estimates of installed capacity growth in New South Wales (including the Australian Capital Territory). At the end of February 2012, the estimated total rooftop PV installed capacity in New South Wales (including the Australian Capital Territory) was 461 MW. Uptake was significant in early 2011, but slowed after the gross feed-intariff was closed to new customers in April Figure 4-1 shows the installed capacity forecast for each of the three scenarios. It also plots estimated historical data, estimated saturation capacity, and a set of independent forecasts developed by SunWiz 11, which were commissioned by AEMO for comparison. Forecast uptake in the short term is expected to be low, relative to This is a continuation of the slowdown observed since mid In the medium term, uptake diverges depending on the scenario. In the long term, the rate of uptake under the rapid uptake scenario begins to slow, as the installed capacity approaches the estimated saturation capacity. For the moderate uptake scenario, the installed capacity reaches 1,870 MW in 2020 and 4,450 MW in Viewed May AEMO 2012 Regional Rooftop PV 15
24

25

26

27

28
29
30
31
32
33

34

35

36
37
38
39 APPENDIX A - DATA SOURCES The rooftop PV analysis required historical data for the number of rooftop PV systems, capacity, and output. Metering data represents the ideal data source, however, most regions only use a net meter, measuring the difference between generation and household or business consumption. Even in regions where the total PV output is measured, the number of installed systems (over 200,000 in New South Wales and the Australian Capital Territory) makes monitoring the output from all systems problematic. Work has commenced to identify and extract metering data for New South Wales, but was not available in time for this publication. As an alternative, AEMO used estimated installed capacity, energy, and maximum demand as data sources to undertake this analysis. A.1 Installed capacity A.1.1 Distribution businesses Unlike large generating systems, rooftop PV systems do not need to be registered in the NEM. As a result, there is not one central source of information on rooftop PV installations. However, their connection to the power system does need be approved by the local electricity distribution business. There are thirteen distribution businesses throughout the NEM, with a variety of processes to record information about rooftop PV systems. Distribution businesses may have several reasons to collect this information: To track and report the progress of state government incentive schemes. Planning for system augmentation. Supporting internal commercial analysis. In November 2011, AEMO approached the distribution businesses for information about installed rooftop PV systems located in their areas. This data provides a snapshot at the end of each month commencing from December 2008, including the number of systems and the total installed capacity, and AEMO has started collecting this data twice a year (September and March). Due to the diversity of record-keeping, not all distribution businesses were able to supply a full data set for several reasons: Missing months. Differing definitions (for example, inverter capacity instead of panel capacity). Differing scope (for example, including only installations receiving a particular feed-in tariff). AEMO has made assumptions where necessary to compile a complete data set. AEMO 2012 Data sources A-1

40
41 A.2.2 Historical solar intensity The average daily exposure was obtained from the Australian Government Bureau of Meteorology, aggregated on a monthly basis for each capital city. The unit of measure for this data is megajoules (MJ) per square meter. Gaps in the data were filled by substituting the value from the previous year. A.2.3 Actual generation from a sample of systems Rooftop PV energy data was obtained from PVOutput.org. This website records actual historical generation for individual systems, collected and released by system owners. A.3 Maximum demand Maximum demand is measured at half-hourly intervals in megawatts (MW). To estimate the output of rooftop PV systems at the time of the maximum demand, sample data for maximum system days was obtained on a regional basis from the website PVOutput.org for the last summer (or winter in the case of Tasmania). AEMO 2012 Data sources A-3
42
43 APPENDIX B - METHODOLOGY B.1 Saturation B.1.1 City of Port Phillip study The Victorian Government Department of Sustainability and Environment commissioned Entura Hydro Tasmania to undertake a study of saturation capacity of rooftop PV systems in the City of Port Phillip in Melbourne. 5 Rooftops were mapped with aerial lasers, analysed by computer and a sample verified manually. Allowing for roof orientation and tilt, solar exposure, shading, irregular geometry and minimum size it was found that at a conservative estimate, the City of Port Phillip could support 220 MW of rooftop PV capacity. This comprised 180 MW on dwellings and 40 MW on large flat roofs, which were taken to be commercial. B.1.2 Calculating saturation capacity forecasts According to the latest census, the City of Port Phillip is very densely populated by Australian standards. Only fourteen percent of its 43,728 occupied private dwellings are separate houses, with the majority being units and apartments. By comparison, the Australian average is 75%. Dividing the City s estimated residential potential of 180 MW by the number of occupied private dwellings results in an average installed capacity per dwelling of over 4 kw. In the absence of a more comprehensive study, the City of Port Phillip result was used as the starting point for an assessment of the NEM s installed capacity at saturation. Due to the small size of the study, conservative assumptions were applied. First, the average system size per household for saturation was reduced from 4 kw to 3.5 kw. This allows for aesthetic considerations and site-specific installation constraints that may not have been apparent in the Entura study. Given the limited roof space of dwellings in the City of Port Phillip, a 3.5 kw average at saturation should be conservative when applied to the entire NEM. Across the outlook period, the roof space per dwelling is forecast to increase, since the average size of newly-built houses is larger than the current average size of all dwellings. Also, as solar panel efficiency increases, the capacity will increase for a given roof area. These factors are not considered when calculating an estimate for saturation, which is again conservative. As a point of comparison, the average capacity of installations in the six months from September 2011 to February 2012 was estimated to be 3 kw, based on data from distribution businesses. Second, it was assumed that the uptake rate even at saturation would only be 75%. Some rooftops will remain bare even if a rooftop PV installation makes economic sense for reasons including the following: Restrictions by authorities (for example, heritage overlays). Aesthetic considerations. Lack of interest or awareness. Lack of incentive in rental properties. Lack of agreement by building management (for example, body corporate). The number of suitable dwellings in NEM regions at the last census (2006) was estimated as the number of occupied, detached houses, plus 30% of other dwelling types. An additional allowance for commercial installations was added, using the ratio of residential to commercial capacity in the Port Phillip study. 5 Viewed May 2012 AEMO 2012 Methodology B-1

44
45
46

47

48
49
50
51
52
53
54
55 APPENDIX D - NON-AEMO ROOFTOP PV CAPACITY FORECASTS In 2011 and early 2012, several organisations estimated the future uptake of rooftop PV. These forecasts were prepared for a variety of different purposes: Forecasting Small-scale Technology Certificates creation. Predicting the growth of the PV industry in Australia. Informing long-term government energy policy. The estimates have also been calculated at various different levels: For the whole of Australia. NEM-wide. Behind-the-meter generation only. All solar installations, including large solar farms. PV only. PV and solar thermal jointly. As a result, the non-aemo forecasts are not a direct comparison with the AEMO forecasts for the NEM (see Chapter 3), but provide a good indication about whether the AEMO estimates are reasonable. The lack of certainty surrounding future rooftop PV uptake is demonstrated by the diversity in these forecasts, with two main groupings being apparent: Organisations focusing on renewable energy (for example, SunWiz, Suntech Australia, and Beyond Zero). Public organisations or consultants engaged by them (for example, the Bureau of Resources and Energy Economics and the Australian Government Department of Resources, Energy and Tourism). Forecasts developed by the second group are noticeably lower than those by the first group for several reasons: The forecasts in general are older so do not account for the acceleration in The documents may have a longer gestation period, making their available data even less fresh. A more conservative approach may have been taken. Figure D-1 shows the AEMO rooftop PV installed capacity forecasts, and compares them to a range of non-aemo forecasts. Historical data has been included with 2011 data including installations in January and February 2012, and the estimated saturation capacity is shown as the grey background area. AEMO 2012 Non-AEMO rooftop PV capacity forecasts D-1

56
57 Table D-1 Scope of non-aemo rooftop PV forecasts for Australia Organisation Geographic scope Scope Forecast date 2020 forecast 2030 forecast SunWiz NEM only. Behind-the-meter. March ,516 SKM/MMA NEM only. PV attracting STCs only. 13 December Green Energy Markets Australia. PV attracting STCs only. December ACIL Tasman Australia. PV attracting STCs only. December AER Australia. PV attracting STCs only. 25 November ,136 DRET Australia. PV and solar thermal. 13 December ,900 a Suntech Australia Australia. PV. 16 November ,000 Roam Consulting Australia. PV. 11 March ,260 BREE Australia. PV and solar thermal. December ,044 3,805 b Beyond Zero Australia. PV. March ,000 c 30,000 c a. Capacity in MW is inferred from an energy forecast, assuming a 1 kw system averages 3.6 kwh per day. b. This forecast is for 2035 rather than c. Assessment of capability rather than a forecast. Table D-2 shows a reference list of the non-aemo compiled forecasts for Australia. AEMO 2012 Non-AEMO rooftop PV capacity forecasts D-3
58
59 DISCLAIMER This publication has been prepared by the Australian Energy Market Operator Limited (AEMO) as part of a series of information papers about the development of AEMO s demand forecasts for the National Electricity Market for onwards, to be used for AEMO s planning and operational functions under the National Electricity Rules. This publication may contain data provided by or collected from third parties, and conclusions, opinions, assumptions or forecasts that are based on that data. AEMO does not warrant or represent that the information in this publication (including statements, opinions, forecasts and third party data) is accurate, complete or current, or that it may be relied on for any particular purpose. Anyone proposing to rely on or use any information in this publication should independently verify and check its accuracy, completeness, reliability and suitability for purpose, and should obtain independent and specific advice from appropriate experts. To the maximum extent permitted by law, neither AEMO, nor any of AEMO s advisers, consultants or other contributors to this publication (or their respective associated companies, businesses, partners, directors, officers or employees) shall have any liability (however arising) for any information or other matter contained in or derived from, or for any omission from, this publication, or for a person s use of or reliance on that information. Copyright Notice Australian Energy Market Operator Ltd. This publication is protected by copyright and may be used provided appropriate acknowledgement of the source is published as well. Acknowledgements AEMO acknowledges the support, co-operation and contribution of all participants in providing the data and information used in this publication, including SP-Ausnet, Powercor, Jemena, Citipower, United Energy, Aurora Energy, ETSA Utilities, Ausgrid, Essential Energy, Endeavour Energy, ActewAGL, Ergon Energy and Energex. AEMO 2012 Disclaimer E-1
60
NATIONAL ELECTRICITY FORECASTING REPORT. For the National Electricity Market
 NATIONAL ELECTRICITY FORECASTING REPORT For the National Electricity Market 2013 NATIONAL ELECTRICITY FORECASTING REPORT Important Notice This document is subject to an important disclaimer that limits
NATIONAL ELECTRICITY FORECASTING REPORT FOR THE NATIONAL ELECTRICITY MARKET
 NATIONAL ELECTRICITY FORECASTING REPORT FOR THE NATIONAL ELECTRICITY MARKET Published: JUNE 2014 Copyright 2014. Australian Energy Market Operator Limited. The material in this publication may be used
Possible future retail electricity price movements: 1 July 2012 to 30 June 2015
 ELECTRICITY PRICE TRENDS FINAL REPORT Possible future retail electricity price movements: 1 July 2012 to 30 June 2015 22 March 2013 Reference: EPR0029 Electricity price trends report EMBARGO until 22 March
APRIL 2014 ELECTRICITY PRICES AND NETWORK COSTS
 APRIL 2014 ELECTRICITY PRICES AND NETWORK COSTS 1 WHAT MAKES UP THE RETAIL ELECTRICITY BILL? Retail electricity bills are made up of a number of components: Wholesale costs reflecting electricity generation
AEMC Electricity Price Trends report released
 AEMC Electricity Price Trends report released AUSTRALIAN ENERGY MARKET COMMISSION LEVEL 5, 201 ELIZABETH STREET SYDNEY NSW 2000 T: 02 8296 7800 E: AEMC@AEMC.GOV.AU W: WWW.AEMC.GOV.AU The Australian Energy
NATIONAL ELECTRICITY FORECASTING
 2011 NATIONAL ELECTRICITY FORECASTING Information Paper - December 2011 Published by AEMO Australian Energy Market Operator ABN 94 072 010 327 Copyright 2011 AEMO AEMO 2011 NATIONAL ELECTRICITY FORECASTING
2014 Residential Electricity Price Trends
 FINAL REPORT 2014 Residential Electricity Price Trends To COAG Energy Council 5 December 2014 Reference: EPR0040 2014 Residential Price Trends Inquiries Australian Energy Market Commission PO Box A2449
Small-scale technology certificates Data modelling for 2015 to 2017
 Small-scale technology certificates Data modelling for 2015 to 2017 Report to the Clean Energy Regulator December 2014 2 Domville Ave Hawthorn VIC 3122 T: 03 9805 0777 F: 03 9815 1066 admin@greenmarkets.com.au
Energex. Statement of expected price trends. 1 July 2014 to 30 June 2015. -1-2014/15 Statement of expected price trends
 Energex Statement of expected price trends 1 July 2014 to 30 June 2015-1- 2014/15 Statement of expected price trends Version control Version Date Description 1.0 16 June 2013 Published on Energex s website
Western Australian Feed-In Tariff Discussion Paper
 Western Australian Feed-In Tariff Discussion Paper OVERVIEW In September 2008, the incoming State Government announced its intention to introduce a feed-in tariff as part of the Liberal Plan for Environmental
Clean Energy Council submission to Queensland Competition Authority Regulated Retail Electricity Prices for 2014-15 Interim Consultation Paper
 Clean Energy Council submission to Queensland Competition Authority Regulated Retail Electricity Prices for 2014-15 Interim Consultation Paper Executive Summary The Clean Energy Council (CEC) supports
2013 Residential Electricity Price Trends
 FINAL REPORT 2013 Residential Electricity Price Trends 13 December 2013 Reference: EPR0036 Final Report Inquiries Australian Energy Market Commission PO Box A2449 Sydney South NSW 1235 E: aemc@aemc.gov.au
Renewable Energy in Victoria
 Renewable Energy in Victoria report 2012 Executive summary The Renewable Energy in Victoria 2012 report provides an overview of Victoria s electricity generation from renewable energy sources in the 2012
FACT SHEET. NEM fast facts:
 (NEM) operates on one of the world s longest interconnected power systems, stretching from Port Douglas in Queensland to Port Lincoln in South Australia and across the Bass Strait to Tasmania a distance
Causes of residential electricity bill changes in Victoria, 1995 to 2013. prepared for: Victorian Electricity Distribution Businesses
 Causes of residential electricity bill changes in Victoria, 1995 to 2013 prepared for: Victorian Electricity Distribution Businesses DISCLAIMER This report has been prepared for the Victorian electricity
ECONOMIC OUTLOOK INFORMATION PAPER. National Electricity Forecasting
 ECONOMIC OUTLOOK INFORMATION PAPER National Electricity Forecasting 2012 ECONOMIC OUTLOOK INFORMATION PAPER Published by AEMO Australian Energy Market Operator ABN 94 072 010 327 Copyright 2012 AEMO ii
Energy consumption forecasts
 Pty Ltd ABN 85 082 464 622 Level 2 / 21 Kirksway Place Hobart TAS 7000 www.auroraenergy.com.au Enquiries regarding this document should be addressed to: Network Regulatory Manager Pty Ltd GPO Box 191 Hobart
Solar Power Frequently Asked Questions
 General information about solar power 1. How do I get solar power? Solar Power Frequently Asked Questions Many companies install solar power systems including some electricity retailers. It is worth comparing
ELECTRICITY FROM RENEWABLE ENERGY IN VICTORIA 2011 June 2012
 ELECTRICITY FROM RENEWABLE ENERGY IN VICTORIA 2011 June 2012 Executive Summary This report provides an overview of Victoria s electricity generation from renewable energy sources in 2012. The report presents
Western Australia and the Northern Territory are not connected to the NEM, primarily due to the distance between networks.
 Australia has one of the world s longest alternating current (AC) systems, stretching from Port Douglas in Queensland to Port Lincoln in South Australia and across the Bass Strait to Tasmania a distance
ISBN 978-0-7246-5379-9. Copyright
 Comparison of Australian Standing Offer Energy Prices as at 1 July 2015 Printed October 2015 Office of the Tasmanian Economic Regulator Level 3, 21 Murray Street, Hobart TAS 7000 GPO Box 770, Hobart TAS
Victorian electricity sales and peak demand forecasts to 2024-25 SUMMARY REPORT
 Victorian electricity sales and peak demand forecasts to 2024-25 SUMMARY REPORT Prepared by the National Institute of Economic and Industry Research (NIEIR) ABN: 72 006 234 626 416 Queens Parade, Clifton
PV INTEGRATION ON AUSTRALIAN DISTRIBUTION NETWORKS
 PV INTEGRATION ON AUSTRALIAN DISTRIBUTION NETWORKS Literature Review By The Australian PV Association September 2013 Author: Ben Noone, Centre for Energy and Environmental Markets, University of NSW ACKNOWLEDGEMENTS
Page 1 of 11. F u t u r e M e l b o u r n e C o m m i t t e e Agenda Item 7.1. Notice of Motion: Cr Wood, Renewable Energy Target 9 September 2014
 Page 1 of 11 F u t u r e M e l b o u r n e C o m m i t t e e Agenda Item 7.1 Notice of Motion: Cr Wood, Renewable Energy Target 9 September 2014 Motion 1. That Council resolves that the Chair of the Environment
Past and projected future components of electricity supply to the ACT, and resultant emissions intensity of electricity supplied
 Past and projected future components of electricity supply to the ACT, and resultant emissions intensity of electricity supplied transport community industrial & mining carbon & energy Prepared for: ACT
August 2014. Industry Report: SolarBusinessServices. Solar Businesses in Australia. Prepared for: Rec Agents Association
 August 2014 Prepared by: Industry Report: SolarBusinessServices Prepared for: Solar Businesses in Australia Rec Agents Association P a g e 1 RAA Industry Report Solar Businesses in Australia Final 2014
APPENDIX 15. Review of demand and energy forecasting methodologies Frontier Economics
 APPENDIX 15 Review of demand and energy forecasting methodologies Frontier Economics Energex regulatory proposal October 2014 Assessment of Energex s energy consumption and system demand forecasting procedures
Causes of residential electricity bill changes in Victoria, 1995 to 2014. prepared for: Victorian Electricity Distribution Businesses
 Causes of residential electricity bill changes in Victoria, 1995 to 2014 prepared for: Victorian Electricity Distribution Businesses DISCLAIMER This report has been prepared for the Victorian Electricity
Committee on the Northern Territory s Energy Future. Electricity Pricing Options. Submission from Power and Water Corporation
 Committee on the Northern Territory s Energy Future Electricity Pricing Options Submission from Power and Water Corporation October 2014 Power and Water Corporation 1. INTRODUCTION On 21 August 2014, the
Small-scale Technology Certificates Data Modelling for 2014 to 2016 FINAL REPORT
 Small-scale Technology Certificates Data Modelling for 2014 to 2016 FINAL REPORT 30 January 2014 SKM MMA ABN 37 001 024 095 Level 11, 452 Flinders Street Melbourne VIC 3000 Australia Tel: +61 3 8668 6090
Consumer guide. be brighter. actewagl.com.au/solar solar@actewagl.com.au 13 14 93
 be brighter. Consumer guide. Your guide on how solar works, how much you can save on your electricity bills and how to choose the right provider and system for you. actewagl.com.au/solar solar@actewagl.com.au
state of the energy market 2012
 State of the energy market 2012 state of the energy market 2012 Australian Energy Regulator Level 35, The Tower, 360 Elizabeth Street, Melbourne Central, Melbourne, Victoria 3000 Email: AERInquiry@aer.gov.au
Understanding Network Tariff Reform
 Understanding Network Tariff Reform A guide for small to medium business and residential customers who use less than 100MWh of electricity a year Ergon Energy is restructuring the way it charges for the
Australian Remote Renewables: Opportunities for Investment
 Australian Remote Renewables: Opportunities for Investment The largely untapped remote clean energy market and funding support available from the Australian Government creates an attractive opportunity
Retailer Margins in Victoria s Electricity Market. Discussion Paper
 Retailer Margins in Victoria s Electricity Market Discussion Paper May 2013 An appropriate citation for this paper is: Essential Services Commission 2013, Retailer Margins in Victoria s Electricity Market
Network Pricing and Enabling Metering Analysis. Prepared by ENERGEIA for the Energy Networks Association
 Network Pricing and Enabling Metering Analysis Prepared by ENERGEIA for the Energy Networks Association November 2014 Executive Summary Rising electricity bills across the country over the past five years
2008-09 2009-10 2010-11 2011-12 2012- Total 5,926 24,514 66,355 97,042 68,624 262,461 0.6 4.7 22.9 94.3 101.6 224.1
 Jan-10 Mar-10 May-10 Jul-10 Sep-10 Nov-10 Jan-11 Mar-11 May-11 Jul-11 Sep-11 Nov-11 Jan-12 Mar-12 May-12 Jul-12 Sep-12 Nov-12 Jan-13 MW kw Australians have installed more than a million rooftop photovoltaic
National Electricity Amendment (Network Support Payments and Avoided TUoS for Embedded Generators) Rule 2011
 Rule 2011") RULE DETERMINATION National Electricity Amendment (Network Support Payments and Avoided TUoS for Embedded Generators) Rule 2011 Commissioners Pierce Henderson Spalding 22 December 2011 JOHN PIERCE Chairman
RULE DETERMINATION National Electricity Amendment (Network Support Payments and Avoided TUoS for Embedded Generators) Rule 2011 Commissioners Pierce Henderson Spalding 22 December 2011 JOHN PIERCE Chairman
Mid North Coast electricity demand forecasts
 Mid North Coast electricity demand forecasts A review of forecast electricity demand prepared by Essential Energy for the Greater Taree region Prepared for the Australian Energy Market Operator May 2013
ORANGE PAPER JULY 2015 OPPORTUNITIES FOR QUEENSLAND TO BE A WORLD LEADER IN SOLAR DEPLOYMENT
 ORANGE PAPER JULY 2015 OPPORTUNITIES FOR QUEENSLAND TO BE A WORLD LEADER IN SOLAR DEPLOYMENT THE QUEENSLAND FUTURES INSTITUTE (QFI) SUPPORTS GREATER USE OF SOLAR GENERATION IN THE QUEENSLAND ELECTRICITY
INSTITUTE FOR SUSTAINABLE FUTURES NSW BUSINESS ENERGY PRICES TO 2020
 INSTITUTE FOR SUSTAINABLE FUTURES NSW BUSINESS ENERGY PRICES TO 2020 NSW business energy prices to 2020 FINAL REPORT Revision 1 FOR THE NSW OFFICE OF ENVIRONMENT AND HERITAGE AUTHORS NICKY ISON, JAY RUTOVITZ
Understanding what is happening to electricity demand
 Understanding what is happening to electricity demand Hugh Saddler Centre for Climate Economics and Policy Seminar Crawford School, ANU 26 August 2015 TWh TWh Changes in sent out electricity since 2006
Port Jackson Partners
 Port Jackson Partners NOT JUST A CARBON HIT ON ELECTRICITY PRICES Many factors will drive a doubling of electricity prices in many states by 15. This will have a major impact on virtually all businesses.
Energy Savings Agency: The Greens plan to fix Australia s energy system
 Energy Savings Agency: The Greens plan to fix Australia s energy system Our electricity system is in bad shape. Power bills have skyrocketed in recent years, mainly because of unnecessary investment in
FINANCIAL SUPPORT PROGRAMS
 9 FINANCIAL SUPPORT PROGRAMS 108 9 FINANCIAL SUPPORT PROGRAMS 9 FINANCIAL SUPPORT PROGRAMS There are a number of Government support mechanisms to help reduce the barriers to undertaking action on energy
Clean Energy Council submission to the Australian Energy Regulator. Regulation of alternative energy sellers under the National Energy Retail Law
 Clean Energy Council submission to the Australian Energy Regulator Regulation of alternative energy sellers under the National Energy Retail Law Executive Summary This submission supports the framework
Ausgrid Network Pricing Proposal For the Financial Year Ending June 2013. May 2012
 Ausgrid Network Pricing Proposal For the Financial Year Ending June 2013 May 2012 Table of Contents PART 1 APPROACH TO PRICE SETTING 1. INTRODUCTION AND OVERVIEW... 4 2. BACKGROUND... 6 3. PRICING METHODOLOGY...
Power of choice review - giving consumers options in the way they use electricity
 FINAL REPORT Power of choice review - giving consumers options in the way they use electricity 30 November 2012 Reference: EPR0022 Final Report Inquiries Australian Energy Market Commission PO Box A2449
2014 Forecasting Benchmark Survey. Itron, Inc. 12348 High Bluff Drive, Suite 210 San Diego, CA 92130-2650 858-724-2620
 Itron, Inc. 12348 High Bluff Drive, Suite 210 San Diego, CA 92130-2650 858-724-2620 September 16, 2014 For the third year, Itron surveyed energy forecasters across North America with the goal of obtaining
Updated SCER Demand Side Participation Program December 2013
 Updated SCER Demand Side Participation Program December 2013 The Standing Council on Energy and Resources (SCER) has adopted this framework to guide its demand side participation (DSP) work. The framework
Impact of green energy policies on electricity prices
 Impact of green energy policies on electricity prices July 2014 Synergies Economic Consulting Pty Ltd www.synergies.com.au Disclaimer Synergies Economic Consulting (Synergies) and ROAM Consulting (ROAM)
Tasmanian Transmission Revenue Proposal
 Tasmanian Transmission Revenue Proposal An overview for Tasmanian electricity consumers Regulatory control period 1 July 2014 30 June 2019 Tasmanian Networks Pty Ltd About TasNetworks We are Tasmania s
Australian Energy Market Commission
 Australian Energy Market Commission Level 6, 201 Elizabeth Street Sydney NSW 2000 PO Box A2449, Sydney South NSW 1235 P 02 8296 7800 F 02 8296 7899 E aemc@aemc.gov.au ABN 49 236 270 144 www.aemc.gov.au
2013 2017 Gas Access Arrangement Review (GAAR) SP AusNet s Revised Access Arrangement Proposal (RAAP) RAAP Chapter 1: Demand Forecasts
 SP AusNet s Revised Access Arrangement Proposal (RAAP) RAAP Chapter 1: Demand Forecasts") 2013 2017 Gas Access Arrangement Review (GAAR) SP AusNet s Revised Access Arrangement Proposal (RAAP) RAAP Chapter 1: Demand Forecasts Submitted: 9 November 2012 RAAP Chapter 1: Demand Forecasts This chapter
2013 2017 Gas Access Arrangement Review (GAAR) SP AusNet s Revised Access Arrangement Proposal (RAAP) RAAP Chapter 1: Demand Forecasts Submitted: 9 November 2012 RAAP Chapter 1: Demand Forecasts This chapter
2017 19 TasNetworks Regulatory Proposal Expenditure Forecasting Methodology
 2017 19 TasNetworks Regulatory Proposal Expenditure Forecasting Methodology Version Number 1 26 June 2015 Tasmanian Networks Pty Ltd (ACN 167 357 299) Table of contents 1 Introduction... 1 2 Meeting our
Australian Solar Council Submission on Queensland Competition Authority Issues Paper Estimating a Fair and Reasonable Solar Feed-in Tariff for
 Australian Solar Council Submission on Queensland Competition Authority Issues Paper Estimating a Fair and Reasonable Solar Feed-in Tariff for Queensland Dear Sir/Madam Thank you for the opportunity to
MICRO HYDRO FOR THE FARM AND HOME
 MICRO HYDRO FOR THE FARM AND HOME How much can I expect to save? This depends entirely on the available flow, available head (fall) and the duration that the flow is available. Some farms struggle to maintain
TAMPA ELECTRIC COMPANY UNDOCKETED: SOLAR ENERGY IN FLORIDA STAFF S REQUEST FOR COMMENTS INTRODUCTION PAGE 1 OF 1 FILED: JUNE 23, 2015.
 INTRODUCTION PAGE 1 OF 1 Introduction Solar power is an important part of Florida s energy future and can provide a number of benefits to Florida and its citizens by generating power without emissions
Jemena Electricity Networks (Vic) Ltd
 Ltd") Jemena Electricity Networks (Vic) Ltd 2016-20 Electricity Distribution Price Review Regulatory Proposal Attachment 7-12 - Independent analysis of augmentation expenditure Public 30 April 2015 AER augex
Jemena Electricity Networks (Vic) Ltd 2016-20 Electricity Distribution Price Review Regulatory Proposal Attachment 7-12 - Independent analysis of augmentation expenditure Public 30 April 2015 AER augex
Retail Operating Costs A REPORT PREPARED FOR THE ECONOMIC REGULATION AUTHORITY OF WESTERN AUSTRALIA. March 2012
 Retail Operating Costs A REPORT PREPARED FOR THE ECONOMIC REGULATION AUTHORITY OF WESTERN AUSTRALIA March 2012 Frontier Economics Pty. Ltd., Australia. i Frontier Economics March 2012 Public Retail Operating
SA Power Networks Planning for Solar PV? Customer information guide to network connected solar PV inverter systems
 SA Power Networks Planning for Solar PV? Customer information guide to network connected solar PV inverter systems Contents Introduction 3 How solar PV power systems work 4 Solar modules 5 Is solar power
BRIEFING PAPER: GROWING QUEENSLAND COMMUNITY ENERGY
 BRIEFING PAPER: GROWING QUEENSLAND COMMUNITY ENERGY INTRODUCTION Community energy groups in Queensland have developed this briefing paper with support from the Community Power Agency. The briefing paper
Tax Credit Incentives for Residential Solar Photovoltaic in Hawai i
 Tax Credit Incentives for Residential Solar Photovoltaic in Hawai i February 11, 2013 The typical residential solar PV investment has an internal rate of return of 9% even without state tax credits. With
Overview 3 Electricity price increases 4 Capital and operating expenditure 6 Demand side management 7 Issues with sales/demand forecasts 8
 Overview 3 Electricity price increases 4 Capital and operating expenditure 6 Demand side management 7 Issues with sales/demand forecasts 8 2 Business SA is the State s leading business organisation, representing
HEATWAVE 13 17 JANUARY 2014. DATE: 26 January 2014
 PREPARED BY: Systems Capability DATE: 26 January 2014 Contents 1 INTRODUCTION... 3 2 RESERVE LEVELS DURING THE HEATWAVE... 3 2.1 EVENTS ON THE NEM POWER SYSTEM CONTRIBUTING TO LOW RESERVES... 4 2.2 RISKS
2016 ERCOT System Planning Long-Term Hourly Peak Demand and Energy Forecast December 31, 2015
 2016 ERCOT System Planning Long-Term Hourly Peak Demand and Energy Forecast December 31, 2015 2015 Electric Reliability Council of Texas, Inc. All rights reserved. Long-Term Hourly Peak Demand and Energy
Review of the Renewable Energy Target. Expert Panel. Call for Submissions
 Review of the Renewable Energy Target Expert Panel Call for Submissions 5 April 2014 Disclaimer While reasonable efforts have been made to ensure that the contents of this publication are factually correct,
Submission on Proposed Approach to Key Modelling Assumptions for 2014 Review of Renewable Energy Target
 Submission on Proposed Approach to Key Modelling Assumptions for 2014 Review of Renewable Energy Target Dear Sir/Madam Thank you for the opportunity to comment on the Consultation Paper on the Proposed
Review of the Energy Savings Scheme. Position Paper
 Review of the Energy Savings Scheme Position Paper October 2015 Contents Executive summary... 3 Energy Savings Scheme Review Report package... 3 Expanding to gas... 3 Target, penalties and duration...
Electricity network services. Long-term trends in prices and costs
 Electricity network services Long-term trends in prices and costs Contents Executive summary 3 Background 4 Trends in network prices and service 6 Trends in underlying network costs 11 Executive summary
Personal Power Stations: The Australian Market for Micro-Combined Heat and Power to 2021
 Personal Power Stations: The Australian Market for Micro-Combined Heat and Power to 2021 A Private Report for Strategic Research Clients 1.0 Overview Personal power plant technology could cost effectively
Off-grid Hybrid Solar: Market Overview, Business Case & Technical Considerations
 Off-grid Hybrid Solar: Market Overview, Business Case & Technical Considerations Craig Chambers AECOM Australia Pty Ltd of 420 George Street, Sydney, NSW 2000 Australia Keywords : Solar PV, sustainability,
RET review and implications Financing solar
 RET review and implications Financing solar Ric Brazzale, March 2014 SEIA NSW meeting Contents Where are we now installations, STCs market etc Recent target announcement what does it mean? The RET Review
AER Submission. Competition Policy Review Draft Report
 AER Submission Competition Policy Review Draft Report November 2014 1 Introduction The AER is Australia s national energy regulator and an independent decision-making authority. Our responsibilities are
Benefit of the Renewable Energy Target to Australia s Energy Markets and Economy Report to the Clean Energy Council
 Benefit of the Renewable Energy Target to Australia s Energy Markets and Economy Report to the Clean Energy Council August 2012 BENEFITS OF THE RENEWABLE ENERGY TARGET Contents Executive Summary 1 1. Introduction
Value of Distributed Generation
 Value of Distributed Generation Solar PV in Massachusetts April 2015 Overview Distributed energy resources (DERs) like solar photovoltaic (solar PV) systems provide unique value to the electric grid by
Net Energy Metering and the Future of Distributed Generation
 Net Energy Metering and the Future of Distributed Generation Vishal C. Patel, P.E. Manager - Distribution Resource Interconnections April 28, 2015 What is Net Energy Metering (NEM)? NEM is a tariffed program
Economic Concepts for Pricing Electricity Network Services A Report for the Australian Energy Market Commission
 Economic Concepts for Pricing Electricity Network Services A Report for the Australian Energy Market Commission 21 July 2014 Project Team Adrian Kemp Oliver Nunn Martin Chow Stephanie Gainger NERA Economic
CUS TOMER INITIATED CAPITAL WORKS (CICW) MANAGEMENT PLAN
 MANAGEMENT PLAN") ABN 85 082 464 622 CUS TOMER INITIATED CAPITAL WORKS (CICW) MANAGEMENT PLAN DOCUMENT NUMBER: NW-#30171121 DATE: MARCH 2011 This page should either be left blank or used for any disclaimers. Page 2 of 19
ABN 85 082 464 622 CUS TOMER INITIATED CAPITAL WORKS (CICW) MANAGEMENT PLAN DOCUMENT NUMBER: NW-#30171121 DATE: MARCH 2011 This page should either be left blank or used for any disclaimers. Page 2 of 19
Power System Operation Procedure: Short Term Projected Assessment of System Adequacy (ST PASA)
") ELECTRICITY INDUSTRY ACT ELECTRICITY INDUSTRY (WHOLESALE ELECTRICITY MARKET) REGULATIONS 2004 WHOLESALE ELECTRICITY MARKET RULES Power System Operation Procedure: Short Term Projected Assessment of System
ELECTRICITY INDUSTRY ACT ELECTRICITY INDUSTRY (WHOLESALE ELECTRICITY MARKET) REGULATIONS 2004 WHOLESALE ELECTRICITY MARKET RULES Power System Operation Procedure: Short Term Projected Assessment of System
Value of Distributed Generation
 Value of Distributed Generation Solar PV in Rhode Island July 2015 Overview Distributed energy resources (DERs) like solar photovoltaic (solar PV) systems provide unique value to the electric grid by reducing
ENA Position Paper DECEMBER 2014 TOWARDS A NATIONAL APPROACH TO ELECTRICITY NETWORK TARIFF REFORM
 ENA Position Paper DECEMBER 2014 TOWARDS A NATIONAL APPROACH TO ELECTRICITY NETWORK TARIFF REFORM CONTENTS EXECUTIVE SUMMARY WHAT S AT STAKE FOR CUSTOMERS? CURRENT MEASURES ARE INSUFFICIENT A NATIONAL
The impact of distributed solar generation on the wholesale electricity market. June 2013. Dylan McConnell, Patrick Hearps, and Dominic Eales
 The role of distributed solar generation in reducing wholesale spot market electricity prices The impact of distributed solar generation on the wholesale electricity market June 2013 Dylan McConnell, Patrick
Meter installation, alteration and abolishment fees
 Meter installation, alteration and abolishment fees Effective January 2015 Australian Capital Territory New South Wales Queensland South Australia Victoria Page 1 of 7 Australian Capital Territory Fees
Residential electricity prices and energy bills 2011/12 Sydney vs Melbourne Updated with 1 January 2012 Victorian price rises
 Residential electricity prices and energy bills 2011/12 Sydney vs Melbourne Updated with 1 January 2012 Victorian price rises Prepared by System Planning and Regulation, Demand Management and Sustainability,
Attachment 20.73 SA Power Networks: Capital and operating historical expenditure October 2014
 Attachment 20.73 SA Power Networks: Capital and operating historical expenditure October 2014 Contents 1. Purpose... 3 2. Capital expenditure... 3 2.1 Capital expenditure summary 2005-2020... 3 2.2 Explanation
NSW Renewable Energy Target
 New South Wales Government NSW Renewable Energy Target Explanatory Paper November 2006 This page intentionally blank. NSW Renewable Energy Target Explanatory Paper Contents Introduction...2 Background...4
UNDERSTANDING ENERGY BILLS & TARRIFS
 UNDERSTANDING ENERGY BILLS & TARRIFS as part of the Energy Efficiency Information Grants Program Reading and understanding your energy and gas bills is a good first step to help you to identify where you
Reducing electricity costs through Demand Response in the National Electricity Market
 Reducing electricity costs through Demand Response in the National Electricity Market A report funded by EnerNOC CME is an energy economics consultancy focused on Australia's electricity, gas and renewables
Design Guide. Managing Peak Energy Demand In Live Performance Venues
 Design Guide Managing Peak Energy Demand In Live Performance Venues Peak demand; the highest amount of electricity consumed at any one time, has a major impact on network charges and has a considerable
Ver.19 December 17, 2013. Program & Document Principles DOCUMENT INTENT, OBJECTIVES & MANAGEMENT. PART I Definitions, Overview & Objectives
 PSEG Long Island SOLAR PIONEER & SOLAR ENTREPRENEUR PROGRAM IMPLEMENTATION GUIDE FOR INSTALLATION CONTRACTORS Rules & Procedures for Solar PV Systems Production Estimating & Rebate Determination Ver.19
The Virtual Power Station - achieving dispatchable generation from small scale solar
 The Virtual Power Station - achieving dispatchable generation from small scale solar John K Ward, Tim Moore, Stephen Lindsay CSIRO Energy Technology, Newcastle, NSW 24 Australia Keywords: forecasting,
House price report. September quarter 2014. Dr Andrew Wilson Senior Economist for the Domain Group
 September quarter 2014 Dr Andrew Wilson Senior Economist for the Domain Group Key findings Most capital city housing markets recorded falls in house prices over the September quarter September quarter
Submission to the 2015 Retail Competition Review Approach Paper (RPR0003)
") 16 February 2015 Australian Energy Market Commission PO Box A2449 Sydney South NSW 1235 Submission to the 2015 Retail Competition Review Approach Paper (RPR0003) Consumer Action Law Centre (Consumer Action)
16 February 2015 Australian Energy Market Commission PO Box A2449 Sydney South NSW 1235 Submission to the 2015 Retail Competition Review Approach Paper (RPR0003) Consumer Action Law Centre (Consumer Action)
SUBMISSION TO THE QUEENSLAND PRODUCTIVITY COMMISSION ISSUES PAPER ON SOLAR FEED IN PRICING IN QUEENSLAND
 SUBMISSION TO THE QUEENSLAND PRODUCTIVITY COMMISSION ISSUES PAPER ON SOLAR FEED IN PRICING IN QUEENSLAND ui CHAMBER OF COMMERCE AND INDUSTRY QUEENSLAND SUBMISSION 23 November 2015 1 CONTENTS 1.0 OVERVIEW...3
HARNESS. Utilising solar energy to save money
 HARNESS Utilising solar energy to save money Why consider solar? No control over ever rising electricity prices Electricity costs have doubled over the last 10 years* What will your electricity bill be
ENERGY RETAILERS COMPARATIVE PERFORMANCE REPORT PRICING 2013-14
 PERFORMANCE REPORT PRICING 2013-14 October 2014 An appropriate citation for this paper is: Essential Services Commission 2014, Energy retailers comparative performance report pricing 2013-14, October 2014
Submission to the Queensland Competition Authority. Regulated Retail Electricity Prices 2013-14 Transitional Issues & Cost Components and Other Issues
 Submission to the Queensland Competition Authority Transitional Issues & Cost Components and Other Issues January 2013 Queensland Farmers Federation Ltd. A.C.N. 055 764 488 A.B.N. 44 055 764 488 PO Box