City of Chula Vista. Fiscal Year Proposed Budget Overview. May 9 and 18, 2016
|
|
|
- Arabella Hill
- 8 years ago
- Views:
Transcription
1 City of Chula Vista Fiscal Year Proposed Budget Overview May 9 and 18, 2016

2 Agenda Fiscal Year Proposed Budget All Funds Summary General Fund Summary Long Term Financial Plan Fiscal Year Capital Improvement Program

3 ALL FUNDS SUMMARY

4 All Funds Summary $294.9M FY All Funds Projected Expenditures by Category CIP Project Expenditures, $20.7 Non CIP Project Expenditures, $1.1 Utilities, $8.8 Transfers Out, $37.9 Capital, $2.9 Other Expenses, $29.0 Personnel Services, $139.5 Supplies and Services, $55.0

5 All Funds Summary $285.7M FY All Funds Projected Revenue by Category Transfers In, $37.9 Property Taxes, $36.1 Other Revenue, $34.7 Other Local Taxes, $66.6 Development Impact Fees, $5.3 Licenses and Permits, $3.3 Charges for Services, $48.2 Revenue from Other Agencies, $48.3 Fines, Forfeitures, Penalties, $1.7 Use of Money & Property, $3.5

6 All Funds Summary Description FY 17 Proposed Revenues $285.7 Expenditures $294.9 Surplus/(Deficit) ($9.2) Reserves Other Funds (Revenues collected in prior years) $9.2 Surplus/(Deficit) $
 Reserves Other Funds (Revenues collected in")
7 All Funds Staffing Summary 1.00 FTE Added Mid Year FTE Net New Positions Staffing by Fund FY Council Adopted FY Proposed Change General Fund Police Grants/CBAG/Local Law Enforcement Block Grant Federal Grants Fund (1.00) Advanced Life Support Fund Environmental Services CV Housing Authority Fleet Management Development Services Fund Sewer Total Citywide
 Advanced Life Support Fund 1.00 1.00 Environmental Services 6.00 7.00 1.00 CV Housing Authority 4.00 4.00 Fleet Management 10.")
8 GENERAL FUND SUMMARY

9 General Fund Summary Description FY 17 Proposed Revenues $146.3 Expenditures $146.3 Surplus/Deficit $

10 General Fund Revenues (in thousands) Category FY15 Actuals FY16 Adopted FY17 Proposed Change Sales Tax $30,394 $31,015 $32,350 $1,336 Property Taxes $28,617 $29,897 $31,175 $1,278 Motor Vehicle License Fees $17,884 $18,597 $19,692 $1,095 Transfers From Other Funds $10,551 $10,022 $11,976 $1,954 Inter fund Reimbursements $10,239 $9,428 $9,752 $324 Franchise Fees $10,832 $11,426 $11,796 $370 Utility Users Taxes $6,365 $6,500 $6,380 ($120) Charges for Services $6,678 $6,476 $6,024 ($452) Transient Occupancy Taxes $3,137 $2,891 $3,655 $764 Use of Money and Property $2,832 $2,677 $2,732 $55 Other Local Taxes $2,421 $2,262 $2,448 $186 Other Agency Revenue $2,226 $2,327 $2,035 ($292) Police Grants $796 $1,279 $834 ($444) Development Revenue $1,363 $1,399 $1,036 ($363) Licenses and Permits $1,136 $1,135 $1,161 $25 Fines, Forfeitures & Penalties $1,638 $1,134 $1,021 ($113) Other Revenues $2,255 $941 $2,194 $1,253 Total Operating Budget $139,363 $139,406 $146,261 $6,855 CIP Projects $1,274 $400 $40 ($360) GENERAL FUND TOTAL REVENUES $140,638 $139,806 $146,301 $6,495
 Police Grants $796 $1,279 $834 ($444) Development Revenue $1,363 $1,399 $1,036 ($363) Licenses and Permits")
11 General Fund Revenues $146.3M Development Revenue, $1.0 Motor Vehicle License Fees, $19.7 Interfund Reimbursements, $9.8 Transfers From Other Funds, $12.0 Franchise Fees, $11.8 Property Taxes, $31.2 Charges for Services, $6.0 Utility Users Taxes, $6.4 Sales Tax, $32.4 CIP, $0.0 Other Agency Revenue, $2.0 Other Local Taxes, $2.4 Other Revenues, $2.2 Transient Occupancy Taxes, Use of Money and $3.7 Property, $2.7 Licenses and Permits, $1.2 Fines, Forfeitures & Police Grants, $0.8 Penalties, $1.0

12 General Fund Expenditures General Fund Expenditures by Category (in thousands) Category FY15 Actuals FY16 Projected FY17 Proposed Change Personnel Services $107,372 $111,712 $118,300 $6,589 Supplies and Services $15,905 $14,263 $14,114 ($149) Other Expenses $840 $551 $559 $8 Capital $962 $266 $1,595 $1,329 Transfers Out $5,482 $6,107 $6,162 $56 Non CIP Project Expenditures $63 $509 $19 ($490) Utilities $5,001 $5,889 $5,512 ($378) Total Operating Budget $135,626 $139,296 $146,261 $6,965 CIP Project Expenditures $503 $510 $40 ($470) TOTAL EXPENDITURES $136,129 $139,806 $146,301 $6,495
 TOTAL EXPENDITURES $136,129 $139,806 $146,301")
13 General Fund Expenditures $146.3M Retirement Benefits, 16% Health Benefits, 9% Other Personnel Expense, 4% Overtime, 4% Hourly Wages, 2% Supplies and Services, 10% Other Expenses, Less than 1% Capital, Less than 1% Transfers Out, 4% CIP Project Expenditures, 1% Non CIP Project Expenditures, Less than 1% Utilities, 4% Salaries, 46%

14 General Fund Net Cost (Allocation of Discretionary Revenue) Police, 41% Boards/ Commissions, Less than 1% Development Services, 0.8% Economic Development, 1% City Clerk, 1% City Council, 1% Animal Care Facility, 1% Recreation, 2% Human Resources, 2% Other, 23% Administration, 2% City Attorney, 3% Finance, 2% ITS, 4% Library, 3% Fire, 23% Public Works, 12% Public Safety = 64%

15 Budget Highlights The City Manager s Proposed Budget for Fiscal Year is balanced Fiscal Year Assumes a continued growth in the City s Major Discretionary revenues (Sales Tax, Property Tax, Motor Vehicle License Fees, Franchise Fees)

16 Budget Highlights Homeless Outreach Team Added 2.0 Peace Officers and 1.0 Sr. Park Ranger to address chronic homeless matters Traffic Engineer Added 1.0 Principal Civil Engineer assigned to traffic engineering Funding for Age Friendly Communities grant match

17 Budget Highlights Equipment Replacement $150,000 for new Engine replacement outfitting $120,000 for the lease of 400 additional computers $350,000 to transition to Microsoft Office 365

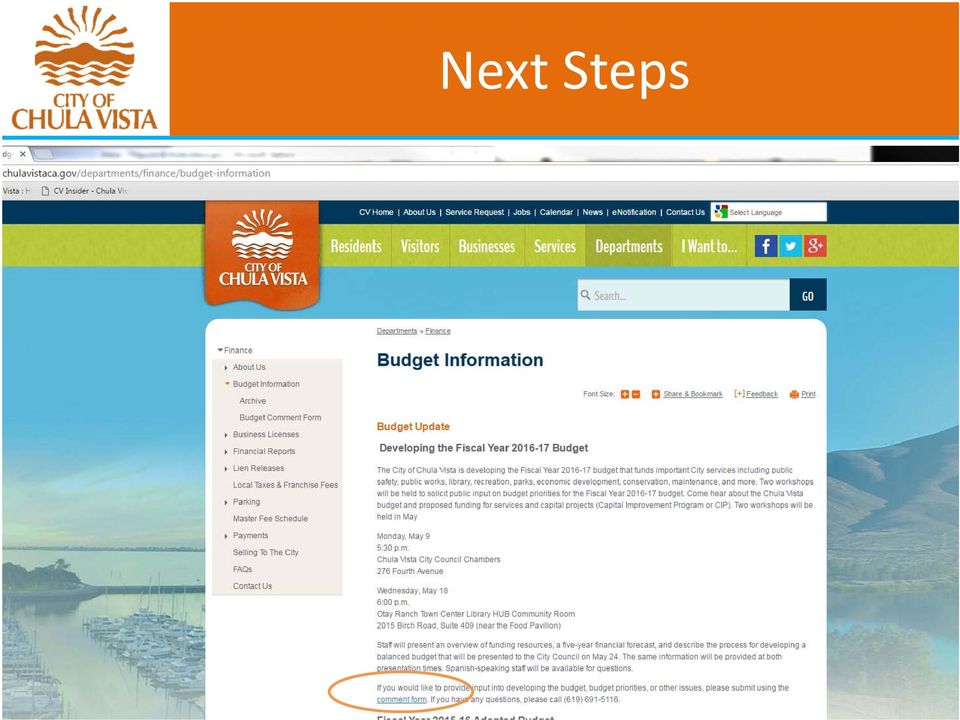
18 Next Steps Fiscal Year Proposed Budget will be presented to the City Council on Tuesday, May 24 th City Council to accept City Manager s Proposed Budget as their own and set a time for Public Hearing and adoption of the budget Additional comments can be submitted on City s website

19 Next Steps
20 LONG TERM FINANCIAL PLAN

21 LONG TERM FINANCIAL PLANNING (LTFP) What is Long Term Financial Planning? Financial Capacity Long Term Service Objectives LONG TERM FINANCIAL PLANNING
22 LTFP BACKGROUND Uses expenditure and revenue forecasts Provides insight into the future financial capacity of our organization Establishes the groundwork for strategies to be developed
23 LTFP BACKGROUND Helps achieve long term sustainability and eventually financial resiliency Integral part of the Strategic Plan and annual Budget Process Shows the City s continued dedication to transparency and financial accountability
24 LTFP GOALS The Long Term Financial Plan will: Lookout for a minimum of 10 years Will focus on General Fund and include Other Funds that could potentially impact the General Fund Be updated regularly to provide direction during budget process
25 LTFP OBJECTIVES Provide a focused plan to address identified high priority needs Continue to improve City s Financial Position Maintain or improve level of service standards Achieve full cost recovery, when possible, for services rendered.
26 LTFP PROCESS MOBILIZATION PHASE DATA ANALYSIS PHASE DECISION MAKING PHASE IMPLEMENTATION PHASE
27 LTFP PROCESS City s Comprehensive Plan Will be integrated with FY 2017 annual budget process. LTFP not a stand alone planning process Combines other planning processes
28 Other Planning Processes Fiscal Recovery and Progress Plan Five year forecast Citywide Strategic Plan Citizen Survey Master Fee updates 5 year CIP Plan Asset Management Planning New Development Financing Plans
29 Ten Year Forecast Description Proposed Forecast Forecast Forecast Forecast Forecast Forecast Forecast Forecast Forecast FY 2017 FY 2018 FY 2019 FY 2020 FY 2021 FY 2022 FY 2023 FY 2024 FY 2025 FY 2026 Revenues: Property Taxes $ 31,174,827 $ 33,006,349 $ 33,899,606 $ 34,819,296 $ 35,766,208 $ 36,741,154 $ 37,744,973 $ 38,778,525 $ 39,842,701 $ 40,938,414 Sales Tax $ 32,350,442 $ 32,835,699 $ 33,328,234 $ 33,994,799 $ 34,979,309 $ 35,992,332 $ 37,034,692 $ 38,107,240 $ 39,210,849 $ 40,346,420 Franchise Fees $ 11,795,951 $ 12,036,125 $ 12,281,408 $ 12,531,912 $ 12,787,752 $ 13,049,043 $ 13,315,905 $ 13,588,460 $ 13,866,831 $ 14,151,147 Utility Users Taxes $ 6,379,964 $ 6,443,764 $ 6,508,201 $ 6,573,283 $ 6,639,016 $ 6,705,406 $ 6,772,460 $ 6,840,185 $ 6,908,587 $ 6,977,673 Transient Occupancy Taxes $ 3,654,779 $ 3,767,500 $ 3,909,294 $ 4,056,424 $ 4,209,092 $ 4,367,506 $ 4,531,882 $ 4,702,444 $ 4,879,425 $ 5,063,067 Motor Vehicle License Fees $ 19,692,436 $ 20,280,086 $ 20,885,366 $ 21,508,804 $ 22,150,945 $ 22,812,351 $ 23,493,599 $ 24,195,284 $ 24,918,020 $ 25,662,437 Other Revenues $ 41,252,859 $ 38,805,316 $ 39,015,079 $ 39,269,256 $ 39,526,228 $ 39,344,031 $ 39,508,856 $ 39,675,606 $ 39,844,311 $ 40,014,997 TOTAL REVENUES $ 146,301,258 $ 147,174,839 $ 149,827,188 $ 152,753,774 $ 156,058,550 $ 159,011,823 $ 162,402,367 $ 165,887,744 $ 169,470,724 $ 173,154,155 Expenditures: Personnel Services $ 84,036,876 $ 84,807,474 $ 86,240,949 $ 86,727,776 $ 88,002,023 $ 88,214,389 $ 88,382,442 $ 88,400,165 $ 88,480,003 $ 88,515,283 Flex/Insurance $ 12,477,961 $ 13,594,584 $ 14,791,053 $ 15,908,602 $ 17,123,395 $ 18,445,177 $ 19,884,829 $ 21,454,519 $ 23,167,881 $ 25,040,222 PERS $ 23,596,679 $ 24,488,747 $ 28,160,178 $ 30,804,143 $ 32,036,069 $ 33,566,357 $ 34,760,910 $ 34,948,338 $ 35,547,271 $ 35,242,920 Salary Savings (On Going) $ (1,811,130) $ (932,003) $ (979,511) $ (1,005,951) $ (1,029,064) $ (1,044,367) $ (1,056,312) $ (1,058,186) $ (1,064,176) $ (1,061,132) Workers Compensation GF Liability $ $ 56,927 $ 58,066 $ 59,227 $ 60,412 $ 61,620 $ 62,852 $ 64,109 $ 65,392 $ 66,699 Other Expenditures $ 28,000,872 $ 28,584,621 $ 30,353,921 $ 32,083,007 $ 33,996,976 $ 35,516,278 $ 36,311,708 $ 37,047,203 $ 37,792,952 $ 38,380,223 Total Expenditures (Baseline) $ 146,301,258 $ 150,600,350 $ 158,624,656 $ 164,576,804 $ 170,189,811 $ 174,759,454 $ 178,346,429 $ 180,856,148 $ 183,989,323 $ 186,184,215 Subtotal Surplus/(Deficit) $ $ (3,425,511) $ (8,797,468) $ (11,823,030) $ (14,131,261) $ (15,747,631) $ (15,944,062) $ (14,968,404) $ (14,518,600) $ (13,030,060)
30 Ten Year Forecast (cont.) Capital and Maintenance: Building Management System (BMS) $ $ 7,300,000 $ 7,519,000 $ 7,744,570 $ 7,976,907 $ 8,216,214 $ 8,462,701 $ 8,716,582 $ 8,978,079 $ 9,247,422 Drainage Management System (DMS) $ $ 10,700,000 $ 11,021,000 $ 11,351,630 $ 11,692,179 $ 12,042,944 $ 12,404,233 $ 12,776,360 $ 13,159,650 $ 13,554,440 Fleet Management System (FMS): Police $ $ 1,000,000 $ 1,030,000 $ 1,060,900 $ 1,092,727 $ 1,125,509 $ 1,159,274 $ 1,194,052 $ 1,229,874 $ 1,266,770 Fire $ $ 1,500,000 $ 1,545,000 $ 1,591,350 $ 1,639,091 $ 1,688,263 $ 1,738,911 $ 1,791,078 $ 1,844,811 $ 1,900,155 General Government $ $ 1,000,000 $ 1,030,000 $ 1,060,900 $ 1,092,727 $ 1,125,509 $ 1,159,274 $ 1,194,052 $ 1,229,874 $ 1,266,770 General Government Management System (GGMS) $ $ 500,000 $ 515,000 $ 530,450 $ 546,364 $ 562,754 $ 579,637 $ 597,026 $ 614,937 $ 633,385 Parks Management System (PMS) $ $ 4,400,000 $ 4,532,000 $ 4,667,960 $ 4,807,999 $ 4,952,239 $ 5,100,806 $ 5,253,830 $ 5,411,445 $ 5,573,788 Roadways Management System (RMS) $ $ 19,400,000 $ 19,982,000 $ 20,581,460 $ 21,198,904 $ 21,834,871 $ 22,489,917 $ 23,164,615 $ 23,859,553 $ 24,575,340 Urban Forestry Management System (UFMS) $ $ 1,800,000 $ 1,854,000 $ 1,909,620 $ 1,966,909 $ 2,025,916 $ 2,086,693 $ 2,149,294 $ 2,213,773 $ 2,280,186 Wastewater Management System (WMS) $ $ 5,000,000 $ 5,150,000 $ 5,304,500 $ 5,463,635 $ 5,627,544 $ 5,796,370 $ 5,970,261 $ 6,149,369 $ 6,333,850 Open Space Management System (OSMS) $ $ 1,000,000 $ 1,030,000 $ 1,060,900 $ 1,092,727 $ 1,125,509 $ 1,159,274 $ 1,194,052 $ 1,229,874 $ 1,266,770 Regional Communication System (RCS Financing) $ $ 400,000 $ 400,000 $ 400,000 $ 400,000 $ 400,000 $ 400,000 $ 400,000 $ 400,000 $ 400,000 RCS Radios $ $ 1,500,000 $ $ $ $ $ $ $ $ Computer Aided Dispatch System (CAD) PD $ $ 150,000 $ 150,000 $ 150,000 $ 150,000 $ 150,000 $ 150,000 $ 150,000 $ 150,000 $ 150,000 ERP System $ $ 250,000 $ 250,000 $ 250,000 $ 250,000 $ 250,000 $ 250,000 $ 250,000 $ 250,000 $ 250,000 Breathing Apparatus Fire Department $ $ 600,000 $ $ $ $ $ $ $ $ Total Other Items $ $ 56,500,000 $ 56,008,000 $ 57,664,240 $ 59,370,167 $ 61,127,272 $ 62,937,090 $ 64,801,203 $ 66,721,239 $ 68,698,876 SURPLUS/(DEFICIT) WITH ADDITIONAL IMPACTS $ $ (59,925,511) $ (64,805,468) $ (69,487,270) $ (73,501,428) $ (76,874,904) $ (78,881,153) $ (79,769,607) $ (81,239,839) $ (81,728,936)
31 LTFP PROCESS MOBILIZATION PHASE Citywide Survey Citizen Participation Citywide Strategic Plan Council Input DATA ANALYSIS Define Fiscal Environment Debt Capacity Analysis Identify weaknesses and opportunities DECISION MAKING Financial Strategy Development IMPLEMENTATION Operationalize strategies in FY 2017 budget
32 Next Steps Include new Asset Management Plans in Ten Year Analysis when available Initiate Long Term Financial Workshops with City Council and staff Discuss Strategies to Balance Future Budgets Report to City Council and Community Implement Recommended Strategies
33 CAPITAL IMPROVEMENT PROGRAM SUMMARY
34 Capital Improvement Program $20.7M by Asset Management System Wastewater, 8.0% Roadway, 83.9% Drainage, 7.7% General Gov't, 1.0%
35 Capital Improvement Program $20.7M by Funding Source TransNet, 38.98% Transportation Development, 9.83% Trunk Sewer Capital Reserve, 7.97% CDBG, 1.93% Traffic Signal, 2.39% Sewer Service Revenue, 0.12% Salt Creek Sewer Basin DIF, 0.24% HSIP, 6.48% Highway Bridge Program, 25.58% Gas Tax, 6.28% General Fund, 0.19%
36 CIP Highlights (FY2016) Third Avenue Streetscape Project, Phase 2 SANDAG: Smart Growth Incentive Program ($1.3M) Bond Funds ($1.3M)
37 CIP Highlights (FY2017) Sewer Rehabilitation $1.6 million Storm Drain Repairs $1.6 million Pavement Rehabilitation $4.5 million Willow Street Bridge $6.2 million
38 Capital Improvement Program 5 Year Period $30,000,000 $25,000,000 $20,000,000 $15,000,000 $10,000,000 $5,000,000 $0 FY13 FY14 FY15 FY16 FY17 Building Drainage OS Roadway Wastewater General Gov't Parks TOTAL CIP
39 City Council Districts
40 CIP Funding by Location By City Council District (FY2017) District 2, 28% District 1, 39% District 4, 15% Citywide, 4% District 3, 14%
41 QUESTIONS?