Board of Governors of the Federal Reserve System. International Finance Discussion Papers. Number 967. March 2009
|
|
|
- Blake Richardson
- 8 years ago
- Views:
Transcription
1 Board of Governors of the Federal Reserve System International Finance Discussion Papers Number 967 March 2009 Biofuels Impact on Crop and Food s: Using an Interactive Spreadsheet Scott Baier, Mark Clements, Charles Griffiths, and Jane Ihrig NOTE: International Finance Discussion Papers are preliminary materials circulated to stimulate discussion and critical comment. References in publications to International Finance Discussion Papers (other than an acknowledgment that the writer has had access to unpublished material) should be cleared with the author or authors. Recent IFDPs are available on the Web at ww.federalreserve.gov/pubs/ifdp/. This paper can be downloaded without charge from Social Science Research Network electronic library at
2 Biofuels Impact on Crop and Food s: Using an Interactive Spreadsheet Scott Baier, Mark Clements, Charles Griffiths, and Jane Ihrig * Abstract: This paper examines the effect that biofuels production has had on commodity and global food prices. The innovative contribution of this paper is the interactive spreadsheet that allows the reader to choose the assumptions behind the estimates. By allowing the reader to choose the country, time period, supply and demand elasticities, and the size of indirect effects we explicitly illustrate the sensitivity of the estimated effect of biofuels production on prices. Our best estimates suggest that the increase in biofuels production over the past two years has had a sizeable impact on corn, sugar, barley and soybean prices, but a much smaller impact on global food prices. Over the past two years (ending June 2008), we estimate that the increase in worldwide biofuels production pushed up corn, soybean and sugar prices by 27, 21 and 12 percentage points respectively. The countries that account for most of the upward pressure on these prices are the United States and Brazil. Our best estimates suggest that the increase in U.S. biofuels production (ethanol and biodiesel) pushed up corn prices by more than 22 percentage points and soybean prices (soybeans and soybean oil) by more than 15 percentage points, while the increase in EU biofuels production pushed corn and soybean prices up around 3 percentage points. Brazil s increase in sugar-based ethanol production accounts for the entire rise in the price of sugar. Although biofuels had a noticeable impact on individual crop prices, they had a much smaller impact on global food prices. Our best estimate suggests that the increase in worldwide biofuels production over the past two years accounts for just over 12 percent of the rise in the IMF s food price index. The increase in U.S. biofuels production accounts for roughly 60 percent of this effect, while Brazil accounts for 14 percent and the EU accounts for 15 percent. The key takeaway point is that nearly 90 percent of the rise in global food prices comes from factors other than biofuels. JEL Classifications: E31, Q42, Q11 Keywords: Biofuels, Ethanol, Commodity s, Food s * Author Notes: Scott Baier is an Associate Professor at the John E. Walter Department of Economics, Clemson University and visiting researcher at the Federal Reserve Bank of Atlanta; he can be reached at sbaier@clemson.edu. Charles Griffiths is an economist at the Environmental Protection Agency and can be reached at griffiths.charles@epa.gov. Mark Clements and Jane Ihrig are staff members at the Board of Governors of the Federal Reserve System and can be reached at mark.w.clements@frb.gov and Jane.Ihrig@frb.gov. The views expressed in this paper are solely the responsibility of the authors and should not be interpreted as reflecting the views of the Environmental Protection Agency, the Board of Governors of the Federal Reserve System or of any other person associated with the Federal Reserve System.
3 1. Introduction Early 2008 saw agricultural commodity prices rise at rates that have not been witnessed in nearly 40 years. When considering the cause of this rise, one can mention the standard list of factors including growing demand from better diets as countries become wealthier, reduced yields from adverse weather shocks, and increased production costs from energy and other sources (Glauber, 2008a). However, a new factor has been attracting a lot of attention: the increased production of biofuels. Since 2005, worldwide ethanol production has nearly doubled and biodiesel production has increased nearly three-fold. The United States has boosted use of corn and soybean oil for its biofuels production, while the EU has increased use of wheat, barley, and soybeans for biofuels production, and Brazil has continued to ramp up sugar-based ethanol production. In the United States, as shown in Figure 1, the increase in corn prices is coincident with the increase in corn-based ethanol production. Similarly, in Figure 2, soybean prices increased in tandem with U.S. biodiesel production. Some use these correlations in the data to suggest that biofuels production is responsible for the bulk of the rise in agricultural and global food prices. This paper, using an interactive spreadsheet 1, allows the reader to estimate the impact of biofuels production on food prices. The spreadsheet allows the reader to customize the analysis by (1) country or area of interest, (2) a one-year or two-year analysis, (3) assumptions about demand and supply elasticities, and (4) the size of indirect effects. When choosing each option, the spreadsheet recalculates an estimate of the impact of increases in biofuels production on individual crop prices (corn, sugar, wheat, barley, soybeans and rapeseed oil), as well as beef and global food prices. 2 As shown in the analysis, the estimated effect of increased biofuels production is sensitive to the options chosen. As illustrated by the four choices we give the reader in the analysis, estimating biofuels effect on food prices is challenging because of the number of assumptions that must be made along the way. In the text of the paper we review what we consider to be the best-guess estimate for elasticities and the size of indirect effects and report these results. We find that the increase in biofuels production, worldwide or for the individual countries in our analysis, is a noticeable factor pushing up the prices of some agricultural crop prices, but is only a small factor pushing up global food prices. In the United States, much attention has been focused on the stringent U.S. biofuels mandate. Our best-guess estimate is that the increase in U.S. biofuels production (ethanol and biodiesel) over the past two years ending in June 2008 pushed up corn prices by more than 22 percentage points, accounting for nearly 14 percent of the rise in corn prices. 3 The increase in U.S. biofuels 1 The spreadsheet can be downloaded from the Federal Reserve Board s International Finance Discussion Papers at 2 Global food prices as measured by the International Monetary Fund s (IMF) food price index in its Primary Commodities data release. 3 Clearly the size of the impact will depend on the time period reported. We choose this two-year window because biodiesel production had increased dramatically; for example ethanol production in the United States had nearly doubled and the fraction of U.S. corn used for domestic production was nearly one-third. The ending date matters as 1
4 production also pushed up soybean prices (soybeans and soybean oil) by more than 15 percentage points, accounting for nearly 10 percent of the rise in soybean prices. In addition, our analysis suggests that the EU and Brazil s increased biofuels production had sizeable impacts on crop prices. Over the past two years ending in June 2008 we find that the increase in EU biofuels production has pushed corn and soybean prices up around 3 percentage points, accounting for roughly 2 percent of the increase in the price of these crops. Also, the increase in EU biofuel production pushed barley prices up 4 percentage points, accounting for around 3 percent of the increase in the price of barley. In Brazil, the increase in sugar-based ethanol production has pushed up sugar prices 12 percentage points. Over this same time period, the increase in worldwide biofuels production has pushed up corn and soybean prices by 27 and 21 percentage points respectively. That means the increase in worldwide biofuels production accounts for almost 17 percent of the rise in corn prices and 14 percent of the rise in soybean prices. Although biofuels had a noticeable impact on individual crop prices, they had a much smaller impact on global food prices. Our best-guess estimate is that the increase in worldwide biofuels production for the two years ending in June accounts for just over 12 percent of the rise in the IMF s food price index. The increase in U.S. biofuels production accounts for roughly 60 percent of this effect, while Brazil accounts for 14 percent and the EU accounts for 15 percent. The key take-away point, however, is that nearly 90 percent of the rise in global food prices comes from factors other than biofuels. Finally, we compare our best-guess results to many other studies. Since the estimated effect of ethanol and total biofuels production on commodity or global food prices depends heavily on assumptions about elasticities of supply and demand, the size of indirect effects, and the time period analyzed it is important to see how our results differ from others. There are studies that find estimates consistent with what we view as our best-guess estimates. The studies whose results are closest to ours tend to be government agencies. There are a few studies, however, that find larger impacts of ethanol and biofuels production on corn or global food prices. We show that in order to get a very large ethanol impact on corn prices we must assume very inelastic demand and supply curves. Whether this realistically represents the world over the past year is a decision left up to the reader. We would argue that the last few years are not any different than other years and, therefore, we use elasticities near their historic values, which provide the estimates mentioned above. Turning to the very large estimates of biofuels production on corn and global food prices, we show that these estimates can be generated only by using unrealistic assumptions both inelastic supply and large indirect effects. We argue these two assumptions are inconsistent and, hence, these results mislead the reader. The remainder of the paper is as follows. Section 2 provides an overview of the biofuels market, focusing primarily on the United States production of corn-based ethanol and soybean oil-based biodiesel. We also summarize movement in various food prices. Next we turn to the estimates of biofuels effect on food prices. We present a reduced-form equation that is the basis of the well. June 2008 was near the peak of agricultural commodity prices and at a time when discussion of biofuels and food prices attracted the most press. It is not obvious to us whether it is more informative to ask what fraction of the `peak commodity prices can be explained by biofuels or the fraction at some other time period. 2
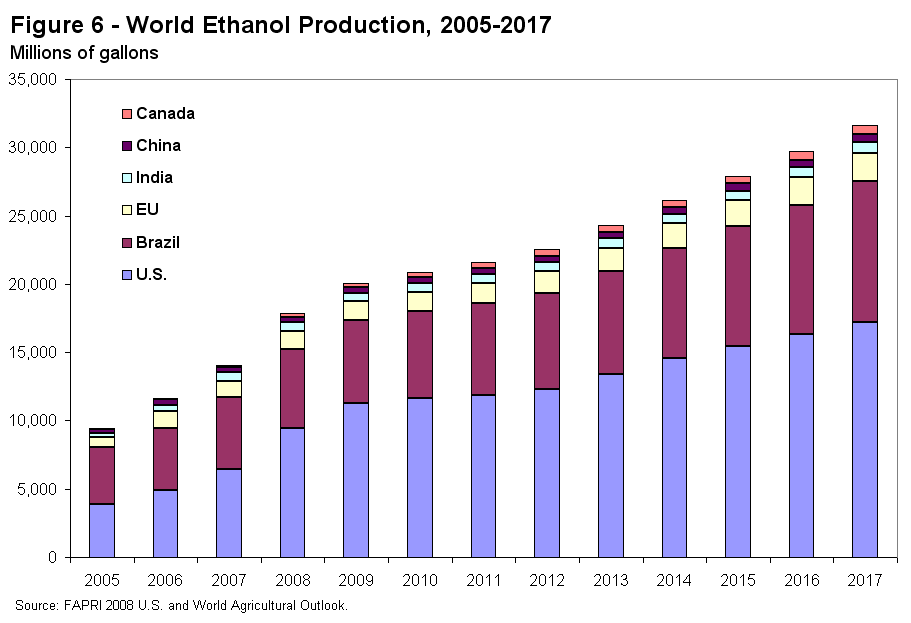
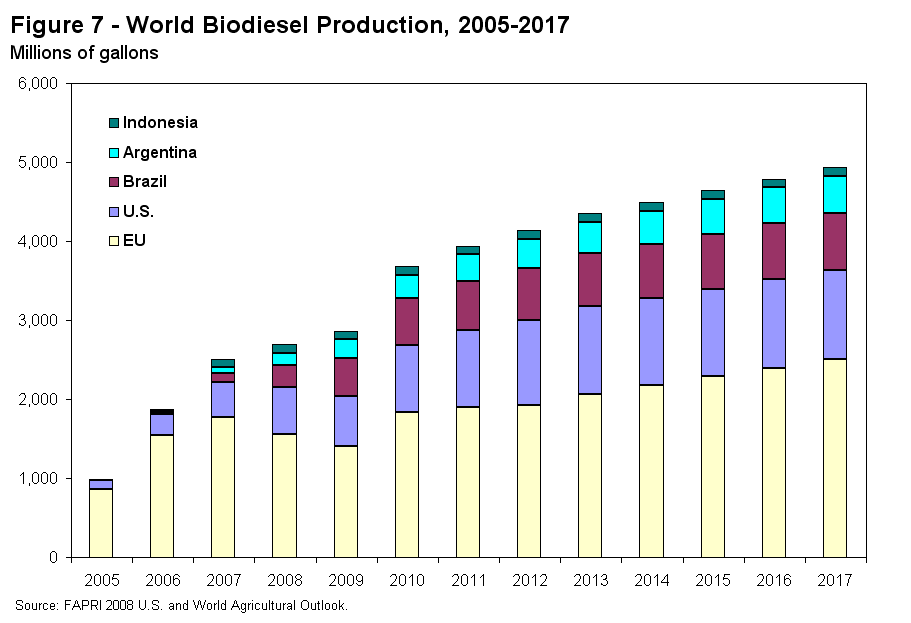
5 estimation and we discuss each of the key assumptions that the reader can choose in estimating the effect of increased biofuels production on food prices. Section 4 highlights our best-guess impact of biofuels on crop and global food prices. Section 5 compares our findings with other studies, and in doing so highlights how sensitive the results are to each assumption. Concluding remarks are provided in section Overview of Biofuels Biofuels are liquid, solid, or gaseous fuels derived from renewable biological sources. This includes ethanol, various other alcohol-based fuels, pyrolysis oils, gasification fuels, and biodiesel. Biofuels use was first championed by Rudolf Diesel in the late 1800s when he envisioned vegetable oil as a fuel source for his diesel engine. At the World s Fair in 1900, Diesel demonstrated his engine using peanut oil. Similarly, Henry Ford designed his model T to run on corn-based ethanol. 4 In the 1920s, automobiles switched over to the relatively cheaper petroleum based fuels. Renewed interest in biofuels followed the rapid increase in petroleum prices in the 1970s associated with the two oil crises in 1973 and 1979 (Schmidt, 2007). World production of biofuels is concentrated in ethanol. As shown in Figure 3, world production of ethanol was 14.1 billion gallons in 2007, while biodiesel production was about 2.5 billion gallons. The majority of world ethanol production is done by the United States (46%) and Brazil (37%). Production of biodiesel in 2007, on the other hand, was primarily done by the EU (71%), with the United States producing a large part of the remainder (18%) (FAPRI 2008). In order to assess the impact the impact of biofuels on food prices, one needs to look at the change in biofuels production, not the stock of biofuels, over time. Not surprisingly, it turns out that the largest current producers of biofuels are the same countries that have had the fastest growth in biofuels production. The remainder of the section focuses on crops used for biofuels production by the United States and the rest of the world, and then turns to looking at other crops and food prices. 2.1 Biofuels in the United States In the United States, two commodities, corn and soybean oil, account for over 90 percent of biofuels production (USDA testimony), with corn being the main feed stock for U.S. biofuels production. Recently, there has been an additional amount of imported ethanol, primarily from Brazil, Costa Rica, El Salvador, Jamaica, and Trinidad and Tobago, and a few others, although not all of that is corn-based ethanol. 5 As Figure 4 illustrates, ethanol production has grown dramatically since gasoline blended with ethanol was introduced into the market in In 4 For more details on the history of biofuels see the Department of Energy s History of Biofuels at and Biofuels for Transportation as well as the Economic Report of the President (2008). 5 EIA. U.S. Imports by Country of Origin: Oxgenates - Fuel Ethanol. 3
6 2000, domestic production of ethanol was 1.6 billion gallons and has grown to 6.5 billion gallons in In 2007, ethanol comprised between 4% and 5% of the total motor gasoline supply. 6 The amount of the U.S. corn crop devoted to ethanol production is substantial and growing, see Figure 5. In 2001, the U.S. produced 9.5 billion bushels of corn, 7% of which (705 million bushels) went to ethanol production. In 2006, corn production had grown to 10.5 billion bushels, but 20% (2.1 billion bushels) was used for ethanol production. The corn crop devoted to ethanol in 2008 is projected to be 34% of total United States production (or about 13% of total world production). As the ethanol share increased over time, the share of corn used for other uses has either remained constant or has fallen. It is important to note that Figure 5 probably overstates the amount of corn used as livestock feed since distiller s grains is a byproduct of ethanol production and is used as cattle feed. Of course, when looking at ethanol s impact on corn prices one needs to look at how the increased demand of corn for ethanol production is in relation to changes in other sources of demand and changes in world supply. Why has there been dramatic growth in corn-based ethanol over the last few years? There are several factors and we provide a list of the main drivers below: 1. The United States provides a subsidy for blending ethanol into gasoline, with the payments going to petroleum blenders in the form of a tax rebate (Elam, 2008) The U.S. government has required ethanol production as part of the Clean Air Act requiring reformulated fuel that includes an oxygenating agent in high smog areas. 3. The United States has a mandate on the amount of ethanol that must be blended into the fuel supply. The 2005 Energy Policy Act mandated that 4 billion gallons of renewable fuel be blended into the fuel supply in Partially because of the dramatic success in producing ethanol, the recent 2007 Energy Independence and Security Act increased this mandate, ultimately requiring 36 billion gallons of biofuels by Only 15 billion gallons of this, however, is required to be a renewable biofuels like corn-ethanol, with the rest being biodiesel or advanced biofuels (see Table 1). 4. Market forces have also contributed to the rise in ethanol production. Since ethanol is a substitute for petroleum, the increase in the price of crude oil has pushed up the demand for ethanol. A similar story can be told for biodiesel production. As mentioned above, the feedstock for biodiesel can come from a number of sources, but soybean oil is one of the lowest priced domestically produced virgin oils and is produced in the largest quantity (Ginder, 2004). 6 EIA. AEO 2007, Table A11. Calculated as Ethanol divided by motor gasoline. This appears to be the same calculation implicit in the AEO 2007 page 81 statement Ethanol, which made up 4 percent of the motor gasoline pool in This credit has been as much as 60 cents for every gallon of ethanol blended in the mid 1980s, but the 2008 Farm Bill reduced this payment to $0.46 per gallon. There is also a $0.54 per gallon import duty on ethanol. There is also a Federal excise tax credit for biodiesel production of 1-cent-per-gallon per percent of inclusion of biodiesel (i.e., $1.00 per gallon of 100% biodiesel) for producers using new vegetable oil. This is also a half-cent per gallon per percent of inclusion for producers using recycled vegetable oils. 4
7 Soybeans are crushed, producing a joint produce of soybean oil and soybean meal. The oil can then be fermented into methyl ester which is used to make biodiesel. Because larger scale production is relatively new, data on the amount of methyl ester produced from soybean oil is only available for the 2006/07 and 2007/08 harvest year; but the growth has been dramatic. In 2006/07, 20.5 billion pound of soybean oil was produced, with 2.8 billion pounds (14%) for biodiesel production. In 2007/08, it is projected that 20.7 billion pounds of soybean oil will have been produced, with 4.2 billion pounds (20%) used for biodiesel Biofuels internationally Precise data on the production biofuels in other countries is not as easy to obtain as United States data. This is because unlike petroleum, which is a globally traded commodity with good international trade flow data, biofuels are often domestically produced and consumed with little or no international trade. Therefore, there could be some niche biofuels markets not captured in the available data (Trostle 2008). Production of biofuels by the major biofuel producing countries is summarized in Figures 6 and 7 (FAPRI, 2008). The United States and Brazil account for about three-fourths of world biofuels production with the United States as the largest biofuels producer in the world, producing 42% of the world s biofuels in 2007 (Coyle, 2007), with most of that in the form of corn-based ethanol. Brazil, mostly in the form of ethanol from sugarcane, accounts for approximately 32% of the world s total. In 2007, Brazil produced a little over 5 billion gallons of ethanol compared to 6.5 billion gallons of ethanol produced in the United States (Renewable Fuels Association, 2008). Presently, Brazil requires that 23% of its fuel supply to be ethanol. Brazil has also increased its biodiesel production, requiring that 2% of its diesel-fuel supply be biodiesel in 2008, with this percentage rising to 5% by 2013 (Dickerson, 2006). This mandate is expected to increase Brazilian biodiesel production for the next couple of years, likely through soybean production. 9 Europe also produces a substantial portion of the world s biofuels, approximately 18% (Coyle, 2007). Unlike the U.S. and Brazil, though, the EU produces more biodiesel, primarily using rapeseed and soybeans, than ethanol. Other countries that produce noticeable amount of biofuels are China, Canada, Argentina, Indonesia and India. China and Canada both use some corn for ethanol production, but are trying to diversify the feedstock to wheat, sweet potatoes, and cassava. Biodiesel in Argentina and Indonesia is produced using a variety of feedstock including soybeans and palm oil (Coyle, 2007). 2.3 Crop substitution and indirect effects The choice of which crops to use for biofuels production depends on a number of factors: what has been traditionally grown, which crops are suitable for that climate, and the technologies available for converting crops into fuel. These factors place constraints on how much and what type of biofuels can be produced. With market determined prices, an increase in demand puts upward pressure on biofuels prices. If the relative cost of producing biofuels with a given crop 8 U.S. Census Bureau. Table 3a: Fats and Oils, Production, Consumption, and Stocks USDA Long-Term Projections, February
8 rises, another crop may be substituted. For all crops, however, crops will only be used for biofuels production if the cost of production is less than the associated cost of using petroleum, absent any other driving factor such as government mandates. Soybeans are most directly affected by the demand for corn-based ethanol because corn and soybeans tend to compete for land area. This is because corn and soybeans can be used in rotation, for example rotating a corn and a soybean crop every other year. In practice, other cycles including other crops are used. As the price of corn rose substantially in , reflecting the increase in demand, the cropping pattern has changed, with more corn production relative to soybeans. This has lead to a noticeable decrease in overall soybean production and increased its price (Westcott, 2007). There is now also feedback to corn from soybeans as the soybean price has risen. Besides soybeans, other crops compete for land area. Corn, wheat, and soybeans account for about 90 percent of acreage for the eight major field crops in the USDA projections to This means that as corn demand increases, wheat production and prices are also affected. Of course, there are weather and land substitution issues as wheat can be planted in more Northern regions of the United States than corn. Crop prices also affect the price of meat and dairy products because grain is used as feed. In fact, livestock feeding is the largest single use of corn. Cattle, hogs, and poultry all use corn feed, which means that expansion in the ethanol industry will affect livestock production. s will adjust quickly for chicken, milk and eggs, and over a longer period of time for beef and pork. The length of time for price adjustment reflects the length of time farmers need to adjust their stock (supply) in response to the higher feed prices. One mitigating factor is that distiller s grains are a by-product of ethanol production and can be used as feed for ruminant animals such as beef and dairy cattle. Some research suggests that distiller s grains can comprise up to half of the cattle diet. Currently, the use of distiller grains is less suitable for hogs and poultry, which are monogastric animals (Hofstrand, 2007; Westcott, 2007). 2.4 Food price effects A number of studies have estimated the impact of the rise in biofuels production on crop and food prices. Here we focus on the increase in biofuels production on crop prices such as corn and soybeans, as well as global food prices. All prices are measured by the IMF s Indices of Primary Commodity s. The food index excludes beverages, but includes cereals (21.4% of the total), vegetable oils (26.5%), meat (22.3%), seafood (19.0%), sugar (5.3%), bananas and oranges (5.4%). The cereals index consists of wheat (46.1%), corn (29.0%), rice (17.8%), and barley (7.1%). The percentages are multiplicative, so while corn is almost 30% of the cereals index and cereals are 21.4% of the food index, corn is only (0.29 x =) 6.2% of the overall food index. The vegetables oil index consists of all soybeans (56.2%, but broken down further into soybeans, 27.5%, soybean meal, 19.0%, and soybean oil, 9.7%), rapeseed oil (7.5%), and palm oil, sunflower oil, olive oil, fishmeal, and groundnuts. The meat index is made up of beef (38.8%), lamb (7.1%), swine (30.6%), and poultry (23.5%). 10 USDA Agricultural Baseline Projections: U.S. Crops,
9 There is no denying that the food prices have risen dramatically over the past few years. Table 2 shows the increase in prices for the IMF food index, the IMF cereals index, as well as a number of selected commodities for the 12, 24, and 36 months ending in June Food prices increased 44% over the 12 months ending June, 55% over two years and 78% over three years. However, using a 20 year average, food price only increased 2.1% at an annual rate. The pattern is the same for cereals, but the price increases have been greater. Cereal prices rose 73%, 120%, and 169% over the past one, two, and three years. Over the past 20 years, however, cereal prices increased at an average annual rate of only 4.7%. A similar story can be told for most of the commodities listed in Table 2, with the exception of sugar. 11 Note that these prices are different from the prices consumers see in the United States because the diet of American consumers is comprised of substantially more processed food. For example, the wheat in the IMF index is No.1 Hard Red Winter wheat, FOB to the Gulf of Mexico; whereas the majority of wheat in the American diet comes from processed bakery products, particularly those purchased away from the home. In general, the price for processed bakery items and particularly food purchased away from home is driven more by labor, marketing and distribution costs than it is by the raw materials. As such, the price increases listed above are much more applicable to the rise in food expenditures for individuals living in developing countries than to the rise in food expenditures for American consumers. For this paper, we will concentrate on the IMF Food Index from the IMF s Primary Commodities data for our measure of the rate of increases in global food prices. 3. Estimating the Effect of Biofuels on Food s 3.1 Model of Direct Effects We begin by estimating the direct effect of increased biofuels production on each agricultural price. For ethanol, we consider the effect of increased production of ethanol on corn, sugar, barley and wheat prices. For biodiesel, we look at how the prices of soybeans and rapeseeds are affected by the increased use of these commodities in biodiesel production. We estimate the direct effect with simple supply and demand equations. For each commodity, define market demand as follows: D D( p) B (1) where D ( p) is world demand for the commodity NOT related to biofuels production and B is the demand related to biofuels production. Totally differentiating Equation (1), we get: dd D' ( p) dp db Assume that market supply is: 11 To put this rate of increase of food prices in perspective, the consumer price index has increased at an average annual rate of 3.1% over the last 20 years. 7
10 S S( p) (2) Totally differentiating Equation (2) we get: ds S' ( p) dp Equating the change in supply to the change in demand 12, we get: Dividing through by S( p ) gives and since we know that S( p) = D( p) B S '( p) dp D'( p) dp db S '( p) D'( p) dp db. S '( p) D'( p) db dp S( p) S( p) S( p) S '( p) D'( p) db dp S( p) D( p) B S( p ). We can now multiply and divide the left-hand side of the above equation by p S p D( p) p dp db p S( p) p D( p) B p S( p) Where we ve substituted S'( p)= S p and ( ) D'( p)= Dp. Now multiply and divide the second p term in brackets by D(p) to obtain which can be re-written as S p D( p) p D( p) dp db p S( p) p D( p) D( p) B p S( p ), S D D( p) dp db / B D( p) B p S( p) / B 12 We implicitly assume that inventories are constant. This assumption can matter, but it depends on the nature of the shocks. If the increase in demand is temporary in nature, then inventories can be used to smooth consumption. In this case, inventories dampen the increase in price. If the shock is permanent and it is desirable to have a stock of inventories that is proportionate to consumption, then the shock may put additional upward pressure on prices. 8
11 or % p s ( B / S( p))*% B d ( D( p) / ( D( p) B)) (3) where S( p) is world production. Equation (3) gives us the direct effect of the increase in biofuels production, B, on the individual commodity prices. For example, if we want to measure the effect of the increased production of corn-based ethanol in the United States over the past 24 months on corn prices we can use Equation 3 with B / S( p ) measuring the quantity of U.S. corn used for ethanol relative to world corn production over the past 24 months and % B capturing the increase in U.S. corn use for ethanol over the past 24 months along with d and s, the elasticities of demand and supply for corn, and ( D( p) / ( D( p) B )), the non-biofuels share of world demand. Plugging these numbers into Equation (3) gives % p, which is the change in the price of corn due to the increased use of corn for ethanol production over the past two years. These estimates of direct effects, of course, are sensitive to the elasticities used in the analysis and we now turn to alternative measures that one might want to consider Elasticities Equation (3) relies on elasticities of both supply and demand for each agricultural commodity that is used in biofuels production. All our estimated elasticities are from the Food and Agricultural Policy Research Institute (FAPRI). 14 These estimates are published in FAPRI s Elasticity Database, which are collected from the academic literature on a relatively large cross section of countries over time. Although the FAPRI data draws on the current academic literature and are the best available data on crop price elasticities across countries, these elasticity are estimates for individual countries. Therefore, simply taking the mean or median of these measures for the world supply and demand elasticities is just an approximation. With this in mind, we provide sensitivity analysis of our results. Besides choosing between mean and median values, we also include the minimum and maximum measure of the FAPRI elasticities to give an upper and lower bound for the analysis. Table 3 presents the mean and median demand and supply elasticities for the commodities examined in this study. One thing to keep in mind is that the maximum demand elasticities in reported in Table 3 are the most negative values. We report these numbers in this manner so that if one chooses the maximum supply and demand elasticities to use in Equation (3), this will produce the smallest biofuels impact on food prices. Likewise, if one chooses the minimum 13 This simple supply and demand analysis does not incorporate cross-price elasticities. To capture these effects we use the empirical correlations of prices to provide plausible upper bound estimates of the cross-price effects. We discuss this in greater detail below. 14 Sugar demand elasticities from Elbobeid and Tokgoz (2008). 9
12 supply and demand elasticities Equation (3) will give the largest impact of biofuels on food prices. Generally, there is little difference between the mean and median elasticities. Our preferred elasticities are the median estimates. Since the medians are slightly lower than the means, this will, if anything, tend to push up the estimated effect of biofuels production on crop and food prices. One might view the maximum and minimum elasticities as the long-run and short-run elasticities, respectfully. However, it is not obvious that the short-run elasticities should be used to estimate the effect of biofuel production on prices. Presumably, farmers have been aware of the subsidies and the mandated increases in ethanol production for several years and have likely taken this into account when making their production decisions. In the U.S., for example, the Energy Independence and Security Act laid out the mandated amount of ethanol production for 2008 to One aspect that may have been unanticipated would have been the increase in petroleum prices over 2007 and the first half of Since biofuels are a substitute for gasoline, the increase in petroleum prices over this period had likely increased the derived demand for all biofuels. After choosing the elasticities one wants to use in the analysis, we plug these values in Equation (3) to get the direct effects of biofuels on commodity prices. Of course, one needs to also consider indirect effects. This is the discussion of the following subsection. 3.3 Adding Indirect Effects Equation (3) is very naïve; it does not allow for indirect effects of the rise in one agricultural commodity s price on other commodity prices. But, these indirect effects can be important. Two types of indirect effects we consider are from crop substitution and the effect of agricultural prices on input costs of other food items. 15 For example, as ethanol prices increase, farmers plant more corn in place of soybeans, so the rise in the price of ethanol indirectly pushes up soybean prices through a land substitution effect. In addition, corn is used as an input to beef production, so as corn prices increase there is upward pressure on beef prices because the cost of inputs has increased. We account for both of these indirect effects in this analysis. The size of indirect effects is controversial. The obvious lower bound is no indirect effects. We denote this as 0% indirect effects. This means that the indirect effects due to land and crop substitution are zero. The upper bound on indirect effects is a one-to-one indirect effect on prices. That is, for example, a 1% change in the price of corn due to the increase in ethanol 15 Another indirect effect can be estimated from using cross-price elasticities. Although this approach sounds reasonable, these elasticities are quite small (e.g., the USDA reports for corn to soybeans) and, therefore, the estimated indirect effects from this methodology are quite close to assuming zero indirect effects. As a result, we do not discuss this method of determining indirect effects in our analysis. 10
13 production will cause a 1% increase in the price of soybeans due to indirect effects. We denote this as 100% indirect effects. One could simply look at the extremes of no indirect effects or 100% indirect effects; however, we think these extreme bounds are unreasonable. Our approach to calculate plausible upper bounds of the indirect effects (rather than assume 100% indirect effects) is to attribute all the correlation between the prices of crops used in biofuels production and other food prices to the rise in the production of biofuels. That is, if a bivariate regression of the log of wheat prices on the log of corn prices yields a slope coefficient of 0.27, then we assume that every one percent increase in corn prices pushes up wheat prices by 0.27 percent. Clearly there are other factors that cause both wheat and corn prices to simultaneously increase (e.g., changes in temperature or rainfall), or it may be that some of the co-movement of the prices can be attributed to factors that push up wheat prices first and this pushed up the price of corn. That said, to provide a plausible upper bound for the indirect effects we assume that the entire correlation between the two series is related to biofuels. We also include an option for 50% indirect effects, which essentially assumes that the slope coefficient of these bivariate regressions is.50. Table 4 reports the results of bivariate regressions on monthly data on crop prices from the USDA. 16 The table is to be interpreted in the following way: row 2, column 2 reports an estimate of This implies a one percent increase in soybean prices will push up corn prices by about 0.65% and wheat prices by about 0.25%. Similarly a one percent increase in corn prices will push up soybean prices by about 0.55%. We also estimate a one percent increase in wheat prices will push up barley prices by 0.74%. Our estimates for the indirect effect of the increase in corn and soybean prices on beef prices are as follows: a one percent increase in corn prices will push up beef prices by 0.1%, while a one percent increase in soybean prices will push up beef prices by 0.06%. These indirect effects come with a 1-2 year lag, as it takes farmers this long to adjust herd size to new cost pressures. In the short run, however, it may be the case that beef prices fall when agricultural prices rise, since it may be optimal to reduce the stock in order to save on costs. Our calculations allow for the longer run effects of higher feed prices pushing up the price of beef, so we interpret the indirect effects on beef with some caveats. In the interactive spreadsheet we allow the user to select from four indirect effects. One option is None. With this option the total effect of the increase in biofuels production on food prices is due to direct effects (i.e., the results of Equation (3)). The other extreme is 100% indirect effects. This will give the upper bound on the total effect of the increase in biofuels production on food prices. We do not consider either of these extremes to produce reasonable results. More reasonable indirect effect options we include are: the bivariate estimates in Table 4 and a 50% indirect effect across all crops in our analysis. When choosing the indirect effects one must consider what option is being chosen for the elasticities. The choices of elasticities and indirect effects should be consistent. That is, minimum elasticities and 100% indirect effects are not compatible. The reason is that if we think the supply is inelastic then there will be little crop substitution and, therefore little to no impact 16 Data on temperature and precipitation across countries were included in these bivariate regressions to account for some weather effects in the estimation results. 11
14 on the price of other crops. Similarly, one would not want to choose maximum elasticities and 0% indirect effects. 3.4 Time period of analysis The interactive spreadsheet allows the reader to consider how food prices have been impacted by the increase in biofuels over the past one or two years, with the end date always June Although the percentage point increase in agricultural prices due to the increase in biofuels production is smaller for one year as opposed to two, the contribution to the price increase in not necessarily larger. The total increase in a food price is due to many factors. If weather, or another non-biofuels factor, strongly influenced agricultural prices in a given year, then the contribution of biofuels to the price increase will be relatively small. 4. Results We now turn to estimating the impact of an increase in biofuels production on food prices. There are many choices to consider when measuring the effect of increased biofuels production of food prices. Here we allow the reader to consider the following options. Country coverage (World, United States, European Union, Brazil, Rest of World) Time period (1 or 2 years) The size of indirect effects (none to 100%) Elasticities of demand and supply (elastic to inelastic) The Food price of interest o Individual crop price (corn, soybean, sugar, rapeseed, wheat, barley, or beef) o Global food price (IMF food price index) The estimated impact of the increase in biofuels production on food prices depends strongly on the options chosen. This paper includes an interactive spreadsheet that allows the reader to see how sensitive the results are to the various options. To provide an overview of the results, we report what we believe to be the most realistic and important results using what we call our best guess. Our best guess uses median elasticities and indirect effects estimated from bivariate regressions. The following subsections highlight how U.S. biofuels production has pushed up crop prices (Section 4.1) and global food prices (Section 4.2), and how world biofuels production has pushed up global food prices (Section 4.3). There are many other individual country results in the spreadsheet. We leave it to the reader to explore the effects of increased biofuel production in other countries on crop and food prices. 4.1 Effect of the increase in U.S. biofuels on crop prices for the two years ending in June 2008 In the United States, two commodities, corn and soybeans account for over 90 percent of biofuels production. For this reason, the direct effect of the increase in U.S. biofuels production 12
15 is going to show up in the prices of corn and soybeans (soybeans and soybean oil). Since corn and soybeans are substitutes and compete for land, demand for each of these commodities has an indirect effect on the price of the other. There are also indirect effects from demand for these two commodities on the prices of wheat, barley and beef. For this reason, we estimate both the direct and indirect effects of the increased production of U.S. biofuels over the past two years ending in June. Then by comparing the estimated impact of the increased biofuels production on food prices to the actual food price increase, we calculate the share of the price increase that can be attributed to the increase in U.S. biofuels production. Table 5 provides the details of this analysis, which is a subset of the data found on the summary tab of the interactive spreadsheet. Beginning with the direct effects, columns 1 and 2, we estimate that the increase in U.S. biofuels production pushed up corn prices by 19 percentage points (pps), soybean prices by 5 pps, and soybean oil prices also by 5 pps. This suggests that U.S. biofuels production is having a noticeable effect on these crop prices. Since corn prices are up 162 pps over the past two years ending in June 2008, we estimate increased ethanol production accounts for about 12 percent (19/162) of the increase in corn prices. Similarly, soybean prices (soybeans or soybean oil) are up about 156 pps over the last two years (ending in June); the increase in soy-based biodiesel production accounts for about 3 percent of the rise in soybean prices. Note that we consider how the increase in biofuels pushed up both soybeans and soybean oil. Both these, as well as soybean meal, are components of the IMF food index. Although soybean oil is the input to biodiesel, we consider the effect of increased demand for soybean oil for biodiesel to have a proportional effect on soybeans prices. Soybean meal, however, is a byproduct of soybean oil production, so if anything increased demand for soybean oil through increased biodiesel production should push down meal prices. We ignore this last indirect effect, so we may be upwardly biasing our estimates. There are also indirect effects that we must consider, reported in columns 3 and 4. As mentioned in section 3.3, and illustrated numerically here, there are noticeable indirect effects between corn to soybeans as wells as other crops and beef (as corn was diverted from feed stock to ethanol). Taken together, we estimate that the increase in U.S. biofuels production over the last two years ending in June pushed up corn prices by slightly more than 22 pps accounting for 14 percent of the increase in corn prices, while soybean and soybean oil prices rose by 15 pps each, accounting for about 10 percent the price increase for each of these commodities. Therefore, we conclude, the increase in U.S. biofuels production has had a noticeable impact on these individual crop prices. 4.2 Effect of the increase in U.S. biofuels production on global food prices for the 24 months ending in June 2008 To calculate the effect of the increase in U.S. biofuels production on global food prices, we take the estimated effect on individual crop prices, apply the appropriate weight from the IMF food index, and sum over the individual components. 17 This index puts a large weight on soybeans (7 percent of the index), wheat (10 percent) and corn (6 percent); with smaller weights for soybean 17 The weights are only updated once a year. To get the appropriate weight for June of 2008, we take the 2007 weight and multiply this by the price index of the individual grain divided by the IMF food index. 13
16 oil (2.6 percent) and barley (2 percent). So the effect of biofuels on these grain prices translates into a noticeable impact on this measure of global food prices. That said, we find the majority of the rise in global food prices is not accounted for by the increased production of biofuels. Table 6, which is a subset of the data found on the summary tab of the interactive spreadsheet, highlights that the increase in U.S. biofuels production pushed up food prices by just over 4 pps for the 24 month period ending in June (column 5); more than half of this increase is due to indirect effects (column 3). Since global food prices rose 55 percentage points over this period, we estimate that the increase in U.S. biofuels production accounts for 7 percent of the rise in global food prices (column 6). Of this 7 percent, the largest impact comes from corn and soybeans, with just over 2 pps of the increase in global food prices coming from corn and about 1.5 pps coming from soybeans and soybean oil. Wheat also plays a visible role in pushing up global food prices. Although wheat is not used in the U.S. for biofuels production, there are indirect effects from crop substitution coming from increased demand for both corn and soybeans used in biofuels production. 4.3 Effect of the increase in worldwide biofuels production on global food prices for the 24 months ending in June 2008 The analysis for the world is similar to that of the United States, but it considers the impact of increased biofuels production from all countries. 18 Table 7 shows that the increase in world biofuels production pushed up food prices about 7 pps (column 5) for the 24 months ending in June. This is primarily a result of corn, soybeans (including soybean oil) and sugar prices contributing about 4.7 pps. to the rise in the IMF food price index, while wheat and barley prices together contribute just over one percentage point, largely due to indirect effects. The nearly 7 pps rise in the IMF food index reflects a direct effect of the increase in biofuels production on global food prices of 3.74 pps (column 1) and an indirect effect of 3.11 (column 3). The direct effect is primarily driven from corn and soybeans being used in the increased production of biofuels, although the increase in sugar-based ethanol also had a noticeable impact. The indirect effects result from dynamics between corn, soybeans and wheat. Note that we also estimate a positive indirect effect on beef prices from corn and soybean effects, although the USDA suggests that this effect was not evident in the data through June The nearly seven percentage point increase (column 5) in global food prices is a small share of the total increase in the IMF food price index, which rose 55 percent over the 24 month period ending in June. As a result, the increase in production of biofuels accounts for just over 12 percent of the increase in global food prices. The nearly 7 pps rise in global food prices from the increase in world biofuels production is primarily driven by the increase in U.S. biofuels production, pushing prices by about 4 pps. 19 That is, roughly 60 percent of the increase in global food prices attributed to the increase in world biofuels production is explained by the ramp up in U.S. production, while the increase in European Union and Brazilian biofuels production accounts for 15 percent and 14 percent of the increase in global food prices. Other countries 18 Since our analysis includes all of the countries for which there exists good biofuels production data (and this list is rather short), world biofuel production should be read as total known biofuel production. 19 This result can be seen by selecting the individual countries in the interactive spreadsheet and using the data in columns F and G to calculate these ratios. 14
17 such as Argentina, Canada, and China account for only about 5 percent of the increase in global food prices due to biofuel production. We now turn to other studies to see how their estimates differ from our best-guess estimates and through the interactive spreadsheet we can see what types of assumptions (valid or invalid) have to be made to generate these other estimates. 5. Comparison to Other Studies In recent months much has been written about the impact of biofuels on food prices. Not surprisingly, studies estimate the impact of the increase in biofuels production differently using different countries, time periods, and food price indexes. The studies also differ in the methodologies used in the analysis. It is important to know what is being measured and how it is being measured before comparing results. Here we focus on a few studies by international organizations, private individuals, and U.S. government agencies that have attracted media attention. Our goal is to see what types of assumptions are needed to generate the results in these studies in order to evaluate if we think these estimates are realistic. Many studies estimate ethanol s impact on corn prices. These studies, explicitly or implicitly, look at how the U.S. increase in corn-based ethanol production is affecting corn prices. Their estimated share of ethanol s effect on the increase in corn prices ranges from 20% to 60%. Table 8 illustrates the range that we get by varying our assumption on supply and demand elasticities. As shown, maximum elasticities suggest that the increase in ethanol production explains only 4% of the increase in corn prices. Our best-guess estimate is that the increase in ethanol production accounts for 12% of the rise in corn prices. This is a bit less than the estimate given by Chairman Lazear of the Council of Economic Advisers (CEA) in his May 2008 Senate testimony 20. He states that the increase in U.S. corn-based ethanol production accounts for approximately 7.5 percentage points of the 37% increase in corn prices over the past twelve months [ending in March] (Lazear, 2008). So, the CEA estimated the increase in U.S. ethanol production accounted for 20% (7.5/37) of the rise in corn prices. The difference between our estimate and the CEA s is likely attributed to the additional run-up in corn prices from March to June; over this four month period corn prices increased more than 22 percent while ethanol production did not ramp up. The International Monetary Fund s October 2008 World Economic Outlook provides a range for the share of the rise in corn prices attributable to ethanol production in the United States of 25-45%. They state this estimate holds for a given range of plausible values for the price elasticity of demand (IMF 2008). This fits in our elasticity range, but only for values of elasticities that are quite low. Finally, Collins, in an independent study for Kraft foods, estimated two scenarios. Under the normal scenario, the increase in ethanol production accounted for 30% of the rise in corn prices over the past two years; a little more than double our best estimate expressed in Table 8. In his restricted scenario ethanol could account for 60 percent of the expected increase in corn prices between 2006/07 and 2008/09 when market 20 Though we are looking over slightly different time periods; Lazear s comments are for corn prices over the twelve months ending in March, and we are looking at the 12 months ending in June. 15
18 demand and supply are inelastic with respect to price i.e., a period when stocks are very low, feed use is slow to respond, export demand is strong due to foreign agricultural policies, and acreage is very constrained (Collins, 2008). If we use the minimum demand and supply elasticities and assume that there are no indirect effects, then ethanol production accounts for, at most, 45% of the increase in corn prices for the 24 month period ending June We conclude that Collins restricted scenario estimate is too large to be plausible, even under restrictive assumptions. As one can see above, the estimated effect of the increase in ethanol production on corn prices depends strongly on the assumed elasticity. Has the supply of corn been more or less responsive to price movements this past year than in previous periods? Collins and the IMF s large estimates rely on an assumption that today s market conditions are not consistent with recent historical periods. We do not believe that this is the case and, in fact, the later part of 2008 has seen corn prices retrace most of the run-up from earlier in the year. This suggests that it was more standard factors, not ethanol, responsible for a share of the increase and then decrease in corn prices over this period. Other studies estimate biofuels impact on corn prices. This includes ethanol s direct impact on corn prices, as well as soybean and other biodiesel commodities indirect effects on corn prices. The USDA s chief economist, Joseph Glauber, testified to the Senate in June 2008 about the U.S. biofuels effect on food prices. For the 12 months ending in April, USDA estimates that corn prices would have increased 47.5 pps instead of 61.7 pps, implying that the increase in U.S. biofuels accounted for about 25 percent of the rise in corn prices (Glauber, 2008b). In Table 9, our best-guess estimate is that the increase in U.S. biofuels production over the past year accounted for 17 percent of the rise in corn prices over this same 12 month period. The two estimates imply that roughly 80 percent of the price increase of corn is due to factors other than increased biofuels production. The largest estimate of biofuels impact on corn prices comes from the IMF. John Lipsky (2008) and Simon Johnson (2008) independently suggested that the increased demand for world biofuels between 2005 and 2007 accounts for 70 percent of the increase in corn prices. As shown in Table 9, the closest we can come to this estimate is if we use our minimum elasticity AND 100% indirect effects. However, as noted before, minimum elasticities and 100% indirect effects cannot occur at the same time since minimum elasticities imply no supply response in the short run and hence this means crop substitution is not possible. Therefore, we find that the IMF estimate is not realistic. In fact, if one looks at the data behind the IMF statement, one sees that the analysis attributes the rise in corn prices exclusively to energy or biofuels and excludes other factors. Therefore, the study is putting the effect of all other factors into these two categories, inflating the biofuels impact on corn prices in their analysis. Finally, we turn to studies of biofuels impact on global food prices. All studies use the IMF food index in the primary commodities index as a proxy for global food prices. The USDA s chief economist testified that assuming no growth in biofuels production in the United States, the IMF global food commodity price index would have increased by 40.6 percent, down from the actual increase of 45.0 percent, from April 2007 to April 2008 (Glauber, 2008b). This suggests that the increase in U.S. biofuels production accounts for about 10 percent of the rise in 16
19 global food prices over that period. This is double our best-guess estimate of roughly 5% over the 12 months ending in June 2008; however, the time period is a bit different and will make our estimate smaller than one using April 2008 as an end point. A study that suggests a large impact of biofuels on global food prices is by the World Bank. This study finds that from 2002 to mid-2008, most of the remaining 75 percent increase in food commodities prices was due to [world] biofuels and the related consequences of low grain stocks, large land use shifts, speculative activity and export bans (Mitchell, 2008). The data for biofuels production that we consider reliable does not go back to 2002, but even looking over the past 2 years, as shown in Table 10, one can see that a contribution close to 75% is only possible if one assumes inelastic supply and demand combined with 100% indirect effects. As we stated before, these combined assumptions are not economically reasonable. The World Bank study, however, does not base its biofuels estimate on standard economic modeling it calls its methodology ad hoc. The study only quantifies three factors responsible for pushing up global food prices: energy, the dollar, and biofuels. Using data on the movement in the dollar and energy prices over the past several years, the study estimates the impact of these factors on food prices. The effect of biofuels is the residual. The study argues the impact of other factors (adverse weather, increased demand from emerging markets, etc) is appointed to the increase in biofuels production because without biofuels production these other factors would not have had an effect on global food prices. One has to decide if this ad hoc methodology should be used instead of standard economic analysis. In our opinion, the answer is no. In summary, there are many studies with very different estimates of the impact of biofuels on crop and global food prices. Various assumptions are being made to get these estimates - some of which are economically reasonable and feasible, while others seem a bit unrealistic. Unfortunately, most media attention has been given to the extreme estimates without much consideration for the economic assumptions that must be made to generate these results. Once we look at the underlying assumptions, we see that these eye-popping estimates are unrealistic. 6. Conclusion This paper, with its interactive spreadsheet, provides a nice foundation for analyzing the effect of biofuels production on crop and global food prices. By allowing the reader to choose the country, time period, supply and demand elasticities, and the size of indirect effects, we explicitly illustrate the sensitivity of the estimated effect of biofuels production on prices. Our best estimates suggest that the increase in biofuels production over the past two years has had a sizeable impact on corn, soybeans, wheat and barley prices, but a much smaller impact on global food prices. The small effect on food prices results from the fact that there are many components of the food index that are not affected by biofuels. Our best estimates suggest that the United States increase in biofuels production (ethanol and biodiesel) over the 24 months ending in June 2008 pushed up corn prices by 22 percentage points, accounting for 14 percent of the rise in corn prices, and pushed up soybean prices (soybeans and soybean oil) by 15 percentage points, accounting for about 10 percent of the rise in these prices. As a share of the total crop price increases, ethanol s contribution is small. 17
20 However, in absolute terms, these are sizeable effects. We estimate that the increase in world biofuels production accounts for just over 12% of the rise in global food prices, with increased U.S. biofuel production accounting for roughly 60% of this total increase. Though the United States accounts for roughly 60 percent of the total increase of the IMF s food price index due to biofuels production, the increase is small, just over 7 percent. Therefore, we conclude that nearly 90 percent of the price increase in global food prices is due to factors other than biofuels production. Our analysis also highlights that other studies, which find much larger effects of biofuels production on crop and food prices, can only be generated using unrealistic assumptions both inelastic supply and large indirect effects. We argue that these two assumptions are inconsistent and, hence, these studies are misleading. In the end, we leave the reader with our interactive spreadsheet to determine what they believe are valid assumptions to determine their own estimate of the impact of biofuels production on food and crop prices. 18
21 References Abbot, P., Hurt, C., & Tyner, W. (2008). What's Driving Food s. Farm Foundation Issue Report (75). Collins, K. (2008). The Role of Biofuels and Other Factors in Increasing Farm and Food s: A Review of Recent Developments with a Focus on Feed Grain Markets and Market Prospects. Kraft Foods Global, Inc. Council of Economic Advisers. (2008). Searching for Alternative Energy Solutions. In Economic Report of the President (pp ). Washington DC: Executive Office of the President. Coyle, W. (2007). The Future of Biofuels: A Global Perspective. Amber Waves, 5 (5), Dickerson, M. (2006, September 19). Farmers' Hopes Sprout as Brazil Bets on Biodiesel. Los Angeles Times, pp. C-1. Elam, T. E. (2008). Biofuels Support Costs to the U.S. Economy: The Key Role of the RFS in a Feedstock Shortage Scenario. The Coalition for Balanced Food and Fuel Policy. Elbobeid, A., & Tokgoz, S. (2008). Removing Distortions in the U.S. Ethanol Market: What Does it Imply for the United States and Brazil. American Journal of Agricultural Economics, 90 (4), FAPRI (Food and Agricultural Policy Research Institute). (2008). FAPRI 2008 U.S. and World Agricultural Outlook. Ames, Iowa: University of Missouri-Columbia Ginder, R. (2004). Evaluating Bio-diesel as a Value-added Opportunity. Agricultural Marketing Resource Center. Glauber, J. (2008a). Statement to the U.S. Congress Joint Economic Committee. Increasing Food s. Washington DC: Hearing. Glauber, J. (2008b). Statement to the U.S. Senate Committee on Energy and Natural Resources. Full Committee Hearing to Receive Testimony on the Relationship Between U.S. Renewable Fuels Policy and Food s. SD-366. Washington DC: Hearing. Hofstrand, D. (2007, March). Energy Agriculture - Corn Ethanol. Ag Decision Maker Newsletter. International Monetary Fund. (2008). Is Inflation Back? Commodity s and Inflation. In World Economic Outlook October 2008 (pp ). Washington DC: International Monetary Fund. Johnson, S. (2008, April 25). Commodity s: Outlook & Risks. Washington DC: International Monetary Fund. 19
22 Lazear, E. P. (2008). Statement to the U.S. Senate Committee on Foreign Relations. Responding to the Global Food Crisis. Washington DC: Hearing. Lipsky, J. (2008). Commodity s and Global Inflation. New York: Council on Foreign Relations. Mitchell, D. (2008). A Note on Rising Food s. World Bank Development Prospects Groupk, Policy Working Paper, Renewable Fuels Association. (2008). Changing the Climate: Ethanol Industry Outlook. Schmidt, C. W. (2007). Biodiesel: Cultivating Alternative Fuels. Environmental Health Perspectives, 115 (2), A87-A91. Trostle, R. (2008). Clobal Agricultural Supply and Demand: Factors Contributing to the Recent Increase in Food and Commodity s. Washington DC: United States Department of Agriculture: Economics Research Service. Westcott, P. (2007). Ethanol Expansion in the United States: How Will the Agricultural Sector Adjust? Washington DC: United States Department of Agriculture: Economics Research Service. 20
23 Appendix A.1. Data Appendix Description of tabs in Spreadsheet: Direct Effect tab Pulls calculations of the direct effect from Calculations tab, conditional on country, time period and elasticities chosen. Indirect effects tab Matrices that contain all indirect effects and possible combinations that can be chosen. Columns B-N: Indirect effect multiplied by IMF weight and price ratio in columns Q-U. Columns AL-AX: Indirect effect multiplied by price increase in columns AE-AI. Columns X-AB: Indirect effect coefficients. By Crop tab Takes data in Biofuels2008 tab and splits up the data by commodity and country. Total is the total production of countries given in the FAPRI data. Shares are calculated with 1/3 + 2/3 since we are looking at June data. US2008 Contains data on U.S. crop utilization from FAPRI. Biofuels2008 tab FAPRI s 2008 Economic Outlook, Biofuels spreadsheet. United States use in ethanol is FAPRI data (US2008 tab), converted to calendar year with 2/3 first market year + 1/3 second market year (convention used by FAPRI). Converted oils back to beans using extraction ratios given by FAPRI. Production_Crop tab This spreadsheet calculates Equation 3 in the paper. Column B and J are from the World Production tab. Column C and K are from By Crop tab Columns D, E, L and M from Elasticities and Calculations tabs World production FAPRI data converted to calendar year. IMF Food Index tab Data and simple calculations. Calculations tab Calculates how much biofuels pushed up each crop price then calculates how much it pushed up IMF food index (worldwide) using weight of item in index and price ratio. Then the share of the worldwide increase is divided among each country. 21
24 Elasticities tab FAPRI database. Except demand for sugarcane which is from the Elbobeid and Tokgoz paper mentioned in the references section. Calculations2 and Direct Effect tabs Internal working sheet. A.2. Assumptions Soybeans Biodiesel converted to soybeans. Calculate price effect on soybeans. Assume same price increase on soybean oils (not on soy meal). So biofuels effect is on soybeans and soy oil, not soy meal. Rapeseed We do the calculation of pushing up rapeseed prices and then assume same price increase in rapeseed oil, which is what is in the IMF index. Sugarcane We do the calculation of how much sugarcane price is increased and use that for sugar items in the IMF index. 22
25 Year Renewable Biofuel Table 1 United States Biofuel Standards Billion Gallons per Year Advanced Cellulosic Biomass Biofuel Biofuel based Undifferentiated Advanced Biofuel Total Biofuel Mandate Diesel Source: Renewable Fuels Association Table 2 Rise in Food - Period Ending June 2008 Weight Percent Change (%) (%) 12-months 2 years 3 years 20 year average IMF food Index IMF Cereals Corn Wheat Barley Soybeans Soybean Oil Rapeseed Oil Sugar Beef Source: International Monetary Fund s Primary Commodities Index 23
26 Table 3 Mean and Median Elasticities Demand Supply Mean Median Max Min Mean Median Max Min Corn Sugar Wheat Barley Soybeans Rapeseed Sources: FAPRI and Elbobied and Tokgoz (2008) Table 4 Bivariate Indirect Effects (%) Indirect Effects Corn Soy Wheat Barley Corn Soy Wheat Barley Beef Memo: column is the independent variable; row is the dependent variable. Table 5 Effects of U.S. Biofuels Production on Individual Food s Direct Effect Indirect Effect Total Effect Share of Share of Pushed up (pps) Total Increase (%) Pushed up (pps) Total Increase (%) Pushed up (pps) Share of Total Increase (%) (1) (2) (3) (4) (5 = 1+3) (6 = 2+4) Corn Wheat Barley Soybeans Soybean Oil Beef
27 Table 6 Effects of U.S. Biofuels Production on Global Food s Direct Effect Indirect Effect Total Effect Share of Share of Pushed up Pushed up Pushed up Increase Increase (pps) (pps) (pps) (%) (%) Share of Increase (%) (1) (2) (3) (4) (5 =1+3) (6 = 2+4) IMF Food Index Corn Wheat Barley Soybeans Soybean Oil Beef Table 7 Effects of World Biofuels Production on Global Food s Direct Effect Indirect Effect Total Effect Share of Share of Pushed up (pps) Total Increase (%) Pushed up (pps) Total Increase (%) Pushed up (pps) Share of Total Increase (%) (1) (2) (3) (4) (5=1+3) (6=2+4) IMF Food Index Corn Sugar Wheat Barley Soybeans Soybean Oil Beef
28 Table 8 Share of U.S./ World Ethanol Production of Corn Increase* Direct Effect and Various Elasticities Maximum Median Elasticity Elasticity Minimum Elasticity 1 year 4% 12% 51% 2 years 4% 12% 45% * These estimates are the share of corn s price increase due to ethanol production; only considers the direct effects; the estimates for the United States and World are similar since the United States produces over 90 percent of worldwide corn-based ethanol. Table 9 Share of World Biofuels Production of Corn Increase* Indirect and Direct Effect, Various Elasticities Median Maximum Elasticity and Minimum Elasticity and Elasticity and 0 bivariate 100% indirect effects indirect effects indirect effects 1 year 5% 17% 67% 2 years 5% 17% 62% * These estimates are the direct plus indirect effects of biofuels production on corn price inflation. Table 10 Share of World Biofuels Production of Global Food Increase* Median Maximum Elasticity and Minimum Elasticity and Elasticity and 0 bivariate 100% indirect effects indirect effects indirect effects 1 year 2% 8% 51% 2 years 3% 12% 74% * These estimates are the share of food price increases due to biofuels production; these estimates consider both direct plus indirect effects on the IMF food price index. 26
29 Figure 1 - Corn and US Ethanol Production, Jan Mar Thousands of Barrels Dollars per Bushel 30, , ,000 15,000 Cash Corn - Central Illinois ($/bushel) ,000 5,000 Monthly Ethanol Production (Thousands of Barrels) Sources: USDA and the Energy Information Association Figure 2 - Soybean s and US Biodiesel Production, Jan Mar Thousands of Barrels Dollars per Bushel 20 1,350 1, Monthly Biodiesel Production - (thousands of barrels) Cash Soybean - Central Illinois ($ / bushel) Sources: USDA and the July 2008 Monthyl Energy Review, EIA 27
30 28
31 29
32 30
Policy Options for Integrated Energy and Agricultural Markets and Global Biofuels Impacts
 Policy Options for Integrated Energy and Agricultural Markets and Global Biofuels Impacts Wally Tyner Collaborators: Dileep Birur, Tom Hertel, Farzad Taheripour Main Topics Energy and agricultural markets
Soybean Supply and Demand Forecast
 Soybean Supply and Demand Forecast U.S. soybean planted acreage is expected to increase 11.5 million acres over the forecast period. U.S. soybean yields are expected to increase 7 bushels per acre or an
298,320 3,041 107,825. Missouri Economic Research Brief FARM AND AGRIBUSINESS. Employment. Number of Agribusinesses.
 Missouri Economic Research Brief FARM AND AGRIBUSINESS Missouri s Farm and Agribusiness Missouri s farm and agribusiness sectors include crops, livestock, industries supporting farm production and farm-related
Abstract. In this paper, we attempt to establish a relationship between oil prices and the supply of
 The Effect of Oil Prices on the Domestic Supply of Corn: An Econometric Analysis Daniel Blanchard, Saloni Sharma, Abbas Raza April 2015 Georgia Institute of Technology Abstract In this paper, we attempt
Grains and Oilseeds Outlook
 United States Department of Agriculture Grains and Oilseeds Outlook Friday, February 26, 2016 www.usda.gov/oce/forum Agricultural Outlook Forum 2016 Released: Friday, February 26, 2016 GRAINS AND OILSEEDS
Grains and Oilseeds Outlook
 United States Department of Agriculture Grains and Oilseeds Outlook Friday, February 20, 2015 www.usda.gov/oce/forum Agricultural Outlook Forum 2015 Released: Friday, February 20, 2015 GRAINS AND OILSEEDS
OILSEEDS AND OILSEED PRODUCTS
 3. COMMODITY SNAPSHOTS OILSEEDS AND OILSEED PRODUCTS Market situation Global oilseeds production in the 214 marketing year (see glossary for a definition of marketing year) reached record levels for the
Effects of Recent Energy Price Reductions on U.S. Agriculture
 United States Department of Agriculture BIO-04 June 2015 A Report from the Economic Research Service www.ers.usda.gov Effects of Recent Energy Price Reductions on U.S. Agriculture Kandice K. Marshall,
U.S. crop program fiscal costs: Revised estimates with updated participation information
 U.S. crop program fiscal costs: Revised estimates with updated participation information June 2015 FAPRI MU Report #02 15 Providing objective analysis for 30 years www.fapri.missouri.edu Published by the
FUTURES TRADERS GUIDE TO THE WASDE
 FUTURES TRADERS GUIDE TO THE WASDE Your Guide To Understanding The USDA World Agriculture Supply & Demand Estimates For Corn, Soybeans And Wheat By Craig & Drew Daniels 1.800.800.3840 What Is The WASDE?
Energy in 2020: Assessing the Economic Effects of Commercialization of Cellulosic Ethanol
 Energy in 2020: Assessing the Economic Effects of Commercialization of Cellulosic Ethanol by Stefan Osborne Office of Competition and Economic Analysis Executive Summary U.S. dependence on imports of crude
STATEMENT OF HOWARD GRUENSPECHT DEPUTY ADMINISTRATOR ENERGY INFORMATION ADMINISTRATION U.S. DEPARTMENT OF ENERGY BEFORE THE
 STATEMENT OF HOWARD GRUENSPECHT DEPUTY ADMINISTRATOR ENERGY INFORMATION ADMINISTRATION U.S. DEPARTMENT OF ENERGY BEFORE THE COMMITTEE ON ENERGY AND COMMERCE SUBCOMMITTEE ON ENERGY AND POWER UNITED STATES
Presentation by Dr James Fry, Chairman, LMC International, Oxford, UK to the Canola Council of Canada Vancouver, B.C., March 2013 www.lmc.co.
 Key global trends in agriculture and in oils in particular Presentation by Dr James Fry, Chairman, LMC International, Oxford, UK to the Canola Council of Canada Vancouver, B.C., March 2013 www.lmc.co.uk
RISK FACTORS IN ETHANOL PRODUCTION
 RISK FACTORS IN ETHANOL PRODUCTION David Coltrain Extension Assistant, Department of Agricultural Economics Kansas Cooperative Development Center Kansas State University Manhattan, KS 66506 785-532-1523
A Note on Rising Food Prices
 Public Disclosure Authorized Public Disclosure Authorized Public Disclosure Authorized Public Disclosure Authorized POLICY RESEARCH WORKING PAPER 4682 A Note on Rising Food Prices The World Bank Development
Missouri Soybean Economic Impact Report
 Missouri Soybean Economic Report State Analysis March 2014 The following soybean economic impact values were estimated by Value Ag, LLC, as part of a Missouri Soybean Merchandising Council funded project.
AGRICULTURE FOR FOOD AND FOR BIOENEGY: IS IT POSSIBLE?
 GLOBAL SUSTAINABLE BIOENERGY PROJECT AGRICULTURE FOR FOOD AND FOR BIOENEGY: IS IT POSSIBLE? Dr. Rodolfo Quintero-Ramírez March 24 th, 2010 Sao Paulo, Brazil ? FOOD ANIMAL FEED AGRICULTURE BIOENERGY BIOPRODUCTS
Technical/Business Planning: For Small-Scale Oilseed Processing and Biodiesel Production
 Agricultural Marketing Resource Center Value-added Agriculture Profile Iowa State University November 2008 Technical/Business Planning: For Small-Scale Oilseed Processing and Biodiesel Production By Gary
FCStone Grain Recap January 6, 2016
 CORN: CH16 made new contract lows but were unable to hold below unchanged into the close. Weekly ethanol production marginally higher this week, up 4 thbpd to 996. Ethanol stocks built again reaching 21099
3.3 Real Returns Above Variable Costs
 3.3 Real Returns Above Variable Costs Several factors can impact the returns above variable costs for crop producers. Over a long period of time, sustained increases in the growth rate for purchased inputs
this section shall not count toward pay limits under the 2014 Farm Bill limits. (Section 1119)
") Title I Commodities (1) Repeal of Direct Payments Section 1101 of the House bill repeals direct payments effective with the 2014 crop year. The section continues direct payments for the 2013 crop year
Title I Commodities (1) Repeal of Direct Payments Section 1101 of the House bill repeals direct payments effective with the 2014 crop year. The section continues direct payments for the 2013 crop year
Impacts of the EU biofuel policy on agricultural markets and land use
 Impacts of the EU biofuel policy on agricultural markets and land use Modelling assessment with AGLINK-COSIMO (2012 version) Sophie Hélaine Robert M barek Hubertus Gay 2 0 1 3 Report EUR 26107 EN European
Economic Effects of the Sugar Program Since the 2008 Farm Bill & Policy Implications for the 2013 Farm Bill
 Economic Effects of the Sugar Program Since the 2008 Farm Bill & Policy Implications for the 2013 Farm Bill June 3, 2013 Overview Changes to the sugar program in the 2008 farm bill made a bad program even
COMMODITIES Precious Metals Industrial (Base) Metals Commodities Grains and Oilseeds Softs affect supply curves Exotics Standardization Tradability
 Metals Commodities Grains and Oilseeds Softs affect supply curves Exotics Standardization Tradability") COMMODITIES Commodities: real and tangible assets that are elements of food (agricultural products like wheat and corn), fuel (oil, gas), metals (ex: copper, aluminum, gold, tin, zinc), and natural resources
COMMODITIES Commodities: real and tangible assets that are elements of food (agricultural products like wheat and corn), fuel (oil, gas), metals (ex: copper, aluminum, gold, tin, zinc), and natural resources
Third Quarter 2015 Earnings Conference Call. 21 August 2015
 Third Quarter 2015 Earnings Conference Call 21 August 2015 Safe Harbor Statement & Disclosures The earnings call and accompanying material include forward-looking comments and information concerning the
Liquid Biofuels for Transport
 page 1/11 Scientific Facts on Liquid Biofuels for Transport Prospects, risks and opportunities Source document: FAO (2008) Summary & Details: GreenFacts Context - Serious questions are being raised about
AIC Farm Bill Brief #1
 University of California July 2007 Agricultural Issues Center AIC Farm Bill Brief #1 The Farm Bill and California Food and Agriculture* Daniel A. Sumner** Every five years or so the United States reconsiders
Policy Options for Integrated Energy and Agricultural Markets. Wally Tyner Farzad Taheripour
 Policy Options for Integrated Energy and Agricultural Markets Wally Tyner Farzad Taheripour Market Integration In the past, agricultural markets have been well integrated. Markets for different energy
BIODIESEL THE NEW FUEL FROM BRAZIL NATIONAL BIODIESEL PRODUCTION & USE PROGRAM
 BIODIESEL THE NEW FUEL FROM BRAZIL NATIONAL BIODIESEL PRODUCTION & USE PROGRAM BIODIESEL: THE NEW FUEL FROM BRAZIL The Brazilian Government has just authorized the commercial use of a new fuel. Brazil
Renewable energy in transport
 Renewable energy in transport Source: http://worldwideed.staradvertiserblogs.com/2009/11/23/fun-day-monday-free-transport-from-naia-airport World transport energy use is growing rapidly Source: IEA Energy
Have Recent Increases in International Cereal Prices Been Transmitted to Domestic Economies? The experience in seven large Asian countries
 Have Recent Increases in International Cereal Prices Been Transmitted to Domestic Economies? The experience in seven large Asian countries David Dawe ESA Working Paper No. 08-03 April 2008 Agricultural
U.S. Agriculture and International Trade
 Curriculum Guide I. Goals and Objectives A. Understand the importance of exports and imports to agriculture and how risk management is affected. B. Understand factors causing exports to change. C. Understand
Total Income from Farming in the United Kingdom. First estimate for 2015
 28 April 2016 Total Income from Farming in the United Kingdom First estimate for 2015 This release presents the first estimate of Total Income from Farming for the United Kingdom for 2015. Total Income
Agricultural Production and Research in Heilongjiang Province, China. Jiang Enchen. Professor, Department of Agricultural Engineering, Northeast
 1 Agricultural Production and Research in Heilongjiang Province, China Jiang Enchen Professor, Department of Agricultural Engineering, Northeast Agricultural University, Harbin, China. Post code: 150030
3.2 Extent of food losses and waste
 4 3. Extent of food losses and waste 3.1 Food volumes produced Figure 1 illustrates the 2007 production volumes of all commodity groups in their primary form, including animal feed products (which are
The 2024 prospects for EU agricultural markets: drivers and uncertainties. Tassos Haniotis
 1. Introduction The 2024 prospects for EU agricultural markets: drivers and uncertainties Tassos Haniotis Director of Economic Analysis, Perspectives and Evaluations; Communication DG Agriculture and Rural
Outlook for the 2013 U.S. Farm Economy
 Outlook for the 213 U.S. Farm Economy Kevin Patrick Farm and Rural Business Branch Resource and Rural Economics Division Highlights Net farm income in 213 forecast: $128.2 billion Net cash income in 213
SOURCES AND USES OF FUNDS ON KFMA FARMS
 KANSAS FARM MANAGEMENT ASSOCIATION Your Farm - Your Information - Your Decision N E W S L E T T E R Volume 6, Issue 3 March 2012 SOURCES AND USES OF FUNDS ON KFMA FARMS A flow of funds report, often referred
Chuck Neece Director Research and Development FUMPA BioFuels
 Chuck Neece Director Research and Development FUMPA BioFuels What is Biodiesel? Just give me the Facts! Biodiesel is Not! Just filtered grease or oil in your tank This would not be chemically changed to
USDA Agricultural Projections to 2025
 United States Department of Agriculture Office of the Chief Economist World Agricultural Outlook Board Long-term Projections Report OCE-2016-1 February 2016 USDA Agricultural Projections to 2025 Interagency
seasonal causality in the energy commodities
 PROFESSIONAL BRIEFING aestimatio, the ieb international journal of finance, 2011. 3: 02-9 2011 aestimatio, the ieb international journal of finance seasonal causality in the energy commodities Díaz Rodríguez,
Analysis for Strategic Planning Applied to Ethanol and Distillers Grain
 International Food and Agribusiness Management Review Volume 16, Special Issue 3, 2013 Analysis for Strategic Planning Applied to Ethanol and Distillers Grain Dennis M. Conley Professor and Director, Graduate
Supply & demand outlook for the canola industry
 Supply & demand outlook for the canola industry J.P. Gervais Chief Ag Economist March 2015 @jpgervais Canola Canola is one component of the environment for oil producing crops Growth in demand has supported
First Quarter 2015 Earnings Conference Call. 20 February 2015
 First Quarter 2015 Earnings Conference Call 20 February 2015 Safe Harbor Statement & Disclosures The earnings call and accompanying material include forward-looking comments and information concerning
Canadian Agricultural Outlook
 2015 Canadian Agricultural Outlook Information contained in this report is current as of February 11, 2015. Her Majesty the Queen in Right of Canada, represented by the Minister of Agriculture and Agri-Food,
JOINT EXPLANATORY STATEMENT OF THE COMMITTEE OF CONFERENCE
 JOINT EXPLANATORY STATEMENT OF THE COMMITTEE OF CONFERENCE The managers on the part of the House and the Senate at the conference on the disagreeing votes of the two Houses on the amendment of the House
Market Monitor Number 3 November 2012
 Market Monitor Number 3 November 2012 AMIS Crops: World Supply-Demand Balances in 2012/13 World supply and demand situation continues to tighten for wheat and maize but rice and soybeans have eased. In
Market-Driven Inventory System (MDIS)
") Market-Driven Over the last dozen years, low-price and high-price extremes revealed shortcomings of the U.S. agricultural commodity program. Under the current program when supply exceeds demand, crop prices
Market-Driven Over the last dozen years, low-price and high-price extremes revealed shortcomings of the U.S. agricultural commodity program. Under the current program when supply exceeds demand, crop prices
ANALYSIS OF POTENTIAL CAUSES
 ANALYSIS OF POTENTIAL CAUSES OF CONSUMER FOOD PRICE INFLATION Prepared for: THE RENEWABLE FUELS FOUNDATION Prepared by: November 2007 TABLE OF CONTENTS I. Executive Summary...4 A. Introduction...4 B. Key
July 2010. Chart 1: World Edible Oil Production
 Agricultural Products An Overview of the Edible Oil Markets: Crude Palm Oil vs Soybean Oil July 2010 Edible vegetable oils are some of the most crucial cooking ingredients in the world. In addition, edible
INTRODUCTION TO THE ETHANOL SUPPLEMENT
 INTRODUCTION TO THE Program planning for export market development must take into account the diversity of market development programs, geographic realities, economic conditions, the nature of constraints
GLOBAL BIOFUELS OUTLOOK 2010-2020 MAELLE SOARES PINTO DIRECTOR BIOFUELS EUROPE & AFRICA WORLD BIOFUELS MARKETS, ROTTERDAM MARCH 23, 2011
 GLOBAL BIOFUELS OUTLOOK 2010-2020 MAELLE SOARES PINTO DIRECTOR BIOFUELS EUROPE & AFRICA WORLD BIOFUELS MARKETS, ROTTERDAM MARCH 23, 2011 Presentation Overview Global Outlook Biofuels Mandates in 2010 Total
Tennessee Agricultural Production and Rural Infrastructure
 Tennessee Trends in Agricultural Production and Infrastructure Highlights - In many states the percentage of the state population designated by the U.S. Census Bureau as living in rural areas has declined,
AGRI- BUSINESS IN ARGENTINA A SEMINAR ON INVESTMENT OPPORTUNITIES
 AGRI- BUSINESS IN ARGENTINA A SEMINAR ON INVESTMENT OPPORTUNITIES Maximiliano Moreno Director of Multilateral Negotiations Ministry of Agriculture, Livestock and Fisheries Argentina NEW INTERNATIONAL ENVIRONMENT
Issues In Agriculture
 Issues In Agriculture John Stulp, Commissioner of Agriculture November, 2010 Colorado Department of Agriculture CDA is charged with: Strengthening and advancing Colorado s agriculture industry; Ensuring
OECD-FAO Agricultural Outlook 2012 OECD/FAO 2012. Chapter 3. Biofuels
 OECD-FAO Agricultural Outlook 2012 OECD/FAO 2012 Chapter 3 Biofuels 87 Biofuels were added to the Outlook in 2008 as an emerging sector that would increasingly affect agricultural markets. This has certainly
Grain marketing in the real world
 2009 GRDC FOR IRRIGATION CROPPERS Grain marketing in the real world Paper prepared by Ron Storey Australian Crop Forecaster Email: ron@cropforecasters.com.au IREC C/- CSIRO Land and Water, Griffith Private
From Biomass. NREL Leads the Way. to Biofuels
 From Biomass NREL Leads the Way to Biofuels The Wide World of Biofuels Fuel Source Benefits Maturity Grain/Sugar Ethanol Biodiesel Corn, sorghum, and sugarcane Vegetable oils, fats, and greases Produces
The Determinants of Food Prices in Pakistan. Henna Ahsan, Zainab Iftikhar, M. Ali Kemal
 The Lahore Journal of Economics 17 : 1 (Summer 2012): pp. 101 128 The Determinants of Food Prices in Pakistan Henna Ahsan, Zainab Iftikhar, M. Ali Kemal Abstract Controlling prices is one of the biggest
The Supplementary Insurance Coverage Option: A New Risk Management Tool for Wyoming Producers
 The Supplementary Insurance Coverage Option: A New Risk Management Tool for Wyoming Producers Agricultural Marketing Policy Center Linfield Hall P.O. Box 172920 Montana State University Bozeman, MT 59717-2920
Farm Commodity Programs and the 2007 Farm Bill
 Order Code RS21999 Updated January 25, 2008 Farm Commodity Programs and the 2007 Farm Bill Jim Monke Specialist in Agricultural Policy Resources, Science, and Industry Division Summary The farm commodity
Enhancing International Cooperation on Biomass
 Enhancing International Cooperation on Biomass 1 Biofuels- issues, challenges and options J. Gururaja Energy and Dransport Branch Department of Economic and Social Affairs United Nations New York > 2 Key
ANALYSIS OF LEBANON S FOOD MARKET
 ANALYSIS OF LEBANON S FOOD MARKET Table of Contents World Food Market 3 Lebanon s Food Production 8 Lebanon s Food Imports and Exports 11 Evolution of Food Imports 11 Food Imports by Type 12 Food Imports
CONTRIBUTION OF THE ETHANOL INDUSTRY TO THE ECONOMY OF THE UNITED STATES IN 2014
 CONTRIBUTION OF THE ETHANOL INDUSTRY TO THE ECONOMY OF THE UNITED STATES IN 2014 Prepared for the Renewable Fuels Association by John M. Urbanchuk Managing Partner February 2015 The U.S. ethanol industry
FCStone Grain Recap October 1, 2015
 CORN: A choppy but firm market today. Today starts the march of the private crop estimates led off with FCStone s number this afternoon. Export sales reported today showed net bookings of 748.2 tmt as
Fertilizer is a world market commodity, which means that supply
 Supply & demand, Energy Drive Global fertilizer prices The Fertilizer Institute Nourish, Replenish, Grow Fertilizer is a world market commodity necessary for the production of food, feed, fuel fiber. &
World Fuel Ethanol. Analysis and Outlook. Prepared for METI. Dr. Christoph Berg, F.O. Licht
 Analysis and Outlook Prepared for METI By Dr. Christoph Berg, F.O. Licht 1 Some basic concepts By production route: Fermentation vs. Synthetic By composition: Anhydrous vs. Hydrous By end-use: Beverage,
Commodity Market Monthly
 Commodity Market Monthly 1 Research Department, Commodities Team* February 11, 215 www.imf.org/commodities Commodity prices fell by 12. percent in January, mainly the result of a sharp decline in oil prices.
Member States Factsheets I T A L Y CONTENTS. Main figures - Year 2014 59 685 227 inhabitants Area 302 069 km 2
 January 2015 Member States Factsheets I T A L Y CONTENTS Main figures 2014 1. KEY DATA 2. POPULATION & ECONOMY 3. FINANCIAL ASPECTS 4. ECONOMIC ACCOUNTS 5. AGRICULTURAL TRADE 6. FARM STRUCTURE 1 2 3 4-5
Member States Factsheets I R E L A N D CONTENTS. Main figures - Year 2014 4 591 087 inhabitants Area 69 798 km 2
 January 2015 Member States Factsheets I R E L A N D CONTENTS Main figures 2014 1. KEY DATA 2. POPULATION & ECONOMY 3. FINANCIAL ASPECTS 4. ECONOMIC ACCOUNTS 5. AGRICULTURAL TRADE 6. FARM STRUCTURE 1 2
Corn Transportation Profile
 Corn Transportation Profile AMS Transportation and Marketing Programs August 2014 Marina R. Denicoff Marvin E. Prater Pierre Bahizi Executive Summary America s farmers depend on transportation as the critical
Third Quarter 2014 Earnings Conference Call. 13 August 2014
 Third Quarter 2014 Earnings Conference Call 13 August 2014 Safe Harbor Statement & Disclosures The earnings call and accompanying material include forward-looking comments and information concerning the
Chapter Five: Risk Management and Commodity Markets
 Chapter Five: Risk Management and Commodity Markets All business firms face risk; agricultural businesses more than most. Temperature and precipitation are largely beyond anyone s control, yet these factors
Managing Feed and Milk Price Risk: Futures Markets and Insurance Alternatives
 Managing Feed and Milk Price Risk: Futures Markets and Insurance Alternatives Dillon M. Feuz Department of Applied Economics Utah State University 3530 Old Main Hill Logan, UT 84322-3530 435-797-2296 dillon.feuz@usu.edu
(14-3238) Page: 1/7 TRENDS IN DOMESTIC SUPPORT MARKET PRICE SUPPORT COMMUNICATION FROM THE UNITED STATES OF AMERICA
 Page: 1/7 TRENDS IN DOMESTIC SUPPORT MARKET PRICE SUPPORT COMMUNICATION FROM THE UNITED STATES OF AMERICA") 3 June 2014 (14-3238) Page: 1/7 Committee on Agriculture Original: English TRENDS IN DOMESTIC SUPPORT MARKET PRICE SUPPORT COMMUNICATION FROM THE UNITED STATES OF AMERICA 1 OVERVIEW 1.1. WTO Members have
3 June 2014 (14-3238) Page: 1/7 Committee on Agriculture Original: English TRENDS IN DOMESTIC SUPPORT MARKET PRICE SUPPORT COMMUNICATION FROM THE UNITED STATES OF AMERICA 1 OVERVIEW 1.1. WTO Members have
THE PREPARATION. SUPPLY/UTILIZATION ACCOUNTS (SUAs)
") THE PREPARATION OF SUPPLY/UTILIZATION ACCOUNTS (SUAs) I. INTRODUCTION The statistical framework of SUAs has been developed with the aim of providing a useful statistical tool for the preparation, conduct
THE PREPARATION OF SUPPLY/UTILIZATION ACCOUNTS (SUAs) I. INTRODUCTION The statistical framework of SUAs has been developed with the aim of providing a useful statistical tool for the preparation, conduct
The Journal of Science Policy & Governance
 The Journal of Science Policy & Governance POLICY MEMO: INCREASING SUSTAINABLE BIOMASS THROUGH PRODUCTION TAX CREDITS BY Ashley Paulsworth ashley0paulsworth@gmail.com Executive Summary As various tax credits
A Comparative Marketing Analysis of Major Agricultural Products in the United States and Argentina
 A Comparative Marketing Analysis of Major Agricultural Products in the United States and Argentina Argentina Report 2 Sergio H. Lence MATRIC Research Paper 00-MRP 2 June 2000 A Comparative Marketing Analysis
Wheat Transportation Profile
 Wheat Transportation Profile Agricultural Marketing Service / Transportation and Marketing Programs November 2014 Marina R. Denicoff Marvin E. Prater Pierre Bahizi Executive Summary America s farmers depend
A LEVEL ECONOMICS. ECON1/Unit 1 Markets and Market Failure Mark scheme. 2140 June 2014. Version 0.1 Final
 A LEVEL ECONOMICS ECON1/Unit 1 Markets and Market Failure Mark scheme 2140 June 2014 Version 0.1 Final Mark schemes are prepared by the Lead Assessment Writer and considered, together with the relevant
The Impact of Ethanol Production on Food, Feed and Fuel
 Issue Brief: The Impact of Ethanol Production on Food, Feed and Fuel Summer 2007 A Publication of Ethanol Across America For more than three decades, critics have tried to cast ethanol as a food versus
Ethanol Usage Projections & Corn Balance Sheet (mil. bu.)
") Ethanol Usage Projections & Corn Balance Sheet (mil. bu.) Updated 12/21/215 Historic Est. Prelim. Proj. 216-17 Year: (production/marketing) 1/ 211-12 212-13 213-14 214-15 215-16 Low Med. 4 High Yield (bu.
Ethanol Usage Projections & Corn Balance Sheet (mil. bu.) Updated 12/21/215 Historic Est. Prelim. Proj. 216-17 Year: (production/marketing) 1/ 211-12 212-13 213-14 214-15 215-16 Low Med. 4 High Yield (bu.
David Sparling Chair Agri-food Innovation dsparling@ivey.ca. Nicoleta Uzea Post-doctoral Fellow nuzea@ivey.ca
 David Sparling Chair Agri-food Innovation dsparling@ivey.ca Nicoleta Uzea Post-doctoral Fellow nuzea@ivey.ca The Issue Canadian agriculture is at a pivotal juncture. The global agriculture and food system
Ethanol Report April 2007 Written by Matthew Page, Co-Manager of the Alternative Energy Fund
 Ethanol Report April 2007 Written by Matthew Page, Co-Manager of the Alternative Energy Fund Ethanol: Fuel for thought. The sun, rich mid-america farmland, water and a little patience. These simple, wholesome
Implications of the Biofuels Boom for the Global Livestock Industry: A Computable General Equilibrium Analysis*
 Implications of the Biofuels Boom for the Global Livestock Industry: A Computable General Equilibrium Analysis* by Farzad Taheripour Thomas W. Hertel Wallace E. Tyner GTAP Working Paper No. 58 2010 * An
Literature Review of Estimated Market Effects of U.S. Corn Starch Ethanol
 Literature Review of Estimated Market Effects of U.S. Corn Starch Ethanol February 2016 FAPRI MU Report #01 16 Prepared by the Food and Agricultural Policy Research Institute, Division of Applied Social
EU Milk Margin Estimate up to 2014
 Ref. Ares(215)2882499-9/7/215 EU Agricultural and Farm Economics Briefs No 7 June 215 EU Milk Margin Estimate up to 214 An overview of estimates of of production and gross margins of milk production in
PETROLEUM WATCH September 16, 2011 Fossil Fuels Office Fuels and Transportation Division California Energy Commission
 PETROLEUM WATCH September 16, 2011 Fossil Fuels Office Fuels and Transportation Division California Energy Commission Summary As of September 14, retail regular-grade gasoline prices in California increased
Key global markets and suppliers impacting U.S. grain exports BRICs
 Key global markets and suppliers impacting U.S. grain exports BRICs Levin Flake Senior Agricultural Economist, Global Policy Analysis Division, OGA/FAS/USDA TEGMA Annual Meeting January 23 rd, 2015 U.S.
Biofuels and Commodity Markets Palm Oil Focus 1. P. Thoenes 2,3 FAO, Commodities and Trade Division
 Biofuels and Commodity Markets Focus 1 P. Thoenes 2,3 FAO, Commodities and Trade Division Abstract: In the last few years, demand for ethanol and biodiesel derived from grains, vegetable oils, sugar and
Introduction to Biofuel
 Introduction to Biofuel April 30, 2009 EEP 142 Presented By: Nan Shi Doris Chen Yu Hui (Becky) Li Songxu (Daniel) Wu The Green Energy Economy Is the Future To describe what s needed to wean the country
Impact of Fuel Price Increases on Texas Crops
 Impact of Fuel Price Increases on Texas Crops Chris R. Eggerman Research Assistant Department of Agricultural Economics Texas A&M University College Station, Texas 77843-2124 creggerman@ag.tamu.edu James
Does the US Biofuel Mandate Increase Poverty in India?
 Does the US Biofuel Mandate Increase Poverty in India? by Ujjayant Chakravorty, Marie-Hélène Hubert and Beyza Ural Marchand 1 Abstract In recent years, many countries have adopted aggressive policies that
How much financing will your farm business
 Twelve Steps to Ag Decision Maker Cash Flow Budgeting File C3-15 How much financing will your farm business require this year? When will money be needed and from where will it come? A little advance planning
Rudolph Diesel demonstrated the diesel engine at the 1900 Worlds Fair running on Peanut Oil! In WWII, the US Government closely looked at biodiesel
 Rudolph Diesel demonstrated the diesel engine at the 1900 Worlds Fair running on Peanut Oil! In WWII, the US Government closely looked at biodiesel as an alternative fuel in case our petroleum supply line
Risk Management Tools in Europe: Agricultural Insurance, Futures, and Options
 Risk Management Tools in Europe: Agricultural Insurance, Futures, and Options Robert Dismukes, John L. Bird, Jr., and Fred Linse 1 As Europe reviews recent changes in agricultural policies and markets
Demand for Ethanol in the Face of Blend Wall: Is it a Complement or a Substitute for Conventional Transportation Fuel in the United States?
 Demand for Ethanol in the Face of Blend Wall: Is it a Complement or a Substitute for Conventional Transportation Fuel in the United States? Zidong Wang Department of Agricultural Economics Texas A&M University
Analysis of Whether the Prices of Renewable Fuel Standard RINs Have Affected Retail Gasoline Prices
 Analysis of Whether the Prices of Renewable Fuel Standard RINs Have Affected Retail Gasoline Prices A Whitepaper Prepared for the Renewable Fuels Association Key Findings Changes in prices of renewable
The$Mortar$is$Nearly$Set$ $
 The$Mortar$is$Nearly$Set$ $ The$Consequences$of$Exceeding$ the$blendwall$in$2013$and$2014$ $ $ $ $ $ $ $ $ $ $ $ $ Ben$Montalbano$ $ $ $ $ $ $ $ $ $ $ $ July$22,$2013$ Introduction Ethanol, when blended
Crop Insurance: Background Statistics on Participation and Results
 September 2010 Crop Insurance: Background Statistics on Participation and Results FAPRI MU Report #10 10 Providing objective analysis for more than 25 years www.fapri.missouri.edu This report was prepared