Sun Li Centre for Academic Computing
|
|
|
- Noah McDonald
- 8 years ago
- Views:
Transcription
1 Sun Li Centre for Academic Computing

2 Elementary Data Analysis Group Comparison & One-way ANOVA Non-parametric Tests Correlations General Linear Regression Logistic Models Binary Logistic Model Ordinal Logistic Model Multinomial Logistic Model


3 The Explore procedure Exploratory data analysis Summary statistics Distribution plots Normality plots with tests Analyze Descriptive Statistics Explore The dependent variable must be a scale variable, while the grouping variables may be ordinal or nominal.


4 E.g.: demo.sav Explore the household income for married and unmarried people.

5


6 The Crosstabulation table Analysis of cross-classifications To examine the relationship btw two categorical variables Nominal-by-nominal relationships Ordinal-by-ordinal relationships Nominal-by-interval relationships Relative risk measurement Agreement measurement Analyze Descriptive Statistics Crosstabs


7 E.g.: Test and measure the relationship btw the job satisfactions and the number of year with current employer.

8

9 T Tests The one-sample T test The paired-samples T test (skip) The independent-samples T test Analyze Compare Means


10 E.g.: 1. Test if the average household income equals to 75k. 2. Test if the average household income for married and unmarried people has no significant difference.


11 One-way analysis of variance to test the hypothesis that the means of two or more groups are not significantly different. E.g.: Test if the average household income for the five education groups are different. If there is significant difference, identify which groups have the major difference.

12

13

14 Non-parametric tests Two-independent samples tests Tests for several independent samples Analyze Nonparametric Tests 2 Independent Samples K Independent Samples


15 Two-independent samples tests: Test if the household income varies btw married and unmarried people. Mann-Whitney and Wilcoxon tests--

16 The two-sample Kolmogorov-Smirnov test

17 K-independent samples tests: Test if the household income varies among people with different educations. Using the median test to detect the difference:

18 Using Kruskal-Wallis to Test Ordinal Outcomes

19 Correlation Analyze Correlation Bivariate correlation: Describe relationship btw two variables. Partial correlation: Describe relationship btw two variables while controlling for the effects of one or more additional variables. Distances: (skip) Similarities/dissimilarities btw pairs of variables/cases.

20 E.g.: Compute the correlation coefficient btw the household income and the price of primary vehicle.


21 E.g.: Compute the correlation coefficient btw the household income and the price of primary vehicle after controlling factor age, marriage status and education.
22 The GLM Univariate procedure Analyze General Linear Model Univariate Analyze Regression Linear In SPSS, there are two menus about linear regressions under pull-down menu Analyze. The difference btw the two menus is that Linear function under Regression treats every predictor to be continuous variables, while in General Linear Model, there are options to define categorical predictors and continuous predictors.
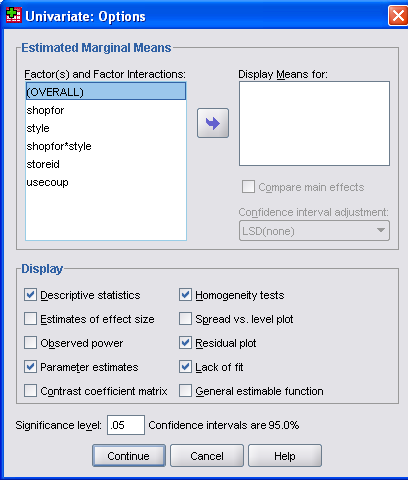
23 Factors: Categorical predictors should be selected as factors in the model. Fixed-effects factors are generally thought of as variables whose values of interest are all represented in the data file. Random-effects factors are variables whose values in the data file can be considered a random sample from a larger population of values. They are useful for explaining excess variability in the dependent variable. Covariates: Scale predictors should be selected as covariates in the model. E.g.: grocery_1month.sav Use the GLM Univariate procedure to fit a model with fixed and random effects to the amounts customers spent in grocery stores.
24 E.g.: A grocery store chain surveyed a set of customers concerning their purchasing habits. Given the survey results and how much each customer spent in the previous month, the store wants to see the factors. Variable storeid shop for style usecoup amtspent Variable information Store id Who shop for: 1 = self 2 = self and spouse 3 = self and family Shopping style: 1 = biweekly, in bulk 2 = weekly, similar items 3 = often, what s on sale Use coupons: 1 = no 2 = from newspaper 3 = from mailings 4 = from both Amount spent last month
25
26
27 Hays, W. L Statistics, 3rd ed. New York: Holt, Rinehart, and Winston. Brown, M. B., and A. B. Forsythe. 1974b. Robust tests for the equality of variances. Journal of the American Statistical Association, 69:, Milliken, G., and D. Johnson Analysis of Messy Data: Volume 1. Designed Experiments. New York: Chapman & Hall. Neter, J., W. Wasserman, and M. H. Kutner Applied Linear Statistical Models, 3rd ed. Homewood, Ill.: Irwin. Siegel, S., and N. J. Castellan Nonparametric statistics for the behavioral sciences. New York: McGraw-Hill, Inc.. Conover, W. J Practical Nonparametric Statistics, 2nd ed. New York: John Wiley and Sons. Horton, R. L The General Linear Model. New York: McGraw-Hill, Inc..
28 Logistic Models Binary logistic model: dichotomous response outcomes e.g.: presence or absence of an event π i = E( yi xi ) logit( π ) = log( π /(1 π )) = g( π ) = α + β X Ordinal logistic model: ordinal response variable with more than two ordered categories e.g.: a 5-point Likert scale g(pr( Y i X )) = αi + β ' X, i = 1,..., k Multinomial logistic model: nominal response variables with more than two categories e.g.: different types of programs in school Pr( Y = i X ) log = αi + β ' i X, i = 1,..., k Pr( Y = k + 1 X )
29 Using binary logistic regression to assess credit risk E.g.: bankloan.sav Analyze Regression Binary Logistic If you are a loan officer at a bank, then you want to be able to identify characteristics that are indicative of people who are likely to default on loans, and use those characteristics to identify good and bad credit risks. We have information on 850 past and prospective customers. The first 700 cases are customers who were previously given loans. Use these 700 customers to create a logistic regression model. Then use the model to classify the 150 prospective customers as good or bad credit risks.
30 Variable name age ed employ address income Variable information Age in years Level of education 1= didn t complete high school 2= high school degree 3= college degree 4= undergraduate 5= postgraduate Years with current employer Years in current address Household income in thousands debtinc Debt to income ratio (*100) creddebt othdebt default Credit card debt in thousands Other debts in thousands Previously defaulted 1= Yes 0 = No

31 Step 1: select the first 700 obs for logistic model Data Select Cases

32 Step 2: construct logistic model
33


34 Step 3: identify possible outlying obs Scatter plot: predicted probability vs Cook s D statistics

35 Step 4: draw ROC curve and find the optimal cut-off point Analyze ROC Curve

36 Step 5: predict credit risk Select the rest 150 obs and compute predicted probability with model coefficients
37 Using Multinomial Logistic Regression to Classify Telecommunications Customers E.g.: telco.sav A telecommunications provider has segmented its customer base by service usage patterns, categorizing the customers into four groups. If demographic data can be used to predict group membership, you can customize offers for individual prospective customers. Analyze Regression Multinomial Logistic

38
39
40 Using Ordinal Regression to Build a Credit Scoring Model g(pr( Y i X )) = αi + β ' X, i = 1,..., k E.g.: german_credit.sav A creditor wants to be able to determine whether an applicant is a good credit risk, given various financial and personal characteristics. From their customer database, the creditor (dependent) variable is account status, with five ordinal levels: no debt history, no current debt, debt payments current, debt payments past due, and critical account. Potential predictors consist of various financial and personal characteristics of applicants, including age, number of credits at the bank, housing type, checking account status, and so on.

41 Analyze Regression Ordinal
42
43 Hays, W. L Statistics, 3rd ed. New York: Holt, Rinehart, and Winston. McCullagh, P., and J. A. Nelder Generalized Linear Models, 2nd ed. London: Chapman & Hall. Cox, D. R., and E. J. Snell The Analysis of Binary Data, 2nd ed. London: Chapman and Hall. Hosmer, D. W., and S. Lemeshow Applied Logistic Regression, 2nd ed. New York: John Wiley and Sons. Kleinbaum, D. G Logistic Regression: A Self-Learning Text. New York: Springer-Verlag. Norusis, M SPSS 13.0 Advanced Statistical Procedures Companion. Upper Saddle-River, N.J.: Prentice Hall, Inc..
44 Advanced Models 30 May Friday 10am-12pm Training Library Level 5 Curve Estimation Non-linear Regression Survival Analysis Linear Mixed Model Time-series Data Analysis
SPSS TRAINING SESSION 3 ADVANCED TOPICS (PASW STATISTICS 17.0) Sun Li Centre for Academic Computing lsun@smu.edu.sg
 Sun Li Centre for Academic Computing lsun@smu.edu.sg") SPSS TRAINING SESSION 3 ADVANCED TOPICS (PASW STATISTICS 17.0) Sun Li Centre for Academic Computing lsun@smu.edu.sg IN SPSS SESSION 2, WE HAVE LEARNT: Elementary Data Analysis Group Comparison & One-way
SPSS TRAINING SESSION 3 ADVANCED TOPICS (PASW STATISTICS 17.0) Sun Li Centre for Academic Computing lsun@smu.edu.sg IN SPSS SESSION 2, WE HAVE LEARNT: Elementary Data Analysis Group Comparison & One-way
STATISTICA Formula Guide: Logistic Regression. Table of Contents
 : Table of Contents... 1 Overview of Model... 1 Dispersion... 2 Parameterization... 3 Sigma-Restricted Model... 3 Overparameterized Model... 4 Reference Coding... 4 Model Summary (Summary Tab)... 5 Summary
SPSS Tests for Versions 9 to 13
 SPSS Tests for Versions 9 to 13 Chapter 2 Descriptive Statistic (including median) Choose Analyze Descriptive statistics Frequencies... Click on variable(s) then press to move to into Variable(s): list
Overview Classes. 12-3 Logistic regression (5) 19-3 Building and applying logistic regression (6) 26-3 Generalizations of logistic regression (7)
 19-3 Building and applying logistic regression (6) 26-3 Generalizations of logistic regression (7)") Overview Classes 12-3 Logistic regression (5) 19-3 Building and applying logistic regression (6) 26-3 Generalizations of logistic regression (7) 2-4 Loglinear models (8) 5-4 15-17 hrs; 5B02 Building and
Overview Classes 12-3 Logistic regression (5) 19-3 Building and applying logistic regression (6) 26-3 Generalizations of logistic regression (7) 2-4 Loglinear models (8) 5-4 15-17 hrs; 5B02 Building and
Credit Risk Analysis Using Logistic Regression Modeling
 Credit Risk Analysis Using Logistic Regression Modeling Introduction A loan officer at a bank wants to be able to identify characteristics that are indicative of people who are likely to default on loans,
Example: Credit card default, we may be more interested in predicting the probabilty of a default than classifying individuals as default or not.
 Statistical Learning: Chapter 4 Classification 4.1 Introduction Supervised learning with a categorical (Qualitative) response Notation: - Feature vector X, - qualitative response Y, taking values in C
The Statistics Tutor s Quick Guide to
 statstutor community project encouraging academics to share statistics support resources All stcp resources are released under a Creative Commons licence The Statistics Tutor s Quick Guide to Stcp-marshallowen-7
240ST014 - Data Analysis of Transport and Logistics
 Coordinating unit: Teaching unit: Academic year: Degree: ECTS credits: 2015 240 - ETSEIB - Barcelona School of Industrial Engineering 715 - EIO - Department of Statistics and Operations Research MASTER'S
Additional sources Compilation of sources: http://lrs.ed.uiuc.edu/tseportal/datacollectionmethodologies/jin-tselink/tselink.htm
 Mgt 540 Research Methods Data Analysis 1 Additional sources Compilation of sources: http://lrs.ed.uiuc.edu/tseportal/datacollectionmethodologies/jin-tselink/tselink.htm http://web.utk.edu/~dap/random/order/start.htm
Instructions for SPSS 21
 1 Instructions for SPSS 21 1 Introduction... 2 1.1 Opening the SPSS program... 2 1.2 General... 2 2 Data inputting and processing... 2 2.1 Manual input and data processing... 2 2.2 Saving data... 3 2.3
Multinomial Logistic Regression
 Multinomial Logistic Regression Dr. Jon Starkweather and Dr. Amanda Kay Moske Multinomial logistic regression is used to predict categorical placement in or the probability of category membership on a
Students' Opinion about Universities: The Faculty of Economics and Political Science (Case Study)
") Cairo University Faculty of Economics and Political Science Statistics Department English Section Students' Opinion about Universities: The Faculty of Economics and Political Science (Case Study) Prepared
Cairo University Faculty of Economics and Political Science Statistics Department English Section Students' Opinion about Universities: The Faculty of Economics and Political Science (Case Study) Prepared
IBM SPSS Missing Values 22
 IBM SPSS Missing Values 22 Note Before using this information and the product it supports, read the information in Notices on page 23. Product Information This edition applies to version 22, release 0,
SOCIOLOGY 7702 FALL, 2014 INTRODUCTION TO STATISTICS AND DATA ANALYSIS
 SOCIOLOGY 7702 FALL, 2014 INTRODUCTION TO STATISTICS AND DATA ANALYSIS Professor Michael A. Malec Mailbox is in McGuinn 426 Office: McGuinn 427 Phone: 617-552-4131 Office Hours: TBA E-mail: malec@bc.edu
IBM SPSS Statistics 20 Part 4: Chi-Square and ANOVA
 CALIFORNIA STATE UNIVERSITY, LOS ANGELES INFORMATION TECHNOLOGY SERVICES IBM SPSS Statistics 20 Part 4: Chi-Square and ANOVA Summer 2013, Version 2.0 Table of Contents Introduction...2 Downloading the
Generalized Linear Models
 Generalized Linear Models We have previously worked with regression models where the response variable is quantitative and normally distributed. Now we turn our attention to two types of models where the
IBM SPSS Direct Marketing 19
 IBM SPSS Direct Marketing 19 Note: Before using this information and the product it supports, read the general information under Notices on p. 105. This document contains proprietary information of SPSS
SPSS ADVANCED ANALYSIS WENDIANN SETHI SPRING 2011
 SPSS ADVANCED ANALYSIS WENDIANN SETHI SPRING 2011 Statistical techniques to be covered Explore relationships among variables Correlation Regression/Multiple regression Logistic regression Factor analysis
Course Agenda. First Day. 4 th February - Monday 14.30-19.00. 14:30-15.30 Students Registration Polo Didattico Laterino
 Course Agenda First Day 4 th February - Monday 14.30-19.00 14:30-15.30 Students Registration Main Entrance Registration Desk 15.30-17.00 Opening Works Teacher presentation Brief Students presentation Course
Data analysis process
 Data analysis process Data collection and preparation Collect data Prepare codebook Set up structure of data Enter data Screen data for errors Exploration of data Descriptive Statistics Graphs Analysis
Classification of Bad Accounts in Credit Card Industry
 Classification of Bad Accounts in Credit Card Industry Chengwei Yuan December 12, 2014 Introduction Risk management is critical for a credit card company to survive in such competing industry. In addition
SAS Software to Fit the Generalized Linear Model
 SAS Software to Fit the Generalized Linear Model Gordon Johnston, SAS Institute Inc., Cary, NC Abstract In recent years, the class of generalized linear models has gained popularity as a statistical modeling
IBM SPSS Direct Marketing 22
 IBM SPSS Direct Marketing 22 Note Before using this information and the product it supports, read the information in Notices on page 25. Product Information This edition applies to version 22, release
SPSS Explore procedure
 SPSS Explore procedure One useful function in SPSS is the Explore procedure, which will produce histograms, boxplots, stem-and-leaf plots and extensive descriptive statistics. To run the Explore procedure,
PASW Direct Marketing 18
 i PASW Direct Marketing 18 For more information about SPSS Inc. software products, please visit our Web site at http://www.spss.com or contact SPSS Inc. 233 South Wacker Drive, 11th Floor Chicago, IL 60606-6412
MEASURES OF LOCATION AND SPREAD
 Paper TU04 An Overview of Non-parametric Tests in SAS : When, Why, and How Paul A. Pappas and Venita DePuy Durham, North Carolina, USA ABSTRACT Most commonly used statistical procedures are based on the
SPSS TUTORIAL & EXERCISE BOOK
 UNIVERSITY OF MISKOLC Faculty of Economics Institute of Business Information and Methods Department of Business Statistics and Economic Forecasting PETRA PETROVICS SPSS TUTORIAL & EXERCISE BOOK FOR BUSINESS
WebFOCUS RStat. RStat. Predict the Future and Make Effective Decisions Today. WebFOCUS RStat
 Information Builders enables agile information solutions with business intelligence (BI) and integration technologies. WebFOCUS the most widely utilized business intelligence platform connects to any enterprise
Linda K. Muthén Bengt Muthén. Copyright 2008 Muthén & Muthén www.statmodel.com. Table Of Contents
 Mplus Short Courses Topic 2 Regression Analysis, Eploratory Factor Analysis, Confirmatory Factor Analysis, And Structural Equation Modeling For Categorical, Censored, And Count Outcomes Linda K. Muthén
COURSE PLAN BDA: Biomedical Data Analysis Master in Bioinformatics for Health Sciences. 2015-2016 Academic Year Qualification.
 COURSE PLAN BDA: Biomedical Data Analysis Master in Bioinformatics for Health Sciences 2015-2016 Academic Year Qualification. Master's Degree 1. Description of the subject Subject name: Biomedical Data
IBM SPSS Direct Marketing 23
 IBM SPSS Direct Marketing 23 Note Before using this information and the product it supports, read the information in Notices on page 25. Product Information This edition applies to version 23, release
Ordinal Regression. Chapter
 Ordinal Regression Chapter 4 Many variables of interest are ordinal. That is, you can rank the values, but the real distance between categories is unknown. Diseases are graded on scales from least severe
Advanced Quantitative Methods for Health Care Professionals PUBH 742 Spring 2015
 1 Advanced Quantitative Methods for Health Care Professionals PUBH 742 Spring 2015 Instructor: Joanne M. Garrett, PhD e-mail: joanne_garrett@med.unc.edu Class Notes: Copies of the class lecture slides
Multiple logistic regression analysis of cigarette use among high school students
 Multiple logistic regression analysis of cigarette use among high school students ABSTRACT Joseph Adwere-Boamah Alliant International University A binary logistic regression analysis was performed to predict
When to Use a Particular Statistical Test
 When to Use a Particular Statistical Test Central Tendency Univariate Descriptive Mode the most commonly occurring value 6 people with ages 21, 22, 21, 23, 19, 21 - mode = 21 Median the center value the
Statistics in Retail Finance. Chapter 6: Behavioural models
 Statistics in Retail Finance 1 Overview > So far we have focussed mainly on application scorecards. In this chapter we shall look at behavioural models. We shall cover the following topics:- Behavioural
Chapter 5 Analysis of variance SPSS Analysis of variance
 Chapter 5 Analysis of variance SPSS Analysis of variance Data file used: gss.sav How to get there: Analyze Compare Means One-way ANOVA To test the null hypothesis that several population means are equal,
The Dummy s Guide to Data Analysis Using SPSS
 The Dummy s Guide to Data Analysis Using SPSS Mathematics 57 Scripps College Amy Gamble April, 2001 Amy Gamble 4/30/01 All Rights Rerserved TABLE OF CONTENTS PAGE Helpful Hints for All Tests...1 Tests
List of Tables. Page Table Name Number. Number 2.1 Goleman's Emotional Intelligence Components 13 2.2 Components of TLQ 34 2.3
 xi List of s 2.1 Goleman's Emotional Intelligence Components 13 2.2 Components of TLQ 34 2.3 Components of Styles / Self Awareness Reviewed 51 2.4 Relationships to be studied between Self Awareness / Styles
IBM SPSS Direct Marketing 20
 IBM SPSS Direct Marketing 20 Note: Before using this information and the product it supports, read the general information under Notices on p. 105. This edition applies to IBM SPSS Statistics 20 and to
Introduction to Regression and Data Analysis
 Statlab Workshop Introduction to Regression and Data Analysis with Dan Campbell and Sherlock Campbell October 28, 2008 I. The basics A. Types of variables Your variables may take several forms, and it
Overview of Non-Parametric Statistics PRESENTER: ELAINE EISENBEISZ OWNER AND PRINCIPAL, OMEGA STATISTICS
 Overview of Non-Parametric Statistics PRESENTER: ELAINE EISENBEISZ OWNER AND PRINCIPAL, OMEGA STATISTICS About Omega Statistics Private practice consultancy based in Southern California, Medical and Clinical
Statistical Analysis Using SPSS for Windows Getting Started (Ver. 2014/11/6) The numbers of figures in the SPSS_screenshot.pptx are shown in red.
 The numbers of figures in the SPSS_screenshot.pptx are shown in red.") Statistical Analysis Using SPSS for Windows Getting Started (Ver. 2014/11/6) The numbers of figures in the SPSS_screenshot.pptx are shown in red. 1. How to display English messages from IBM SPSS Statistics
Statistical Analysis Using SPSS for Windows Getting Started (Ver. 2014/11/6) The numbers of figures in the SPSS_screenshot.pptx are shown in red. 1. How to display English messages from IBM SPSS Statistics
Assumptions. Assumptions of linear models. Boxplot. Data exploration. Apply to response variable. Apply to error terms from linear model
 Assumptions Assumptions of linear models Apply to response variable within each group if predictor categorical Apply to error terms from linear model check by analysing residuals Normality Homogeneity
Essentials of Marketing Research
 Essentials of Marketing Second Edition Joseph F. Hair, Jr. Kennesaw State University Mary F. Wolfinbarger California State University-Long Beach David J. Ortinau University of South Florida Robert P. Bush
UNIVERSITY OF NAIROBI
 UNIVERSITY OF NAIROBI MASTERS IN PROJECT PLANNING AND MANAGEMENT NAME: SARU CAROLYNN ELIZABETH REGISTRATION NO: L50/61646/2013 COURSE CODE: LDP 603 COURSE TITLE: RESEARCH METHODS LECTURER: GAKUU CHRISTOPHER
Introduction to Quantitative Methods
 Introduction to Quantitative Methods October 15, 2009 Contents 1 Definition of Key Terms 2 2 Descriptive Statistics 3 2.1 Frequency Tables......................... 4 2.2 Measures of Central Tendencies.................
business statistics using Excel OXFORD UNIVERSITY PRESS Glyn Davis & Branko Pecar
 business statistics using Excel Glyn Davis & Branko Pecar OXFORD UNIVERSITY PRESS Detailed contents Introduction to Microsoft Excel 2003 Overview Learning Objectives 1.1 Introduction to Microsoft Excel
Binary Logistic Regression
 Binary Logistic Regression Main Effects Model Logistic regression will accept quantitative, binary or categorical predictors and will code the latter two in various ways. Here s a simple model including
How to Get More Value from Your Survey Data
 Technical report How to Get More Value from Your Survey Data Discover four advanced analysis techniques that make survey research more effective Table of contents Introduction..............................................................2
PROBABILITY AND STATISTICS. Ma 527. 1. To teach a knowledge of combinatorial reasoning.
 PROBABILITY AND STATISTICS Ma 527 Course Description Prefaced by a study of the foundations of probability and statistics, this course is an extension of the elements of probability and statistics introduced
Probability of Selecting Response Mode Between Paper- and Web-Based Options: Logistic Model Based on Institutional Demographics
 Probability of Selecting Response Mode Between Paper- and Web-Based Options: Logistic Model Based on Institutional Demographics Marina Murray Graduate Management Admission Council, 11921 Freedom Drive,
SPSS Introduction. Yi Li
 SPSS Introduction Yi Li Note: The report is based on the websites below http://glimo.vub.ac.be/downloads/eng_spss_basic.pdf http://academic.udayton.edu/gregelvers/psy216/spss http://www.nursing.ucdenver.edu/pdf/factoranalysishowto.pdf
HYPOTHESIS TESTING: CONFIDENCE INTERVALS, T-TESTS, ANOVAS, AND REGRESSION
 HYPOTHESIS TESTING: CONFIDENCE INTERVALS, T-TESTS, ANOVAS, AND REGRESSION HOD 2990 10 November 2010 Lecture Background This is a lightning speed summary of introductory statistical methods for senior undergraduate
Section Format Day Begin End Building Rm# Instructor. 001 Lecture Tue 6:45 PM 8:40 PM Silver 401 Ballerini
 NEW YORK UNIVERSITY ROBERT F. WAGNER GRADUATE SCHOOL OF PUBLIC SERVICE Course Syllabus Spring 2016 Statistical Methods for Public, Nonprofit, and Health Management Section Format Day Begin End Building
GLM I An Introduction to Generalized Linear Models
 GLM I An Introduction to Generalized Linear Models CAS Ratemaking and Product Management Seminar March 2009 Presented by: Tanya D. Havlicek, Actuarial Assistant 0 ANTITRUST Notice The Casualty Actuarial
Developing Risk Adjustment Techniques Using the SAS@ System for Assessing Health Care Quality in the lmsystem@
 Developing Risk Adjustment Techniques Using the SAS@ System for Assessing Health Care Quality in the lmsystem@ Yanchun Xu, Andrius Kubilius Joint Commission on Accreditation of Healthcare Organizations,
Nominal and ordinal logistic regression
 Nominal and ordinal logistic regression April 26 Nominal and ordinal logistic regression Our goal for today is to briefly go over ways to extend the logistic regression model to the case where the outcome
Cool Tools for PROC LOGISTIC
 Cool Tools for PROC LOGISTIC Paul D. Allison Statistical Horizons LLC and the University of Pennsylvania March 2013 www.statisticalhorizons.com 1 New Features in LOGISTIC ODDSRATIO statement EFFECTPLOT
Institute of Actuaries of India Subject CT3 Probability and Mathematical Statistics
 Institute of Actuaries of India Subject CT3 Probability and Mathematical Statistics For 2015 Examinations Aim The aim of the Probability and Mathematical Statistics subject is to provide a grounding in
Multivariate Logistic Regression
 1 Multivariate Logistic Regression As in univariate logistic regression, let π(x) represent the probability of an event that depends on p covariates or independent variables. Then, using an inv.logit formulation
Multivariate Statistical Inference and Applications
 Multivariate Statistical Inference and Applications ALVIN C. RENCHER Department of Statistics Brigham Young University A Wiley-Interscience Publication JOHN WILEY & SONS, INC. New York Chichester Weinheim
Correlational Research. Correlational Research. Stephen E. Brock, Ph.D., NCSP EDS 250. Descriptive Research 1. Correlational Research: Scatter Plots
 Correlational Research Stephen E. Brock, Ph.D., NCSP California State University, Sacramento 1 Correlational Research A quantitative methodology used to determine whether, and to what degree, a relationship
Logistic regression modeling the probability of success
 Logistic regression modeling the probability of success Regression models are usually thought of as only being appropriate for target variables that are continuous Is there any situation where we might
Credit Risk Models. August 24 26, 2010
 Credit Risk Models August 24 26, 2010 AGENDA 1 st Case Study : Credit Rating Model Borrowers and Factoring (Accounts Receivable Financing) pages 3 10 2 nd Case Study : Credit Scoring Model Automobile Leasing
Name of the module: Multivariate biostatistics and SPSS Number of module: 471-8-4081
 Name of the module: Multivariate biostatistics and SPSS Number of module: 471-8-4081 BGU Credits: 1.5 ECTS credits: Academic year: 4 th Semester: 15 days during fall semester Hours of instruction: 8:00-17:00
LOGISTIC REGRESSION ANALYSIS
 LOGISTIC REGRESSION ANALYSIS C. Mitchell Dayton Department of Measurement, Statistics & Evaluation Room 1230D Benjamin Building University of Maryland September 1992 1. Introduction and Model Logistic
Data Analysis, Research Study Design and the IRB
 Minding the p-values p and Quartiles: Data Analysis, Research Study Design and the IRB Don Allensworth-Davies, MSc Research Manager, Data Coordinating Center Boston University School of Public Health IRB
An introduction to IBM SPSS Statistics
 An introduction to IBM SPSS Statistics Contents 1 Introduction... 1 2 Entering your data... 2 3 Preparing your data for analysis... 10 4 Exploring your data: univariate analysis... 14 5 Generating descriptive
Reporting Statistics in Psychology
 This document contains general guidelines for the reporting of statistics in psychology research. The details of statistical reporting vary slightly among different areas of science and also among different
MASTER COURSE SYLLABUS-PROTOTYPE PSYCHOLOGY 2317 STATISTICAL METHODS FOR THE BEHAVIORAL SCIENCES
 MASTER COURSE SYLLABUS-PROTOTYPE THE PSYCHOLOGY DEPARTMENT VALUES ACADEMIC FREEDOM AND THUS OFFERS THIS MASTER SYLLABUS-PROTOTYPE ONLY AS A GUIDE. THE INSTRUCTORS ARE FREE TO ADAPT THEIR COURSE SYLLABI
Principle Component Analysis and Partial Least Squares: Two Dimension Reduction Techniques for Regression
 Principle Component Analysis and Partial Least Squares: Two Dimension Reduction Techniques for Regression Saikat Maitra and Jun Yan Abstract: Dimension reduction is one of the major tasks for multivariate
Mitchell H. Holt Dec 2008 Senior Thesis
 Mitchell H. Holt Dec 2008 Senior Thesis Default Loans All lending institutions experience losses from default loans They must take steps to minimize their losses Only lend to low risk individuals Low Risk
Introduction to Statistics and Quantitative Research Methods
 Introduction to Statistics and Quantitative Research Methods Purpose of Presentation To aid in the understanding of basic statistics, including terminology, common terms, and common statistical methods.
IBM SPSS Bootstrapping 22
 IBM SPSS Bootstrapping 22 Note Before using this information and the product it supports, read the information in Notices on page 7. Product Information This edition applies to version 22, release 0, modification
SPSS: AN OVERVIEW. Seema Jaggi and and P.K.Batra I.A.S.R.I., Library Avenue, New Delhi-110 012
 SPSS: AN OVERVIEW Seema Jaggi and and P.K.Batra I.A.S.R.I., Library Avenue, New Delhi-110 012 The abbreviation SPSS stands for Statistical Package for the Social Sciences and is a comprehensive system
UNDERSTANDING THE INDEPENDENT-SAMPLES t TEST
 UNDERSTANDING The independent-samples t test evaluates the difference between the means of two independent or unrelated groups. That is, we evaluate whether the means for two independent groups are significantly
Non-parametric Tests Using SPSS
 Non-parametric Tests Using SPSS Statistical Package for Social Sciences Jinlin Fu January 2016 Contact Medical Research Consultancy Studio Australia http://www.mrcsau.com.au Contents 1 INTRODUCTION...
Business Statistics. Successful completion of Introductory and/or Intermediate Algebra courses is recommended before taking Business Statistics.
 Business Course Text Bowerman, Bruce L., Richard T. O'Connell, J. B. Orris, and Dawn C. Porter. Essentials of Business, 2nd edition, McGraw-Hill/Irwin, 2008, ISBN: 978-0-07-331988-9. Required Computing
Biostatistics: Types of Data Analysis
 Biostatistics: Types of Data Analysis Theresa A Scott, MS Vanderbilt University Department of Biostatistics theresa.scott@vanderbilt.edu http://biostat.mc.vanderbilt.edu/theresascott Theresa A Scott, MS
SAS/STAT. 9.2 User s Guide. Introduction to. Nonparametric Analysis. (Book Excerpt) SAS Documentation
 SAS Documentation") SAS/STAT Introduction to 9.2 User s Guide Nonparametric Analysis (Book Excerpt) SAS Documentation This document is an individual chapter from SAS/STAT 9.2 User s Guide. The correct bibliographic citation
SAS/STAT Introduction to 9.2 User s Guide Nonparametric Analysis (Book Excerpt) SAS Documentation This document is an individual chapter from SAS/STAT 9.2 User s Guide. The correct bibliographic citation
USING LOGIT MODEL TO PREDICT CREDIT SCORE
 USING LOGIT MODEL TO PREDICT CREDIT SCORE Taiwo Amoo, Associate Professor of Business Statistics and Operation Management, Brooklyn College, City University of New York, (718) 951-5219, Tamoo@brooklyn.cuny.edu
Adequacy of Biomath. Models. Empirical Modeling Tools. Bayesian Modeling. Model Uncertainty / Selection
 Directions in Statistical Methodology for Multivariable Predictive Modeling Frank E Harrell Jr University of Virginia Seattle WA 19May98 Overview of Modeling Process Model selection Regression shape Diagnostics
Statistical Models in R
 Statistical Models in R Some Examples Steven Buechler Department of Mathematics 276B Hurley Hall; 1-6233 Fall, 2007 Outline Statistical Models Structure of models in R Model Assessment (Part IA) Anova
Modeling Customer Lifetime Value Using Survival Analysis An Application in the Telecommunications Industry
 Paper 12028 Modeling Customer Lifetime Value Using Survival Analysis An Application in the Telecommunications Industry Junxiang Lu, Ph.D. Overland Park, Kansas ABSTRACT Increasingly, companies are viewing
SPSS-Applications (Data Analysis)
") CORTEX fellows training course, University of Zurich, October 2006 Slide 1 SPSS-Applications (Data Analysis) Dr. Jürg Schwarz, juerg.schwarz@schwarzpartners.ch Program 19. October 2006: Morning Lessons
CORTEX fellows training course, University of Zurich, October 2006 Slide 1 SPSS-Applications (Data Analysis) Dr. Jürg Schwarz, juerg.schwarz@schwarzpartners.ch Program 19. October 2006: Morning Lessons
Bowerman, O'Connell, Aitken Schermer, & Adcock, Business Statistics in Practice, Canadian edition
 Bowerman, O'Connell, Aitken Schermer, & Adcock, Business Statistics in Practice, Canadian edition Online Learning Centre Technology Step-by-Step - Excel Microsoft Excel is a spreadsheet software application
CREDIT RISK ASSESSMENT FOR MORTGAGE LENDING
 IMPACT: International Journal of Research in Business Management (IMPACT: IJRBM) ISSN(E): 2321-886X; ISSN(P): 2347-4572 Vol. 3, Issue 4, Apr 2015, 13-18 Impact Journals CREDIT RISK ASSESSMENT FOR MORTGAGE
January 26, 2009 The Faculty Center for Teaching and Learning
 THE BASICS OF DATA MANAGEMENT AND ANALYSIS A USER GUIDE January 26, 2009 The Faculty Center for Teaching and Learning THE BASICS OF DATA MANAGEMENT AND ANALYSIS Table of Contents Table of Contents... i
Missing data and net survival analysis Bernard Rachet
 Workshop on Flexible Models for Longitudinal and Survival Data with Applications in Biostatistics Warwick, 27-29 July 2015 Missing data and net survival analysis Bernard Rachet General context Population-based,
Using DOE in Service Quality
 Using DOE in Service Quality Dr. Scott Kowalski Minitab Inc. October 2013 Outline Minitab Six Sigma & DMAIC Industries Design of Experiments Examples Summary Minitab the Company World Headquarters, State
Organizing Your Approach to a Data Analysis
 Biost/Stat 578 B: Data Analysis Emerson, September 29, 2003 Handout #1 Organizing Your Approach to a Data Analysis The general theme should be to maximize thinking about the data analysis and to minimize
Simple Predictive Analytics Curtis Seare
 Using Excel to Solve Business Problems: Simple Predictive Analytics Curtis Seare Copyright: Vault Analytics July 2010 Contents Section I: Background Information Why use Predictive Analytics? How to use
Silvermine House Steenberg Office Park, Tokai 7945 Cape Town, South Africa Telephone: +27 21 702 4666 www.spss-sa.com
 SPSS-SA Silvermine House Steenberg Office Park, Tokai 7945 Cape Town, South Africa Telephone: +27 21 702 4666 www.spss-sa.com SPSS-SA Training Brochure 2009 TABLE OF CONTENTS 1 SPSS TRAINING COURSES FOCUSING
Data Mining: An Overview of Methods and Technologies for Increasing Profits in Direct Marketing. C. Olivia Rud, VP, Fleet Bank
 Data Mining: An Overview of Methods and Technologies for Increasing Profits in Direct Marketing C. Olivia Rud, VP, Fleet Bank ABSTRACT Data Mining is a new term for the common practice of searching through
ANALYSING LIKERT SCALE/TYPE DATA, ORDINAL LOGISTIC REGRESSION EXAMPLE IN R.
 ANALYSING LIKERT SCALE/TYPE DATA, ORDINAL LOGISTIC REGRESSION EXAMPLE IN R. 1. Motivation. Likert items are used to measure respondents attitudes to a particular question or statement. One must recall
11. Analysis of Case-control Studies Logistic Regression
 Research methods II 113 11. Analysis of Case-control Studies Logistic Regression This chapter builds upon and further develops the concepts and strategies described in Ch.6 of Mother and Child Health:
MORTGAGE LENDER PROTECTION UNDER INSURANCE ARRANGEMENTS Irina Genriha Latvian University, Tel. +371 26387099, e-mail: irina.genriha@inbox.
 MORTGAGE LENDER PROTECTION UNDER INSURANCE ARRANGEMENTS Irina Genriha Latvian University, Tel. +371 2638799, e-mail: irina.genriha@inbox.lv Since September 28, when the crisis deepened in the first place
Part 2: Analysis of Relationship Between Two Variables
 Part 2: Analysis of Relationship Between Two Variables Linear Regression Linear correlation Significance Tests Multiple regression Linear Regression Y = a X + b Dependent Variable Independent Variable
SPSS Modules Features Statistics Premium
 SPSS Modules Features Statistics Premium Core System Functionality (included in every license) Data access and management Data Prep features: Define Variable properties tool; copy data properties tool,