Oracle Corporation Proprietary and Confidential
|
|
|
- Malcolm Norris
- 8 years ago
- Views:
Transcription
1

2 The following is intended to outline our general product direction. It is intended for information purposes only, and may not be incorporated into any contract. It is not a commitment to deliver any material, code, or functionality, and should not be relied upon in making purchasing decisions. The development, release, and timing of any features or functionality described for Oracle s products remain at the sole discretion of Oracle Oracle Corporation Proprietary and Confidential

3 Extreme (WLS/Java) Performance Workshop JVM Performance Tuning Zhao Yi Consulting Solution Architect OFM A Team

4 Agenda JVM Fundamentals JVM Performance Tuning GC Fundamentals Hotspot Internals Hotspot Tuning Diagnosing GC Issues 4

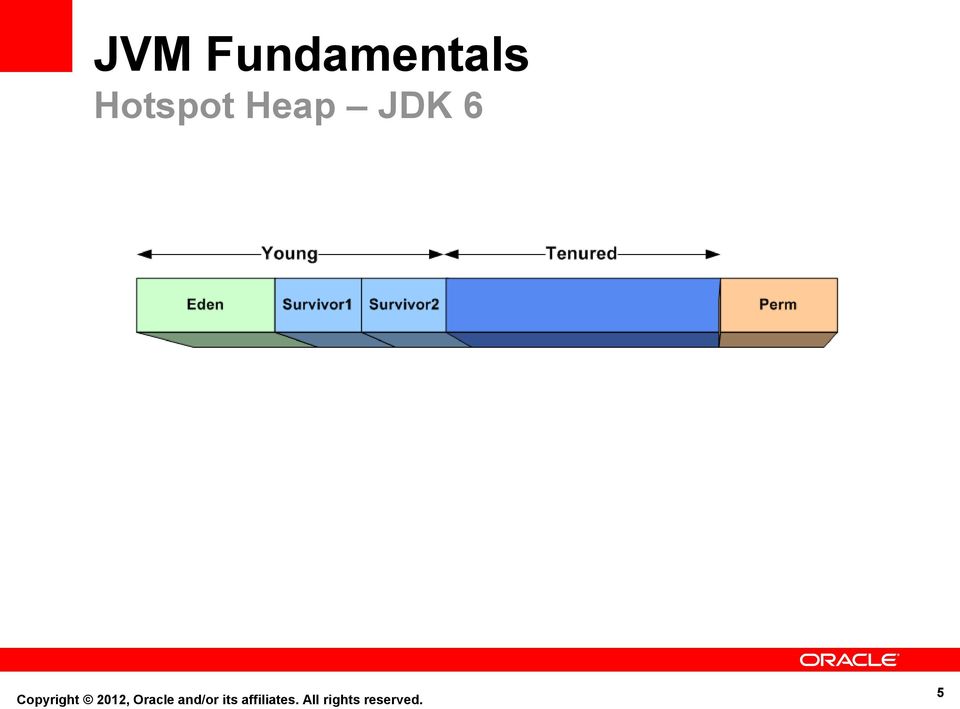
5 JVM Fundamentals Hotspot Heap JDK 6 5

6 JVM Fundamentals Hotspot Heap JDK 7 6

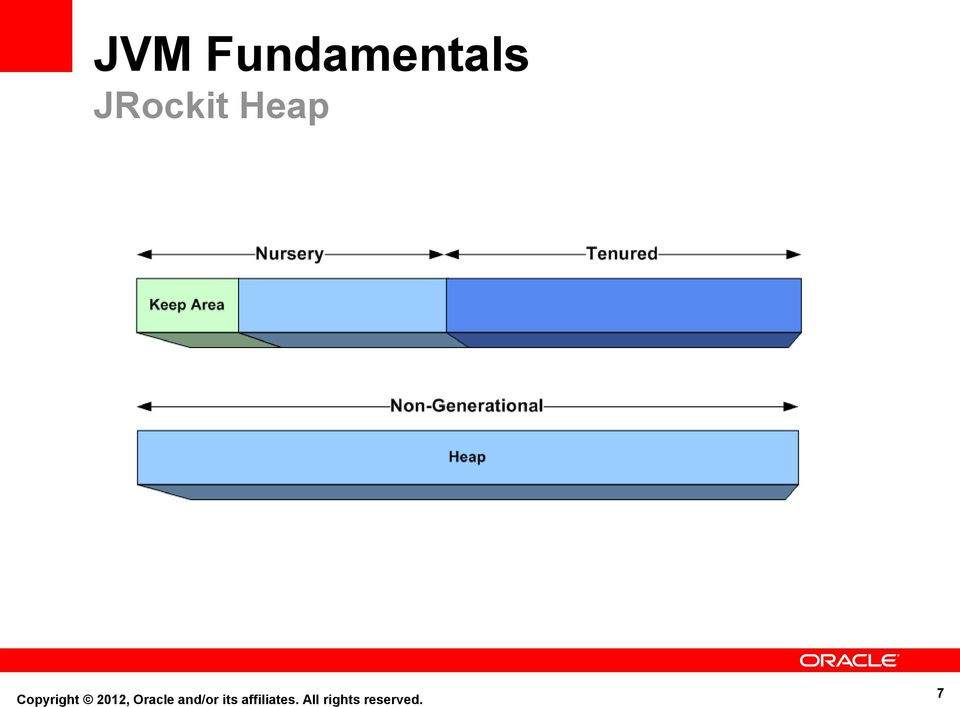
7 JVM Fundamentals JRockit Heap 7

8 JVM Fundamentals IBM JVM 8

9 JVM Fundamentals Java Compilation Interpreted Mode Byte code (.class) is interpreted initially* Just in Time (JIT) Compile Byte code is compiled to Native code when marked as a hotspot E.g. Method count crosses -XX:CompileThreshold in Hotspot JVM *JRockit only runs in compiled mode Optimization JVM collects heuristics and optimizes compiled code 9

10 JVM Fundamentals Adaptive Memory Management Hotspot calls it Ergonomics Collects heap usage and GC statistics Some values selected at startup based on server type For instance, generation sizes, heap size, gc threads Some values adjusted dynamically based on statistics For instance, survivor space JRockit switches GC algorithm dynamically Good out of the box performance Manually well tuned JVM yields better performance 10

11 Agenda JVM Fundamentals JVM Performance Tuning GC Fundamentals Hotspot Internals Hotspot Tuning Diagnosing GC Issues 11


12 JVM Performance Tuning Performance Tuning Process 12

 Important Responsiveness Latency, round trip time, user wait time, etc Very Important Minimize Memory Footprint Minimize GC Pauses You can only pick two!")
13 JVM Performance Tuning Performance metrics for Tuning Memory Footprint Less important on 64-bit Prevent swapping Startup Time Somewhat important (e.g. production) Throughput Transactions processed over time (e.g. TPS) Important Responsiveness Latency, round trip time, user wait time, etc Very Important Minimize Memory Footprint Minimize GC Pauses You can only pick two!! NOTE: Common mistake to use single message latency as indication of machine performance Minimize GC Overhead 13

14 JVM Performance Tuning JVM Monitoring and Profiling JVM Monitoring tools Online: JRMC (JRockit), VisualVM (Hotspot) Offline: GC logs, GCViewer (all), JFR JVM Profiling Memory, CPU, Lock/Monitor profiling Profilers Most IDE s (JVMTI) MAT (Heap dumps) JRMC (JRockit) VisualVM (Hotspot) 3 rd Party profilers (JProfiler, YourKit) 14
 JRMC (JRockit) VisualVM (Hotspot) 3 rd Party profilers (JProfiler,")
15 JVM Performance Tuning GCViewer Offline analysis of GC logs 15

16 JVM Performance Tuning GCViewer Memory Leak Pattern 16


17 JVM Performance Tuning JRockit Mission Control - Console 17


18 JVM Performance Tuning JRockit Mission Control - JFR 18


19 JVM Performance Tuning JRockit Mission Control - JFR 19

20 JVM Performance Tuning GC Tuning - Generic We will cover minimum parameters yielding maximum performance General Tuning Advice Keep it simple Provide the basic parameters (-X parameters) -Xms, -Xmx, -Xmn Select a GC/performance priority Throughput vs Pause Time Keep most defaults for the rest Let ergonomics compute the right values Fine tune only if defaults don t work 20

21 JVM Performance Tuning GC Tuning Parameters - Generic Most commonly used GC parameters Garbage collection policy (e.g. non-generational, concurrent, parallel GC, deterministic, etc) GC parallelism (serial vs parallel vs concurrent) Generation Sizes Most commonly used GC diagnostics parameters GC logging (e.g. -verbose:gc) Log Verbosity level. E.g. -XX:+PrintGCDetails (Hotspot), Xverbose:gcpause (JRockit) GC log file. E.g. -Xloggc:<file> (Hotspot), -Xverboselog: (JRockit) GC logging is safe to leave on in production 21
22 Agenda JVM Fundamentals JVM Performance Tuning GC Fundamentals Hotspot Internals Hotspot Tuning Diagnosing GC Issues 22
23 GC Fundamentals Garbage Distribution Objects die young 23

24 GC Fundamentals Garbage Distribution - Generational Collection Buckets ideally correspond to distribution curve Collect each bucket with most efficient algorithm Size buckets for best GC performance 24
25 Agenda JVM Fundamentals JVM Performance Tuning GC Fundamentals Hotspot Internals Hotspot Tuning Diagnosing GC Issues 25

26 Hotspot Internals Hotspot Heap 26

27 Hotspot Internals Generations & Object Lifecycle Eden S0 S1 27

28 Hotspot Internals Object lifecycle Number indicates Age 0 28
29 Hotspot Internals Object lifecycle 1 29
30 Hotspot Internals Object lifecycle 2 30
31 Hotspot Internals Object lifecycle 3 31
32 Hotspot Internals Object lifecycle 4 32

33 Hotspot Internals Object lifecycle 5 33

34 Hotspot Internals Object lifecycle 34
35 Agenda JVM Fundamentals JVM Performance Tuning GC Fundamentals Hotspot Internals Hotspot Tuning Diagnosing GC Issues 35
36 Hotspot Tuning Garbage Collectors - Old Collection -XX:+UseParallelGC -XX:+UseParallelOldGC -XX:+UseConcMarkSweepGC 36
37 Hotspot Tuning Garbage Collectors Hotspot generational collectors Young Gen collection aka minor collection Uses copy collection (most efficient type) Old Gen collection aka major collection Requires Full GC to compact fragmented heap space Old collection can be serial old (-XX:+UseParallelGC) parallel old (-XX:+UseParallelOldGC) concurrent (-XX:+UseConcMarkSweepGC) 37

38 Hotspot Tuning Hotspot Native Process Space Maximize Java Heap Fixed 38
39 Hotspot Tuning 32-bit vs. 64-bit 32-bit For heap sizes up to 2.5G/3G or so Reduce stack to maximize heap (-xss:128k) 64-bit with/without compressed references -XX:+/-UseCompressedOops (default JDK6_18+) Compressed references: 32GB Max (26GB best) -Xmx: 26G (compressed) / unlimited (regular) 32-bit 64-bit migration Higher heap size requirements (around 20%) Slight throughput impact (without compressed refs) 64-bit preferred for today s servers Only option starting with Fusion Middleware 12c 39
40 Hotspot Tuning Sizing Heap Young Generation size determines Frequency of minor GC Number of objects reclaimed in minor GC Old Generation Size Should hold application's steady-state live data size Try to minimize frequency of major GC s JVM footprint should not exceed physical memory Max of 80-90% RAM (leave room for OS) Thumb Rule: Try to maximize objects reclaimed in young gen. Minimize Full GC frequency 40
41 Hotspot Tuning Sizing Heap (cont d) Resize of any generation requires Full GC Set Xmx = Xms Prevents resizing (Full GC) to grow from Xms to Xmx Better performance Not always best for production availability (swapping preferred to OOME) Perm Size -XX:PermSize = -XX:MaxPermSize Perm Gen occupancy is hard to predict Set high enough to prevent PermGen OOME Set -XX:NewSize = -XX:MaxNewSize Using Xmn instead preferred 41
42 Hotspot Tuning Parallel GC Threads Number of parallel GC threads controlled by -XX:ParallelGCThreads=<num> Default value assumes 1 JVM Adjust ParallelGCThreads value for Number of JVMs deployed on the system/virtual-machine CPU chip architecture and cores e.g., Sun CMT, Intel Hyperthreads Example: Exalogic compute node has 2 x 6-core Intel CPU s that have hyperthreading (2 threads per core), for 24 virtual CPU s. If each node runs 4 WLS Instances 24/4 = 6 Set XX:ParallelGCThreads <= 6 as starting point per WLS JVM 42
43 Hotspot Tuning CMS Collector Tuning Concurrent Mark Sweep (low pause) collector -XX:+UseConcMarkSweepGC Pros: Better worst-case latencies than Throughput Collector Cons: Lower application throughput than Throughput Collector Fragmentation - lengthier (albeit concurrent) GC cycles Increase old gen size by at least 20% to 30% Tune the young generation as described so far Need to be even more careful about avoiding premature promotion Promotion in CMS is expensive Causes more fragmentation Full GC inevitable 43
44 Hotspot Tuning CMS Initiating Threshold Starting a CMS cycle too early Frequent CMS cycles Starting a CMS cycle too late Chance of an evacuation failure / Full GC Safer to do earlier than later Default CMS initiating threshold Computed dynamically Almost always starts too late (CMS miss) To override default -XX:CMSInitiatingOccupancyFraction=<percent> (e.g. 50) Set low enough to prevent Concurrent Mode Failure Always use with -XX:+UseCMSInitiatingOccupancyOnly 44

45 Hotspot Tuning Valid GC combinations Source: Jon Masamitsu s blog 45
46 Hotspot Tuning GC Recommendations Source: Jon Masamitsu s blog 46

47 Hotspot Tuning Default GC Values JDK6 Defaults -XX:+UseParallelGC ParallelGCThreads=CPU SurvivorRatio=32 PermSize=64M No GC logging Recommended -XX:+UseParallelOldGC ParallelGCThreads=CPU s/jvm s SurvivorRatio=8 PermSize=MaxPermSize Verbose GC logging 47
48 Hotspot Tuning Large Pages Use Large Pages for OS VM pages Memory intensive applications Applications using large objects Using Large Pages on Hotspot -XX:+UseLargePages On Solaris, on by default -XX:LargePageSizeInBytes=4m Valid values differ by OS and chip architecture E.g. max supported on x86 usually 2m 48
49 Hotspot Tuning Large Pages Example Exalogic and Linux Huge Pages Intel chip supports large pages (up to 2m) Regular Page size = 2KB Out-of-the-box Huge Page configuration on Exalogic Huge Page size = 2MB Number of Huge Pages = 10,000 Total 20GB reserved for Huge Pages Regular pages get (96GB 20GB) Change vm.nr_hugepages to rebalance Use -XX:+UseLargePagesForHeap on JRockit JVM heap now allocated on 20GB Huge Page Block Up to 15% performance improvement 49
50 Hotspot Tuning Hotspot Tuning Cheat-sheet 50
51 Agenda JVM Fundamentals JVM Performance Tuning GC Fundamentals Hotspot Internals Hotspot Tuning Diagnosing GC Issues 51
52 Diagnosing GC Issues Reading GC Logs - Minor GC GC logs are required for GC diagnosis [GC[PSYoungGen: 99952K->14688K(109312K)] K->341136K(764672K), secs] [Times: user=0.06 sys=0.00, real=0.06 secs] PSYoungGen indicates this is a minor collection Throughput collector used (e.g. UseParallelGC) Numbers mean SIZE_BEFORE_GC->SIZE_AFTER_GC(MAX_SIZE) STW pause = 0.06 secs ( real time) Similar minor collection log for CMS would show ParNew [GC[ParNew: 99952K->14688K(109312K)] K->341136K(764672K), secs] [Times: user=0.06 sys=0.00, real=0.06 secs] 52
53 Diagnosing GC Issues Reading GC Logs - Full GC Throughput collector Full GC [Full GC[PSYoungGen: 11456K->0K(110400K)] [ParOldGen: K->58466K(655360K)] K->58466K(765760K) [PSPermGen: 10191K->10191K(22528K)], secs[times: user=1.01 sys=0.00, real=1.12 secs] CMS collector Full GC [Full GC : [CMS59.608: [CMS-concurrent-sweep: 0.189/0.191 secs] [Times: user=0.37 sys=0.00, real=0.19 secs] (concurrent mode failure): K-> K( K), secs] K-> K( K), [CMS Perm : 2621K->2621K(524288K)], secs] [Times: user=3.35 sys=0.00, real=3.42 secs] 53
54 Diagnosing GC Issues GC log analysis Full GC usual cause for long pauses Search for Full GC in verbose GC logs Full GC in log Heap dump taken? Action Ignore this Full GC (triggered by heap dump) Shows string Full GC (system) Set -XX:+DisableExplicitGC Shows Perm full Increase XX:MaxPermSize Shows heap resized Set Xmx=-Xms, -XX:NewSIze=-XX:MaxNewSIze Shows concurrent mode failure Reduce -XX:CMSInitiatingOccupancyFraction OR Forgot to use XX:+CMSInitiatingOccupancyOnly 54
55 Full GC : [CMS-concurrent-sweep-start] : [CMS-concurrent-sweep: 4.004/4.015 secs] : [CMS-concurrent-reset-start] : [CMS-concurrent-reset: 0.264/0.264 secs] : [Full GC : [CMS (concurrent mode failure): K- >912719K( K), secs] K->912719K( K), [CMS Perm : K->142668K(262144K)], secs] Heap exhausted prior to CMS completion Dynamically adjusted CMS Initiation Occupancy incorrect Manually specify a more conservative initiation occupancy -XX:+UseCMSInitiatingOccupancyOnly -XX:CMSInitiatingPermOccupancyFraction=<percent> 55
56 Full GC : [GC : [ParNew: K->100069K( K), secs] K-> K( K), secs] [Times: user=0.85 sys=0.00, real=0.40 secs] : [GC : [ParNew: K->103052K( K), secs] K-> K( K), secs] [Times: user=0.83 sys=0.01, real=0.39 secs] : [Full GC : [CMS: K-> K( K), secs] K-> K( K), [CMS Perm : K- >475625K(524288K)], secs] [Times: user=40.13 sys=0.73, real=43.43 secs] Full GC caused by PermGen exhaustion Old gen is not close to full, but Full GC triggered Perm was full before Full GC Resolution: Increase XX:MaxPermSize Use XX:+CMSClassUnloadingEnabled 56
57 Full GC : [Full GC (System) : [CMS: K- >617525K( K), secs] K->617525K( K), [CMS Perm : K->205495K(421888K)], secs] [Times: user=69.89 sys=0.05, real=27.03 secs] : [Full GC (System) : [CMS: K- >612104K( K), secs] K->612104K( K), [CMS Perm : K->205495K(421888K)], secs] [Times: user=51.70 sys=0.02, real=25.82 secs] Back to back Full GC Full GC has (System) in log Resolution: Have customer remove system.gc() in code Add -XX:+DisableExplicitGC flag 57
58 Full GC : [GC [PSYoungGen: 736K->64K(832K)] 96847K->96191K( K), secs] [Times: user=0.00 sys=0.00, real=0.00 secs] : [GC [PSYoungGen: 703K->64K(832K)] 96831K->96207K( K), secs] [Times: user=0.00 sys=0.00, real=0.00 secs] : [GC [PSYoungGen: 101K->32K(832K)] 96244K->96199K( K), secs] [Times: user=0.00 sys=0.00, real=0.00 secs] : [Full GC [PSYoungGen: 32K->0K(832K)] [PSOldGen: 96167K- >56751K( K)] 96199K->56751K( K) [PSPermGen: 8115K->8115K(51200K)], secs] [Times: user=0.02 sys=0.00, real=0.02 secs] Normal Full GC log with no apparent trigger (lot of heap left on each generation) User could have triggered a heap dump Heap dump causes a full GC prior to dumping file 58
59 Full GC Pause - External Factors [Full GC K->747933K( K), secs] [Full GC K->747525K( K), secs] [Full GC K->748193K( K), secs] [Full GC K->697827K( K), secs] [Full GC K->657890K( K), secs] [Full GC K->688939K( K), secs] [Full GC K->240312K( K), secs] Heap size is only 1G Full GC time of 91s extremely high for this size heap Inspect OS for thrashing Memory: Excessive Paging CPU: ~100% 59
60 Questions? 60
Java Performance Tuning
 Summer 08 Java Performance Tuning Michael Finocchiaro This white paper presents the basics of Java Performance Tuning for large Application Servers. h t t p : / / m f i n o c c h i a r o. w o r d p r e
Troubleshoot the JVM like never before. JVM Troubleshooting Guide. Pierre-Hugues Charbonneau Ilias Tsagklis
 Troubleshoot the JVM like never before JVM Troubleshooting Guide Pierre-Hugues Charbonneau Ilias Tsagklis Table of Contents Oracle HotSpot JVM Memory...3 Java HotSpot VM Heap space...3 Java HotSpot VM
Angelika Langer www.angelikalanger.com. The Art of Garbage Collection Tuning
 Angelika Langer www.angelikalanger.com The Art of Garbage Collection Tuning objective discuss garbage collection algorithms in Sun/Oracle's JVM give brief overview of GC tuning strategies GC tuning (2)
Java Garbage Collection Basics
 Java Garbage Collection Basics Overview Purpose This tutorial covers the basics of how Garbage Collection works with the Hotspot JVM. Once you have learned how the garbage collector functions, learn how
JVM Garbage Collector settings investigation
 JVM Garbage Collector settings investigation Tigase, Inc. 1. Objective Investigate current JVM Garbage Collector settings, which results in high Heap usage, and propose new optimised ones. Following memory
Java Performance. Adrian Dozsa TM-JUG 18.09.2014
 Java Performance Adrian Dozsa TM-JUG 18.09.2014 Agenda Requirements Performance Testing Micro-benchmarks Concurrency GC Tools Why is performance important? We hate slow web pages/apps We hate timeouts
Introduction to Spark and Garbage Collection
 Tuning Java Garbage Collection for Spark Applications May 28, 2015 by Daoyuan Wang and Jie Huang This is a guest post from our friends in the SSG STO Big Data Technology group at Intel. Join us at the
Java Garbage Collection Characteristics and Tuning Guidelines for Apache Hadoop TeraSort Workload
 Java Garbage Collection Characteristics and Tuning Guidelines for Apache Hadoop TeraSort Workload Shrinivas Joshi, Software Performance Engineer Vasileios Liaskovitis, Performance Engineer 1. Introduction
THE BUSY DEVELOPER'S GUIDE TO JVM TROUBLESHOOTING
 THE BUSY DEVELOPER'S GUIDE TO JVM TROUBLESHOOTING November 5, 2010 Rohit Kelapure HTTP://WWW.LINKEDIN.COM/IN/ROHITKELAPURE HTTP://TWITTER.COM/RKELA Agenda 2 Application Server component overview Support
JVM Performance Study Comparing Oracle HotSpot and Azul Zing Using Apache Cassandra
 JVM Performance Study Comparing Oracle HotSpot and Azul Zing Using Apache Cassandra January 2014 Legal Notices Apache Cassandra, Spark and Solr and their respective logos are trademarks or registered trademarks
The Fundamentals of Tuning OpenJDK
 The Fundamentals of Tuning OpenJDK OSCON 2013 Portland, OR Charlie Hunt Architect, Performance Engineering Salesforce.com sfdc_ppt_corp_template_01_01_2012.ppt In a Nutshell What you need to know about
JBoss Data Grid Performance Study Comparing Java HotSpot to Azul Zing
 JBoss Data Grid Performance Study Comparing Java HotSpot to Azul Zing January 2014 Legal Notices JBoss, Red Hat and their respective logos are trademarks or registered trademarks of Red Hat, Inc. Azul
Garbage Collection in the Java HotSpot Virtual Machine
 http://www.devx.com Printed from http://www.devx.com/java/article/21977/1954 Garbage Collection in the Java HotSpot Virtual Machine Gain a better understanding of how garbage collection in the Java HotSpot
Identifying Performance Bottleneck using JRockit. - Shivaram Thirunavukkarasu Performance Engineer Wipro Technologies
 Identifying Performance Bottleneck using JRockit - Shivaram Thirunavukkarasu Performance Engineer Wipro Technologies Table of Contents About JRockit Mission Control... 3 Five things to look for in JRMC
Extreme Performance with Java
 Extreme Performance with Java QCon NYC - June 2012 Charlie Hunt Architect, Performance Engineering Salesforce.com sfdc_ppt_corp_template_01_01_2012.ppt In a Nutshell What you need to know about a modern
Using jvmstat and visualgc to Solve Memory Management Problems
 Using jvmstat and visualgc to Solve Memory Management Problems java.sun.com/javaone/sf 1 Wally Wedel Sun Software Services Brian Doherty Sun Microsystems, Inc. Analyze JVM Machine Memory Management Problems
USE IMPROVE EVANGELIZE. JVM Internals, 0.75. Stefan Parvu System Administrator. http://www.nbl.fi/stefan.parvu
 JVM Internals, 0.75 Stefan Parvu System Administrator http://www.nbl.fi/stefan.parvu License, copyrights COPYRIGHT: Copyright (c) 2008 Stefan Parvu The contents of this file are subject to the terms of
Garbage Collection in NonStop Server for Java
 Garbage Collection in NonStop Server for Java Technical white paper Table of contents 1. Introduction... 2 2. Garbage Collection Concepts... 2 3. Garbage Collection in NSJ... 3 4. NSJ Garbage Collection
An Oracle White Paper September 2013. Advanced Java Diagnostics and Monitoring Without Performance Overhead
 An Oracle White Paper September 2013 Advanced Java Diagnostics and Monitoring Without Performance Overhead Introduction... 1 Non-Intrusive Profiling and Diagnostics... 2 JMX Console... 2 Java Flight Recorder...
BEAJRockit Mission Control. Using JRockit Mission Control in the Eclipse IDE
 BEAJRockit Mission Control Using JRockit Mission Control in the Eclipse IDE Mission Control 3.0.2 Document Revised: June, 2008 Contents 1. Introduction Benefits of the Integration................................................
Performance Tuning for Oracle WebCenter Content 11g: Strategies & Tactics CHRIS ROTHWELL & PAUL HEUPEL FISHBOWL SOLUTIONS, INC.
 Performance Tuning for Oracle WebCenter Content 11g: Strategies & Tactics CHRIS ROTHWELL & PAUL HEUPEL FISHBOWL SOLUTIONS, INC. i Fishbowl Solutions Notice The information contained in this document represents
Practical Performance Understanding the Performance of Your Application
 Neil Masson IBM Java Service Technical Lead 25 th September 2012 Practical Performance Understanding the Performance of Your Application 1 WebSphere User Group: Practical Performance Understand the Performance
Advanced Liferay Architecture: Clustering and High Availability
 Advanced Liferay Architecture: Clustering and High Availability Revision 1.1, Oct 2010 *Note: All of the configuration examples in 3 rd -party software (i.e. Apache, Sun Java) in this document are examples
Robert Honeyman http://www.honeymanit.co.uk rob.honeyman@honeymanit.co.uk
 An Introduction to WebLogic Administration Robert Honeyman http://www.honeymanit.co.uk rob.honeyman@honeymanit.co.uk WEBLOGIC 11G : WHAT IS IT? Weblogic 10.3.3-10.3.6 = 11g Java EE 5 compliant Application
Agenda. Tomcat Versions Troubleshooting management Tomcat Connectors HTTP Protocal and Performance Log Tuning JVM Tuning Load balancing Tomcat
 Agenda Tomcat Versions Troubleshooting management Tomcat Connectors HTTP Protocal and Performance Log Tuning JVM Tuning Load balancing Tomcat Tomcat Performance Tuning Tomcat Versions Application/System
MID-TIER DEPLOYMENT KB
 MID-TIER DEPLOYMENT KB Author: BMC Software, Inc. Date: 23 Dec 2011 PAGE 1 OF 16 23/12/2011 Table of Contents 1. Overview 3 2. Sizing guidelines 3 3. Virtual Environment Notes 4 4. Physical Environment
How To Improve Performance On An Asa 9.4 Web Application Server (For Advanced Users)
") Paper SAS315-2014 SAS 9.4 Web Application Performance: Monitoring, Tuning, Scaling, and Troubleshooting Rob Sioss, SAS Institute Inc., Cary, NC ABSTRACT SAS 9.4 introduces several new software products
Paper SAS315-2014 SAS 9.4 Web Application Performance: Monitoring, Tuning, Scaling, and Troubleshooting Rob Sioss, SAS Institute Inc., Cary, NC ABSTRACT SAS 9.4 introduces several new software products
JBoss Seam Performance and Scalability on Dell PowerEdge 1855 Blade Servers
 JBoss Seam Performance and Scalability on Dell PowerEdge 1855 Blade Servers Dave Jaffe, PhD, Dell Inc. Michael Yuan, PhD, JBoss / RedHat June 14th, 2006 JBoss Inc. 2006 About us Dave Jaffe Works for Dell
Production time profiling On-Demand with Java Flight Recorder
 Production time profiling On-Demand with Java Flight Recorder Using Java Mission Control & Java Flight Recorder Klara Ward Principal Software Developer Java Platform Group, Oracle Copyright 2015, Oracle
Memory Management in the Java HotSpot Virtual Machine
 Memory Management in the Java HotSpot Virtual Machine Sun Microsystems April 2006 2 Table of Contents Table of Contents 1 Introduction.....................................................................
JBoss Cookbook: Secret Recipes. David Chia Senior TAM, JBoss May 5 th 2011
 JBoss Cookbook: Secret Recipes David Chia Senior TAM, JBoss May 5 th 2011 Secret Recipes Byteman Cluster and Load Balancing Configuration Generator Troubleshooting High CPU Mocking a JBoss Hang State Byte
enterprise professional expertise distilled
 Oracle JRockit The Definitive Guide Develop and manage robust Java applications with Oracle's high-performance Java Virtual Machine Marcus Hirt Marcus Lagergren PUBLISHING enterprise professional expertise
Oracle JRockit Mission Control Overview
 Oracle JRockit Mission Control Overview An Oracle White Paper June 2008 JROCKIT Oracle JRockit Mission Control Overview Oracle JRockit Mission Control Overview...3 Introduction...3 Non-intrusive profiling
Optimize GlassFish Performance in a Production Environment Performance White Paper February 2009. Abstract
 Optimize GlassFish Performance in a Production Environment Performance White Paper February 2009 Abstract Sun GlassFish Application Server v2 is a high performance application server. This white paper
Mission-Critical Java. An Oracle White Paper Updated October 2008
 Mission-Critical Java An Oracle White Paper Updated October 2008 Mission-Critical Java The Oracle JRockit family of products is a comprehensive portfolio of Java runtime solutions that leverages the base
Java in Virtual Machines on VMware ESX: Best Practices
 Java in Virtual Machines on VMware ESX: Best Practices TABLE OF CONTENTS 1. SUMMARY OF BEST PRACTICES...1 1.1 Java in Virtual Machines on ESX...1 1.2. Running Applications in ESX Virtual Machines...2 2.
IBM WebSphere Portal 7.0 Performance Tuning Guide
 IBM WebSphere Portal software family Your world. Your way. IBM WebSphere Portal 7.0 Performance Tuning Guide IBM Collaboration Solutions Performance Team December 2010 Document version 1 Contents PERFORMANCE
Tuning WebSphere Application Server ND 7.0. Royal Cyber Inc.
 Tuning WebSphere Application Server ND 7.0 Royal Cyber Inc. JVM related problems Application server stops responding Server crash Hung process Out of memory condition Performance degradation Check if the
Oracle WebLogic Server 11g: Monitor and Tune Performance
 D61529GC10 Edition 1.0 March 2010 D66055 Oracle WebLogic Server 11g: Monitor and Tune Performance Student Guide Author Shankar Raman Technical Contributors and Reviewer s Werner Bauer Nicole Haba Bala
Arun Kejariwal. CS229 Project Report
 Arun Kejariwal CS229 Project Report Abstract Elasticity of cloud assists in achieving availability of web applicatis by scaling up a cluster as incoming traffic increases and keep operatial costs under
Tomcat Tuning. Mark Thomas April 2009
 Tomcat Tuning Mark Thomas April 2009 Who am I? Apache Tomcat committer Resolved 1,500+ Tomcat bugs Apache Tomcat PMC member Member of the Apache Software Foundation Member of the ASF security committee
Performance Optimization For Operational Risk Management Application On Azure Platform
 Performance Optimization For Operational Risk Management Application On Azure Platform Ashutosh Sabde, TCS www.cmgindia.org 1 Contents Introduction Functional Requirements Non Functional Requirements Business
Understanding Java Garbage Collection
 TECHNOLOGY WHITE PAPER Understanding Java Garbage Collection And What You Can Do About It Table of Contents Executive Summary... 3 Introduction.... 4 Why Care About the Java Garbage Collector?.... 5 Classifying
Performance Monitoring and Tuning. Liferay Chicago User Group (LCHIUG) James Lefeu 29AUG2013
 James Lefeu 29AUG2013") Performance Monitoring and Tuning Liferay Chicago User Group (LCHIUG) James Lefeu 29AUG2013 Outline I. Definitions II. Architecture III.Requirements and Design IV.JDK Tuning V. Liferay Tuning VI.Profiling
Performance Monitoring and Tuning Liferay Chicago User Group (LCHIUG) James Lefeu 29AUG2013 Outline I. Definitions II. Architecture III.Requirements and Design IV.JDK Tuning V. Liferay Tuning VI.Profiling
Liferay Performance Tuning
 Liferay Performance Tuning Tips, tricks, and best practices Michael C. Han Liferay, INC A Survey Why? Considering using Liferay, curious about performance. Currently implementing and thinking ahead. Running
<Insert Picture Here> Java Application Diagnostic Expert
 Java Application Diagnostic Expert Agenda 1. Enterprise Manager 2. Challenges 3. Java Application Diagnostics Expert (JADE) 4. Feature-Benefit Summary 5. Features Overview Diagnostic
What s Cool in the SAP JVM (CON3243)
") What s Cool in the SAP JVM (CON3243) Volker Simonis, SAP SE September, 2014 Public Agenda SAP JVM Supportability SAP JVM Profiler SAP JVM Debugger 2014 SAP SE. All rights reserved. Public 2 SAP JVM SAP
What s Cool in the SAP JVM (CON3243) Volker Simonis, SAP SE September, 2014 Public Agenda SAP JVM Supportability SAP JVM Profiler SAP JVM Debugger 2014 SAP SE. All rights reserved. Public 2 SAP JVM SAP
An Oracle White Paper March 2013. Load Testing Best Practices for Oracle E- Business Suite using Oracle Application Testing Suite
 An Oracle White Paper March 2013 Load Testing Best Practices for Oracle E- Business Suite using Oracle Application Testing Suite Executive Overview... 1 Introduction... 1 Oracle Load Testing Setup... 2
How To Use Java On An Ipa 2.2.2 (Jspa) With A Microsoft Powerbook (Jempa) With An Ipad 2.3.2 And A Microos 2.5 (Microos)
 With A Microsoft Powerbook (Jempa) With An Ipad 2.3.2 And A Microos 2.5 (Microos)") Java Monitoring and Diagnostic Tooling Iris Baron IBM Java JIT on System Z ibaron@ca.ibm.com Session ID: 16182 Insert Custom Session QR if Desired. Java Road Map Java 7.0 Language Updates Java 6.0 SE 5.0
Java Monitoring and Diagnostic Tooling Iris Baron IBM Java JIT on System Z ibaron@ca.ibm.com Session ID: 16182 Insert Custom Session QR if Desired. Java Road Map Java 7.0 Language Updates Java 6.0 SE 5.0
Tool - 1: Health Center
 Tool - 1: Health Center Joseph Amrith Raj http://facebook.com/webspherelibrary 2 Tool - 1: Health Center Table of Contents WebSphere Application Server Troubleshooting... Error! Bookmark not defined. About
Holly Cummins IBM Hursley Labs. Java performance not so scary after all
 Holly Cummins IBM Hursley Labs Java performance not so scary after all So... You have a performance problem. What next? Goals After this talk you will: Not feel abject terror when confronted with a performance
Cognos8 Deployment Best Practices for Performance/Scalability. Barnaby Cole Practice Lead, Technical Services
 Cognos8 Deployment Best Practices for Performance/Scalability Barnaby Cole Practice Lead, Technical Services Agenda > Cognos 8 Architecture Overview > Cognos 8 Components > Load Balancing > Deployment
Java Troubleshooting and Performance
 Java Troubleshooting and Performance Margus Pala Java Fundamentals 08.12.2014 Agenda Debugger Thread dumps Memory dumps Crash dumps Tools/profilers Rules of (performance) optimization 1. Don't optimize
Validating Java for Safety-Critical Applications
 Validating Java for Safety-Critical Applications Jean-Marie Dautelle * Raytheon Company, Marlborough, MA, 01752 With the real-time extensions, Java can now be used for safety critical systems. It is therefore
Oracle WebLogic Server Monitoring and Performance Tuning
 Oracle WebLogic Server Monitoring and Performance Tuning Duško Vukmanović Principal Sales Consultant, FMW Stuck Threads A Label given to threads not returned to thread pool after
Web Performance, Inc. Testing Services Sample Performance Analysis
 Web Performance, Inc. Testing Services Sample Performance Analysis Overview This document contains two performance analysis reports created for actual web testing clients, and are a good example of the
WebSphere Architect (Performance and Monitoring) 2011 IBM Corporation
 2011 IBM Corporation") Track Name: Application Infrastructure Topic : WebSphere Application Server Top 10 Performance Tuning Recommendations. Presenter Name : Vishal A Charegaonkar WebSphere Architect (Performance and Monitoring)
Track Name: Application Infrastructure Topic : WebSphere Application Server Top 10 Performance Tuning Recommendations. Presenter Name : Vishal A Charegaonkar WebSphere Architect (Performance and Monitoring)
MONITORING A WEBCENTER CONTENT DEPLOYMENT WITH ENTERPRISE MANAGER
 MONITORING A WEBCENTER CONTENT DEPLOYMENT WITH ENTERPRISE MANAGER Andrew Bennett, TEAM Informatics, Inc. Why We Monitor During any software implementation there comes a time where a question is raised
Java Garbage Collection Best Practices for Sizing and Tuning the Java Heap
 IBM Software Group Java Garbage Collection Best Practices for Sizing and Tuning the Java Heap Chris Bailey WebSphere Support Technical Exchange Objectives Overview Selecting the Correct GC Policy Sizing
Tuning Your GlassFish Performance Tips. Deep Singh Enterprise Java Performance Team Sun Microsystems, Inc.
 Tuning Your GlassFish Performance Tips Deep Singh Enterprise Java Performance Team Sun Microsystems, Inc. 1 Presentation Goal Learn tips and techniques on how to improve performance of GlassFish Application
PERFORMANCE ENHANCEMENTS IN TreeAge Pro 2014 R1.0
 PERFORMANCE ENHANCEMENTS IN TreeAge Pro 2014 R1.0 15 th January 2014 Al Chrosny Director, Software Engineering TreeAge Software, Inc. achrosny@treeage.com Andrew Munzer Director, Training and Customer
THE BUSY JAVA DEVELOPER'S GUIDE TO WEBSPHERE DEBUGGING & TROUBLESHOOTING
 THE BUSY JAVA DEVELOPER'S GUIDE TO WEBSPHERE DEBUGGING & TROUBLESHOOTING ROHIT KELAPURE IBM ADVISORY SOFTWARE ENGINEER HTTP://WWW.LINKEDIN.COM/IN/ROHITKELAPURE HTTP://TWITTER.COM/RKELA HTTP://WASDYNACACHE.BLOGSPOT.COM/
TDA - Thread Dump Analyzer
 TDA - Thread Dump Analyzer TDA - Thread Dump Analyzer Published September, 2008 Copyright 2006-2008 Ingo Rockel Table of Contents 1.... 1 1.1. Request Thread Dumps... 2 1.2. Thread
WEBLOGIC ADMINISTRATION
 WEBLOGIC ADMINISTRATION Session 1: Introduction Oracle Weblogic Server Components Java SDK and Java Enterprise Edition Application Servers & Web Servers Documentation Session 2: Installation System Configuration
Advanced Performance Forensics
 Advanced Performance Forensics Uncovering the Mysteries of Performance and Scalability Incidents through Forensic Engineering Stephen Feldman Senior Director Performance Engineering and Architecture stephen.feldman@blackboard.com
A Practical Method to Diagnose Memory Leaks in Java Application Alan Yu
 A Practical Method to Diagnose Memory Leaks in Java Application Alan Yu 1. Introduction The Java virtual machine s heap stores all objects created by a running Java application. Objects are created by
An Oracle White Paper September, 2012. Enterprise Manager 12c Cloud Control: Monitoring and Managing Oracle Coherence for High Performance
 An Oracle White Paper September, 2012 Enterprise Manager 12c Cloud Control: Monitoring and Managing Oracle Coherence for High Performance Executive Overview... 2 Introduction... 2 Abstract Data Layer...
Solutions for detect, diagnose and resolve performance problems in J2EE applications
 IX Konferencja PLOUG Koœcielisko PaŸdziernik 2003 Solutions for detect, diagnose and resolve performance problems in J2EE applications Cristian Maties Quest Software Custom-developed J2EE applications
Java Monitoring. Stuff You Can Get For Free (And Stuff You Can t) Paul Jasek Sales Engineer
 Paul Jasek Sales Engineer") Java Monitoring Stuff You Can Get For Free (And Stuff You Can t) Paul Jasek Sales Engineer A Bit About Me Current: Past: Pre-Sales Engineer (1997 present) WaveMaker Wily Persistence GemStone Application
Java Monitoring Stuff You Can Get For Free (And Stuff You Can t) Paul Jasek Sales Engineer A Bit About Me Current: Past: Pre-Sales Engineer (1997 present) WaveMaker Wily Persistence GemStone Application
Enterprise Manager Performance Tips
 Enterprise Manager Performance Tips + The tips below are related to common situations customers experience when their Enterprise Manager(s) are not performing consistent with performance goals. If you
An Oracle White Paper August 2012. Oracle WebCenter Content 11gR1 Performance Testing Results
 An Oracle White Paper August 2012 Oracle WebCenter Content 11gR1 Performance Testing Results Introduction... 2 Oracle WebCenter Content Architecture... 2 High Volume Content & Imaging Application Characteristics...
Blackboard Learn TM, Release 9 Technology Architecture. John Fontaine
 Blackboard Learn TM, Release 9 Technology Architecture John Fontaine Overview Background Blackboard Learn Deployment Model and Architecture Setup and Installation Common Administrative Tasks Tuning Integrating
Technical Paper. Moving SAS Applications from a Physical to a Virtual VMware Environment
 Technical Paper Moving SAS Applications from a Physical to a Virtual VMware Environment Release Information Content Version: April 2015. Trademarks and Patents SAS Institute Inc., SAS Campus Drive, Cary,
Deploying a Logi Info Application on WAS
 Deploying a Logi Info Application on WAS Updated 30 April 2015 These instructions apply to WAS 7.x and WAS 8.x, for use with Logi Info and JDK 1.6 or 7.x. WAS versions earlier than 7.0 cannot be used with
An Oracle White Paper October, 2013. Enterprise Manager 12c Cloud Control Sizing Guidelines
 An Oracle White Paper October, 2013 Enterprise Manager 12c Cloud Control Executive Overview... 1 Introduction... 1 Overview of... 2 Hardware Information... 2 Sizing Specifications... 2 Sizing for Upgraded
Insight into Performance Testing J2EE Applications Sep 2008
 Insight into Performance Testing J2EE Applications Sep 2008 Presented by Chandrasekar Thodla 2008, Cognizant Technology Solutions. All Rights Reserved. The information contained herein is subject to change
An Oracle White Paper July 2011. Oracle Primavera Contract Management, Business Intelligence Publisher Edition-Sizing Guide
 Oracle Primavera Contract Management, Business Intelligence Publisher Edition-Sizing Guide An Oracle White Paper July 2011 1 Disclaimer The following is intended to outline our general product direction.
Effective Java Programming. measurement as the basis
 Effective Java Programming measurement as the basis Structure measurement as the basis benchmarking micro macro profiling why you should do this? profiling tools Motto "We should forget about small efficiencies,
WebSphere Performance Monitoring & Tuning For Webtop Version 5.3 on WebSphere 5.1.x
 Frequently Asked Questions WebSphere Performance Monitoring & Tuning For Webtop Version 5.3 on WebSphere 5.1.x FAQ Version 1.0 External FAQ1. Q. How do I monitor Webtop performance in WebSphere? 1 Enabling
Agenda. Enterprise Application Performance Factors. Current form of Enterprise Applications. Factors to Application Performance.
 Agenda Enterprise Performance Factors Overall Enterprise Performance Factors Best Practice for generic Enterprise Best Practice for 3-tiers Enterprise Hardware Load Balancer Basic Unix Tuning Performance
PTC System Monitor Solution Training
 PTC System Monitor Solution Training Patrick Kulenkamp June 2012 Agenda What is PTC System Monitor (PSM)? How does it work? Terminology PSM Configuration The PTC Integrity Implementation Drilling Down
Crystal Reports Server 2008
 Revision Date: July 2009 Crystal Reports Server 2008 Sizing Guide Overview Crystal Reports Server system sizing involves the process of determining how many resources are required to support a given workload.
Java Mission Control
 Java Mission Control Harald Bräuning Resources Main Resource: Java Mission Control Tutorial by Marcus Hirt http://hirt.se/downloads/oracle/jmc_tutorial.zip includes sample projects! Local copy: /common/fesa/jmcexamples/jmc_tutorial.zip
ILOG JRules Performance Analysis and Capacity Planning
 ILOG JRules Performance Analysis and Capacity Planning Version 1. Last Modified: 25-9-31 Introduction JRules customers and evaluators often ask fundamental questions such as: How fast is the rule engine?,
Oracle Weblogic. Setup, Configuration, Tuning, and Considerations. Presented by: Michael Hogan Sr. Technical Consultant at Enkitec
 Oracle Weblogic Setup, Configuration, Tuning, and Considerations Presented by: Michael Hogan Sr. Technical Consultant at Enkitec Overview Weblogic Installation and Cluster Setup Weblogic Tuning Considerations
IBM SDK, Java Technology Edition Version 1. IBM JVM messages IBM
 IBM SDK, Java Technology Edition Version 1 IBM JVM messages IBM IBM SDK, Java Technology Edition Version 1 IBM JVM messages IBM Note Before you use this information and the product it supports, read the
BEA White Paper. Adaptive Memory Management for Virtualized Java Environments
 White Paper Adaptive Memory Management for Virtualized Java Environments Copyright Copyright 1995 2007 Systems, Inc. All Rights Reserved. Restricted Rights Legend This software is protected by copyright,
Performance Management for Cloudbased STC 2012
 Performance Management for Cloudbased Applications STC 2012 1 Agenda Context Problem Statement Cloud Architecture Need for Performance in Cloud Performance Challenges in Cloud Generic IaaS / PaaS / SaaS
Azul Pauseless Garbage Collection
 TECHNOLOGY WHITE PAPER Azul Pauseless Garbage Collection Providing continuous, pauseless operation for Java applications Executive Summary Conventional garbage collection approaches limit the scalability
Zing Vision. Answering your toughest production Java performance questions
 Zing Vision Answering your toughest production Java performance questions Outline What is Zing Vision? Where does Zing Vision fit in your Java environment? Key features How it works Using ZVRobot Q & A
System Requirements Table of contents
 Table of contents 1 Introduction... 2 2 Knoa Agent... 2 2.1 System Requirements...2 2.2 Environment Requirements...4 3 Knoa Server Architecture...4 3.1 Knoa Server Components... 4 3.2 Server Hardware Setup...5
Enabling Java in Latency Sensitive Environments
 Enabling Java in Latency Sensitive Environments Matt Schuetze, Product Manager, Azul Systems Utah JUG, Murray UT, November 20, 2014 High level agenda Intro, jitter vs. JITTER Java in a low latency application
Oracle WebLogic Thread Pool Tuning
 Oracle WebLogic Thread Pool Tuning AN ACTIVE ENDPOINTS TECHNICAL NOTE 2010 Active Endpoints Inc. ActiveVOS is a trademark of Active Endpoints, Inc. All other company and product names are the property
Apache and Tomcat Clustering Configuration Table of Contents
 Apache and Tomcat Clustering Configuration Table of Contents INTRODUCTION REVISION HISTORY DOWNLOAD AND INSTALL JDK DOWNLOAD AND INSTALL APACHE WEB SERVER (HTTPD) DOWNLOAD AND INSTALL TOMCAT SERVER APACHE
11.1 inspectit. 11.1. inspectit
 11.1. inspectit Figure 11.1. Overview on the inspectit components [Siegl and Bouillet 2011] 11.1 inspectit The inspectit monitoring tool (website: http://www.inspectit.eu/) has been developed by NovaTec.
Mark Bennett. Search and the Virtual Machine
 Mark Bennett Search and the Virtual Machine Agenda Intro / Business Drivers What to do with Search + Virtual What Makes Search Fast (or Slow!) Virtual Platforms Test Results Trends / Wrap Up / Q & A Business
MEASURING WORKLOAD PERFORMANCE IS THE INFRASTRUCTURE A PROBLEM?
 MEASURING WORKLOAD PERFORMANCE IS THE INFRASTRUCTURE A PROBLEM? Ashutosh Shinde Performance Architect ashutosh_shinde@hotmail.com Validating if the workload generated by the load generating tools is applied
Implementing a Well- Performing and Reliable Portal
 Implementing a Well- Performing and Reliable Portal Adam Rybicki arybicki@unicon.net Agenda I. Introduction II. Tools Needed III. Capacity Planning IV. Load Testing V. Automatic Failover VI. Performance
How To Monitor A Server With Zabbix
 & JavaEE Platform Monitoring A Good Match? Company Facts Jesta Digital is a leading global provider of next generation entertainment content and services for the digital consumer. subsidiary of Jesta Group,
Performance Monitoring API for Java Enterprise Applications
 Performance Monitoring API for Java Enterprise Applications Purpose Perfmon4j has been successfully deployed in hundreds of production java systems over the last 5 years. It has proven to be a highly successful