INDOOR CROP PRODUCTION FEEDING THE FUTURE
|
|
|
- Mae Cobb
- 8 years ago
- Views:
Transcription
1 INDOOR CROP PRODUCTION FEEDING THE FUTURE MARCH 2015

2 About the White Paper The purpose of this paper is to consolidate knowledge on the current state of the indoor agriculture industry, demonstrate its growing importance to our food system, and present the case for its long-term economic viability. Our target audience is those that do not know the industry well; the paper is intended as an introduction to indoor agriculture. As its authors, we do not consider ourselves expert in the industry, nor are we bound by any legal or contractual relationship to one another. We came together to create this paper out of a shared belief that, by better understanding the current state and trajectory of the indoor agriculture industry, we can collectively work to expedite its growth and create new opportunities for economic gain as well as wide-scale improvement in the US food supply system. About the Authors Newbean Capital is a registered investment adviser that manages early stage venture capital mandates for institutional investors. Its founder Nicola Kerslake has a longstanding interest in agriculture investment, having previously covered agriculture stocks as an equity analyst and managed institutional investment portfolios that covered the sector. She founded the Indoor Ag-Con event three years ago to provide a meeting place for those who are as passionate as she is about the promise of the indoor agriculture industry. hello@newbeancapital.com Local Roots is a thought leader in indoor agriculture, dedicated to solving systemic food chain inef iciencies through innovation and technology-driven solutions. Local Roots is currently pioneering modular controlled environment agriculture technologies that enable year round crop production in any climate, in any geography. Local Roots Mission is to provide everyone access to fresh, healthy, and affordable locallygrown produce. dan@localrootsfarms.com Proteus Environmental Technologies provides both market-based solutions to facilitate the successful commercialization of new technologies as well as consulting services that help its clients to improve their bottom line through the careful implementation of sustainability technologies and practices. We provide clients with a comprehensive analysis of sustainability options that is weighted by both the economic and societal bene its. Commercialization and consulting de ines entrepreneurial strategies for achieving sustainability goals and can help implement the chosen strategies. info@proteusenv.com Acknowledgements The authors would like to thank the following for their input into this paper: Megan Klein at FarmedHere, Chris Higgins at Hort Americas, Andrew Mefferd at Johnny s Selected Seeds, Wendy Millet and Doug Millar at TomKat Ranch, Matt Roy at US Foods.

3 Disclaimer This publication has been produced by Newbean Capital, a registered investment adviser. Readership of this publication does not create an investment client, or other business or legal relationship. It provides information about the indoor agriculture market to help you to better understand this industry. This publication does not purport to provide investment advice, nor may it be relied upon as a substitute for, speci ic investment, legal or other professional advice. You should seek such advice only from a qualified professional. Newbean Capital has acted in good faith to provide an accurate publication. However, Newbean Capital does not make any warranties or representations of any kind about the contents of this publication, the accuracy or timeliness of its contents, or the information or explanations given. Newbean Capital has no obligation to update this report or any information contained within it. Newbean Capital does not have any duty to you, whether in contract, tort, under statute or otherwise with respect to or in connection with this publication or the information contained within it. To the fullest extent permitted by law, Newbean Capital disclaims any responsibility or liability for any loss or damage suffered or cost incurred by you or by any other person arising out of or in connection with you or any other person s reliance on this publication or on the information contained within it and for any omissions or inaccuracies.

4 EXECUTIVE SUMMARY ndoor agriculture is quickly gaining momentum in the United States. Indoor farms mostly use Ifarming techniques and technologies which allow for improved control over the variables involved in the growing of produce. We estimate that there are 15 commercial-scale vertical farms and rooftop greenhouses in North America today, and that a further 30 will be added in 2015 alone. With a total addressable market size of over $9bn or 17x the current US market size - indoor agriculture is poised to be the next major enhancement to the American food supply chain. Strong growth in local food demand, the market for which has expanded from an estimated $1 billion in 2005 to nearly $7 billion last year, has meant a unique market entry point for indoor farms higher pricepoint products, whether this means leafy greens harvested that morning for lunch service or microgreens grown to order for a local supermarket. While seasonality, soil conditions, and access to land have traditionally made year-round local produce sourcing impossible, indoor agriculture is well positioned to satisfy the largely unmet need for local produce by growing year-round in any climate. Indoor farms have historically struggled to compete on cost with outdoor counterparts but ' ield parity' growing at the same per plant cost as in outdoor farms - is quickly becoming a reality thanks to rapid falls in technology costs in areas as diverse as lighting, seed development and control systems. Continued advances in technology are driving the industry towards wide-scale economic viability. Indoor crop production has secondary bene its that increase ef iciency in our national food supply chain. Indoor farms can theoretically be located anywhere, including retailer parking lots, urban rooftops, vacant lots, and rural locations. Farmers can more easily grow just in time and can supplement outdoor growing by supplying produce off season. Combined, this means lower transportation costs, less spoilage and better quality produce on the supermarket shelf. It helps supermarkets cut the $15bn they lose annually on unsold and spoiled produce. This lexibility has encouraged supermarket chains, restaurants and campuses to source produce from indoor farms. Investors too have a newfound interest in the sector, with about 12% of global agtech investment dollars going into indoor cultivation systems last year. In the US, at least $32 million in venture capital-like funds was invested in indoor agriculture in 2014, more than 60% of the total raised from 2011 onwards. Like many young industries, the indoor agriculture sector looks to a variety of stakeholders to aid its expansion. Local governments have a role to play in clarifying regulation and zoning for indoor farms, while their federal counterparts can provide better data and extend existing funding programs to the indoor sector. Chefs can use their voice to incorporate indoor crops into menus, to educate consumers on its bene its and to work with farmers on innovative lavor pro iles. Indoor farming will never replace conventional outdoor farming methods. It will instead augment the food chain to create a diverse, distributed system more resilient to supply shocks and better prepared to meet the demands of a growing global population. PAGE 3 INDOOR CROP PRODUCTION FEEDING THE FUTURE MARCH 2015

5 Newbean Capital 2015

6 TABLE OF CONTENTS Executive Summary A. An Introduction to Indoor Agriculture Diagram One: Indoor Agriculture Industry Timeline Diagram Two: Indoor Agriculture Industry By Structure Diagram Three: USA s Large Greenhouse Companies Diagram Four: Canada s Large Greenhouse Companies Diagram Five: US & Canadian Commercial Scale Vertical Farms B. Primary Factors Driving Indoor Agriculture Growth Diagram Six: State Fruit & Veggie Production As Share of Demand (%) Case Study: Lufa Farms Brings Local Food to Montreal C. The Technologies Behind Indoor Crop Production Diagram Seven: Hydroponic System Components Case Study: The Rise of the Greenhouse Tomato Diagram Eight: Retail Tomato Dollars D. Secondary Benefits of Indoor Crop Production Diagram Nine: Non-Organic Green Leaf Letuce Prices By Hub, $/Carton 24S, Nov 2012-Nov Diagram Ten: Year on Year Changes in Incidence of Laboratory-Confirmed Bacterial Infections, US, Case Study: Feeding A Grass-Fed Herd In A Time Of Drought E. The Indoor Agriculture Investment Landscape Table Eleven: Venture Capital Investment In North American Indoor Agriculture F. Expediting Industry Growth Case Study: How an Urban Ordinance Fueled Chicago s Indoor Agriculture Industry G. The Future of Indoor Crop Production Appendix: Calculating the Addressable Market for Indoor Crops Table Twelve: Production Value By Crop ($1,000) PAGE 5 INDOOR CROP PRODUCTION FEEDING THE FUTURE MARCH 2015
.")
7 INDOOR CROP PRODUCTION FEEDING THE FUTURE MARCH 2015

8 A An Introduction to Indoor Agriculture

9 A. AN INTRODUCTION TO INDOOR AGRICULTURE Between 1930 and 2000, United States agricultural output quadrupled while the United States Department of Agriculture s (USDA) index of aggregate inputs (land, labor, capital, and other materials) remained essentially unchanged. 1 The primary driver of increased productivity has been technological progress, fueled by rapid improvements in irrigation techniques, development of synthetic nitrogen fertilizers, widespread use of pesticides, advanced plant breeding, and a host of other innovations. Indoor Agriculture, one such family of technologies, has received increasing attention over the past decade for its ability to supplement food systems in a sustainable manner. Businesses have started tackling the challenges of year-round local food production by designing and deploying systems impervious to weather and other outdoor environmental conditions. Indoor production of crops is nothing new; the foundations of modern greenhouses date back to Roman times as is shown in diagram one over page. Since the creation of key enabling technologies in the 1960s, the greenhouse industry has grown to be a signi icant part of the US produce supply chain and greenhousegrown vegetables are prevalent in all national supermarket chains. Insulating themselves from the outside environment, these farms extend the growing season beyond the limits of conventional agriculture. The fresh tomato industry, for example, has experienced rapid transformation over the past twenty years as greenhouse-grown on-vine varieties of tomato have captured market share from traditional outdoor growers and foreign import markets during winter months. A new wave of innovation has recently emerged that augments traditional greenhouse technologies by extending wider controls over the variables involved with the growing of plants including light, water, carbon dioxide, air temperature, nutrients, and a variety of other factors. These systems are predominately soilless, instead using hydroponic, aquaponic and aeroponic growing techniques to facilitate plant growth. Hydroponic systems work by submerging plant roots in a closed-loop recirculating water system illed with dissolved essential minerals and nutrients. Aeroponic systems are similar in concept, delivering water and essential nutrients in a mist to increase water ef iciency and expedite plant growth. Aquaponics is a coupling of hydroponic plant growing methods with conventional aquaculture. The burgeoning industry is referred to by a number of different names: closed loop systems, Controlled Environment Agriculture (CEA), plant factories (a common term in Asia in particular), protected environment agriculture, soilless growing, urban agriculture, vertical farms. For the purposes of this paper, we use the term indoor agriculture to refer to the growing of produce using hydroponic and aeroponic technologies within greenhouses, warehouses and containers. It is an intentionally broad de inition intended to encompass the full range of soilless growing techniques and environments, from the most basic greenhouse to fully automated, remotely controlled, clean room systems. 1 US Agriculture in the Twentieth Century, Bruce Gardner, University of Maryland, Economic History Association MARCH 2015 PAGE 8

10 DIAGRAM ONE: INDOOR AGRICULTURE INDUSTRY TIMELINE Development of greenhouse industry for instance 1550 > 1st greenhouse at a botanical garden built at Padua, Italy 1720 > 1st greenhouse with glass on all four sides built in Boston, which later becomes greenhouse hub 1820 > 1st commercial greenhouse 1899 > Total greenhouse crops of 2,200 acres & $2.25mn in revenue US military uses hydroponics to supply troops in Paci ic & in Japan post war 1946 > 54 acre hydroponic farm opens in Chofu, Japan Commercial hydroponic industry grows 1950s > Commercial hydroponics operations appear in France, UK, Germany, Israel, Spain, Sweden, US, USSR Increased scienti ic interest in hydroponics, NFT systems popularized & new substrates (coco coir, perlite etc) developed 1982 > Land Pavilion at EPCOT Center features hydroponics 1983 > First plant factory opens in Japan 1985 > NASA s BreadBoard project begins th th Centuries 1940s & 1950s 1980s FUTURE Biodiverse Systems Cost Reductions System Automation st Pre 1 Century DARK AGES Little progress until European Renaissance in 1300s-1500s 1970s 1930s 1960s 2010s High oil prices & pests cause many operations to fail Earliest experimentation with indoor growing BC > Hanging Gardens of Babylon contain terraced growing areas AD > Off-season cucumbers grown under "transparent stone" for the Roman Emperor Tiberius Extreme environment growing for wealthy patrons: e.g. hydroponics used by Pan Am Airlines to grow produce for passengers on Wake Island in the Paci ic Technical developments e.g. invention of the hose 1937 > Gericke at UC Berkeley coins term hydroponics Introduction of commercial plastics leads to cheaper growing systems & revival of hydroponics in 1970s e.g. van Wingerden builds double layer polyethylene greenhouse, nutrient ilm technique developed in UK Fall in solar panel & LED light prices, plus development of big data abilities, enables rejuvenation of indoor agriculture technology Sources: Miscellaneous including University of Arizona s Controlled Environment Agriculture Center, Shizuoka University, Newbean Capital analysis MARCH 2015 PAGE 9

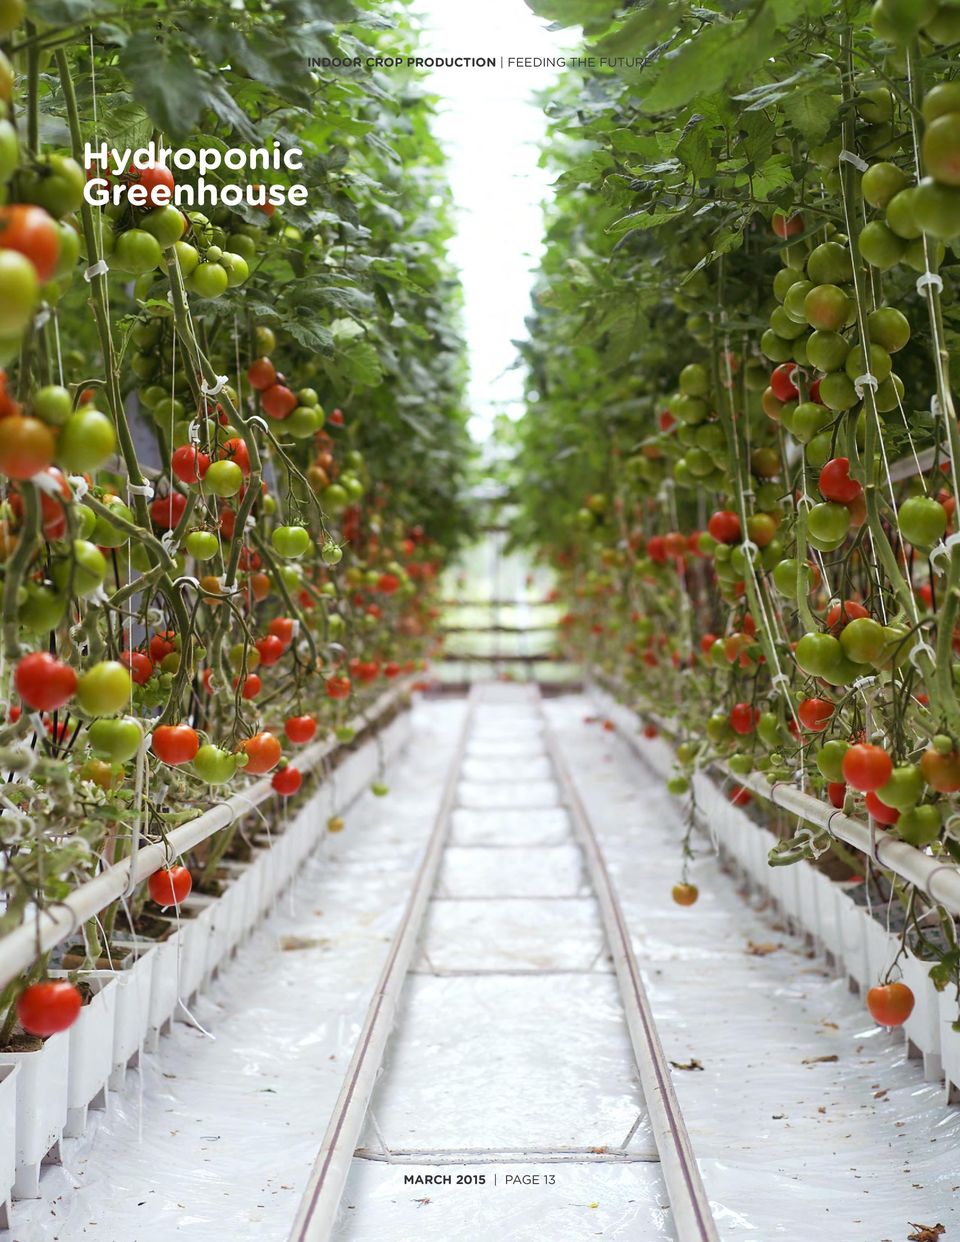
11 As can be seen from diagram two, the wide spectrum of indoor agriculture systems currently on the market can be summed up in four broad categories: Ÿ Ÿ Ÿ Ÿ Hydroponic Greenhouses like soil-based greenhouses, these greenhouses grow crops in a single layer. Transparent roofs are employed to utilize natural sunlight, augmented with supplemental lighting during dark days and off-peak growing seasons (i.e. winter). Warehouse Farms - industrial warehouse space is built or retro itted with hydroponic, aquaponic or aeroponic equipment and crops are grown vertically to achieve economies of scale. Arti icial lighting systems are used at all times. Container Farms standardized, self-contained growing units that employ vertical farming and arti icial lighting. In contrast to customdesigned warehouses, container farms strive for standardization. In Home Systems small standardized growing units for use by consumers in home settings. These focus more on convenience and design than on yield, and are not a focus of our paper. As of this writing, the indoor agriculture industry is still in its infancy. Its substantial market potential has been only marginally penetrated by traditional greenhouse hydroponics, which in 2013 had total revenues of $555mn 2, with large greenhouses across North America (see diagrams three and four). Though very little industry-wide data exists on other forms of indoor crop production, we estimate that there are no more than 50 businesses in the United States focused on commercial scale vertical farming, most with single farm locations and limited investment from institutional capital. Approximately 15 are currently farming at commercial scale that is with multiple large purchase contracts supporting a dedicated full time staff; their locations are shown in diagram ive. There were none as few as four years ago. Even the largest players are still solidifying business models and exploring strategies for rapid growth. But this is quickly changing, and the potential is large. We estimate an addressable US market size of $9bn, the calculation for which is in the appendix to this paper. The diverse group of indoor agriculture entrepreneurs is rapidly expanding, attracting those looking for new solutions, and inspired to meet the challenges of creating the food system of tomorrow. This paper will provide an overview of technologies, opportunities and market factors driving this industry forward, and outline ways in which this growth can be bolstered and accelerated. It will focus on commercial farms using hydroponic and aeroponic growing systems in the US. 2 "Hydroponic Crop Farming in the US, IBISWorld, January 2015 MARCH 2015 PAGE 10

12 DIAGRAM TWO: INDOOR AGRICULTURE INDUSTRY BY STRUCTURE HYDROPONIC GREENHOUSES VERTICAL FARMS CONTAINER FARMS IN HOME SYSTEMS Description Like soil-based greenhouses, these greenhouses grow crops in a single layer. Transparent roofs are employed to utilize natural sunlight, augmented with supplemental lighting during dark days and off-peak growing seasons (i.e. winter). Industrial space is constructed or retro itted with hydroponic, aquaponic or aeroponic equipment and crops are grown vertically to achieve economies of scale. Arti icial lighting systems are used at all times. Standardized, selfcontained growing units that employ vertical farming and arti icial lighting. In contrast to customdesigned warehouses, container farms strive for standardization. Systems targeted at consumers for small scale in home growth, whether as fridges in kitchens or as standalone units elsewhere in the home. Estimated No. of Cos in US Market 250 greenhouse vegetable companies, (not all hydroponic) further 20+ greenhouses under development 15 fully commercial, at least 30 more in active development 3 commercial, at least 4-5 others in process of commercializing e.g. Local Roots Farms At least 20 offering some form of inhome solution Company Examples Houwelings, Mastronarti, Nature Sweet, Village Farms, Windset Farmbox Greens, FarmedHere, Gar ield Produce Co, Green Sense Farms, PodPonics, Daiwa s agri-cube, Crop Box, FreightFarms, Growtainers, Pure Genius (formerly AquaHarvest) agrilution, Grove Labs, Modern Sprout, Urban Cultivator, Windowfarms Source: Miscellaneous public sources, greenhouse data from Cuesta Roble Consulting, Newbean Capital analysis MARCH 2015 PAGE 11

13 Vertical Farm MARCH 2015 PAGE 12

14 Hydroponic Greenhouse MARCH 2015 PAGE 13
15 DIAGRAM THREE: USA S LARGE GREENHOUSE COMPANIES CALIFORNIA 28% OF CAPACITY Large Greenhouse Operators: Hollandia, Houweling, Prime Time International, Quail Mountain Herbs SunSelect, Windset Farms ARIZONA 19% OF CAPACITY Large Greenhouse Operators: Nature Sweet 28% 19% TEXAS 14% OF CAPACITY Large Greenhouse Operators: Village Farms 14% REST OF USA 38% OF CAPACITY Large Greenhouse Operators: Backyard Farms, Coldwater Greenhouse (Mastronardi), Houweling, Intergrow, Sunblest Sunsetgrown (Mastronardi) 38% Source: Data from Cuesta Roble Consulting, analysis by Newbean Capital. Companies listed are those with greenhouses of 30 acres or more. Figures are for share of total US greenhouse acreage. DIAGRAM FOUR: CANADA S LARGE GREENHOUSE COMPANIES ONTARIO 65% OF CAPACITY Large Greenhouse Operators: Agriville Farms, AMCO Farms Clifford Produce, DiCiocco s Double Diamond Acres, Flavour Pict Produce, Great Northern Hydroponics Mucci Farms, Nature Fresh Farms Orangeline Farms, Platinum Produce Prism Farms, Red Sun Farms, Sabelli Farms, Smarty Brand, St. Davids Hydroponics, Sunset, Suntastic, Westmoreland Sales 65% BRITISH COLUMBIA 29% OF CAPACITY Large Greenhouse Operators: Canagro, Houweling, Merom Farms Millenium Paci ic GHs, Randhawa Farms, South Alder Greenhouses, Sunselect, Vander Meulen Greenhouse, Village Farms. West Coast Vegetables, Windset 29% QUEBEC 5% OF CAPACITY Large Greenhouse Operators: Les Serres du St Laurent 5% Source: Data from Cuesta Roble Consulting, analysis by Newbean Capital. Companies listed are those with greenhouses of 30 acres or more. Figures are for share of total Canadian greenhouse acreage, remaining 1% is operated by small companies MARCH 2015 PAGE 14

16 DIAGRAM FIVE: US & CANADIAN COMMERCIAL SCALE VERTICAL FARMS KEY US Vertical Farms SEATTLE, WA Farmbox Greens LOS ANGELES, CA Urban Produce NEW BUFFALO, MI Green Spirit Farms* PORTAGE, IN Green Sense Farms CHICAGO, IL Gar ield Produce Co The Plant BEDFORD PARK, IL FarmedHere NASHVILLE, TN Greener Roots ATLANTA, GA PodPonics* MONTREAL, QC Lufa Farms BIBLE HILL, NS TruLeaf MONCTON, NB Local By Atta NEWTON, MA Sky Vegetables BROOKLYN, NY Gotham Greens TAMPA, FL Uriah Urban Farms Canada Vertical Farms Rooftop Greenhouse Farms Source: Industry Reports *Green Spirit Farms has a second location in Medina, OH *PodPonics is based in Atlanta GA, and also has a farm in Dubai MARCH 2015 PAGE 15

17 GROWING CONSUMER DEMAND FOR LOCAL FOODS MARCH 2015 PAGE 16

18 B Primary Factors Driving Indoor Agriculture Growth

19 B. PRIMARY FACTORS DRIVING INDOOR AGRICULTURE GROWTH A primary driver of the indoor agriculture industry is its ability to satisfy the rapid growth in consumer demand for affordable, high quality, local produce. Strong growth in Natural and Organic segments over the past decade has established a precedent for premium, branded produce sold through a variety of sales channels. Distribution options have expanded for farmers as local delivery platforms have gained traction, such as New York online grocer Fresh Direct and online retailer Overstock.com s Farmers Market initiative. Indoor farms have historically struggled to compete on cost with traditional outdoor farms, but the recent rapid movement towards eating local, along with the introduction of new distribution channels, has provided the opportunity for high-margin indoor crops to establish a foothold in the market. 1. GROWING CONSUMER DEMAND FOR LOCAL FOODS As a category, local foods is rapidly gaining market share in the produce industry, growing from an estimated $1 billion in 2005 to nearly $7 billion last year with anticipated rapid category growth through The unmet need is large: 39 states in the nation grow fewer fruits and vegetables than they consume, as can be seen from diagram six below. DIAGRAM SIX: STATE FRUIT & VEGGIE PRODUCTION AS SHARE OF DEMAND (%) OREGON WASHINGTON NEVADA CALIFORNIA IDAHO ARIZONA UTAH MONTANA NORTH DAKOTA WYOMING SOUTH DAKOTA COLORADO NEW MEXICO NEBRASKA KANSAS MINNESOTA IOWA WISCONSIN MISSOURI ARKANSAS OKLAHOMA TEXAS ILLINOIS MISSISSIPPI LOUISIANA MICHIGAN TENNESSEE PENNSYLVANIA VERMONT NEW YORK OHIO INDIANA WEST VIRGINIA KENTUCKY GEORGIA ALABAMA SOUTH CAROLINA FLORIDA MAINE NEW HAMPSHIRE MASSACHUSETTS RHODE ISLAND CONNECTICUT NEW JERSY DELAWARE MARYLAND VIRGINIA NORTH CAROLINA HAWAII KEY Less than 50% 50% - 100% More than 100% ALASKA Source: New Venture Advisors LLC data, Newbean Capital analysis 3 USDA con irms farmers markets growth, sustainability, AgriNews, August 25, MARCH 2015 PAGE 18

20 The desire to eat local is not simply the product of effective marketing tactics by corporate executives. Decentralizing the supply chain and bringing production closer to the consumer can directly result in longer shelf life and better taste. Moreover, produce traditionally bred for resilience and the ability to withstand long-distance transport can instead be cultivated for unique size and lavor pro iles. According to a 2014 study conducted by the Hartman Group; local is emerging as a category poised to surpass both organic and natural as a symbol of transparency and trust. With its connotations of community, economy and environmental stewardship, local offers compelling narratives that include small-scale production and closer, reciprocal relationships with food producers. 4 The internet has given modern consumers information on farming practices, allowing insight into growing methods and an unprecedented opportunity to know your farmer. This demand for increased transparency in growing practices mirrors a broader trend of regulatory mandated traceability throughout the food chain. Growth has been seen across direct-to-consumer channels (farmers markets, community supported agriculture) and intermediated marketing channels (grocers, restaurants, regional distributors) alike. The number of farmers markets has more than doubled over the past decade, providing increased opportunities for consumers to buy local. 5 Small farms tend to favor direct-to-consumer channels as they offer logistic simplicity and higher per-unit margins. Large farms tend towards intermediated channels, contributing towards a more permanent presence of local food sections in retail outlets. 2. BUSINESSES HAVE LACKED YEAR-ROUND SOLUTIONS Commercial food buyers are eager to meet this increased consumer demand for local foods. For retailers, distributors, and food service professionals, the local category represents an opportunity to not only meet consumer demand, but simultaneously decrease food waste, increase unit margins and ultimately drive bottom lines. The USDA estimates that supermarkets lose $15bn annually in unsold fruits and vegetables. 6 A large portion of this loss is attributable to shrink (produce damaged during transport) and spoilage, which typically increases proportionately to food miles the distance food travels between farm and the end customer. Local produce offers an opportunity to mitigate shrink, as food is no longer required to travel hundreds, or even thousands of miles in transport between farm and store. Shelf life is simultaneously increased as the time between harvest and customer drops. Successive studies have shown that, in common with parts of the organic category, local produce can generally demand a price premium and increase per unit margins. For example, a 2014 Cornell University study 7 listed a 27% premium for locally produced strawberries in Ohio, a 27.5% one for local produce in South Carolina, and premiums for both tomatoes and strawberries in a New York county. 4 Organic & Natural 2014, Hartman Group 5 National Count of Farmers Market Directory Listing Graph: , USDA Agricultural Marketing Service 6 Wasted: How America Is Losing Up to 40 Percent of Its Food from Farm to Fork to Land ill, Dana Gunders, Natural Resources Defense Council, August A Case Study of Price Premiums for Local Foods in Tompkins County, New York, Tang, Gomez & Park, Charles H. Dyson School of Applied Economics and Management, Cornell University, November 2014 MARCH 2015 PAGE 19

21 As a result, many grocers have added or expanded category shelf space and are rapidly developing localsourced initiatives. Sourcing locally enables regional grocery chains to differentiate themselves from big box competitors, and it allows larger players to meet corporate social responsibility targets. For instance, in 2010, Walmart announced its Heritage Agriculture initiative whereby it aimed to double the amount of local produce that it sourced in the US. 8 In an article in the magazine The Atlantic, Walmart s Senior Director of Local and Sustainable Sourcing highlighted the change in it s sourcing for jalapeno peppers, where it says that it worked with existing suppliers to expand sourcing to 20 states, so lowering costs and carbon emissions while supporting local farmers. 9 In reality, most food buyers struggle to source any portion of their produce locally on a consistent basis. Seasonality makes year-round sourcing dif icult, if not impossible for many parts of the country where climate conditions, soil conditions and access to land limit the growth of high-quality produce for many months of the year. Small farms frequently cannot meet delivery schedules, volume demands, regulatory requirements, or other food safety certi ications imposed by large produce buyers. Instead they turn to direct-to-consumer channels where they sell at prices unattainable for much of the population. 3. INDOOR AGRICULTURE IS WELL PLACED TO BE A YEAR ROUND SOLUTION By curtailing the effects of weather and seasonality and enabling year-round crop production in all parts of the country, indoor growing techniques are uniquely situated to meet this market need. Several businesses are already using indoor agriculture technologies to drive pro its and grow indoor crops in a costcompetitive manner, whether it s to grow leafy greens during the winter when local produce would be otherwise unavailable, to grow a high value herb crop with particular lavor characteristics, or to substitute fresh barley for dry hay for animal fodder. The most enduring criticism of the industry has long been that it could not compete with ield grown produce, and this criticism still holds in some cases; few indoor farms can claim to produce lettuce at the same price as California s famed farming area, Salinas Valley in summer months, for instance. But ield parity is coming closer as the costs of indoor farm equipment falls; for example, LED light bulb prices fell by 24% between 2010 and 2012, and are forecast to halve by 2020.¹ 0 Moreover, this trend is just beginning. As is laid out below, indoor growers have an increasingly plentiful range of options when it comes to the technologies that they can employ to reach cost competitiveness. 8 Walmart Unveils Global Sustainable Agriculture Goals, Press Release, October 14, An Insider's Account of Walmart's Local Foods Program, The Atlantic, November 17, 2010 ¹ 0 Source: Enterprise LED Market Research for historic igures, Lux Research for forecasts MARCH 2015 PAGE 20
22 CASE STUDY: LUFA FARMS BRINGS LOCAL FOOD TO MONTREAL Montreal-based Lufa Farms was one of the pioneers of commercial urban agriculture, opening its irst hydroponic greenhouse in February Where most beginning farmers sell through local farmers markets or small-farmer-friendly grocers, such as Whole Foods Market, Lufa Farms instead decided to sell its produce direct to consumers. The approach allows Lufa Farms to capture the full return from its produce, but also poses the challenge of building a customer base one-by-one. The company s online platform offers products from local artisans alongside its own produce; customers select a weekly basket and collect it from one of dozens of locations in the city, whether a gym, of ice or neighborhood coffee shop. In effect, the company has created its own distribution platform, with the added bene it of vertical integration. In a recent interview, Lufa Farms co-founder Lauren Rathwell commented that; we ve made it to over 5,000 weekly subscribers, largely through word of mouth ¹ 1, though this downplays the role that customer service, technology and economies of scale have played in the company s success. A strong traditional and social media presence has doubtless helped Lufa Farms reach a wider audience. It has also made ordering and collecting baskets a simple and lexible process for consumers, for instance, by allowing customers to tailor baskets to their needs that week, rather than insisting that they sign up for an entire season s worth of produce as is the case with some community supported agriculture agreements. As the company grows over 40 vegetables, there s plenty of choice and this is supplemented by other locally-source products, such as cuts of meat and yogurt. Customers can pick up baskets from the venues that they visit as part of their daily routines, whether that s a coffee shop or a gym. The company has been at economic scale since the get-go, its inaugural Montreal greenhouse being capable of producing more than 150k lbs of produce annually. It opened a second, larger, greenhouse on the roof of a new building in October 2013 in conjunction with Dutch greenhouse manufacturer KUBO. In media reports, the company has discussed its intention to move into the US market with Boston likely to be the location of its irst state-side farm. Finally, the farms feature a good deal of technical sophistication, for example, utilizing cloud-based remote crop monitoring and disease management. It is this winning combination that has, in our opinion, allowed Lufa Farms to defy the odds in building a successful direct-to-consumer business. ¹ 1 #5 Lauren Rathwell: Co-Founder Lufa Farms, The Editorial, December 30, 2014 MARCH 2015 PAGE 21
23 INDOOR AGRICULTURE IS WELL PLACED TO BE A YEAR ROUND SOLUTION MARCH 2015 PAGE 22
24 C The Technologies Behind Indoor Crop Production
25 C. THE TECHNOLOGIES BEHIND INDOOR CROP PRODUCTION Indoor agriculture is a tech-industry at its core, driven by rapid iterations in the technologies critical to plant growth. New integrations of these systems continue to raise yields, increase growing ef iciencies, and lower costs associated with indoor crop production. We anticipate that the rate of technological advancement will continue to increase as the industry proves wide-scale economic viability. DIAGRAM SEVEN: HYDROPONIC SYSTEM COMPONENTS LED LIGHTING Diagram seven opposite shows the basic components of a generic hydroponic growing system, each of which are undergoing substantial technology upgrades. The most impactful areas of ongoing development are: FORM FACTOR AND GROWING SYSTEMS PLANTS IN GROWING SYSTEM RECIRCULATING WATER MIXED WITH NUTRIENTS CONTROL SYSTEM Current state: As previously highlighted, indoor crop production occurs in a wide variety of con igurations. Once an overall form factor is selected (greenhouse, warehouse, container, etc.), farmers can customize facilities with a variety of growing systems. These range from traditional Ebb & Flow and Nutrient Film Technique racking systems to ZipGrow vertical grow racks to even more novel concepts such as the pyramid-shaped growing system Pyramid Gardens or Volksgarden's circular Omega Gardens. Farms are most frequently customengineered and manufactured to meet speci ic geographic, and crop requirements. A farm's overall size, shape, materials used for construction, and crop spatial arrangements largely dictate upfront capital expenditures required to develop commercial-scale farms. What would help: We believe that we have reached a tipping point where the focus of development should switch from creating new and novel form factors to increasing the yield and substantially lowering the manufacturing and operating costs of existing solutions, so improving payback periods of indoor growing systems. Standardization and centralized manufacturing of forms would dramatically reduce costs. Form factor research and development should continue to be directed towards increasing output and lowering costs per cubic foot, for instance, by incorporating more automation and use of sensors into systems. MARCH 2015 PAGE 24
26 LIGHTING Current state: Indoor crop production systems, particularly warehouse and modular ones, rely on highly ef icient lights to augment or replace natural sunlight. Dramatic advances in LED technologies since 2010 have afforded indoor growers unprecedented lexibility to customize light spectrums as a method to expedite plant growth. Modern LEDs use primarily blue and red diodes to increase light ef iciency while minimizing temperature impacts within a growth chamber. Commercially available horticulture lights now allow for analogue control over light spectrums, encouraging unprecedented work in plant spectrum response and enabling growers to optimize light delivery to achieve ideal plant characteristics. What would help: Adaptive LEDs will allow light spectrums to be fully customized throughout the lifespan of a crop by adjusting, light intensity, spectrum composition (red vs. blue proportions), and light height (distance from plants) to ensure even spread across growth chambers. Upfront costs remain high, so lower prices, along with LEDs with more micromoles per joule (which translates to higher yields) would be bene icial. CONTROL SYSTEM HARDWARE Current state: Large-scale control systems are available from industry leaders, such as Priva and Argus Control Systems. These systems are employed by many large-scale greenhouse operators, designed into farms from inception to monitor and regulate lighting, CO2 levels, nutrient reservoirs, plumbing and a host of other variables. The systems are typically cost-prohibitive for small operations and beginning farmers. As a result, many practitioners are developing and leveraging proprietary control systems as a competitive advantage. What would help: Small-scale control systems with robust functionality would allow businesses on a shoestring budget to better automate their systems, increasing yields while decreasing labor costs. In the long run, user-friendly human machine interfaces should allow skilled tradesmen to customize prebuilt systems and horticulturalists to more precisely control the plant environment. As sensors decrease in cost and more data is collected from tightly controlled systems, big data methods such as linear programming, non-linear optimization, machine learning, arti icial neural networks, cluster analysis, and other arti icial intelligence techniques should be applied to optimize plant characteristics and yields. WATER CONSUMPTION Current state: Closed-loop indoor systems have been shown to reduce water usage by over 90% compared with traditional outdoor farms. Certain aeroponic farms and other advanced water recapture systems allow for 95% or more reduction in water usage, but can be prohibitively expensive to install and maintain. Examples of water management companies in the space include BioSafeSystems, Dosatron, and DRAMM. MARCH 2015 PAGE 25
27 What would help: Additional water puri ication, desalination, and atmospheric recapture techniques could be developed to increase potential farm site locations and ultimately drive off-grid lexibility for indoor farms. NUTRIENTS Current state: A wide range of nutrient solutions exists for home and commercial hydroponic systems that provide a wide of macro and micro molecules essential to plant health. Most large commercial players create their own nutrient mixes. What would help: Many nutrient solutions make claims regarding effects on plant formation, including increased speed of plant growth or taste, but these claims are predominately poorly documented and untested. In addition, microbiomes within soil are not well understood and future development could bring vast advantages to plant growth in hydroponic systems. SEEDS Current state: Most indoor farms use seeds bred to grow outdoors under highly volatile environmental conditions. Select crops particularly leafy greens, tomatoes, peppers and cucumbers have been bred for conventional greenhouses but limited data exists on performance under more-tightly controlled environment conditions. Larger growers operate their own seed development programs. What would help: Seed development and testing, to optimize growing qualities for indoor systems where conditions are tightly managed and traditional outdoor concerns (pests, drought, loods, high winds, extreme temperatures, etc.) are limited, would be helpful. Such development could also be instrumental in expanding the universe of crops that can be grown commercially in indoor systems. This development is likely to be slower than that for other system components mentioned here as seed development programs are long term by nature; greenhouse seed trials have been running since the 1970s, for instance. MARCH 2015 PAGE 26
28 CASE STUDY: THE RISE OF THE GREENHOUSE TOMATO The second largest in the world, the US tomato market bifurcates between those that are grown for processing (most of the market) and those that are destined for the fresh produce market. Tomatoes are grown both in the ield and in the greenhouse. Traditionally, Florida and California have been the largest US growers of outdoor tomatoes, with nearly two-thirds of total US fresh tomato acreage, a share that has been steady since the 1960s.¹ 2 DIAGRAM EIGHT: RETAIL TOMATO DOLLARS Undefined Field Grown Greenhouse Grown 35% 16% 49% Source: Village Farms Figures exclude Costco and BJs which are 100% Greenhouse retailers In its annual report, the Florida Tomato Committee, an industry advocacy group, noted that the greenhouse tomato sector appears to be on the rise but that no solid numbers were available. By 2004, greenhouse tomatoes were under 10% of total US supply, but by 2011, they were 40%, with a higher share in retail channels.¹ 3 The USDA s Economic Research Service attributes this rise to consumer demand for year-round supply, a growing diversity of tomato types/substitutes, and developing technologies.²⁰ The total market has also grown: US per capita fresh tomato consumption rose from under 15lb pa in 1985 to a peak of 20.6lb pa by 2010.¹ 4 Consumers have become accustomed to being able to purchase fresh produce year round, and to having abundant choices in grocery stores. The total number of all products (including packaged goods) in the average supermarket grew from an average of 8,948 in 1975 to almost 47,000 by 2008.²¹ Greenhouse-grown tomato major Village Farms offers 10 varieties, for instance. In the US, California is the dominant ield-grown tomato supplier in the summer, and Florida in the winter, with Mexican and Canadian imports ful illing surplus demand in the winter in particular. This de icit allowed greenhouse growers to gain a foothold in the market by, for instance, introducing tomatoes on the vine, which are now the most popular variety among consumers. At the same time, a 2013 University of Florida paper concluded that the improved yields in greenhouse production outweighed substantially higher costs, in turn rendering greenhouse based growing more pro itable than ield based production in some environments. 15 With continued improvements in greenhouse technology and falling US farmland acreage, the market expectation is that the greenhouse grown share of the market will continue to rise. ¹ 2 USDA Economic Research Service data 13 Protected-Culture Technology Transforms the Fresh-Tomato Market, USDA ERS, September 2013 ¹ 4 Food Marketing Institute igures 15 The Potential for Greenhouse Tomato Production Expansion in Florida, VanSickle, Cantliffe & Asci, Southern Agricultural Economics Association (SAEA) Annual Meeting, 3-5 February 2013 MARCH 2015 PAGE 27
29 INDOOR CROP PRODUCTION ENABLES YEAR-ROUND GROWING BY MITIGATING THE EFFECTS OF WEATHER. MARCH 2015 PAGE 28
30 D Secondary Benefits of Indoor Crop Production
31 D. SECONDARY BENEFITS OF INDOOR CROP PRODUCTION It is clear that consumer demand, business demand, and technologies are converging to create an opportunity for rapid expansion of indoor crop production. To expedite this growth and win broader public opinion, the indoor agriculture industry should communicate its secondary bene its as well. Year Round Growing Indoor crop production enables year-round growing by mitigating the effects of weather. This control over crop timing allows indoor farms to increase margins by growing off-market and selling against outdoor seasonality. In other words, indoor farms are uniquely capable of growing traditional summer crops during the winter and winter crops during the summer. Further, indoor farming techniques greatly reduce production variability at the farm level and enable unprecedented accuracy in cost forecasting. For consumers, this allows consistent availability and quality of produce throughout the year in all parts of the country, and for produce buyers accustomed to inconsistent supplies and volatile market prices, DIAGRAM NINE: NON-ORGANIC GREEN LEAF LETUCE PRICES BY HUB, $/CARTON 24S, NOV 2012-NOV 2014 BOSTON DETROIT $38 SAN FRANCISCO $36 $16 $8 LOS ANGELES $33 $13 $9 CHICAGO $33 $16 $34 $10 $16 $5 PHILADEPHIA ST. LOUIS $36 $38 $16 $9 $17 $12 ATLANTA $18 $12 NEW YORK $38 $16 $6 BALTIMORE $38 $19 $13 DALLAS $40 $18 $10 $58 $27 $13 MIAMI $38 $20 $15 KEY HIGH AVG LOW Source: USDA Economic Research Service data, Newbean Capital analysis MARCH 2015 PAGE 30
32 it represents a potential paradigm shift as the practice becomes more common. Suddenly produce buyers do not need to aggregate from multiple farms on an ongoing basis to hedge against volatility; as is shown in diagram nine below,prices vary by as much as 300% across a year for a crop as commonplace as lettuce. Instead, longer-term contracts with ixed pricing and volumes can be instigated. In this scenario both sides bene it. Farms receive guarantees that their product will be sold and have greater insight into revenue metrics for strategic planning purposes. Produce buyers can accurately forecast costs, while saving time and energy by avoiding the spot markets. Certain produce buyers who have traditionally relied upon distributors to smooth supply may have greater lexibility to deal direct with farmers, increasing pro it margins on both sides. Flexibility of Farm Locations Indoor systems can, in theory, be located anywhere including retailer parking lots, urban rooftops, vacant lots, and rural locations. For businesses seeking to it into existing transportation infrastructure, farms can be located adjacent to cold-storage warehouses or end points of consumption. Co-location with customers reduces transportation costs, minimizes spoilage and mitigates quality degradation while extending product shelf life for consumers. Potential Health Bene its USDA s Economic Research Service estimates that 23.5mn Americans live in food deserts, of which 13.5mn are low income. 16 These individuals lack both regular access to nutritious foods and the ability to afford fresh produce. Enabling mass crop production in urban environments allows for unique approaches to solving food access issues because it changes the unfavorable economics of last-mile distribution logistics. By placing indoor farms inside of food deserts, the cost of shipping produce is greatly reduced or eliminated entirely. These savings can be passed on to customers, ultimately lowering produce prices to levels affordable even in low-income communities. The Farmery, for example, is a prototype facility that acts simultaneously as a farm and a retail outlet in downtown Durham, NC. Other creative solutions, such as the Arcadia Center for Sustainable Food & Agriculture s Mobile Markets, a 28 farm stand on wheels, provide relevant partnership opportunities and areas for blue ocean market expansion. Water Ef iciency Is Important Record drought conditions are currently occurring in key agricultural regions, speci ically the largest in the U.S., California. If drought conditions persist as is as is predicted due to the changing climate, there will be continuing pressure to reduce agricultural production and fallow some land. Indoor agriculture can take up some or all of this slack in production, in regions like California, using only a fraction of the water, and continuing to operate even under severe drought conditions. 16 Food Deserts, USDA Economic Research Service MARCH 2015 PAGE 31
33 DIAGRAM TEN: YEAR ON YEAR CHANGES IN INCIDENCE OF LABORATORY-CONFIRMED BACTERIAL INFECTIONS, US, 2013 YEAR ON YEAR CHANGES IN INCIDENCE OF LABORATORY-CONFIRMED BACTERIAL INFECTIONS, US, 2013 Yersinia Vibrio STEC* O157 STEC* Non-O157 Shigella Salmonella Listeria Campylobacter -15% -10% -5% 0% 5% 10% 15% 20% 25% 30% 35% Source: United States Centers for Disease Control and Prevention, data is most recent available * Shiga toxin-producing Escherichia coli Increased Food Safety and Traceability Growing indoors in soilless systems inherently limits exposure to many soil-borne pathogens that may have caused E. Coli, salmonella, and in turn produce recalls in recent years. This is of particular bene it during a time when the incidence and awareness of food borne illnesses are rising. Some indoor farms are creating clean-room environments where workers wear special gloves, hats, and uniforms to prevent outside pathogens from infecting crops. Pests are much easier to keep out, and manure use is all-but eliminated. Should a recall prove necessary, indoor systems are often able to track individual plant variables throughout the growth cycle, allowing farmers to quickly identify the source of contamination and isolate any affected products. The overall result is cleaner and safer produce for the end-consumer. MARCH 2015 PAGE 32
34 CASE STUDY: FEEDING A GRASS-FED HERD IN A TIME OF DROUGHT TomKat Ranch is an eighteen hundred acre cattle ranch in Pescadero, CA which acts as a learning laboratory for animal agriculture focused on climate stability, nature s bene its, healthy food, biodiversity, and vibrant community. It houses several businesses, including LeftCoast GrassFed, a grass-fed beef company that sells at local farmers market in order to educate consumers about the bene its of grass-fed meat. As for any cattle operation, feed is a large component of LeftCoast GrassFed s costs, and became a particular concern when hay fodder was in short supply this past summer. Owing to California s drought and lower surface water allocations to farmers, hay prices rose 35% year on year by May 2014 to $320 per ton. 17 Naturally, both pasture and hay crops require suf icient water for optimal growth. Worse, hay was coming to TomKat from ever further a ield: we were paying $100 per ton just for transportation in some cases comments Wendy Millet, TomKat s ranch director. LeftCoast GrassFed holds Animal Welfare Approved and American GrassFed Association certi ications, so traceability is extremely important to the venture, and its values lead it to seek locally sourced fodder wherever possible. The answer came in the form of a self-made fodder machine from Symbi Biological, which raises insect protein for an aquaponics operation on TomKat Ranch. The system consists of three racks of growing trays, in which the ranch grows fresh barley. "The cattle really liked it once they figured out what it was" Wendy adds "and it ended up being cheaper than importing hay". There are also ready-made solutions on the market, such as that from Fodder Solutions, an Australian technology company that distributes its hydroponic fodder system globally and is used by a ranch neighboring TomKat. The product consists of a truck containing up to 108 hydroponic growing trays in six layers, which rotate as the crop grows such that a portion of the fodder can be harvested and planted daily. The unit can be driven to the cattle feed stations, and barley takes only six days to grow from seedling to feed in the climate-controlled growroom. The seeds grow on mats that are edible by cattle, so there s no waste from the system. It allows the ranch to precisely control inputs into the feed, and the largest unit uses under 300 gallons a day of water. For a ranch that is careful to track such metrics, it also reduces feed miles and waste, for instance, hay stored outside can develop mold and lose protein quality in times of heavy rain as was seen in Montana in September 2014 for example. Traditional fodder growers have often been dismissive of hydroponically grown fodder, citing the higher moisture content contained in young hydroponically grown barley and lower dry matter (the part of feed that contains the nutrients that animals need) content in hydroponically grown fodder. They argue that this renders hydroponic fodder extremely expensive on a like-for-like basis, but their analysis has been challenged by some ranchers, for instance, a 2005 paper by Australian rancher Joseph Mooney 18 argued that the cost to fatten a beast on hydroponic fodder over a day period is around a sixth of the cost of fattening the beast on grain. We anticipate that fodder systems will become more ef icient and economic as LED lighting and other technologies develop, and as hay prices remain at risk from drought (NOAA 19 forecasts continued drought for California in 2015), it seems likely that ranches such as TomKat Ranch will continue to ind a place for hydroponic fodder as a supplement to traditional animal feeds. 17 USDA Hay Report, comparing May 24, 2013 and May 23, 2014 prices for Sacramento Valley FOB Supreme Alfafa 18 Growing Cattle Feed Hydroponically, Joseph Mooney, July 2005, Australian Nuf ield Farming Scholarship Association 19 National Oceanic and Atmospheric Administration, December 2014 forecast MARCH 2015 PAGE 33
Remake farming for modern cities
 Lawrence Berkeley National Laboratory Scalable Sustainable affordable Breakthrough technologies to Remake farming for modern cities LBNL in partnership with ITT Institute for Globally Transformative Technologies
Three-Year Moving Averages by States % Home Internet Access
 Three-Year Moving Averages by States % Home Internet Access Alabama Alaska Arizona Arkansas California Colorado Connecticut Delaware Florida Georgia Hawaii Idaho Illinois Indiana Iowa Kansas Kentucky Louisiana
Public School Teacher Experience Distribution. Public School Teacher Experience Distribution
 Public School Teacher Experience Distribution Lower Quartile Median Upper Quartile Mode Alabama Percent of Teachers FY Public School Teacher Experience Distribution Lower Quartile Median Upper Quartile
Impacts of Sequestration on the States
 Impacts of Sequestration on the States Alabama Alabama will lose about $230,000 in Justice Assistance Grants that support law STOP Violence Against Women Program: Alabama could lose up to $102,000 in funds
2014 INCOME EARNED BY STATE INFORMATION
 BY STATE INFORMATION This information is being provided to assist in your 2014 tax preparations. The information is also mailed to applicable Columbia fund non-corporate shareholders with their year-end
Englishinusa.com Positions in MSN under different search terms.
 Englishinusa.com Positions in MSN under different search terms. Search Term Position 1 Accent Reduction Programs in USA 1 2 American English for Business Students 1 3 American English for Graduate Students
BUSINESS DEVELOPMENT OUTCOMES
 BUSINESS DEVELOPMENT OUTCOMES Small Business Ownership Description Total number of employer firms and self-employment in the state per 100 people in the labor force, 2003. Explanation Business ownership
recovery: Projections of Jobs and Education Requirements Through 2020 June 2013
 recovery: Projections of Jobs and Requirements Through June 2013 Projections of Jobs and Requirements Through This report projects education requirements linked to forecasted job growth by state and the
TOTAL AVERAGE QUALIFIED PAID & NONPAID CIRCULATION 392,372
 7 FARM PUBLICATION Publisher s Statement 6 months ended December 31, 2015 Subject to Audit Field Served: Serving the business, production and personal needs of America s farm families. TOTAL AVERAGE QUALIFIED
Workers Compensation State Guidelines & Availability
 ALABAMA Alabama State Specific Release Form Control\Release Forms_pdf\Alabama 1-2 Weeks ALASKA ARIZONA Arizona State Specific Release Form Control\Release Forms_pdf\Arizona 7-8 Weeks by mail By Mail ARKANSAS
NON-RESIDENT INDEPENDENT, PUBLIC, AND COMPANY ADJUSTER LICENSING CHECKLIST
 NON-RESIDENT INDEPENDENT, PUBLIC, AND COMPANY ADJUSTER LICENSING CHECKLIST ** Utilize this list to determine whether or not a non-resident applicant may waive the Oklahoma examination or become licensed
High Risk Health Pools and Plans by State
 High Risk Health Pools and Plans by State State Program Contact Alabama Alabama Health 1-866-833-3375 Insurance Plan 1-334-263-8311 http://www.alseib.org/healthinsurance/ahip/ Alaska Alaska Comprehensive
Q1 2009 Homeowner Confidence Survey. May 14, 2009
 Q1 2009 Homeowner Confidence Survey Results May 14, 2009 The Zillow Homeowner Confidence Survey is fielded quarterly to determine the confidence level of American homeowners when it comes to the value
MAINE (Augusta) Maryland (Annapolis) MICHIGAN (Lansing) MINNESOTA (St. Paul) MISSISSIPPI (Jackson) MISSOURI (Jefferson City) MONTANA (Helena)
 Maryland (Annapolis) MICHIGAN (Lansing) MINNESOTA (St. Paul) MISSISSIPPI (Jackson) MISSOURI (Jefferson City) MONTANA (Helena)") HAWAII () IDAHO () Illinois () MAINE () Maryland () MASSACHUSETTS () NEBRASKA () NEVADA (Carson ) NEW HAMPSHIRE () OHIO () OKLAHOMA ( ) OREGON () TEXAS () UTAH ( ) VERMONT () ALABAMA () COLORADO () INDIANA
HAWAII () IDAHO () Illinois () MAINE () Maryland () MASSACHUSETTS () NEBRASKA () NEVADA (Carson ) NEW HAMPSHIRE () OHIO () OKLAHOMA ( ) OREGON () TEXAS () UTAH ( ) VERMONT () ALABAMA () COLORADO () INDIANA
Hail-related claims under comprehensive coverage
 Bulletin Vol. 29, No. 3 : April 2012 Hail-related claims under comprehensive coverage Claims for hail damage more than doubled in 2011 compared with the previous three years. Hail claims are primarily
The Obama Administration and Community Health Centers
 The Obama Administration and Community Health Centers Community health centers are a critical source of health care for millions of Americans particularly those in underserved communities. Thanks primarily
US Department of Health and Human Services Exclusion Program. Thomas Sowinski Special Agent in Charge/ Reviewing Official
 US Department of Health and Human Services Exclusion Program Thomas Sowinski Special Agent in Charge/ Reviewing Official Overview Authority to exclude individuals and entities from Federal Health Care
State Pest Control/Pesticide Application Laws & Regulations. As Compiled by NPMA, as of December 2011
 State Pest Control/Pesticide Application Laws & As Compiled by NPMA, as of December 2011 Alabama http://alabamaadministrativecode.state.al.us/docs/agr/mcword10agr9.pdf Alabama Pest Control Alaska http://dec.alaska.gov/commish/regulations/pdfs/18%20aac%2090.pdf
Chex Systems, Inc. does not currently charge a fee to place, lift or remove a freeze; however, we reserve the right to apply the following fees:
 Chex Systems, Inc. does not currently charge a fee to place, lift or remove a freeze; however, we reserve the right to apply the following fees: Security Freeze Table AA, AP and AE Military addresses*
Real Progress in Food Code Adoption
 Real Progress in Food Code Adoption The Association of Food and Drug Officials (AFDO), under contract to the Food and Drug Administration, is gathering data on the progress of FDA Food Code adoptions by
Vertical Market Selling Guide. Pet Grooming
 Vertical Market Selling Guide Pet Grooming Purpose This guide is provided to you at no charge to create awareness for the needs of a payment terminal solution within a specific vertical market that may
National Heavy Duty Truck Transportation Efficiency Macroeconomic Impact Analysis
 National Heavy Duty Truck Transportation Efficiency Macroeconomic Impact Analysis Prepared for the: Union of Concerned Scientists 2397 Shattuck Ave., Suite 203 Berkeley, CA 94704 Prepared by: Marshall
LexisNexis Law Firm Billable Hours Survey Top Line Report. June 11, 2012
 LexisNexis Law Firm Billable Hours Survey Top Line Report June 11, 2012 Executive Summary by Law Firm Size According to the survey, we found that attorneys were not billing all the time they worked. There
Paid Subscriptions Verified Subscriptions Single Copy Sales. Paid & Verified. Verified. Digital Issue
 Technology Review MAGAZINE Publisher s Statement 6 months ended June 30, 2015 Subject to Audit Field Served: TECHNOLOGY REVIEW serves emerging technology and business markets. Published by Frequency: Massachusetts
How to Become a Fashion Model - Harper's Magazine, India
 MAGAZINE Publisher s Statement 6 months ended June 30, 2015 Subject to Audit Field Served: The 165-year old monthly journal of politics, economics, society, travel, culture and nature, as well as essays
Question for the filing office of Texas, Re: the Texas LLC act. Professor Daniel S. Kleinberger. William Mitchell College of Law, Minnesota
 Topic: Question by: : Question for the filing office of Texas, Re: the Texas LLC act Professor Daniel S. Kleinberger William Mitchell College of Law, Minnesota Date: March 18, 2012 Manitoba Corporations
Net-Temps Job Distribution Network
 Net-Temps Job Distribution Network The Net-Temps Job Distribution Network is a group of 25,000 employment-related websites with a local, regional, national, industry and niche focus. Net-Temps customers'
The Week. Field Served: A comprehensive, balanced distillation of national and international news, opinions and ideas.
 The Week MAGAZINE Publisher s Statement 6 months ended June 30, 2014 Subject to Audit Field Served: A comprehensive, balanced distillation of national and international news, opinions and ideas. Published
Fuel Taxes: December 2012. A State-by-State Comparison
 Fuel Taxes: A -by- Comparison December 2012 The 18th Amendment to the Washington Constitution dedicates motor fuel tax collections to highway purposes. Strategic Planning and Finance Number of s Fuel
2009-10 STATE AND LOCAL GOVERNMENT TAX AND REVENUE RANKINGS. By Jacek Cianciara
 2009-10 STATE AND LOCAL GOVERNMENT TAX AND REVENUE RANKINGS By Jacek Cianciara Wisconsin Department of Revenue Division of Research and Policy December 12, 2012 TABLE OF CONTENTS Key Findings 3 Introduction
Low-Profit Limited Liability Company (L3C) Date: July 29, 2013. [Low-Profit Limited Liability Company (L3C)] [July 29, 2013]
![Low-Profit Limited Liability Company (L3C) Date: July 29, 2013. [Low-Profit Limited Liability Company (L3C)] [July 29, 2013]](/thumbs/27/11522934.jpg "Low-Profit Limited Liability Company (L3C) Date: July 29, 2013. [Low-Profit Limited Liability Company (L3C)] [July 29, 2013]") Topic: Question by: : Low-Profit Limited Liability Company (L3C) Kevin Rayburn, Esq., MBA Tennessee Date: July 29, 2013 Manitoba Corporations Canada Alabama Alaska Arizona Arkansas California Colorado
Topic: Question by: : Low-Profit Limited Liability Company (L3C) Kevin Rayburn, Esq., MBA Tennessee Date: July 29, 2013 Manitoba Corporations Canada Alabama Alaska Arizona Arkansas California Colorado
Job Market Intelligence:
 March 2014 Job Market Intelligence: Report on the Growth of Cybersecurity Jobs Matching People & Jobs Reemployment & Education Pathways Resume Parsing & Management Real-Time Jobs Intelligence Average #
MAGAZINE Publisher s Statement 6 months ended December 31, 2014 Subject to Audit
 MAGAZINE Publisher s Statement 6 months ended December 31, 2014 Subject to Audit Field Served: GARDEN & GUN is a dynamic southern lifestyle magazine that captures the soul of the South, the sporting culture,
SAMPLE REPORT. Competitive Landscape for Wholesale Distribution: Electronics $295.95 RESEARCHED & PRODUCED BY:
 $295.95 2015 Competitive Landscape for Wholesale Distribution: Electronics ANNUAL MARKET DATA, TRENDS AND ANALYSIS FOR THE NORTH AMERICAN WHOLESALE DISTRIBUTION INDUSTRY 2015 by Gale Media, Inc. All rights
Percent change. Rank Most expensive states Average expenditure Rank Least expensive states Average expenditure
 Page 1 of 7 Auto Insurance AAA s 2010 Your Driving Costs study found that the average cost to own and operate a sedan rose by 4.8 percent to $8,487 per year, compared with the previous year. Rising fuel,
STATE DATA CENTER. District of Columbia MONTHLY BRIEF
 District of Columbia STATE DATA CENTER MONTHLY BRIEF N o v e m b e r 2 0 1 2 District Residents Health Insurance Coverage 2000-2010 By Minwuyelet Azimeraw Joy Phillips, Ph.D. This report is based on data
States Ranked by Alcohol Tax Rates: Beer (as of March 2009) Ranking State Beer Tax (per gallon)
 Ranking State Beer Tax (per gallon)") States Ranked by Alcohol Tax Rates: Beer (as of March 2009) Ranking State Beer Tax (per gallon) Sales Tax Applied 1 Wyoming $0.02 4% 2 4 8 10 Missouri $0.06 4.225% Wisconsin $0.06 5% Colorado $0.08 2.9%
States Ranked by Alcohol Tax Rates: Beer (as of March 2009) Ranking State Beer Tax (per gallon) Sales Tax Applied 1 Wyoming $0.02 4% 2 4 8 10 Missouri $0.06 4.225% Wisconsin $0.06 5% Colorado $0.08 2.9%
Real Progress in Food Code Adoption
 Real Progress in Food Code Adoption August 27, 2013 The Association of Food and Drug Officials (AFDO), under contract to the Food and Drug Administration, is gathering data on the progress of FDA Food
COMMERCIAL FINANCE ASSOCIATION. Annual Asset-Based Lending and Factoring Surveys, 2008
 COMMERCIAL FINANCE ASSOCIATION Annual Asset-Based Lending and Factoring Surveys, 2008 Non-Member Edition May 6, 2009 R.S. Carmichael & Co., Inc. Commercial Finance Association 70 West Red Oak Lane (4 th
2016 Individual Exchange Premiums updated November 4, 2015
 2016 Individual Exchange Premiums updated November 4, 2015 Within the document, you'll find insights across 50 states and DC with available findings (i.e., carrier participation, price leadership, gross
FACT SHEET. Language Assistance to Persons with Limited English Proficiency (LEP).
.") FACT SHEET Office of Civil Rights Washington, D.C. 20201 (202) 619-0403 Language Assistance to Persons with Limited English Proficiency (LEP). To ensure that persons with limited English skills can effectively
FACT SHEET Office of Civil Rights Washington, D.C. 20201 (202) 619-0403 Language Assistance to Persons with Limited English Proficiency (LEP). To ensure that persons with limited English skills can effectively
14-Sep-15 State and Local Tax Deduction by State, Tax Year 2013
 14-Sep-15 State and Local Tax Deduction by State, Tax Year 2013 (millions) deduction in state dollars) claimed (dollars) taxes paid [1] state AGI United States 44.2 100.0 30.2 507.7 100.0 11,483 100.0
American C.E. Requirements
 American C.E. Requirements Alaska Board of Nursing Two of the following: 30 contact hours 30 hours of professional nursing activities 320 hours of nursing employment Arizona State Board of Nursing Arkansas
Age and Health Insurance: Pricing Out the Decades of Adult Life Looking at the difference in health insurance premiums between ages 20 and 60.
 Age and Health Insurance: Pricing Out the Decades of Adult Life Looking at the difference in health insurance premiums between ages 20 and 60. Contents 2 3 3 4 4 5 6 7 7 8 9 10 11 12 13 14 Table of Contents
Venture Capital Tax Credits By State
 Venture Capital Tax Credits By State Alabama States Credit Amount Eligibility Notes Alaska Arizona Angel Investment Bill (Direct Tax Credit available for investments made after June 30, 2006, for tax years
MAGAZINE Publisher s Statement 6 months ended June 30, 2015 Subject to Audit
 MAGAZINE Publisher s Statement 6 months ended June 30, 2015 Subject to Audit Field Served: General News. Published by Time Inc. Frequency: 52 times/year 1. TOTAL AVERAGE PAID & VERIFIED CIRCULATION : (See
State Corporate Income Tax Rates As of December 31, 2006 (2006's noteworthy changes in bold italics)
") State Corporate Income Tax Rates As of December 31, 2006 (2006's noteworthy changes in bold italics) State Tax Rates and Brackets Special Rates or Notes Alabama 6.50% Federal deductibility Alaska 1.0%
State Corporate Income Tax Rates As of December 31, 2006 (2006's noteworthy changes in bold italics) State Tax Rates and Brackets Special Rates or Notes Alabama 6.50% Federal deductibility Alaska 1.0%
University of Massachusetts School of Law: Career Services Office State-By-State Online Job Search Resources
 University of Massachusetts School of Law: Career Services Office State-By-State Online Job Search Resources Alabama http://www.alabar.org - Alabama Bar Association http://www.judicial.state.al.us - Alabama
ANTHONY P. CARNEVALE NICOLE SMITH JEFF STROHL
 State-Level Analysis HELP WANTED PROJECTIONS of JOBS and EDUCATION REQUIREMENTS Through 2018 JUNE 2010 ANTHONY P. CARNEVALE NICOLE SMITH JEFF STROHL Contents 1 Introduction 3 U.S. Maps: Educational concentrations
Licensure Resources by State
 Licensure Resources by State Alabama Alabama State Board of Social Work Examiners http://socialwork.alabama.gov/ Alaska Alaska Board of Social Work Examiners http://commerce.state.ak.us/dnn/cbpl/professionallicensing/socialworkexaminers.as
County - $0.55/$500 - $.75/$500 depending on +/- 2 million population 0.11% - 0.15% Minnesota
 22-Apr-13 State Deed Transfer and Mortgage Tax Rates, 2012 Alabama State Tax Description Transfer Fee Rate Deeds $0.50/$500 0.10% Mortgages $0.15/$100 0.15% Alaska Arizona $2 fee per deed or contract Flat
Data show key role for community colleges in 4-year
 Page 1 of 7 (https://www.insidehighered.com) Data show key role for community colleges in 4-year degree production Submitted by Doug Lederman on September 10, 2012-3:00am The notion that community colleges
In-state Tuition & Fees at Flagship Universities by State 2014-15 Rank School State In-state Tuition & Fees Penn State University Park Pennsylvania 1
 In-state Tuition & Fees at Flagship Universities by State 2014-15 Rank School State In-state Tuition & Fees Penn State University Park Pennsylvania 1 $18,464 New New Hampshire 2 Hampshire $16,552 3 Vermont
State-Specific Annuity Suitability Requirements
 Alabama Alaska Arizona Arkansas California Colorado Connecticut Delaware District of Columbia Effective 10/16/11: Producers holding a life line of authority on or before 10/16/11 who sell or wish to sell
Environmentally Friendly Technology
 During these tough economic times, companies are looking for ways to save. This and the corporate push for greener technology have influenced the surge in thin client deployment. This whitepaper explains
We do require the name and mailing address of each person forming the LLC.
 Topic: LLC Managers/Members Question by: Jeff Harvey : Idaho Date: March 7, 2012 Manitoba Corporations Canada Alabama Alaska Arizona Arkansas California Colorado Arizona requires that member-managed LLCs
The American Quarter Horse Journal
 MAGAZINE Publisher s Statement Six months ended December 31, 2013 Subject to Audit The American Quarter Horse Journal Field Served: Equine-News, stories and pictures regarding the breeding and performance
statistical review Foundation for Community Association Research For U.S. Homeowners Associations, Condominium Communities and Housing Cooperatives
 Foundation for Community Association Research statistical review For U.S. Homeowners Associations, Condominium Communities and Housing Cooperatives NATIONAL AND STATE DATA 2012 323,600total U.S. associations
MAGAZINE Publisher s Statement 6 months ended June 30, 2015 Subject to Audit
 MAGAZINE Publisher s Statement 6 months ended June 30, 2015 Subject to Audit Field Served: TRAVEL + LEISURE propels its readers to travel now, travel smarter, and travel often. T+L fuses reporting on style,
MINIMUM CAPITAL & SURPLUS AND STATUTORY DEPOSITS AND WHO THEY PROTECT. By: Ann Monaco Warren, Esq. 573.634.2522
 MINIMUM CAPITAL & SURPLUS AND STATUTORY DEPOSITS AND WHO THEY PROTECT By: Ann Monaco Warren, Esq. 573.634.2522 With the spotlight on the financial integrity and solvency of corporations in the U.S. by
Benefits of Selling WorkLife 65
 PruTerm WorkLife 65 SM LEARN ABOUT THE PRODUCT AND MARKET Benefits of Selling WorkLife 65 Pru s new and innovative term product will resonate with your clients. WorkLife 65 is a new and innovative term
State Tax Information
 State Tax Information The information contained in this document is not intended or written as specific legal or tax advice and may not be relied on for purposes of avoiding any state tax penalties. Neither
How To Regulate Rate Regulation
 Rate Regulation Introduction Concerns over the fairness and equity of insurer rating practices that attempt to charge higher premiums to those with higher actual and expected claims costs have increased
July 2012 (1) States With Negative Growth 22 States With Positive Growth 25
 States With Negative Growth 22 States With Positive Growth 25") Respondent Coverage: 100% July 2012 Current Month Current Month New England 9.5% Connecticut -3.3% Maine 3.6% Massachusetts 24.1% New Hampshire -0.1% Rhode Island 13.3% Vermont -0.3% Middle Atlantic -3.5%
Respondent Coverage: 100% July 2012 Current Month Current Month New England 9.5% Connecticut -3.3% Maine 3.6% Massachusetts 24.1% New Hampshire -0.1% Rhode Island 13.3% Vermont -0.3% Middle Atlantic -3.5%
MAGAZINE Publisher s Statement 6 months ended June 30, 2015 Subject to Audit
 MAGAZINE Publisher s Statement 6 months ended June 30, 2015 Subject to Audit Field Served: INSTYLE celebrates the private side of public faces, revealing the personal style choices of the world s most
ANNUAL FINANCIAL PROFILE OF AMERICA S FRANCHISED NEW-CAR DEALERSHIPS. 2014 www.nada.org/nadadata
 ANNUAL FINANCIAL PROFILE OF AMERICA S FRANCHISED NEW-CAR DEALERSHIPS 2014 www./nadadata Overview NADA Data 2014 the annual financial profile of America s franchised new-car dealerships shows a robust and
WAGE REPORTS FOR WORKERS COVERED BY FEDERAL OLD-AGE INSURANCE IN 1937
 WAGE REPORTS FOR WORKERS COVERED BY FEDERAL OLD-AGE INSURANCE IN 937 JOHN J. CORSON* 3 DURING 937 approximately 3 million men and women worked in employment covered by Federal old-age insurance. They received
Table 1: Advertising, Marketing and Promotional Expense as a Percentage of Net Operating Revenue
 Table 1: Advertising, Marketing and Promotional Expense as a Percentage of Net Operating Revenue NAIC Group % Attorney s Title 3.8% Chicago / Fidelity 0.9% Diversified 0.6% First American 2.7% Investors
Use of "Mail Box" service. Date: April 6, 2015. [Use of Mail Box Service] [April 6, 2015]
![Use of Mail Box service. Date: April 6, 2015. [Use of Mail Box Service] [April 6, 2015]](/thumbs/26/8624083.jpg "Use of Mail Box service. Date: April 6, 2015. [Use of Mail Box Service] [April 6, 2015]") Topic: Question by: : Use of "Mail Box" service Kathy M. Sachs Kansas Date: April 6, 2015 Manitoba Corporations Canada Alabama Alaska Arizona Arkansas California Colorado Connecticut Delaware District
Topic: Question by: : Use of "Mail Box" service Kathy M. Sachs Kansas Date: April 6, 2015 Manitoba Corporations Canada Alabama Alaska Arizona Arkansas California Colorado Connecticut Delaware District
Your Direct Connection Between the US and Canada
 Caneda Transport Inc. Your Direct Connection Between the US and Canada Established in 1975. Caneda has been providing Quality, Professional, and Friendly carrier service for over 36 years. Company Profile
Closing the College Attainment Gap between the U.S. and Most Educated Countries, and the Contributions to be made by the States
 National Center for Higher Education Management Systems Closing the College Attainment Gap between the U.S. and Most Educated Countries, and the Contributions to be made by the States Patrick J. Kelly
STATISTICAL BRIEF #273
 STATISTICAL BRIEF #273 December 29 Employer-Sponsored Health Insurance for Employees of State and Local Governments, by Census Division, 28 Beth Levin Crimmel, M.S. Introduction Employees of state and
ENERGY COST INDEX 2012: RANKING THE STATES
 ENERGY COST INDEX 2012: RANKING THE STATES Raymond J. Keating Chief Economist Small Business & Entrepreneurship Council June 2012 Protecting small business, promoting entrepreneurship www.sbecouncil.org
Administrative Waste
 Embargoed until August 20, 2003 5PM EDT, Administrative Waste in the U.S. Health Care System in 2003: The Cost to the Nation, the States and the District of Columbia, with State-Specific Estimates of Potential
VCF Program Statistics (Represents activity through the end of the day on June 30, 2015)
") VCF Program Statistics (Represents activity through the end of the day on June 30, 2015) As of June 30, 2015, the VCF has made 12,712 eligibility decisions, finding 11,770 claimants eligible for compensation.
VCF Program Statistics (Represents activity through the end of the day on June 30, 2015) As of June 30, 2015, the VCF has made 12,712 eligibility decisions, finding 11,770 claimants eligible for compensation.
State Tax Information
 State Tax Information The information contained in this document is not intended or written as specific legal or tax advice and may not be relied on for purposes of avoiding any state tax penalties. Neither
STATE-SPECIFIC ANNUITY SUITABILITY REQUIREMENTS
 Alabama Alaska Arizona Arkansas California This jurisdiction has pending annuity training legislation/regulation Annuity Training Requirement Currently Effective Initial 8-Hour Annuity Training Requirement:
STATE SUPPLEMENTAL NUTRITION ASSISTANCE PROGRAM PARTICIPATION RATES IN 2009 FOOD AND NUTRITION SERVICE
 Responsibility and Work Opportunity Reconciliation Act.... STATE SUPPLEMENTAL NUTRITION ASSISTANCE PROGRAM PARTICIPATION RATES IN 2009 FOOD AND NUTRITION SERVICE Recent studies have examined national participation
State Corporate Income Tax Rates As of July 1, 2009
 State Tax Rates and Special Rates or Notes Brackets Alabama 6.5% Federal deductibility Alaska 1.0% > $0 2.0 > 10K 3.0 > 20K 4.0 > 30K 5.0 > 40K 6.0 > 50K 7.0 > 60K 8.0 > 70K 9.0 > 80K 9.4 > 90K Arizona
Verizon Wireless Ranks Highest in Wireless Network Quality Performance in Five Regions; AT&T Ranks Highest in One Region
 Reports: Tablet and Mobile Broadband Devices Generate Increased Data Quality Issues as Usage Patterns and Customer Expectations Impact Problem Incidence Ranks Highest in Wireless Network Quality Performance
Cash Rents Methodology and Quality Measures
 ISSN: 2167-129X Cash Rents Methodology and Quality Measures Released August 1, 2014, by the National Agricultural Statistics Service (NASS), Agricultural Statistics Board, United States Department of Agriculture
NEW CARRIER SIGN UP REQUEST FORM
 Instructions: (Please fax or email the completed documents) dispatch@txcarriers.com Fax: 1-855-631-4174 o Fill o Copy o Copy o initial o Insurance out Carrier profile of Common Carrier Authority Company
Connecticut s Insurance Industry: Economic Impacts & Contributions
 Connecticut s Insurance Industry: Economic Impacts & Contributions Prepared by: Connecticut Economic Resource Center, Inc. December 2006 2006 Insure Connecticut s Future, Connecticut Insurance and Financial
california Health Care Almanac Health Care Costs 101: California Addendum
 california Health Care Almanac : California Addendum May 2012 Introduction Health spending represents a significant share of California s economy, but the amounts spent on health care rank among the lowest
Exploring the Impact of the RAC Program on Hospitals Nationwide
 Exploring the Impact of the RAC Program on Hospitals Nationwide Overview of AHA RACTrac Survey Results, 4 th Quarter 2010 For complete report go to: http://www.aha.org/aha/issues/rac/ractrac.html Agenda
CMS Establishes PDP and MA Regions
 Washington New York San Francisco London Brussels Health Care Reimbursement Client Alert: Medicare Part D December 2004 CMS Establishes PDP and MA Regions The Centers for Medicare and Medicaid Services
ObamaCare s Impact on Small Business Wages and Employment
 ObamaCare s Impact on Small Business Wages and Employment Sam Batkins, Ben Gitis, Conor Ryan September 2014 Executive Summary Introduction American Action Forum (AAF) research finds that Affordable Care
US Exports to China by State
 US Exports to China by State 2004 2013 1818 N Street, NW, Suite 200, Washington, DC 20036 Tel: 202-429-0340 Fax: 202-775-2476 E-mail: info@uschina.org www.uschina.org Executive Summary Exports to China:
Commodity Profile: Tomatoes, fresh market
 Agricultural Issues Center University of California Created October 25 Commodity Profile: Tomatoes, fresh market by Hayley Boriss, Junior Specialist Henrich Brunke, Assistant Specialist brunke@primal.ucdavis.edu
Changes in the Cost of Medicare Prescription Drug Plans, 2007-2008
 Issue Brief November 2007 Changes in the Cost of Medicare Prescription Drug Plans, 2007-2008 BY JOSHUA LANIER AND DEAN BAKER* The average premium for Medicare Part D prescription drug plans rose by 24.5
NAIC ANNUITY TRAINING Regulations By State
 Select a state below to display the current regulation and requirements, or continue to scroll down. Light grey text signifies states that have not adopted an annuity training program. Alabama Illinois
State Specific Annuity Suitability Requirements updated 10/10/11
 Alabama Alaska Ai Arizona Arkansas California This jurisdiction has pending annuity training legislation/regulation Initial 8 Hour Annuity Training Requirement: Prior to selling annuities in California,
Georgia s Ranking Among the States: Budget, Taxes, and Other Indicators
 THE CENTER FOR STATE AND LOCAL FINANCE JUNE 2015 Georgia s Ranking Among the States: Budget, Taxes, and Other Indicators IN COLLABORATION WITH ABOUT THE CENTER FOR STATE AND LOCAL FINANCE The (CSLF) mission
February 2015 STATE SUPPLEMENT. Completing College: A State-Level View of Student Attainment Rates
 8 February 2015 STATE SUPPLEMENT Completing College: A State-Level View of Student Attainment Rates Completing College: A State-Level View of Student Attainment Rates In the state supplement to our eighth
LLC Domestications. Date: March 23, 2015. [LLC Domestication] [March 23, 2015]
![LLC Domestications. Date: March 23, 2015. [LLC Domestication] [March 23, 2015]](/thumbs/27/9699692.jpg "LLC Domestications. Date: March 23, 2015. [LLC Domestication] [March 23, 2015]") Topic: Question by: : LLC Domestications Earl B. Weaver, Jr. Illinois Date: March 23, 2015 Manitoba Corporations Canada Alabama Alaska Arizona Alabama has removed the term domestication from our Code for
Topic: Question by: : LLC Domestications Earl B. Weaver, Jr. Illinois Date: March 23, 2015 Manitoba Corporations Canada Alabama Alaska Arizona Alabama has removed the term domestication from our Code for
IRS Request for Assistance re New EIN and True Owner. Question by: Sarah Steinbeck on behalf of Leslie Reynolds. Date: 5 August 2010
 Topic: IRS Request for Assistance re New EIN and True Owner Question by: Sarah Steinbeck on behalf of Leslie Reynolds Jurisdiction: Colorado/NASS Date: 5 August 2010 Jurisdiction Question(s) Have you spoken
Centers of Excellence
 Centers of Excellence A program of the NMSDC to enhance corporate minority supplier development through knowledge sharing and excellence in implementing NMSDC best practices. Centers of Excellence enhances
INTRODUCTION. Figure 1. Contributions by Source and Year: 2012 2014 (Billions of dollars)
") Annual Survey of Public Pensions: State- and Locally- Administered Defined Benefit Data Summary Report: Economy-Wide Statistics Division Briefs: Public Sector By Phillip Vidal Released July 2015 G14-ASPP-SL
Annual Survey of Public Pensions: State- and Locally- Administered Defined Benefit Data Summary Report: Economy-Wide Statistics Division Briefs: Public Sector By Phillip Vidal Released July 2015 G14-ASPP-SL