Big Data, Socio- Psychological Theory, Algorithmic Text Analysis, and Predicting the Michigan Consumer Sentiment Index
|
|
|
- Rolf Harold Gardner
- 10 years ago
- Views:
Transcription
1 Big Data, Socio- Psychological Theory, Algorithmic Text Analysis, and Predicting the Michigan Consumer Sentiment Index Rickard Nyman *, Paul Ormerod Centre for the Study of Decision Making Under Uncertainty, University College London and Diphrontis Analytics Ltd., London May 2014 Corresponding author 1

2 Abstract We describe an exercise of predicting the Michigan Consumer Sentiment Index, a widely used indicator of the state of confidence in the US economy. We carry out the exercise from a pure ex ante perspective. We use the methodology of algorithmic text analysis of an archive of brokers reports over the period June 2010 through June The search is directed by the social- psychological theory of agent behaviour, namely conviction narrative theory. We compare one month ahead forecasts generated this way over a 15 month period with the forecasts reported for the consensus predictions of Wall Street economists. The former give much more accurate predictions, getting the direction of change correct on 12 of the 15 occasions compared to only 7 for the consensus predictions. We show that the approach retains significant predictive power even over a four month ahead horizon. 1. Introduction The development of Big Data appears to provide many opportunities for discovering knowledge in hitherto unconventional ways. However, it is essential to proceed with caution. An enormous amount of data has become available, and as a result there will be many apparently significant correlations awaiting discovery. However, as Silver points out in his best- selling book The Signal and the Noise, many of these will be spurious and almost entirely dependent upon the particular sample which is used to estimate them. In order to interpret correctly any relationships which are found in Big Data, it is essential to view the results from the perspective of a soundly based behavioural theory. In terms of frequentist statistical theory, a correlation between any two factors is deemed to be significant if, to use natural rather than scientific language, the chance of observing the correlation is less than 1 in 20. Given the immense amount of data which is now available, and the ease of processing it, it is clearly very easy to obtain large numbers of correlations which meet this criterion. However, results obtained through data mining in this way can only be interpreted ex post. Almost anything can be rationalised in this way. Without theoretical guidance, there is no way of knowing in advance even what the sign of any correlation ought to be. In this paper, we describe an exercise of predicting the Michigan Consumer Sentiment Index, a widely used indicator of the state of confidence in the US economy. We carry out the exercise from a pure ex ante perspective. We use the methodology of algorithmic text analysis of an archive of brokers reports over the period June 2010 through June A key point here is that our text analysis is guided completely by the social- psychological theory of conviction narratives (Chong and Tuckett, 2013; Tuckett, Smith and Nyman, 2013). The theory starts from the proposition agents may be more or less emotionally convinced that the information they have available provides the grounds to make confident decisions. 2

3 Indicators of the emotional conviction in narratives are then used in conjunction with standard algorithmic text search methodologies to filter and extract shifts in confidence from the database. Section 2 describes the Michigan data and the accuracy of the forecasts of the index made by a survey of economists polled by Reuters. Section 3 sets out the methodology we employ, and section 4 compares the forecasts with those of the economic consensus. 2 The Michigan index and the consensus forecasting record The Michigan Consumer Sentiment Index has long been the industry leading measure of consumer confidence and consumer expectations. Survey results are released twice each month at a.m. Eastern Time: preliminary estimates usually (variations occur during the winter season) on the second Friday of each month, and final results on the fourth Friday. There is a very high correlation of between the preliminary and final index. The correlation between the change in the preliminary index in any given month from the final in the previous month, and change in the final itself remains high, at When the economists are polled by Reuters, the preliminary estimate for the month has already been published. So the task of predicting the final value of the index is considerable simplified by having this information. The real question is what the change will be in the preliminary index from the level of the final index in the previous month. Given the preliminary index and its high correlation, whether in levels or differences, with the final, the forecasting task is fairly straightforward. In terms of the change in the preliminary index from the level of the final index in the previous month, the forecasting accuracy of the consensus is considerably less impressive, indeed it might even be described as poor. As a matter of descriptive convenience, we will now refer to this change in the preliminary index from the level of the final index in the previous month as DIFFPRELIM. The consensus forecasts only predict the sign of DIFFPRELIM correctly on 7 out of the 15 occasions. This is no better than a purely random guess. A linear regression of DIFFPRELIM on the change in the preliminary on the previous final predicted by the consensus forecast confirms the poor record (which we describe as DIFFCONSENSUS) 1. Over the period May 2012 through July 2013, (1) DIFFPRELIM = *DIFFCONSENSUS (1.084) (1.178) 1 The autocorrelation function of each variable contains no lags which are significantly different from zero, so the two variables have the same order of integration 3

4 Residual standard error: Adjusted R- squared F- statistic: on 1 and 13 degrees of freedom, p- value: The figures in brackets are the estimated standard errors of the coefficients. The explanatory power of the equation is very low. In fact, it is essentially not significantly different from zero. In other words, the consensus forecasts have very little value in terms of predicting the change in the preliminary index from the level of the final index in the previous month. We now move to consider whether the algorithmic text based approach, filtered through the lens of conviction narrative theory, can do any better. 3. Algorithmic text analysis based on conviction narrative theory We analyse an archive of 14 brokers from June 2010 through June 2013 consisting of documents of a primarily global economic focus. The archive consists of approximately 111 documents per month. The documents are very long (up to 50 pages in some cases), and so we pick up on a large number of words. In total we arrive at 37 monthly data points. The approach we use here is simply one particular application of a methodology which has been developed to analyse any textual data base. A detailed description of the approach, including the algorithm used for text analysis, is available in Tuckett et al. (2013). Here, we provide a summary. The social- psychological theory of conviction narratives (Chong and Tuckett, 2013; Tuckett, Smith and Nyman, 2013) starts from the proposition agents may be more or less emotionally convinced that the information they have available provides the grounds to make confident decisions. A conviction narrative combines reasons for and against action into order in such a way that action is supported. Agents faced with uncertainty can then feel persuaded to act and to stay acting, while they try to interpret signs and signals in the world and wait to see how their decisions are turning out. Indicators of the emotional conviction in narratives are then used in conjunction with standard algorithmic text search methodologies to filter and extract shifts from any given text data base. For any given text data base, we compute two emotional summary statistics, one for excitement (the attractor) and one for anxiety (the repellor), by applying a simple word count methodology. Two sets of emotion words, each of size approximately 150, indicative of the relevant emotions have been defined. The lists proved useful in other studies (Tuckett, Smith and Nyman, 2013, Tuckett et al. 2013) and have been validated in a laboratory setting (Strauss, 2013). 4

5 We construct from this a single variable which we use for analytical purposes, defined as the difference between the frequency of excitement words and the frequency of anxiety words, normalized by dividing by the total number of characters 2 in the data base. For descriptive convenience we describe this as BROKER. 4. The results The approach we use is as follows. We estimate a linear regression of DIFFPRELIM on DIFFBROKER in the previous month, where the latter is the change in BROKER. The time stamp of the data is important to explain. It is crucial to understanding the significance of the results. Initially, we estimate the regression using the data on DIFFPRELIM from August 2010 through April The first observation in this sample is the value of the preliminary index in August 2010 minus the value of the final observation in July The corresponding data point for the series BROKER is the change in the value of BROKER between July and June In other words, we regress DIFFPRELIM on information which would have been available at the end of the previous month to which DIFFPRELIM relates. Using data on DIFFPRELIM from August 2010 through April 2012 and data on DIFFBROKER from July 2010 through March 2012, we obtain 3 : (2) DIFFPRELIM = *DIFFBROKER (0.766) (0.261) Residual standard error: Adjusted R- squared F- statistic: on 1 and 19 degrees of freedom, p- value: DW = 1.92; Ramsey F (3,30) = 0.69; W = 0.96 The figures in brackets are the estimated standard errors of the coefficients; DW is the Durbin- Watson statistic for first order autocorrelation; Ramsey is the Ramsey RESET specification test and W is the Shapiro- Wilk test for normality of the residuals The equation is well- specified. Using the full sample, in other words DIFFPRELIM from August 2010 through July 2013 and data on DIFFBROKER from July 2010 through June 2013, we have: (3) DIFFPRELIM = *DIFFBROKER 2 In general, the total number of words or documents is the divisor, but in this particular instance some of the documents contain tables and others do not, so that the total number of characters is more appropriate 3 Again, the autocorrelation function of each variable contains no lags which are significantly different from zero, so the two variables have the same order of integration 5

6 (0.536) (0.170) Residual standard error: Adjusted R- squared F- statistic: on 1 and 34 degrees of freedom, p- value: The figures in brackets are the estimated standard errors of the coefficients DW = 1.97; Ramsey F (3,15) = 0.81; W = 0.94 Again, the equation is well- specified. To generate forecasts of the preliminary estimates of the Michigan index for May 2012, we use the coefficients in equation (2) above, and the data for DIFFBROKER in April In other words, to predict the May value of the index, we use information which was available at the end of April. We then repeat the analysis, moving the sample forward one month at a time, until we predict the index in July 2013 using the equation estimated with DIFFPRELIM from August 2010 through June 2013 and DIFFBROKER July 2010 through May The prediction for July 2013 uses the value of DIFFBROKER in June Again, to emphasise, when making the prediction we only use information which was available at the previous month. This replicates as far as possible an ex ante forecasting situation. We also emphasise that the text analysis was only carried out once. In other words, we applied our general methodology to this particular data base and used the results to make predictions, as described above. We did not do repeated searches of the data base, using for example only sub- sets of the complete set of words which represent excitement and anxiety, or giving words different weights in order to improve the forecast performance. Ex post, it would almost certainly be possible to achieve an apparent improvement in forecast performance by carrying out such procedures, but as a way of replicating an ex ante forecasting situation, it would be wholly invalid. Further, we specified the very simple functional form in equations (2) and (3) and then carried out the regressions. We did not modify this in any way in order for the equations to perform better on statistical tests of validation. The test statistics reported with the equations therefore satisfy completely the requirements of statistical theory and their power can be relied upon. We make this point because many regressions, especially on time series data, reported in the academic econometric literature, appear to satisfy an impressive battery of specification tests. But usually this is only achieved by modifying the specification of the equation, either in terms of explanatory variables or in terms of functional form, in order that the equation does in fact satisfy such tests. But in these circumstances, the true power of the tests is in general unknown, except that it is less than that suggested by statistical theory. 6

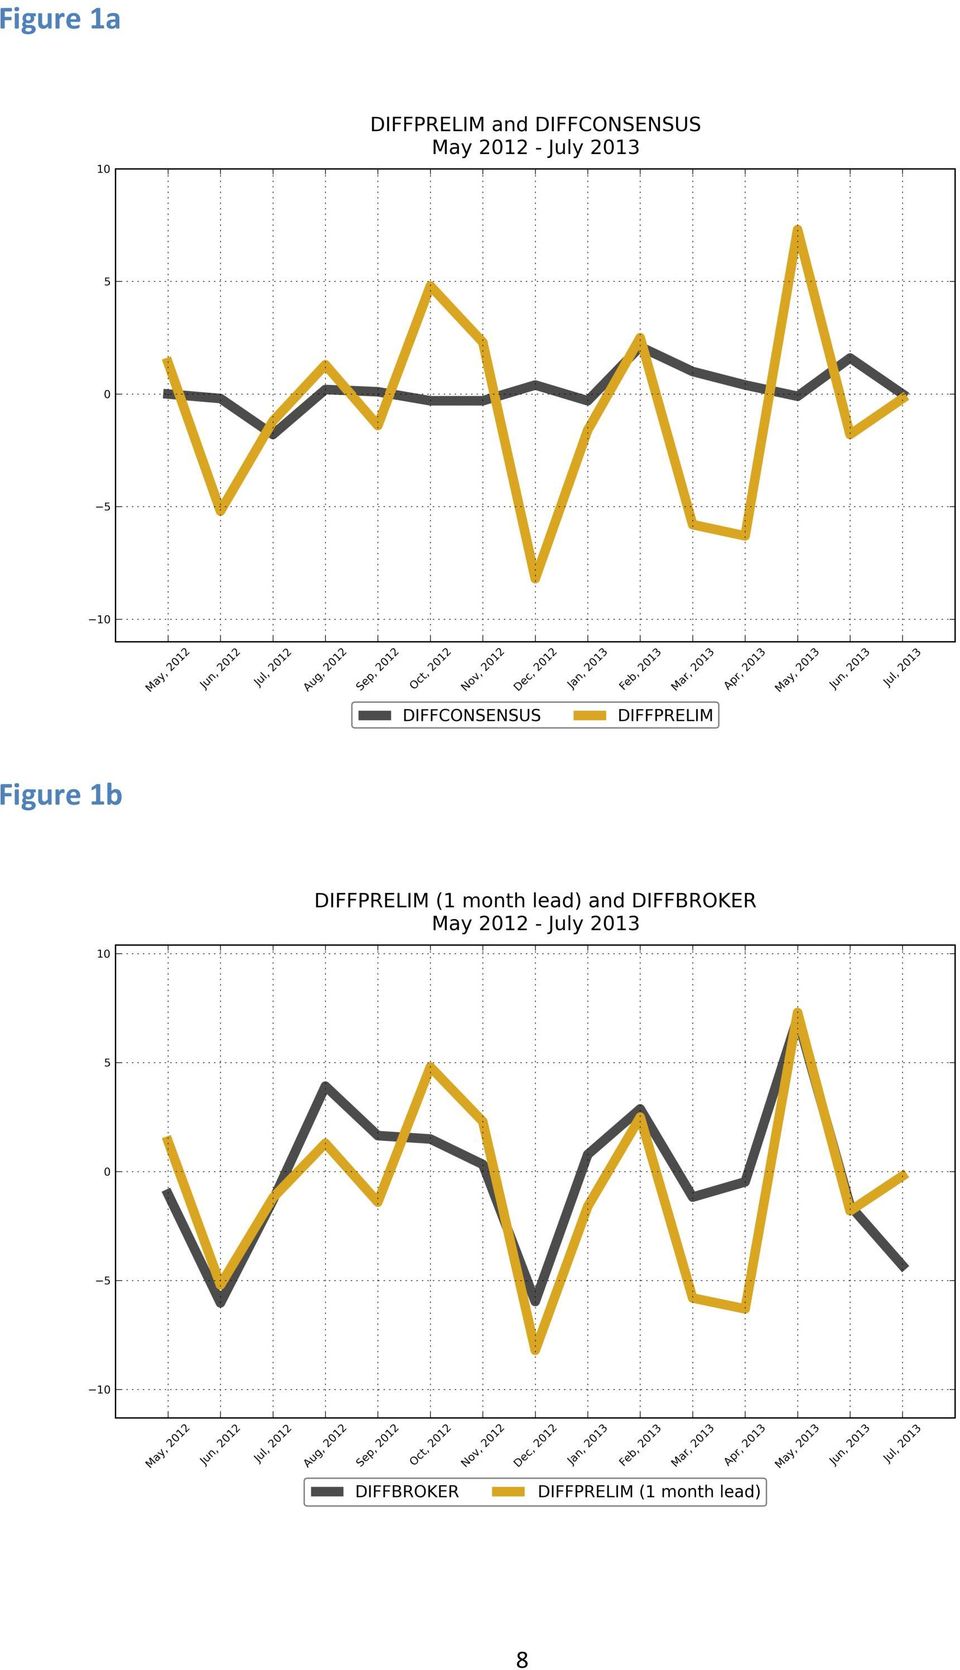
7 To recap, the consensus forecasts made by economists over the period May 2012 through July 2013 only get the sign of the change correct on 7 out of 15 equations, and a regression of the actual value of DIFFPRELIM on the changes implied by the consensus forecasts has effectively zero statistical power. This is the benchmark against which we judge our predictions. Our methodology captures the correct value of the sign of DIFFPRELIM on 12 out of 15 occasions. The regression comparable to (1) using the BROKER data is as follows: (4) DIFFPRELIM( in month t) = *DIFFBROKER( in month t- 1) (0.852) (0.323) Residual standard error: Adjusted R- squared F- statistic: on 1 and 13 degrees of freedom, p- value: The figures in brackets are the estimated standard errors of the coefficients. It is apparent that, whilst the equation is not perfect, it has genuine power and is very much better than equation (1). The predictions are unbiased, given that the intercept is not significantly different from zero and the coefficient on the explanatory variable is not significantly different from one. The difference in the forecasting performance of the CONSENSUS and BROKER data is seen very clearly in Figures 1a and 1b which plot the difference between the preliminary estimate and the final value in the previous month (DIFFPRELIM) and the prediction given by the consensus and broker approaches, as described above 7
 (0.852) (0.323) Residual standard error: 3.081 Adjusted R- squared 0.486 F- statistic: 14.24 on 1 and 13 degrees of freedom, p- value: 0.")
8 Figure 1a Figure 1b 8
9 We also examined the ability of the BROKER series to predict the preliminary value of the MCI further ahead than the immediate next month. We consider 2, 3 and 4 months ahead. So, using information available at the end of April 2012, for example, the prediction 2 months ahead is for the change in the preliminary value of the MCI in June 2012 on the final value in April Similarly, the 3 months ahead is the change in the preliminary value of the MCI in July 2012 on the final value in April 2012, and the 4 month ahead is the change in the preliminary value of the MCI in August 2012 on the final value in April Even 4 months ahead, there is some predictive power in the BROKER data, although the performance deteriorates the further ahead the prediction is made, as one would expect. In terms of the correct prediction of the sign of the change in the preliminary index, defined as in the paragraph immediately above, for the 2 month ahead it is 11/15, for the 3 month 8/15 and for the 4 month 7/ Discussion and Conclusion The Michigan Consumer Sentiment Index is important not only in its own right as an indicator of the current state of consumer confidence in America, but it is also the focus of many trades on financial markets. Economists make predictions of this index, month by month, and their views are polled by Reuters and the consensus is published. The final value of the index for any given month is published essentially at the end of the month, but a preliminary estimate is also published in the first half of the month. This preliminary estimate is very strongly correlated with the final value, and is available to the economists when they make their predictions. The real challenge, is therefore, to predict not the final, but the preliminary value of the index. More specifically, the challenge is to predict the change in the preliminary estimate from the final value of the previous month. The performance of the economic consensus forecasts of this change over the 15 months from May 2012 through July 2013 is poor. Even the sign of the change is correctly predicted on only 7 out of the 15 occasions, no better than a random guess. A regression of the actual change on the predictive change has essentially no predictive power. The approach we have presented, grounded in the social- psychological theory of conviction narratives and using directed algorithmic text analysis with a database of brokers reports generates a time series which indicates the net level of excitement minus anxiety found in the reports. We replicate as far as possible a genuine ex ante forecasting situation over the same 15 months from May 2012 through July These predictions give the correct sign on 12 out of the 15 occasions, and have significant explanatory power. The methodology can readily be applied to other text databases in the same or other forecasting contexts. It can 9

10 undoubtedly be refined. For example, all documents are given equal weight in our analysis, even though in practice some may be more influential than others. References Chong, K. & Tuckett, D. (2014). Constructing Conviction through Action and Narrative: How Money Managers Manage Uncertainty and the Consequences for Financial Market Functioning. Socio- Economic Review. doi: /ser/mwu020 Silver, N. (2012). The Signal and the Noise: Why Most Predictions Fail but Some Don t. Penguin Press. Strauss, Viktor, M. (2013). Emotional Values of Words in Finance: Anxiety about Losses and Excitement about Gains. M.Sc. thesis in Social Cognition, University College London. Tuckett, D., Smith, R. E. & Nyman, R. (2014). Tracking Phantastic Objects: A Computer Algorithmic Investigation of Narrative Evolution in Unstructured Data Sources. Social Networks 38, pp Tuckett, D., Ormerod, P., Smith, R. & Nyman, R. (2014). Bringing Social- Psychological Variables into Economic Modeling: Uncertainty, Animal Spirits and the Recovery from the Great Recession, IEA World Congress June 6 - June 10, Jordan. 10
.")
4. Simple regression. QBUS6840 Predictive Analytics. https://www.otexts.org/fpp/4
 4. Simple regression QBUS6840 Predictive Analytics https://www.otexts.org/fpp/4 Outline The simple linear model Least squares estimation Forecasting with regression Non-linear functional forms Regression
News and narratives in financial systems: exploiting big data for systemic risk assessment 1
 News and narratives in financial systems: exploiting big data for systemic risk assessment 1 Rickard Nyman, David Gregory, Sujit Kapadia, Robert Smith and David Tuckett February 2014 Preliminary draft.
16 : Demand Forecasting
 16 : Demand Forecasting 1 Session Outline Demand Forecasting Subjective methods can be used only when past data is not available. When past data is available, it is advisable that firms should use statistical
Is the Forward Exchange Rate a Useful Indicator of the Future Exchange Rate?
 Is the Forward Exchange Rate a Useful Indicator of the Future Exchange Rate? Emily Polito, Trinity College In the past two decades, there have been many empirical studies both in support of and opposing
Composite performance measures in the public sector Rowena Jacobs, Maria Goddard and Peter C. Smith
 Policy Discussion Briefing January 27 Composite performance measures in the public sector Rowena Jacobs, Maria Goddard and Peter C. Smith Introduction It is rare to open a newspaper or read a government
Promotional Forecast Demonstration
 Exhibit 2: Promotional Forecast Demonstration Consider the problem of forecasting for a proposed promotion that will start in December 1997 and continues beyond the forecast horizon. Assume that the promotion
Chapter 4: Vector Autoregressive Models
 Chapter 4: Vector Autoregressive Models 1 Contents: Lehrstuhl für Department Empirische of Wirtschaftsforschung Empirical Research and und Econometrics Ökonometrie IV.1 Vector Autoregressive Models (VAR)...
Time Series Analysis
 Time Series Analysis Identifying possible ARIMA models Andrés M. Alonso Carolina García-Martos Universidad Carlos III de Madrid Universidad Politécnica de Madrid June July, 2012 Alonso and García-Martos
EQUITY STRATEGY RESEARCH.
 EQUITY STRATEGY RESEARCH. Value Relevance of Analysts Earnings Forecasts September, 2003 This research report investigates the statistical relation between earnings surprises and abnormal stock returns.
5. Multiple regression
 5. Multiple regression QBUS6840 Predictive Analytics https://www.otexts.org/fpp/5 QBUS6840 Predictive Analytics 5. Multiple regression 2/39 Outline Introduction to multiple linear regression Some useful
A Primer on Forecasting Business Performance
 A Primer on Forecasting Business Performance There are two common approaches to forecasting: qualitative and quantitative. Qualitative forecasting methods are important when historical data is not available.
Marketing Mix Modelling and Big Data P. M Cain
 1) Introduction Marketing Mix Modelling and Big Data P. M Cain Big data is generally defined in terms of the volume and variety of structured and unstructured information. Whereas structured data is stored
2.2 Elimination of Trend and Seasonality
 26 CHAPTER 2. TREND AND SEASONAL COMPONENTS 2.2 Elimination of Trend and Seasonality Here we assume that the TS model is additive and there exist both trend and seasonal components, that is X t = m t +
RELEVANT TO ACCA QUALIFICATION PAPER P3. Studying Paper P3? Performance objectives 7, 8 and 9 are relevant to this exam
 RELEVANT TO ACCA QUALIFICATION PAPER P3 Studying Paper P3? Performance objectives 7, 8 and 9 are relevant to this exam Business forecasting and strategic planning Quantitative data has always been supplied
I. Introduction. II. Background. KEY WORDS: Time series forecasting, Structural Models, CPS
 Predicting the National Unemployment Rate that the "Old" CPS Would Have Produced Richard Tiller and Michael Welch, Bureau of Labor Statistics Richard Tiller, Bureau of Labor Statistics, Room 4985, 2 Mass.
Section A. Index. Section A. Planning, Budgeting and Forecasting Section A.2 Forecasting techniques... 1. Page 1 of 11. EduPristine CMA - Part I
 Index Section A. Planning, Budgeting and Forecasting Section A.2 Forecasting techniques... 1 EduPristine CMA - Part I Page 1 of 11 Section A. Planning, Budgeting and Forecasting Section A.2 Forecasting
Forecast. Forecast is the linear function with estimated coefficients. Compute with predict command
 Forecast Forecast is the linear function with estimated coefficients T T + h = b0 + b1timet + h Compute with predict command Compute residuals Forecast Intervals eˆ t = = y y t+ h t+ h yˆ b t+ h 0 b Time
Forecasting Methods. What is forecasting? Why is forecasting important? How can we evaluate a future demand? How do we make mistakes?
 Forecasting Methods What is forecasting? Why is forecasting important? How can we evaluate a future demand? How do we make mistakes? Prod - Forecasting Methods Contents. FRAMEWORK OF PLANNING DECISIONS....
Simple Linear Regression Inference
 Simple Linear Regression Inference 1 Inference requirements The Normality assumption of the stochastic term e is needed for inference even if it is not a OLS requirement. Therefore we have: Interpretation
Neural Networks for Sentiment Detection in Financial Text
 Neural Networks for Sentiment Detection in Financial Text Caslav Bozic* and Detlef Seese* With a rise of algorithmic trading volume in recent years, the need for automatic analysis of financial news emerged.
Application of Predictive Model for Elementary Students with Special Needs in New Era University
 Application of Predictive Model for Elementary Students with Special Needs in New Era University Jannelle ds. Ligao, Calvin Jon A. Lingat, Kristine Nicole P. Chiu, Cym Quiambao, Laurice Anne A. Iglesia
Outline: Demand Forecasting
 Outline: Demand Forecasting Given the limited background from the surveys and that Chapter 7 in the book is complex, we will cover less material. The role of forecasting in the chain Characteristics of
THE IMPACT OF EXCHANGE RATE VOLATILITY ON BRAZILIAN MANUFACTURED EXPORTS
 THE IMPACT OF EXCHANGE RATE VOLATILITY ON BRAZILIAN MANUFACTURED EXPORTS ANTONIO AGUIRRE UFMG / Department of Economics CEPE (Centre for Research in International Economics) Rua Curitiba, 832 Belo Horizonte
Analysis of Bayesian Dynamic Linear Models
 Analysis of Bayesian Dynamic Linear Models Emily M. Casleton December 17, 2010 1 Introduction The main purpose of this project is to explore the Bayesian analysis of Dynamic Linear Models (DLMs). The main
SIMPLIFIED PERFORMANCE MODEL FOR HYBRID WIND DIESEL SYSTEMS. J. F. MANWELL, J. G. McGOWAN and U. ABDULWAHID
 SIMPLIFIED PERFORMANCE MODEL FOR HYBRID WIND DIESEL SYSTEMS J. F. MANWELL, J. G. McGOWAN and U. ABDULWAHID Renewable Energy Laboratory Department of Mechanical and Industrial Engineering University of
Premaster Statistics Tutorial 4 Full solutions
 Premaster Statistics Tutorial 4 Full solutions Regression analysis Q1 (based on Doane & Seward, 4/E, 12.7) a. Interpret the slope of the fitted regression = 125,000 + 150. b. What is the prediction for
How to Discredit Most Real Estate Appraisals in One Minute By Eugene Pasymowski, MAI 2007 RealStat, Inc.
 How to Discredit Most Real Estate Appraisals in One Minute By Eugene Pasymowski, MAI 2007 RealStat, Inc. Published in the TriState REALTORS Commercial Alliance Newsletter Spring 2007 http://www.tristaterca.com/tristaterca/
Forecasting of Paddy Production in Sri Lanka: A Time Series Analysis using ARIMA Model
 Tropical Agricultural Research Vol. 24 (): 2-3 (22) Forecasting of Paddy Production in Sri Lanka: A Time Series Analysis using ARIMA Model V. Sivapathasundaram * and C. Bogahawatte Postgraduate Institute
Forecasting methods applied to engineering management
 Forecasting methods applied to engineering management Áron Szász-Gábor Abstract. This paper presents arguments for the usefulness of a simple forecasting application package for sustaining operational
Unit 31 A Hypothesis Test about Correlation and Slope in a Simple Linear Regression
 Unit 31 A Hypothesis Test about Correlation and Slope in a Simple Linear Regression Objectives: To perform a hypothesis test concerning the slope of a least squares line To recognize that testing for a
Big Data: a new era for Statistics
 Big Data: a new era for Statistics Richard J. Samworth Abstract Richard Samworth (1996) is a Professor of Statistics in the University s Statistical Laboratory, and has been a Fellow of St John s since
Least Squares Estimation
 Least Squares Estimation SARA A VAN DE GEER Volume 2, pp 1041 1045 in Encyclopedia of Statistics in Behavioral Science ISBN-13: 978-0-470-86080-9 ISBN-10: 0-470-86080-4 Editors Brian S Everitt & David
Earnings Announcement and Abnormal Return of S&P 500 Companies. Luke Qiu Washington University in St. Louis Economics Department Honors Thesis
 Earnings Announcement and Abnormal Return of S&P 500 Companies Luke Qiu Washington University in St. Louis Economics Department Honors Thesis March 18, 2014 Abstract In this paper, I investigate the extent
Predicting the Performance of a First Year Graduate Student
 Predicting the Performance of a First Year Graduate Student Luís Francisco Aguiar Universidade do Minho - NIPE Abstract In this paper, I analyse, statistically, if GRE scores are a good predictor of the
MGT 267 PROJECT. Forecasting the United States Retail Sales of the Pharmacies and Drug Stores. Done by: Shunwei Wang & Mohammad Zainal
 MGT 267 PROJECT Forecasting the United States Retail Sales of the Pharmacies and Drug Stores Done by: Shunwei Wang & Mohammad Zainal Dec. 2002 The retail sale (Million) ABSTRACT The present study aims
7 Time series analysis
 7 Time series analysis In Chapters 16, 17, 33 36 in Zuur, Ieno and Smith (2007), various time series techniques are discussed. Applying these methods in Brodgar is straightforward, and most choices are
Linear Regression. Chapter 5. Prediction via Regression Line Number of new birds and Percent returning. Least Squares
 Linear Regression Chapter 5 Regression Objective: To quantify the linear relationship between an explanatory variable (x) and response variable (y). We can then predict the average response for all subjects
Chapter 1 Introduction. 1.1 Introduction
 Chapter 1 Introduction 1.1 Introduction 1 1.2 What Is a Monte Carlo Study? 2 1.2.1 Simulating the Rolling of Two Dice 2 1.3 Why Is Monte Carlo Simulation Often Necessary? 4 1.4 What Are Some Typical Situations
Answer: C. The strength of a correlation does not change if units change by a linear transformation such as: Fahrenheit = 32 + (5/9) * Centigrade
 * Centigrade") Statistics Quiz Correlation and Regression -- ANSWERS 1. Temperature and air pollution are known to be correlated. We collect data from two laboratories, in Boston and Montreal. Boston makes their measurements
Statistics Quiz Correlation and Regression -- ANSWERS 1. Temperature and air pollution are known to be correlated. We collect data from two laboratories, in Boston and Montreal. Boston makes their measurements
Forecasting in supply chains
 1 Forecasting in supply chains Role of demand forecasting Effective transportation system or supply chain design is predicated on the availability of accurate inputs to the modeling process. One of the
Integrated Resource Plan
 Integrated Resource Plan March 19, 2004 PREPARED FOR KAUA I ISLAND UTILITY COOPERATIVE LCG Consulting 4962 El Camino Real, Suite 112 Los Altos, CA 94022 650-962-9670 1 IRP 1 ELECTRIC LOAD FORECASTING 1.1
Ch.3 Demand Forecasting.
 Part 3 : Acquisition & Production Support. Ch.3 Demand Forecasting. Edited by Dr. Seung Hyun Lee (Ph.D., CPL) IEMS Research Center, E-mail : [email protected] Demand Forecasting. Definition. An estimate
Stock market booms and real economic activity: Is this time different?
 International Review of Economics and Finance 9 (2000) 387 415 Stock market booms and real economic activity: Is this time different? Mathias Binswanger* Institute for Economics and the Environment, University
Week TSX Index 1 8480 2 8470 3 8475 4 8510 5 8500 6 8480
 1) The S & P/TSX Composite Index is based on common stock prices of a group of Canadian stocks. The weekly close level of the TSX for 6 weeks are shown: Week TSX Index 1 8480 2 8470 3 8475 4 8510 5 8500
International Journal of Computer Trends and Technology (IJCTT) volume 4 Issue 8 August 2013
 volume 4 Issue 8 August 2013") A Short-Term Traffic Prediction On A Distributed Network Using Multiple Regression Equation Ms.Sharmi.S 1 Research Scholar, MS University,Thirunelvelli Dr.M.Punithavalli Director, SREC,Coimbatore. Abstract:
A Short-Term Traffic Prediction On A Distributed Network Using Multiple Regression Equation Ms.Sharmi.S 1 Research Scholar, MS University,Thirunelvelli Dr.M.Punithavalli Director, SREC,Coimbatore. Abstract:
APPENDIX N. Data Validation Using Data Descriptors
 APPENDIX N Data Validation Using Data Descriptors Data validation is often defined by six data descriptors: 1) reports to decision maker 2) documentation 3) data sources 4) analytical method and detection
Testing for Lack of Fit
 Chapter 6 Testing for Lack of Fit How can we tell if a model fits the data? If the model is correct then ˆσ 2 should be an unbiased estimate of σ 2. If we have a model which is not complex enough to fit
ADVANCED FORECASTING MODELS USING SAS SOFTWARE
 ADVANCED FORECASTING MODELS USING SAS SOFTWARE Girish Kumar Jha IARI, Pusa, New Delhi 110 012 [email protected] 1. Transfer Function Model Univariate ARIMA models are useful for analysis and forecasting
Data analysis and regression in Stata
 Data analysis and regression in Stata This handout shows how the weekly beer sales series might be analyzed with Stata (the software package now used for teaching stats at Kellogg), for purposes of comparing
Module 6: Introduction to Time Series Forecasting
 Using Statistical Data to Make Decisions Module 6: Introduction to Time Series Forecasting Titus Awokuse and Tom Ilvento, University of Delaware, College of Agriculture and Natural Resources, Food and
Rob J Hyndman. Forecasting using. 11. Dynamic regression OTexts.com/fpp/9/1/ Forecasting using R 1
 Rob J Hyndman Forecasting using 11. Dynamic regression OTexts.com/fpp/9/1/ Forecasting using R 1 Outline 1 Regression with ARIMA errors 2 Example: Japanese cars 3 Using Fourier terms for seasonality 4
Time Series Analysis of Aviation Data
 Time Series Analysis of Aviation Data Dr. Richard Xie February, 2012 What is a Time Series A time series is a sequence of observations in chorological order, such as Daily closing price of stock MSFT in
A Review of the Literature of Real Business Cycle theory. By Student E XXXXXXX
 A Review of the Literature of Real Business Cycle theory By Student E XXXXXXX Abstract: The following paper reviews five articles concerning Real Business Cycle theory. First, the review compares the various
Forecasting the first step in planning. Estimating the future demand for products and services and the necessary resources to produce these outputs
 PRODUCTION PLANNING AND CONTROL CHAPTER 2: FORECASTING Forecasting the first step in planning. Estimating the future demand for products and services and the necessary resources to produce these outputs
REGRESSION MODEL OF SALES VOLUME FROM WHOLESALE WAREHOUSE
 REGRESSION MODEL OF SALES VOLUME FROM WHOLESALE WAREHOUSE Diana Santalova Faculty of Transport and Mechanical Engineering Riga Technical University 1 Kalku Str., LV-1658, Riga, Latvia E-mail: [email protected]
Testing for Granger causality between stock prices and economic growth
 MPRA Munich Personal RePEc Archive Testing for Granger causality between stock prices and economic growth Pasquale Foresti 2006 Online at http://mpra.ub.uni-muenchen.de/2962/ MPRA Paper No. 2962, posted
Statistics in Retail Finance. Chapter 6: Behavioural models
 Statistics in Retail Finance 1 Overview > So far we have focussed mainly on application scorecards. In this chapter we shall look at behavioural models. We shall cover the following topics:- Behavioural
STATISTICAL SIGNIFICANCE AND THE STANDARD OF PROOF IN ANTITRUST DAMAGE QUANTIFICATION
 Lear Competition Note STATISTICAL SIGNIFICANCE AND THE STANDARD OF PROOF IN ANTITRUST DAMAGE QUANTIFICATION Nov 2013 Econometric techniques can play an important role in damage quantification cases for
PITFALLS IN TIME SERIES ANALYSIS. Cliff Hurvich Stern School, NYU
 PITFALLS IN TIME SERIES ANALYSIS Cliff Hurvich Stern School, NYU The t -Test If x 1,..., x n are independent and identically distributed with mean 0, and n is not too small, then t = x 0 s n has a standard
Correlation. What Is Correlation? Perfect Correlation. Perfect Correlation. Greg C Elvers
 Correlation Greg C Elvers What Is Correlation? Correlation is a descriptive statistic that tells you if two variables are related to each other E.g. Is your related to how much you study? When two variables
Methodology For Illinois Electric Customers and Sales Forecasts: 2016-2025
 Methodology For Illinois Electric Customers and Sales Forecasts: 2016-2025 In December 2014, an electric rate case was finalized in MEC s Illinois service territory. As a result of the implementation of
Trend and Seasonal Components
 Chapter 2 Trend and Seasonal Components If the plot of a TS reveals an increase of the seasonal and noise fluctuations with the level of the process then some transformation may be necessary before doing
Time Series Analysis: Basic Forecasting.
 Time Series Analysis: Basic Forecasting. As published in Benchmarks RSS Matters, April 2015 http://web3.unt.edu/benchmarks/issues/2015/04/rss-matters Jon Starkweather, PhD 1 Jon Starkweather, PhD [email protected]
Sales forecasting # 2
 Sales forecasting # 2 Arthur Charpentier [email protected] 1 Agenda Qualitative and quantitative methods, a very general introduction Series decomposition Short versus long term forecasting
Multiple Linear Regression in Data Mining
 Multiple Linear Regression in Data Mining Contents 2.1. A Review of Multiple Linear Regression 2.2. Illustration of the Regression Process 2.3. Subset Selection in Linear Regression 1 2 Chap. 2 Multiple
Introduction to Linear Regression
 14. Regression A. Introduction to Simple Linear Regression B. Partitioning Sums of Squares C. Standard Error of the Estimate D. Inferential Statistics for b and r E. Influential Observations F. Regression
2. Simple Linear Regression
 Research methods - II 3 2. Simple Linear Regression Simple linear regression is a technique in parametric statistics that is commonly used for analyzing mean response of a variable Y which changes according
College Readiness LINKING STUDY
 College Readiness LINKING STUDY A Study of the Alignment of the RIT Scales of NWEA s MAP Assessments with the College Readiness Benchmarks of EXPLORE, PLAN, and ACT December 2011 (updated January 17, 2012)
CHAPTER 8 FACTOR EXTRACTION BY MATRIX FACTORING TECHNIQUES. From Exploratory Factor Analysis Ledyard R Tucker and Robert C.
 CHAPTER 8 FACTOR EXTRACTION BY MATRIX FACTORING TECHNIQUES From Exploratory Factor Analysis Ledyard R Tucker and Robert C MacCallum 1997 180 CHAPTER 8 FACTOR EXTRACTION BY MATRIX FACTORING TECHNIQUES In
Multiple Regression Analysis A Case Study
 Multiple Regression Analysis A Case Study Case Study Method 1 The first step in a case study analysis involves research into the subject property and a determination of the key factors that impact that
Algorithmic Trading Session 1 Introduction. Oliver Steinki, CFA, FRM
 Algorithmic Trading Session 1 Introduction Oliver Steinki, CFA, FRM Outline An Introduction to Algorithmic Trading Definition, Research Areas, Relevance and Applications General Trading Overview Goals
OBJECTIVE ASSESSMENT OF FORECASTING ASSIGNMENTS USING SOME FUNCTION OF PREDICTION ERRORS
 OBJECTIVE ASSESSMENT OF FORECASTING ASSIGNMENTS USING SOME FUNCTION OF PREDICTION ERRORS CLARKE, Stephen R. Swinburne University of Technology Australia One way of examining forecasting methods via assignments
How To Predict Stock Price With Mood Based Models
 Twitter Mood Predicts the Stock Market Xiao-Jun Zeng School of Computer Science University of Manchester [email protected] Outline Introduction and Motivation Approach Framework Twitter mood model
APPLICATION OF LINEAR REGRESSION MODEL FOR POISSON DISTRIBUTION IN FORECASTING
 APPLICATION OF LINEAR REGRESSION MODEL FOR POISSON DISTRIBUTION IN FORECASTING Sulaimon Mutiu O. Department of Statistics & Mathematics Moshood Abiola Polytechnic, Abeokuta, Ogun State, Nigeria. Abstract
MULTIPLE REGRESSIONS ON SOME SELECTED MACROECONOMIC VARIABLES ON STOCK MARKET RETURNS FROM 1986-2010
 Advances in Economics and International Finance AEIF Vol. 1(1), pp. 1-11, December 2014 Available online at http://www.academiaresearch.org Copyright 2014 Academia Research Full Length Research Paper MULTIPLE
The SAS Time Series Forecasting System
 The SAS Time Series Forecasting System An Overview for Public Health Researchers Charles DiMaggio, PhD College of Physicians and Surgeons Departments of Anesthesiology and Epidemiology Columbia University
Artificial Neural Network and Non-Linear Regression: A Comparative Study
 International Journal of Scientific and Research Publications, Volume 2, Issue 12, December 2012 1 Artificial Neural Network and Non-Linear Regression: A Comparative Study Shraddha Srivastava 1, *, K.C.
Demand Forecasting When a product is produced for a market, the demand occurs in the future. The production planning cannot be accomplished unless
 Demand Forecasting When a product is produced for a market, the demand occurs in the future. The production planning cannot be accomplished unless the volume of the demand known. The success of the business
Joseph Twagilimana, University of Louisville, Louisville, KY
 ST14 Comparing Time series, Generalized Linear Models and Artificial Neural Network Models for Transactional Data analysis Joseph Twagilimana, University of Louisville, Louisville, KY ABSTRACT The aim
OFFER BY WPP GROUP PLC ("WPP")
") THE TAKEOVER PANEL 2001/15 OFFER BY WPP GROUP PLC ("WPP") FOR TEMPUS GROUP PLC ("TEMPUS") 1. The Takeover Panel met on 31 October to hear an appeal by WPP against the Panel Executive's refusal to allow
THE TAKEOVER PANEL 2001/15 OFFER BY WPP GROUP PLC ("WPP") FOR TEMPUS GROUP PLC ("TEMPUS") 1. The Takeover Panel met on 31 October to hear an appeal by WPP against the Panel Executive's refusal to allow
Example G Cost of construction of nuclear power plants
 1 Example G Cost of construction of nuclear power plants Description of data Table G.1 gives data, reproduced by permission of the Rand Corporation, from a report (Mooz, 1978) on 32 light water reactor
The Viability of StockTwits and Google Trends to Predict the Stock Market. By Chris Loughlin and Erik Harnisch
 The Viability of StockTwits and Google Trends to Predict the Stock Market By Chris Loughlin and Erik Harnisch Spring 2013 Introduction Investors are always looking to gain an edge on the rest of the market.
How to Get More Value from Your Survey Data
 Technical report How to Get More Value from Your Survey Data Discover four advanced analysis techniques that make survey research more effective Table of contents Introduction..............................................................2
Intercoder reliability for qualitative research
 Intercoder reliability for qualitative research You win some, but do you lose some as well? TRAIL Research School, October 2012 Authors Niek Mouter, MSc and Diana Vonk Noordegraaf, MSc Faculty of Technology,
Introduction to time series analysis
 Introduction to time series analysis Margherita Gerolimetto November 3, 2010 1 What is a time series? A time series is a collection of observations ordered following a parameter that for us is time. Examples
APPLICATION OF DATA MINING TECHNIQUES FOR BUILDING SIMULATION PERFORMANCE PREDICTION ANALYSIS. email [email protected]
 Eighth International IBPSA Conference Eindhoven, Netherlands August -4, 2003 APPLICATION OF DATA MINING TECHNIQUES FOR BUILDING SIMULATION PERFORMANCE PREDICTION Christoph Morbitzer, Paul Strachan 2 and
Credit rating and the business cycle: can bankruptcies be forecast?
 Credit rating and the business cycle: can bankruptcies be forecast? BY TOR JACOBSON AND JESPER LINDÉ Research Department Credit rating agencies have an important role to fulfil in the financial markets.
STUDY THE RELATIONSHIP BETWEEN INVESTMENT OPPORTUNITIES AND EARNINGS STABILITY OF FIRMS IN TEHRAN SECURITIES EXCHANGE
 2014 Vol. 4 (S4), pp. 24482455/Parvin and Mehrdad STUDY THE RELATIONSHIP BETWEEN INVESTMENT OPPORTUNITIES AND EARNINGS STABILITY OF FIRMS IN TEHRAN SECURITIES EXCHANGE Parvin Nafei 1, 2 and *Mehrdad Ghanbari
A Short review of steel demand forecasting methods
 A Short review of steel demand forecasting methods Fujio John M. Tanaka This paper undertakes the present and past review of steel demand forecasting to study what methods should be used in any future
Sensex Realized Volatility Index
 Sensex Realized Volatility Index Introduction: Volatility modelling has traditionally relied on complex econometric procedures in order to accommodate the inherent latent character of volatility. Realized
11. Analysis of Case-control Studies Logistic Regression
 Research methods II 113 11. Analysis of Case-control Studies Logistic Regression This chapter builds upon and further develops the concepts and strategies described in Ch.6 of Mother and Child Health: