Using housing wealth and other assets to pay for care
|
|
|
- Andrew Daniels
- 10 years ago
- Views:
Transcription
1 Using housing wealth and other assets to pay for care Summary In the UK, personal wealth, including housing wealth, is greatest in older age, driven by the natural lifecycle of wealth accumulation and decumulation and the huge rise in house prices Wealth inequality is much greater than income inequality so the holding of housing wealth in older age is by no means universal Housing assets are viewed differently from other assets. First and foremost the owner occupied property is a home and only used as a source of income as a last resort for emergency support later in life. The Care Act 2014 will provide, for the first time a degree of certainty in the cost of residential care in older age including o a cap on total care expenditure of 72,000 but excluding residential care hotel fees of approximately 12,000 per annum o a universal deferred payments scheme where non housing assets held are less than 23,250, allowing the deferral of the payment of residential care fees, up to 70 80% of the value of the main residence,secured on the main residence and subject to an administration fee and interest charged at 3½ 5%. Financial institutions are not trusted to provide fair and good value housing equity release products, with highest trust being placed on government related financial institutions (such as the Sparkasse in Germany) Current housing equity release schemes are not, in general, suitable to pay for residential care as the scheme ends and the house is forfeited when it is unoccupied for any length of time Inheritance is not a primary factor in initial house purchase although it becomes more important as homeowners with children age. Britain is not yet a nation of inheritors because it will be some time yet before the cohort of new home owners from the 1980s onwards, pass on their wealth Older people would prefer not to use their hard won housing assets to pay for long term care but, given the unacceptability of a pooled system either from general taxation, a compulsory up front insurance premium on retirement or a death tax, a scheme to pay for long term care as the need arises becomes necessary. The care cap and universal deferred payment scheme provisions of the Care Act 2014 may well be the most acceptable way forward. 1

2 Background Many older people have accumulated housing and other assets by the time they reach older age, but this is by no means universal. Should older people who have accumulated assets be expected to use those assets to help pay for social and residential care in older age, if they are unfortunate enough to require it, or should welfare support be provided? Is it unfair to use scarce public funding to provide welfare support for these better off people in older age or is it unfair to not help an older person who has saved and accumulated assets while, at the same time, helping someone with the same life time income who has been more profligate? Older people who need care, spend on average about 3 years receiving care 1 although the length of time spent in residential care has been declining 2. Home care might cost around 5,000 per year while residential care costs about 28, Few people can afford residential care without selling their home, 60% of older people have less than 25,000 in savings (around 1 year in care) while 80% have less than 75,000 (around 3 years in care the average stay) 1. Thirty to forty thousand homes are sold each year to pay for care 1 The Care Act 2014 has, for the first time, placed a greater degree of certainty on the maximum potential liability arising from the need to pay for care in older age. As part of the Care Act 2014, and based on Dilnot Commission proposals, from April 2016 the Government will introduce a cap of 72,000 on the amount a person must pay for care. This will not include room and board in residential care (assumed to cost 12,000 per annum), or discretionary top up services. The Care Act 2014 also requires councils to provide Universal Deferred Payment Schemes. UDPS will allow people in residential care who are at risk of having to sell their home to pay for care, to defer paying the care fees until later, so they do not have to sell their home in their lifetime. 1 Housing and Finance Working Group (2013), Department of Health Steering Group Housing and Equity 2 Lievesley et al (2011), The changing role of care homes 3 Dilnot Commission (2010), Technical briefing document 2

3 Household wealth in the UK Wealth, like Space, is big, really big. 4 In aggregate total wealth from all sources, of private households in Great Britain, was 9.5 trillion. 6 Median household wealth is 7 12 time median household income. 4 In the 18th and 19th century, total accumulated wealth was about 600% of national income but that fell to around 300 to 400% by the mid 20th century. It has returned to around 600% in many advanced economies. 5 Private pension wealth is the largest component of aggregate total wealth in Great Britain with net property wealth a very close second. 6 [Figure 1] A key statistical source for wealth and assets studies in the UK is the Wealth and Assets Survey (WAS). Results from the third wave 6 ( ) were published by the Office for National Statistics (ONS) in May [Table 1] Figure 1 4 Hills et al (2013), Wealth in the UK: Distribution, Accumulation, and Policy 5 Turner (2014), Wealth, Debt, Inequality and Low Interest Rates: Four Big Trends and Some Implications 6 ONS (2014), Wealth in Great Britain Wave 3,

4 Wealth inequality Wealth inequality is much greater than income inequality. Those near the top (at the 90 th percentile) of the earning and income distributions have earning or incomes around four times higher than those near the bottom (at the 10 th percentile). For household wealth the corresponding ratio is seventy seven to one. 4 The wealthiest 10% of households own 44% of total aggregate household wealth while the least wealthy half (50%) of households combined own just 9% of total aggregate household wealth. 6 Table 1 4
 of households")
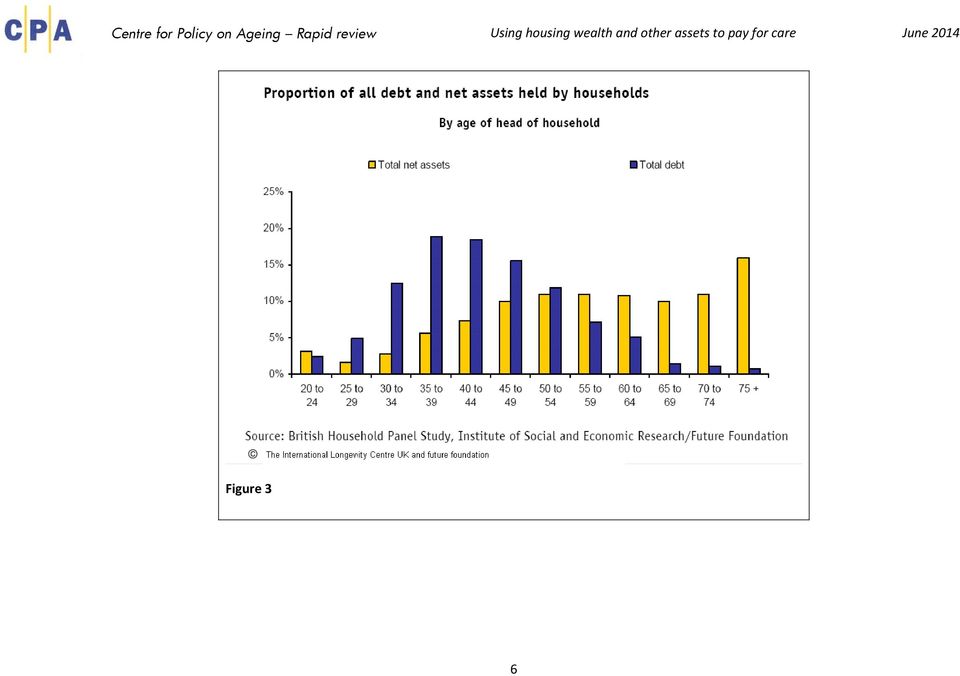
5 There is some evidence however that housing wealth inequality goes in cycles and the current upward trend in wealth inequality is neither inexorable nor inevitable. 7,8 In Great Britain in the period , older couples without dependent children had, on average, the highest levels of total household wealth and had seen the greatest increases in that wealth. [Figure 2] That older households have greater wealth and lower debt than younger households is confirmed by figures from the General Household Survey. 9 [Figure 3] Figure 2 7 Levin and Pryce (2011), The dynamics of spatial inequality in UK housing wealth 8 Levin and Price (2010), Delivering Changes in Housing Wealth Inequality 9 International Longevity Centre UK ILCUK (2003), Asset accumulation and lifestage 5
![wealth. [Figure 2] That older households have greater wealth and lower debt than younger households is confirmed by figures from the General Household Survey.](/docs-images/51/14507249/images/page_5.jpg "9 [Figure 3] Figure 2 7 Levin and Pryce (2011), The dynamics of spatial inequality in UK housing wealth 8 Levin and Price (2010), Delivering Changes in Housing Wealth Inequality 9 International")
6 Figure 3 6
7 There are however wide disparities in household wealth in older age with 11% of individuals aged 65 and over holding over 1 million in wealth and assets while 12% hold assets of less than 40,000. [Figure 4] Figure 4 7

8 Housing as wealth The UK is at the leading edge of a much wider trend towards mortgage enabled home ownership societies. Not only does owner occupation accommodate nearly 70 per cent of UK households, but governments are keen for this to increase 10. However, the level of home ownership shows significant regional variation and perhaps depends very much on differing local attitudes as well as underlying economic and societal factors. In Great Britain in , excluding London which is a special case with a large transient population and an exceptionally low home ownership rate of 61%, Scotland and the North East of England had the lowest home ownership rates at around 64 66% while the South East of England had the highest at around 75% 11. In former socialist countries, at the time of the return to capitalism, many governments passed their housing stock over to their residents at very low cost, creating high levels of home ownership. Figure 5 10 Smith and Searle (2008). Dematerialising Money 11 Black, ONS (2011), Wealth in Great Britain: Main results from the wealth and assets survey

9 However, within the former Czechoslovakia, the Czech Republic has home ownership levels of 59%, closer to those in adjacent Germany (43%), while Slovakia has home ownership levels of 81%, closer to those in adjacent Hungary (92%) 12. This is perhaps indicative of differing underlying economic factors and societal attitudes to home ownership even in areas with similar experiences. The housing wealth lifecycle The housing wealth of UK households is at its greatest in older age with older couples without children holding the greatest housing wealth. [ Figure 5] This skewing of housing wealth towards older age in the UK is driven by two main factors, the natural accumulation and decumulation of housing wealth over the lifecycle [Figure 6 and Table 2]and the huge rise in UK house prices since the 1970s and 80s [Figure 7]. Figure 6 12 Reifner et al (2009), Study on Equity Release Schemes in the EU Part I: General Report 9

10 Across the OECD, home ownership rates decline after age 60 but, when cohort effects are taken into account, ownership decline starts after age 70 with a 1% per annum decline after age In the decade between 2002 and 2013, house prices in the United Kingdom rose by 85% with prices in London and the North East of England each more than doubling in that same period, albeit from very different bases 14. Table 2 Figure 7 13 Chiuri and Jappelli (2010), Do the elderly reduce housing equity? An international comparison 14 ONS (2014), Wealth in Great Britain Wave 3,

11 A small proportion of older households continue to hold mortgage debt but this declines with age. 15 [Figure 8] Figure 8 The relationship between housing and health and levels of welfare expenditure Housing as a share of household wealth in older age differs across Europe with generally higher levels of home ownership in southern Europe and lower levels in northern Europe 16 [Figure 9] but there are also wide variations within regions indicating other, more localised, social and economic factors at work 12. In a 1980 thesis Kemeny conjectured that societies with higher levels of home ownership had lower levels of welfare expenditure. This idea was tested and confirmed by Castles 17 in 1998 and revisited and re confirmed by Kemeny 18 in PFRC (2013) The mortgage debt of older households and the effect of age 16 Lauridsen and Skak (2009), Demographic Change and Housing Wealth 17 Castles (1998), The really big trade off: home ownership and the welfare state in the New world and the Old 11
![levels of home ownership in southern Europe and lower levels in northern Europe 16 [Figure 9] but there are also wide variations within regions indicating other, more localised, social and economic](/docs-images/51/14507249/images/page_11.jpg "factors at work 12. In a 1980 thesis Kemeny conjectured that societies with higher levels of home ownership had lower levels of welfare expenditure.")
12 This inverse relationship, at the macro level, between levels of welfare expenditure and home ownerships is referred to in the literature as the big trade off. It has led to discussions about which is cause and which effect but it is likely that both are effect with a government and society that promotes home ownership, such as that of Margaret Thatcher in the UK in the 1980s, being also a government and society that drives down on welfare payments. At the micro level, several studies have demonstrated a two way relationship between home ownership and levels of health and wellbeing. Good health throughout life facilitates the ability to generate housing and other wealth while being a home owner is associated with better health and a lower likelihood of needing social care. 19 Figure 9 18 Kemeny (2005), The Really Big Trade Off between home ownership and welfare: Castles' evaluation of the 1980 thesis, and a reformulation 25 years on 19 McCann et al (2012), Why is housing tenure associated with a lower risk of admission to a nursing or residential home? 12

13 Using housing equity Housing is viewed differently from other assets 20. First and foremost the owner occupied dwelling represents a home. 20 Homeowners are reluctant to use housing wealth to supplement and support everyday consumption, preferring either not to use it at all or only as a last resort for emergency support later in life 21. Homeowners are just as likely to engage in equity borrowing episodes during periods of economic prosperity as they are during periods of decline with the most likely participants being lone parents with non dependent children and unemployed people. Housing tends to be used as a last resort once other forms of credit have been exhausted. 22 Equity extraction overall is not a function of higher incomes, greater wealth, and older age; rather it occurs across the life course and is linked to pressing spending needs. 23 Equity release schemes The purpose of Equity Release Schemes may be achieved by means of virtually any form of loan, lease or sale (second mortgages, overdraft credit, leases, sale and lease back or sale and move arrangements Products that are exclusively designed as Equity Release Schemes ( ERS) must (1) be a financial service; (2) be a source of liquidity for the future; (3) contain a strong entitlement to remain in occupation of the property; and (4) rely solely on the sale of the property for repayment/payment of the funds released. Payments take the form of a lump sum or regular income, and are either secured by means of a mortgage on the property or generated by an immediate sale. Under the Loan Model ERS, repayment is made from the proceeds of the sale of the property either on the death of the homeowner or when the property has been vacated for a specified period of time Elsinga et al (2010), Households Perceptions on Old Age and Housing Equity 21 Poterba et al (2011), The Composition and Draw down of Wealth in Retirement 22 Searle B (2011) Recession and housing wealth 23 Ong et al (2013), Channels from Housing Wealth to Consumption 24 Reifner et al (2009), Study on Equity Release Schemes in the EU Part I: General Report 13

14 Financial institutions were not fully trusted before the financial crisis, and the financial crisis reduced trust even further. Government related financial institutions (such as the Sparkasse in Germany) are regarded as more reliable institutions. Should governments wish to promote equity release options, non profit or government related financial institutions are likely to be more successful in doing so 25. Figure Elsinga et al (2010), Households Perceptions on Old Age and Housing Equity 14

15 There are two main types of equity release product available in the UK: lifetime mortgages and home reversion plans. Lifetime mortgages have been regulated by the FSA since 2004 and home reversions since Lifetime mortgages provide applicants with taxfree funds, either as a lump sum or regular payments, which are repayable when they die or exit home ownership (following entrance to a residential home for instance). If they move home, the loan can move with them. Drawdown loans, which allow customers to access an initial lumpsum and set a further amount which they can draw on as suits them over time, have become increasingly popular and now account for more than half of all lifetime mortgages. Most lifetime mortgages include a no negative equity guarantee, to ensure that the total amount owed is not greater than the sale price of the house. 26 Figure Williams P (2010) Home equity: accumulation and decumulation through the life cycle 15
. If they move home, the loan can move with them.")
16 Under home reversion plans, an individual sells up to a 100 per cent share of their home to a provider for a tax free lump sum and continues to live there rent free. The amount paid is based on a valuation below the market value of the property, typically between 35 per cent and 60 per cent. On death, or a move into a care home, the property is sold and the provider receives the value of the share of the home they own. Under some schemes, customers pay a small amount of rent to the provider in return for receiving a larger initial price. 26 The formal UK equity release market is dominated by lifetime mortgages. 26 Over one half of equity release products are taken out for uses that include home and garden improvement and over one third include paying off unsecured loans or taking a holiday. [Figure 11] Equity release has not been designed to help pay for residential care as the house is usually forfeited when it is no longer occupied, but equity release products can be used to help pay for domiciliary care. Universal Deferred Payment Scheme Since 2001, the Department of Health in England has operated a scheme to allow local authorities to pay the care home fees of individuals with total assets, including housing assets, of over 23,500 and who would therefore have been liable for their own care home fees (self funders). The authority is then repaid following the eventual sale of the housing asset. The scheme was discretionary and variable in its implementation with, for example, some authorities only allowing the deferment when cash assets were less than 23,500.Take up rates in different authorities varied from less than 1% of new self funders to a maximum of 40% 27. [ Figure 12] The Care Act 2014 introduces, from April 2015, a universally available local authority based deferred payments scheme which, subject to regulations still being finalised, offers deferred payment on residential care fees of up to 70% 80% of the value of the resident s main home at an interest rate in the range 3½% 5% and subject also to administration fees but in a way potentially compatible with Sharia law. The deferred payment scheme will only apply when a residents other assets, excluding the main home, do not exceed 23,250 and the care home fees paid in total will not exceed the cap of 72,000 plus hotel fees of around 12,500 per year. 27 Department of Health (2013), Universal deferred payment scheme Impact Assessment 16

17 Figure 12 17

18 Housing as inheritance In the United Kingdom inheritance plays an important part in many peopleʼs lives but has not generally become entrenched as an expectation or a duty. Most older people are willing to use their assets for themselves, rationally using some of their lifetime assets to meet their own needs in later life. People over 80 are least likely to prioritise their own needs over bequeathing but even among this group, a majority intend to enjoy life rather than worry about inheritance. 28 Households buy housing for a number of reasons. Householders tend to buy when they can afford to, often because it is seen as cheaper than renting, however, in most countries (except Hungary), the consideration of inheritance is not a major factor at the time of house purchase, nor is retirement planning (except in Germany). 29 The distribution of inheritance mirrors the distribution of wealth more generally, with those in the middle starting to benefit from inheritance for the first time but those at the bottom receiving nothing and so falling further behind. Better off families not only pass on financial capital to future generations but also other forms of capital: human, social, and cultural. This also contributes to wide inequalities of life chances. 30 Britain is not yet a nation of inheritors, in part because the large cohort of new home owners from the 1970s and 1980s are living longer than predicted and will not pass on their wealth for some time. 30 Using housing assets to pay for care Older people would prefer not to use their hard won housing assets to pay for long term care but, given the unacceptability of a pooled system to pay for all long term care, either from general taxation or, for example a compulsory up front insurance premium of 15,000 on retirement or a death tax, 20,000 taken from the estate after death, a scheme to pay for long term care as the need arises is necessary. Housing assets are of increasing value for many older people and therefore forma tempting target for government policy. Private equity release products, as currently set up, are not in general well trusted or able to pay for residential care, so the provisions of the Care Act 2014, a cap on overall care costs and a universal deferred payment scheme, look to be the most acceptable way forward. 28 Rowlingson and McKay (2005), Attitudes to inheritance in Britain 29 Elsinga et al (2010) Households Perceptions on Old Age and Housing Equity 30 Appleyard and Rowlingson (2010) Home ownership and the distribution of personal wealth : a review of the evidence 18

19 Review of the literature Page a) Wealth overviews and the wealth lifecycle 20 b) Wealth inequality 27 c) Housing as wealth 32 d) Releasing equity from housing wealth 35 e) Attitudes to housing, wealth and the release of equity 43 f) Inheritance 50 g) The relationship between health and wealth and the trade-off between home ownership and welfare provision h) Housing and wealth as contributors to the funding of long term care i) International and comparative studies 66 j) Statistical sources 74 References 76 Within each section, the reviewed literature is listed in reverse chronological order with the most recent publication first. 19

20 a) Wealth overviews and the wealth lifecycle Study Hills J, Bastagli F, Cowell F, Glennerster H, Karagiannaki E, and McKnight A (2013) Wealth in the UK: Distribution, Accumulation, and Policy, Oxford University Press : 256pp Findings This book examines key issues connected with the distribution of personal wealth in the UK and why wealth is now such an important factor in social differences and public policy. It presents recent information on current wealth inequalities and a discussion of trends in the distribution of wealth. It compares wealth inequalities in the UK with the USA, Canada and Sweden, using longitudinal data to examine trajectories in wealth accumulation over the decade to 2005 and inequalities in inheritances over the same period. It looks at how parental wealth levels and people's asset-holdings early in adulthood affect outcomes later in their lives. Finally looks at the way in which policies towards wealthholding developed historically, and the contradictory ways in which a wide range of public policies relate to people's wealth levels, including through taxation, means-testing, and the encouragement of saving, and discusses what the key issues for policy towards wealth and wealth inequalities now are. Personal wealth in the UK totalled 5.5 trillion by 2010 ( 9-10 trillion if occupational pension rights are included). Inheritance flows are now equivalent to 4 per cent of national income each year. All households in the wealthiest tenth have more than 75 times the wealth of any of those in the bottom tenth. Absolute differences in wealth levels have increased substantially over the last 15 years, so wealth differences represent many more years of income than in the past. This makes them of great importance to life chances. 20

21 Bastagli F and Hills J (2012) Wealth accumulation in Great Britain : the role of house prices and the life cycle, London: ESRC Centre for Analysis of Social Exclusion - CASE, Suntory- Toyota International Centres for Economics and Related Disciplines - STICERD, London School of Economics and Political Science : 30 pp (CASEpaper 166) This paper examines trends in the distribution of household wealth in Great Britain from 1995 to 2005 using the British Household Panel Survey (BHPS). The data show that wealth is very unevenly distributed, and reveal a widening absolute gap over the period between wealthier households and those with no or negative wealth. However, in relative terms, wealth grew fastest for households in the middle of the distribution; and inequality measured by the Gini coefficient decreased. This mainly reflected housing wealth becoming a greater share of total net worth, more equally distributed, and the highest percentage increase in housing wealth taking place in the middle of the distribution. To estimate the distributional impact of the remarkable rise in house prices which defined this period, the authors simulate the distribution of net 2005 wealth in the hypothetical scenario in which house prices remained at their 1995 levels in real terms. They find that the reduction in wealth inequality is almost entirely accounted for by changes in house prices. The paper also finds that, controlling for factors such as age, households that gained most from the house price boom were mortgagors, in particular those that were initially wealthier, and were advantaged in other ways such as by level of educational qualification. The house price boom also masked what might have been expected to be the life cycle pattern of wealth accumulation followed by decumulation. At actual house prices, all age groups substantially increased their mean and median wealth as they aged between 1995 and 2005, including older ones. For the same age groups, the gains were remarkable. For instance, median wealth grew from 73,000 to 190,000 for households initially aged Within this, absolute gains were larger for those who were initially the most wealthy, but proportionate gains largest for the least wealthy groups. However, if house prices had remained at their real levels of 1995, mean wealth for the panel of households would have grown much less by only 8 per cent and there would have been a much clearer life cycle pattern, with the age groups initially aged having unchanged real wealth and the older groups lower wealth in 2005 than they had in If one abstracts from rising house prices, it is initially the wealthiest over-60s who would have been dissaving most the wealthiest quarter drawing down nearly 10,000 per year on average as it is they that have significant assets they could run down in retirement. Households that experienced the highest wealth gains over the period (at actual 2005 prices) are mortgagors and those that are more highly qualified. For instance, those initially aged with degrees increased their mean wealth by 196,000 (at actual house prices), compared to 72,000 for those with qualifications below O-level. Even without the house price boom, those with degrees would have been wealthier by 56,000, but those with low qualifications only 9,000 wealthier. 21
22 Lowe S G, Searle B A and Smith S J (2011) From Housing Wealth to Mortgage Debt: The Emergence of Britain s Asset-Shaped Welfare State, Social Policy & Society 11 (1) : Rowlingson K and McKay S D (2011) Wealth and the wealthy: Exploring and tackling inequalities between rich and poor, Policy Press The banking crisis of revealed how important housing, especially home ownership and the institutional structures of the mortgage market, has become to welfare state change. Securitisation of mortgages created a new circuit of global capital, while national mortgage markets became the conduit through which home owners were connected to this wave of globally sourced capital. In the UK, equity stored in owner-occupied property became much more fungible because of the very open/liberal mortgage market. As a result home owners began to bank on their homes using it not only for consumption but increasingly as a financial safety net, a cushion against adversity and a means for securing access to privately supplied services and supporting their family s welfare needs across the life-course. This welfare state change a move towards asset based welfare was historically and today remains underpinned by the emergence of the UK as a home-owning society. This book draws on new data on wealth to answer the following key questions: What is wealth? Who has got it? Where might we draw a 'wealth line'? Who lies above it? And what might policy do about wealth and the wealthy? Using data sources from the HMRC to the Sunday Times Rich list, this book provides a comprehensive and critical discussion of these issues, and looks at potential policy responses, including 'asset-based' welfare and taxation. The books looks at: Why wealth matters; Why the wealthy matter; What is wealth and who are the wealthy; The distribution of wealth; The rich, the richer and the richest; Towards a comprehensive policy on assets; Social policy and the wealthy 22
23 Williams P (2010) Home equity: accumulation and decumulation through the life cycle, London: The Resolution Foundation (electronic format) : 46 pp A considerable number of households, including some of those on lower incomes, own their homes outright, others are in the process of buying them. Over time they may need to draw down on the store of wealth represented by that home. This report considers how the flows of households into home ownership have been changing, reflecting a range of factors but including increased affordability pressures, and how they might change in the future. The report examines how households currently access the wealth that has been built up in those homes. What is quite clear is that there are a variety of routes for extracting that wealth, most obviously trading down and remortgaging for equity withdrawal. Formal equity release is perhaps one of the less significant channels at present. We are at an important crossroads regarding both the future of home ownership in England and the UK and the role of property as a vehicle for accumulation and decumulation. Although the government has not formally abandoned its aspiration to get home ownership in England up to 75 per cent, the target. is being reconsidered alongside other policy. Future policy is likely to offer a more balanced view of tenure, with a greater emphasis on private renting. There is a real possibility that without more radical policy interventions we have now seen the peak of the proportional size of the home ownership market in England and the UK. 23
24 Banks J, Crawford R and Tetlow G; Department for Work and Pensions - DWP; Institute for Fiscal Studies - IFS (2010) What does the distribution of wealth tell us about future retirement resources? a report of research carried out by the Institute for Fiscal Studies on behalf of the Department for Work and Pensions, London: Department for Work and Pensions - DWP : 90 pp (Department for Work and Pensions Research report 665) This paper examines the cross-sectional distribution of household wealth holdings from the first wave of the Wealth and Assets Survey (WAS) from the perspective of a 'life cycle' model of saving behaviour. Rather than just document differences across the population in their raw form, the analysis is aimed at using evidence from both the initial WAS report and the WAS microdata itself to illustrate what the distribution of pension wealth and other forms of wealth can tell us about the level of, and uncertainty about, future retirement resources. With many of the households still years away from retirement and with only one cross-sectional observation of wealth holdings for each household, the researchers are cautious of inferring too much from just one wave of data. Low education households (that is, those households headed by someone with no educational or vocational qualifications) tend to hold very low levels of wealth. Half of low education households aged between 25 and 54 have net wealth of no more than about 25,000 per adult in the household. In contrast, the majority of high education households (that is, households headed by someone with qualifications at degree level or above) aged close to retirement hold far higher levels of private wealth: 83 per cent hold more than 191,000 per adult in the household (including housing wealth). Mid-education households (headed by someone with below degree level qualifications) hold, on average, higher levels of wealth than low education households but less than high education households. Among the groups of mid-education households, renters and single parents are more likely to have low levels of wealth, while households with multiple earners are more likely to have high wealth holdings per adult in the household. Household wealth holdings (both gross and net) are lowest amongst the youngest households and highest amongst households close to retirement, before falling again after State Pension age, consistent with the idea of lifecycle saving. This hump shaped pattern is particularly pronounced among the most highly educated households. Median wealth levels vary less by age among the mid-education group, and less still in the low education group. 24
25 Boreham R and Lloyd J; National Centre for Social Research - NatCen; International Longevity Centre UK - ILC UK (2007) Asset accumulation across the life course: a report of research carried out by the National Centre for Social Research on behalf of the International Longevity Centre - UK, London: International Longevity Centre - ILC-UK : 35 pp Asset accumulation across the life course' explores changing patterns of asset holding among different age cohorts in the UK. It uses British Household Panel Survey (BHPS) data from 1995, 2000, 2004 and 2005, which included detailed questions about household finances. Net household income broadly increased for all age groups between 1995 and 2004 over and above inflation. Overall, households were less likely to be contributing to a private pension in 2005 than in For example, 26% of year olds contributed to a pension in 1995 compared with 13% of year olds in For younger age cohorts, there was very little change in their mean net household liquid assets between 1995 and For example, year olds had net liquid assets of 20,345 in 1995, and the assets of this group in 2005 (when they were aged 55-64) were 20,571. In contrast, there was some evidence that older cohorts were better off in 2005 than their counterparts had been ten years previously. Those aged in 1995 had net assets of 30,135 in 1995 and of 39,600 in 2005 (when they were 65-74). All age cohorts increased their mean net illiquid assets over time, and were better off in 2005 than their counterparts had been in For example, those aged in 1995 had mean household illiquid assets of around 9,000 (adjusted to 2005 rates), which had increased to around 95,000 by 2005 when they were aged All groups increased the total net mean assets over time. For example, those aged in 1995 had total net assets of around 13,000, which had increased to around 103,000 in 2005 when this group was Increases were proportionally greater in the younger age groups. Comparing those aged and those aged in 1995, these groups had mean total net household assets of around 13,000 and 42,000 in 1995 and these had increased to around 103,000 and 158,000 respectively by Thus, in 1995 the older group had three times the amount of net assets, but only 1.5 times the amount of net assets in Overall there has been an increase in the proportion of net assets that are illiquid in all groups between 1995 and 2005, particularly among those aged In 1995, among those aged 25-34, only 12% of their total net household assets were illiquid, and this increased to 73% among this group by 2005 (when they were 35-44). Comparing the top wealth decile and the mean, there was an overall decrease in inequality between 1995 and For example, in 1995 the top decile of year olds had 4.4 times the mean net assets of all year olds, but the equivalent factor for year olds in 2005 was 3.3 times 25
26 Lloyd J; International Longevity Centre UK - ILC UK (2007) Asset accumulation in focus: the challenges ahead, London: International Longevity Centre - ILC-UK : 35 pp This policy report is based on, and responds to, research published simultaneously by ILC UK entitled 'Asset accumulation across the life course' by Richard Boreham and James Lloyd. Significant increases in net wealth have been experienced by older cohorts in retirement, in contrast to the common presumption that retirement is a time when assets are gradually run-down. These increases in wealth have resulted from rising property prices and suggest that despite objections to the use of means-testing toward older people in principle and in practice, the Government should continue defending this principle, while simultaneously improving the mechanisms involved. Furthermore, the Government should review the case for extending the use of means-testing in further welfare transfers to older people. The report says The increasing value of mortgages held by the young and the rising property wealth of older cohorts indicate a transfer of wealth has taken place: the current and future income and wealth of younger cohorts has been transferred to older age groups in the form of illiquid property wealth. The magnitude of this transfer poses a risk to the principle of intergenerational solidarity that underpins various functions of the state, such as the NHS and state pension. A new language of wealth inequality is required to cope with these changes and enable public debate and discussion. The Government should focus on protecting intergenerational solidarity in society, in particular, by exploring how societal risk sharing in public policy can take place across cohorts, rather than between the generations. International Longevity Centre UK - ILCUK (2004) Asset accumulation and lifestage - an analysis of the wealth of households as they approach and pass the retirement age, Electronic format : 25 pp Patterns of asset accumulation leading up to and through retirement by UK residents are explored using the British Household Panel Survey (BHPS). Wealth is distributed in a very unequal way. Some people are super rich and many have few if any assets at all and such polarisation has, indeed, increased over the last few decades. In 1986, the most wealthy 5% of the population owned 36% of total personal wealth and by 2000 this had increased to 42%. But how much this inequality represents pure wealth polarisation across the life course (once people become rich either at birth or at some early point in life they stay rich) and how much it denotes a planned build of assets in preparation for retirement is unclear. This is because we know very little about asset accumulation and planning since micro data on assets and savings has not been available until very recently. 26
27 b) Wealth inequality Study Turner A (2014) Wealth, Debt, Inequality and Low Interest Rates: Four Big Trends and Some Implications, Cass Business School Findings A lecture by Adair Turner at Cass Business School outlining... Increasing inequality. The bottom 20% of US earners have received no real wage increase since 1980: the top 1% have enjoyed a tripling of real income. In other economies the trend is not so extreme: but the direction is almost universal. Increasing wealth relative to income. As the French economist Thomas Piketty puts it "wealth is back". In the 18th and 19th century, total accumulated wealth was about 600% of national income: that fell to around 300 to 400% by the mid-20th century. It has returned to around 600% in many advanced economies. Increasing private sector leverage. A calculation taken from Carmen Reinhart and Kenneth Rogoff of private sector debt as a % of GDP in 22 advanced economies. It rises continuously from 50% in the early 1950s to 170% on the eve of the crisis. And leverage is now rising very rapidly in many emerging economies, most dramatically in China. 27
28 Cowell F A, Karagiannaki E and McKnight A (2013) Accounting for cross-country differences in wealth inequality, London: ESRC Centre for Analysis of Social Exclusion - CASE, Suntory- Toyota International Centres for Economics and Related Disciplines - STICERD, London School of Economics and Political Science : 35 pp (CASEpaper 168) The differences between countries wealth distributions cannot be explained away by differences in age, working status, household structure, education and income. But, taking these factors into account, some wealth inequality comparisons turn out as one might have expected. For example, the US is unambiguously more unequal than the UK which is more unequal than Italy. Two main components of net worth are particularly important. Housing is the largest asset that most households will ever hold. Homeownership rates are similar across four of the five countries at around 70% but Sweden stands out as having relatively low rates at 57% (2002). Housing supply in Sweden is relatively constrained in the large urban areas where there is high demand and the Swedish housing system is quite complex and idiosyncratic. Around one-third of owner occupied homes (effectively all owner occupied apartments) are in what is known as the tenantowned co-operative sector which appears to create a number of market distortions (European Housing Review, 2011). Also the recently abolished wealth tax and a higher average property tax rate may have created some disincentives to acquire and accumulate housing assets. Italy also stands out with much higher rates of outright homeownerships (62%), explained partly by cultural differences (later age of household formation, greater parental assistance with house purchase, multi-generational households, attitudes to debt) and institutional differences (access to credit). This contributes to positive and relatively high rates of net worth among Italian households particularly in the lower and middle parts of the net worth distributions. Debt holdings give rise to much of the wealth inequality differences across countries. Italy has lower financial debt as well as housing debt. The fact that the Swedish data additionally include householdheld business debt contributes to the higher debt holding found in Sweden. American households are the most likely to hold financial and housing debt and the average value of these debts is greater. In addition, debt-holding is comparatively more common in later life. We have shown cross country differences in educational loans both in their incidence and their average value; explaining all of the difference in wealth inequality between the US and Sweden. Cultural and institutional differences in relation to debt holdings result in greater unobserved country effects than for other wealth components. 28
29 Personal Finance Research Centre (PFRC), University of Bristol; International Longevity Centre UK - ILC-UK (2013) The mortgage debt of older households and the effect of age: an analysis using the Wealth and Assets Survey , London: International Longevity Centre UK : 12 pp Norris M and Winston N (2012) Home Ownership and Income Inequalities in Western Europe: Access, Affordability and Quality - GINI Discussion Paper 41, As people aged 50+ get older, they are less likely to have a mortgage, and the amount they owe decreases. However, 21% of all households headed by someone aged 50+ had outstanding mortgage borrowing on their main home in Among the over 50s with outstanding mortgages, the mean average owed was 62,200; and 13% of all older mortgaged households were struggling to repay their mortgage. This report examines research on three key areas: the effect of age in predicting mortgage borrowing in older households; the relationship between age and heavy mortgage borrowing; and the likelihood of older mortgaged households having difficulties in meeting their monthly mortgage payments. The data for 1997 reveal that home ownership rates were higher in countries with higher income inequality such as Spain, Greece, Italy, the UK and Ireland, and lower in more equal countries such as France, Sweden, Austria, Germany and the Netherlands. By 2007 home ownership rates had risen in the latter group of countries as had income inequality, albeit more modestly, while home ownership rates stagnated or declined in the former group and income inequality also declined in most of them. Broadly speaking therefore, this indicates that, in the case of Western Europe, home ownership is higher in more unequal countries and it tends to expand with rising income inequality. The data also reveals that in 1997 home ownership was relatively low among low income households in the more equal countries (e.g. France, Germany, the Netherlands, Sweden and Denmark) and higher in more unequal countries (Spain, Greece and Italy). The 2007 data reveals that the stagnation in home ownership rates in these more unequal countries where this tenure was traditionally dominant was driven in large part by a decline in the proportion of low income households in the tenure. income inequality declined in each of these countries with the exception of the UK where it remained static. By contrast, a marked rise in low income home owners drove the rise in the total home ownership rates in the more equal and traditionally rental dominated countries such as the Netherlands, Sweden, Denmark and Germany. Income inequality also increased in each case. These data suggest that access to home ownership for low income households is positively correlated with wider income inequality and that access improves as inequality rises and vice versa. The preceding analysis also indicates that home ownership is less affordable for low income households in more unequal countries and that, in most cases, affordability increases in line with increasing equality and vice versa. 29
30 Levin E J and Pryce G (2011) The dynamics of spatial inequality in UK housing wealth, Housing Policy Debate 21 (1) : Resolution Foundation (2010) Behind the balance sheet - the financial health of low earning households, London: The Resolution Foundation (electronic format only) : 42 pp This paper investigates the dynamics of spatial inequality in gross housing wealth in the UK. The results challenge recent research findings in the UK that suggest inexorable rises in housing wealth inequality. The authors argue that such findings are illusory, arising in part from the use of final period price levels to categorize areas into low and high house price locations. We use Monte Carlo simulations to illustrate the bias that final period categorization introduces and we then estimate how gross housing wealth inequality changes over time using a battery of measures. All our results indicate that there is evidence of cycles in housing wealth inequality but no evidence of an upward trend. Most surprisingly, the cycles in inequality are found to be of very large amplitude and this may have important effects on consumption, work incentives and business formation. We also find that the entire distribution of house values has shifted which is likely to imply a growing gulf in housing wealth between owners and renters over the period considered. This report offers a fresh set of findings about how low earning households think about their money and make financial decisions. It uses current statistics, to find for example, that for the 14 million low earning adults living in 7.2 million households in the UK, housing, fuel, power and food account for around 26% of disposable income compared to 15% for high earners. However, the figures do not elaborate on the factors that drove financial decisions in these households. The report presents a statistical overview of the current financial health of low earners. It uses qualitative research to offer individual case studies, which highlight themes that cut across all the households met, one such being that small changes in circumstances can be very destabilising. It goes "behind the balance sheet" to capture the sometimes invisible factors that affect how people think about their money and manage their finances, such as hidden assets and liabilities, and participation in the informal economy. Three foundations are suggested for improving financial health and bringing about financial inclusion: resilience, behavioural economics, and financial capability 30
31 Levin E and Price G (2010) Delivering Changes in Housing Wealth Inequality, Department for Communities and Local Government Orton M and Rowlingson K (2007) A problem of riches: towards a new social policy research agenda on the distribution of economic resources, Journal of Social Policy 36 (1) : Denton M and Boos L (2007) The gender wealth gap: structural and material constraints and implications for later life, Journal of Women and Aging 19 (3/4) : Recent research has suggested a strong upward trend in housing wealth inequality in the UK with high house price areas growing in value at a faster rate than housing in low priced areas. This report investigates whether this finding is dependent on the particular research methods used or whether it reflects a genuine trend. The report examines changes to housing wealth inequality using a variety of measures based on large samples (around a million observations a year are used in the house price distribution calculations, for example). Land Registry data from 1996 to 2006 and building society data from 1981 to 2003 are employed to compute a detailed and continuous picture of housing wealth inequality. Taken together, the results suggest a cyclical pattern in housing wealth inequality over the long term (1981 to 2006), with inequality falling in the most recent phase of that cycle (2000 to 2006). The authors argue that it is time for social policy to move away from a narrow focus on poverty to consider the broader issues of inequality between different groups in the economic distribution, and, by implication, the position of better-off citizens. This raises a number of conceptual challenges, due to the current lack of consideration of wealth and inequality at a political, theoretical or empirical level. This article discusses the challenges, and concludes by outlining a possible research agenda. However, the underpinning argument is that social policy needs to develop a broader understanding of the economic distribution. This presentation documents the extent of gender inequality in wealth for Canadian women and men aged 45 and older. The analysis uses data from the 1999 Canadian Survey of Financial Security, a large nationally representative survey of household wealth in Canada. Wealth is measured by total net worth as measured by total assets minus debt. The authors test two general hypotheses to account for gender differences in wealth. The differential exposure hypothesis suggests that women report less wealth accumulation because of their reduced access to the material and social conditions of life that foster economic security. The differential vulnerability hypothesis suggests that women report lower levels of wealth because they receive differential returns to the material and social conditions of their lives. Support is found for both hypotheses. Much of the gender differences in wealth can be explained by the gendering of work and family roles that restrict women's ability to build up assets over the life course. But beyond this, there are significant gender interaction effects that indicate that women are further penalised by their return to participation in family life, their health and where they live. When women do work, net of other factors, they are better able to accumulate wealth than their male counterparts 31
32 c) Housing as wealth Study Searle B (2011) Recession and housing wealth, Journal of Financial Economic Policy 3 (1) : Williams P (2010) Home equity: accumulation and decumulation through the life cycle, London: The Resolution Foundation (electronic format) : 46 pp Doling J and Ronald R (2010) Home ownership and asset-based welfare, Journal of Housing and the Built Environment 25 (2) : Findings The purpose of this paper is to explore the changing role of housing wealth from an investment vehicle to a welfare resource. It also considers the implications of economic prosperity and decline in the UK on homeowners, intentions of equity withdrawal, and the consequences of managing household budgets. The paper takes the form of a quantitative longitudinal analysis of national data and panel survey, including random effects logistic regression model. Findings Housing wealth is increasingly being used as a financial safety net across the life course. Homeowners are equally likely to have engaged in equity-borrowing episodes during periods of economic prosperity as they are during periods of decline; particularly, lone parents with non-dependent children and unemployed people. Housing tends to be used as a last resort once other forms of credit have been exhausted. See: Wealth overviews and the wealth lifecycle section (above) This article highlights three core issues of home ownership and asset-based welfare. First is the interaction between housing, pensions, employment and welfare institutions and practices. These combinations shape not only the effectiveness of housing-asset-based welfare but also the scale and directions in which the overall system can be developed. Second are the differences in home ownership systems, including housing markets, housing stock, housing finance and equity release, home building and purchase practices. Differences in these dimensions may inhibit or enhance the potential of housing as an asset. A third issue concerns the features of ageing populations and their relative wealth, housing or otherwise, in relation to both other generations and within the cohort. An emergent feature of asset-based welfare systems is the divide between different generations of home buyers whose relative market advantage can disadvantage those who follow. 32
33 Appleyard L and Rowlingson K (2010) Homeownership and the distribution of personal wealth : a review of the evidence, Joseph Rowntree Foundation This paper outlines the role that housing wealth plays in the overall distribution of wealth in the UK; explores the growth in, and distribution of, housing wealth in the past few decades; and considers the potential role housing wealth might play in improving the welfare of retired households and the role of inheritance and lifetime gifts on the inter-generational distribution of wealth. Key findings include: Owner-occupied housing has become increasingly expensive relative to earnings but some lenders practices have enabled first-time buyers and those on low incomes to enter the housing market in recent years. Low interest rates also affect affordability; There are great inequalities in overall wealth, with the top 10 per cent owning more than 100 times the wealth of the bottom 10 per cent; Housing wealth is spread very unevenly in Britain, though less so than private pension wealth or financial wealth; The gap between the housing haves and the housing have-nots is increasing even if some people in the middle have increased their share of wealth by becoming home-owners. Home-ownership undoubtedly provides many financial and other benefits. But there are also extra costs associated with home-ownership, such as repairs and maintenance, which people in rented accommodation do not face. Such costs may be difficult for older people on low incomes to cover; People already withdraw equity in a range of ways (e.g. moving to a cheaper property and/or selling and renting). Equity release schemes could also provide people with additional resources to pay for repairs/maintenance and generally increase living standards but very few people use such schemes at the moment due to concerns about them. The current system of funding for long-term care means-tests people s capital, including their housing wealth. While only a small proportion of the population use residential care, the number is likely to rise and the system is widely perceived as unfair; The role of housing wealth in relation to welfare needs to be considered alongside other forms of welfare support. If income from pensions was higher then there would be less need for people to withdraw equity from their homes to raise their living standards. The distribution of inheritance mirrors the distribution of wealth more generally, with those in the middle starting to benefit from inheritance for the first time but those at the bottom receiving nothing and so falling further behind; Better-off families not only pass on financial capital to future generations but also other forms of capital: human, social, and cultural. This also contributes to wide inequalities of life chances; Inheritance tax is unpopular but could be reformed and then used to reduce inequalities of inherited wealth. 33
34 Malpass P (2008) Housing and the new welfare state: Wobbly pillar or cornerstone?, Housing Studies 23 (1) : 1-19 Beal D J (2001) Use of housing wealth by older Australians, Australasian Journal on Ageing 20 (3) : This paper is concerned with the question of how to depict the current housing-welfare state relationship. It begins with a discussion of how housing can be seen as both the wobbly pillar under the welfare state and a cornerstone. The paper then examines two different perspectives, variously giving explanatory weight to economic and cultural factors. The first, derived from the work of Michael Harloe, provides an explanation of the tendency of social housing to move towards a residual role, but has nothing to say about the growing significance of housing markets and housing wealth in relation to the contemporary welfare state. The second, originated by Jim Kemeny, is based on international correlations of homeownership rates and levels of welfare state expenditure. It is argued that this approach has limited, and diminishing, relevance in the context of the early 21st century. The paper suggests that in the present period housing, especially the housing wealth of owner occupiers, provides governments with the opportunity to pursue welfare restructuring. This idea is explored by reference to evidence from Great Britain, a country with a high level of homeownership and an active programme of public service reform. Australians have long skewed their investment portfolios towards personal housing with the rate of owner occupation being one of the highest in the world. Some 85% of over 65s in Australia own their own houses, and the wealth represented by housing constitutes 50% of assets held by the household sector. However, housing wealth is not generally being realised to fund more comfortable retirements. This paper reports a preliminary study - based on a random sample of Australians from two electorates - into current community attitudes towards using housing wealth more "wisely" in retirement. About half of the surveyed home-owners indicated that they would be willing to use their housing wealth to fund more comfortable retirements. Only a small proportion - predominantly the age group - reported a desire to leave their homes as legacies to their children. Community attitudes and government policy in the past have mitigated against the use of housing wealth to fund more comfortable retirements. However, community attitudes appear to be changing slowly. Governments, too, are starting to amend inconsistent policy and to remove impediments. 34
35 d) Releasing equity from housing wealth Study Ong R, Parkinson S, Searle B A, Smith S J and Wood G A (2013) Channels from Housing Wealth to Consumption, Housing Studies 28 (7) : Findings This paper uses micro-data from two national panel surveys to analyze the flow of wealth from residential property onto households' balance sheets, where it is available for discretionary spending. The examples are Australia and the UK two of the world's most entrenched nations of owner occupation, both with relatively complete mortgage markets. The focus is on the early 2000s, which set the scene for an unprecedented wave of housing equity withdrawal. Equity released is considered through sales and through additional borrowing. The findings show that equity extraction overall is not only (or even) a function of higher incomes, greater wealth, and older age; rather it occurs across the life course and is linked to pressing spending needs. Attention is drawn in particular to the growing social and economic significance of in situ equity borrowing a practice whose financial buffering effects may form a short-lived prelude, rather than a sustainable alternative, to trading on or selling up. 35
36 Housing and Finance Working Group (2013) Department of Health Steering Group - Housing and Equity, The DH housing and finance working group was composed of key, well-informed, stakeholders including AgeUK, ILC-UK, Aviva, Scottish Widows, Zurich and the Equity Release Council. Key findings included: The Equity Release (ER) market has significantly developed in the last decade. It is widely used for a variety of purposes by individuals, including domiciliary care. However, ER products require the property is sold when an individual enters residential care; this currently excludes ER as a product to pay for residential care; Whilst ER can provide for domiciliary care, the Universal Deferred Payments Scheme (UDPS) focuses on providing for residential care and in principle the two do not directly compete. However to allow individuals flexibility to choose to have both products, both ER providers and local authorities need to work together to develop a common framework (e.g. Ensuring UDPS is not unduly declined if ER has already been used; Homeowners in care often need help to manage their property. This may also be crucial to prevent dilapidation if ER or UDPS has been used. Services which exist may not be accessible to people and there is a need for advocacy and co-ordination. Local authorities should work with industry and NGOs to develop this; Planning for long term care needs to become part of financial life-stage planning with people addressing the need to plan earlier. Wider communication and promotion on options for consumers, with pan industry and Government involvement, is required; A common advice framework is required, with regulated advice potentially required for all individuals (particularly self-funders) with the local authority playing a key role. A consistent regulatory regime for all financial products being used to pay for care is also required; The nature of these issues requires a long term and sustainably policy and regulatory framework. As part of this, a favourable outcome of Solvency II debate is needed to ensure competitive ER products remain available. 36
37 Burgess G, Monk S and Williams P (2013) Equity release amongst older homeowners, Cambridge Centre for Housing and Planning Research Equity release in its broadest sense has been defined as converting housing wealth into liquid assets. It includes downsizing, moving out and renting, taking an interest only mortgage, taking out a sale and rent back scheme among others The main ways of releasing housing equity are either by selling a property and moving home or by withdrawing housing equity in situ, i.e. without moving home, using equity release products. People can access the equity in their homes through a number of methods, such as: trading down by selling their current home and moving either to a smaller, less expensive property in the same area or a similar property in a less expensive area; selling and moving into rented accommodation; or borrowing against the value of their home through: Extending an existing mortgage on a property; Taking out a lifetime or interest roll-up mortgage in which no payments are made until the person dies (this is an equity release scheme); Selling a share (or all) of the property to an equity release company. This form of equity release scheme is referred to as a home reversion scheme; or Selling a share of the property to a member of the family. Whilst downsizing may financially be better value than using equity release products, there are a number of constraints on the housing options of older people which can restrict their choices and make finding appropriate housing solutions difficult. For example, trading down/downsizing to release equity can be difficult because of a lack of affordable and desirable properties to move to. Evidence shows that appropriate housing prolongs independence and reduces the need for care homes, and that more people would downsize if there was better information and advice about the options and support with the move and if we had more attractive and affordable options in general and more high quality specialist housing for people to move to. There is a limited supply of specialist accommodation for older people and it is often relatively expensive, meaning that selling an existing property may not release sufficient funds to purchase specialist market housing, such as Extra-Care. If moving home is not suitable or possible, people may have to look to alternatives such as using equity release products. 37
38 Poterba J M, Venti S F and Wise D A (2011) The Composition and Draw-down of Wealth in Retirement [NBER Working Paper No ], Cambridge, MA: National Bureau of Economic Research This paper presents evidence from the USA on the resources available to households as they enter retirement. Even if households used all of their financial assets inside and outside personal retirement accounts to purchase a life annuity, only 47 percent of households between the ages of 65 and 69 in 2008 could increase their life-contingent income by more than $5,000 per year. At the upper end of the wealth distribution, however, a substantial number of households could make large annuity purchases. The paper also considers the role of housing equity in the portfolios of retirement-age households, and explores the extent to which households draw down housing equity and financial assets as they age. Many households appear to treat housing equity and non-annuitized financial assets as precautionary savings, tending to draw them down only when they experience a shock such as the death of a spouse or a period of substantial medical outlays. Because home equity is often conserved until very late in life, for many households it may provide some insurance against the risk of living longer than expected. The typical household with a head aged 65 to 69 has total non-annuitized wealth of about $220,000. About 80 percent of these households are homeowners, and primary home equity accounts for the largest share - roughly 30 percent - of non-annuitized wealth. There are considerable differences in asset holdings across households, especially for financial assets. While the typical household has total financial assets (both inside and outside PRAs) of just $52,000, households at the 90th percentile of financial asset holdings have over $700,000, or more than 13 times as much. For home equity, households at the 90th percentile have about five times as much wealth as the median household ($585,000 vs. $120,000), while the equivalent ratio for Social Security wealth is only two ($643,000 vs. $315,000). The authors show that there is little use of home equity early in retirement to support consumption or purchase other assets or annuities; rather, households tend to hold home equity until they experience a traumatic event such as one spouse's death or entry into a nursing home. For non-housing assets, singles and couples who do not experience death or divorce tend to have constant or slightly rising assets from one survey wave to the next, while couples that do experience one of these events see their assets drop sharply. Exploring linkages between health and wealth, the authors find that there is a strong correlation between these factors, not only at given point in time but also in how they evolve over time. Specifically, the authors find that net worth rises with age for healthier households (those in the top three quintiles of initial health status), but is flat or more slowly increasing for less healthy households (those in the lower two quintiles). While there are many potential explanations that need to be explored more fully, the authors "conclude from these patterns of wealth evolution that if anything, past studies of the cost of poor health in late life underestimate the risks that households face from adverse health shocks." 38
39 Elsinga M, Jones A, Quilgars D and Toussaint J (2010) Households Perceptions on Old Age and Housing Equity, This report has presented the findings from the qualitative work package of the DEMHOW EC Seventh Framework Programme. Householders tend to buy when they can afford to, often because it is seen as cheaper than renting (although not in all countries). The desire to leave property for children is a minor motive in house purchase, with the exception of Hungary where equity is central to family financial strategies. Retirement planning was not usually the primary motive for buying a home, only in Germany was buying a house explicitly mentioned as pension strategy. This may be because of the dominant role of the rental sector in Germany where households are quite content to rent and there is no pressure to buy. A key finding was that the role of home ownership was rarely a key driver in decision making around care. This may have partly reflected the fact that very few householders had made explicit plans for care in the future. Housing most often was mentioned in terms of plans to downsize and/or move to more appropriate accommodation. In Hungary, however, the value of the house was explicitly tied into care strategies. Here a bequest strategy was widely practiced of leaving the house to one child who then cared for you in return. In terms of paying for care, people realised that the state was likely to struggle with meeting the care needs of an ageing population in the future. Here, some people did discuss the potential role of housing equity and felt that it was likely that they would have to use their home to pay for care. However, there was a great reluctance to do so as they felt that they had saved all their life and many wished to leave their property to their children. However, interestingly, Slovenians were most commonly agreeing with the use of equity for care and were also the most likely to mention institutional care as an option for later life. Where financial products are available, home owners may also be able to release housing equity whilst remaining in their home. However, this research found that these financial products (or the idea of them where people did not have any knowledge of this possibility) were not encountered with great enthusiasm. Two key barriers were evident. Firstly, people mentioned a bequest motive, especially important in some countries like Hungary. People without children appeared more open to mortgage equity release in old age than people with children. Secondly, people seemed to have low trust in the providers of equity release products. Taking out a reverse mortgage means: losing control, running risks and becoming dependent (some reason by analogy with renting). Financial institutions were not fully trusted before the financial crisis, and current financial crisis has reduced trust further. It appeared that government related financial institutions (such as the Sparkasse in Germany) were regarded as more reliable institutions. Based on the findings, should governments wish to promote equity release options, non-profit or government related financial institutions are likely to be more successful in doing so. However, in some countries resistance is likely to be strong for example where the role of housing wealth within family strategies is seen as crucial (and may therefore undermine existing family based planning mechanisms). 39
40 Overton L (2010) Housing and Finance in Later Life: A Study of Equity Release Customers, London: Age UK Parkinson S, Searle B A, Smith S J, Stokes A and Wood G A (2009) Mortgage equity withdrawal in Australia and Britain: towards a wealth-fare state?, European Journal of Housing Policy 9 (4) : This research report presents findings of a survey of 553 equity release customers and 26 follow-up semistructured interviews. It sheds light on the sorts of people who take out equity release plans, what they do with the money, and their satisfaction or dissatisfaction with the plans. Plans were used to supplement, rather than substitute for, private pension assets (85 per cent of respondents had a private pension). Plans tended to be used to provide capital rather than a regular income. The top three uses for released equity were: House maintenance/repairs (46 per cent), holidays (36 per cent) and debt clearance (35 per cent). Equity release plans were used in different ways by different groups: Group 1 Passing it on - Equity release was commonly used to make early bequests and large one-off purchases. This group were typically better off than the other two groups. Group 2 Enhancing later life - Equity release was used to provide a boost to capital to increase financial security and enable a more enjoyable and comfortable lifestyle. Equity was typically spent on a wide range of housing and non-housing consumption. This group had lower levels of pension income and savings than those in group 1. Group 3 Getting by - Equity release was a last resort to relieve financial difficulty. This group were much more likely to be in debt than the other two groups. Across the decade to 2007, a combination of house price appreciation and relaxed credit constraints gave a boost to consumption through the mechanism of mortgage equity withdrawal (MEW). Arguably, this kept developed economies buoyant, even through periods of recession. This paper uses panel data on British and Australian homeowners to show that, notwithstanding its macro-economic effects, such borrowing has farreaching implications for the micro-economy of households. The data indicate that, for the period , equity borrowing was a common tactic. The sums involved were not trivial, were not limited to older cohorts, or the province simply of the rich. In fact, the events and circumstances associated with equity borrowing at the zenith of the last housing cycle were consistent with an insurance, as well as a general consumption, role for MEW. 40
41 Reifner U, Clerc-Renaud S, Pérez-Carrillo E F, Tiffe A and Knobloch M (2009) Study on Equity Release Schemes in the EU - Part I: General Report, Hamburg: Institut für Finanzdienstleistungen e.v. Smith S J and Searle B A (2008) Dematerialising Money? Observations on the flow of wealth from, Housing Studies 23 (1) : Equity Release Schemes (ERS) transform fixed assets in owner occupied dwellings into liquid assets for private pensions. They thus enable a homeowner to access the wealth accumulated in the form of his or her home, while being able to continue to live in it. An illiquid asset becomes a source of liquidity, mainly for consumption purposes. They can take two different forms: Loan Model ERS, also known as reverse mortgages or lifetime mortgages, provide a loan that will eventually be repaid from the sale proceeds of the property. Sale Model ERS, also known as home reversions, involve an immediate sale of the property but provide for the right to remain in occupation and to use the cash price for income in retirement. Although the purpose of ERS may be achieved by means of virtually any form of loan, lease or sale (second mortgages, overdraft credit, leases, sale and lease-back or sale and-move arrangements) the research targeted only products that were exclusively designed as ERS. ERS must therefore: (1) be a financial service; (2) be a source of liquidity for the future; (3) contain a strong entitlement to remain in occupation of the property; and (4) rely solely on the sale of the property for repayment/payment of the funds released to be used as a retirement pension. Payments take the form of a lump sum or regular income, and are either secured by means of a mortgage on the property or generated by an immediate sale. Under the Loan Model ERS, repayment is made from the proceeds of the sale of the property either on the death of the homeowner or when the property has been vacated for a specified period of time. This paper examines the extent and relevance of mortgage equity withdrawal (MEW) in the UK. MEW has, of late, been of most interest as a mechanism transmitting the wealth effects of housing into whole economies. Its implications for housing and social policy are less well documented. To redress the balance, the paper first offers a critique of data resources, before drawing from five substantial surveys to document the growing significance and changing style of MEW among British home buyers. The analysis focuses particularly on the under-explored question of what secured loans are spent on, identifying a trend away from reinvestment into housing, towards the consumption of other things. The study concludes by arguing that wealth effects might usefully be recast as equity leakage if the aim is to safeguard the quality of the stock and appreciate the limits to housing wealth as an asset base for welfare. 41
42 Terry R and Gibson R (2007) Overcoming obstacles to equity release, Housing, Care and Support 10 (1) : Terry R and Gibson R (2006) Obstacles to equity release, Joseph Rowntree Foundation More than two million older home owners have housing assets worth over 50,000, but incomes so low that they qualify for means-tested benefits. Drawing on housing equity could improve their quality of life significantly, helping them to live more comfortably in their own homes for longer. But only about 25,000 home owners (of all ages and incomes) conclude equity release deals each year. This paper identifies the obstacles that deter asset-rich, income-poor older home owners from drawing on their housing equity, and suggests ways of overcoming them. The focus is on paying for additional care at home, home improvements and repairs. This report examines the obstacles faced by low-income, asset-rich home owners in drawing on the value in their homes, and proposes ways in which they could be helped to do so, to pay for home improvements and care at home. This report investigates why, despite most older people knowing about equity release, few of those who could benefit from it to pay for works to their home, or for additional care at home, currently release equity. It asks what the public sector could do to make equity release more attractive to those who really need it. The study reviews people s views on equity release. It identifies the obstacles to equity release deals for low-income home owners, and outlines how the obstacles could be tackled, including changes to the benefit regime and local authority-supported schemes. Major obstacles include: Equity release involves significant setting-up costs, particularly if the amount to be raised is relatively small. There is widespread mistrust of equity release products and providers, and belief that they are not good value for money. For older low-income home owners, guidance on housing and care options can be difficult to find. For over two million older home owners with substantial equity in their homes, but incomes so low that they are entitled to benefits, improving their quality of life through equity release is particularly hazardous. They may lose so much in benefits that they are left little or no better off. 42
43 e) Attitudes to housing, wealth and the release of equity Study Jones A, Geilenkeuser T, Helbrecht I and Quilgars D (2012) Demographic Change and Retirement Planning: Comparing Households Views on the Role of Housing Equity in Germany and the UK, International Journal of Housing Policy 12 (1) : Findings As states across Europe come under pressure to meet the needs of ageing populations, there has been increasing interest in the potential role of housing equity in funding welfare provision. This paper draws on the findings of a European study, Demographic Change and Housing Wealth (DEMHOW) to compare the views of homeowners in Germany and the UK. The former is a country where homeownership is the minority tenure and the preserve of affluent households, and where house prices have been stagnant for years. The latter is a country of homeownership where half the poor are home owners, and where real house price increases over many decades have served to establish the belief that homeownership is one of the best investments accessible to ordinary people. In addition, equity release is more common, and related products better developed, in the UK than in Germany. Given these differences, it might be assumed UK homeowners would be more willing to consider utilising housing equity to supplement their income in retirement than their German counterparts. This paper sets out to explore whether this is the case. See also: Elsinga et al (2010), Households Perceptions on Old Age and Housing Equity Elsinga M, Jones A, Quilgars D and Toussaint J (2010) Households Perceptions on Old Age and Housing Equity, See: Releasing equity from housing wealth section (above) 43
44 Costa-Font J, Gil J and Mascarilla O (2010) Housing Wealth and Housing Decisions in Old Age: Sale and Reversion, Housing Studies 25 (3) : In the event of old-age dependency, housing assets can become a key self-insurance device. However, little empirical evidence has been reported regarding an individual's expectations of having to use their housing wealth for such a purpose. This paper draws upon two complementary data sources to empirically examine: (1) the influence of housing assets on an individual's willingness-to-sell (WTS) their dwelling for care purposes, and (2) the willingness to take out a reverse mortgage contract loan in the event of old-age dependency. The paper's findings suggest that homeowners' WTS in old age is unaffected by their income or housing assets and is, rather, determined by socio-environmental housing characteristics and the individual's health and personal needs. Conversely, the study finds that the uptake of home reversion loans is largely dependent on income or education, but not on a household's housing assets. 44
45 Vorms B (2009) Home ownership as wealth over the life cycle. European Household Motivation for Residential Assets - Current situation and future prospects, Most countries encourage households to become homeowners in a more or less active way. Some even use the percentage increase of homeowners as an explicit and quantitative target in public policy. Yet there is no correlation between a country s wealth and the proportion of home owners. The progression in property has been a world phenomenon since the Second World War, but has evolved in different ways. Most former socialist countries transferred rented public sector housing to occupants more or less free of charge. With an often extended security of tenure in the premises, sometimes even transferable to children of occupants, tenants find themselves the owner of their home. The cost of upkeep for this housing is also simultaneously transferred to them. Home-buying developed in countries where there was strong legal certainty of the mortgage deed and where income in households with stable jobs was increasing. Equity withdrawal: There is frequent confusion between the two principal forms of equity withdrawal: equity withdrawal stricto sensu and reverse mortgages, also known as equity release. This is because they both enable the obtaining of liquidity from a housing good (more precisely the principal residence in all the known examples), in return for a mortgage for the good in question. Equity withdrawal and reverse mortgages are fundamentally different in terms of their technical characteristics as well as the risks they present, on both an individual and macroeconomic level. Firstly, equity withdrawal is only aimed at home-buyers who already have a loan that they are currently repaying; the increase in the size of the loan therefore prolongs the duration of being indebted, and if need be, by increasing the level of debt, sometimes above its initial level, when the value of the good rises and regulations allow. In general, reverse mortgages involve mortgaging a good free of this constraint, either because the home-buyer has finished paying off his loan or has never taken out a loan. He will therefore consume the total value of his good only once (even if the payments can be scheduled), whilst in the case of equity withdrawal, the agent can increase his debt as long as its total amount is less than the value of the collateral, and as many times as he likes on the obvious condition that he can repay what he borrows. Viager : Reverse Annuity Mortgages ie selling one s house to either obtain a lump sum or to purchase a life annuity whilst remaining in the house until death is a well-known system in France. The system involves a transaction between two individuals. Around a third of these operations are conducted between members of the same family. 45
46 Age Concern England - ACE [Opinion Leader} (2009) It's a heck of a gamble, isn't it? Attitudes of older people towards the use of assets for pooling risk of care costs, London: Age Concern Reports : 39 pp Elsinga M, De Decker P, Teller N and Toussaint J (2007) Home ownership: beyond asset and security. Perceptions of housing related security and insecurity in eight European countries, Amsterdam: IOS Press Age Concern England (ACE) commissioned Opinion Leader to undertake focus groups to test out people's attitudes towards using assets as a method of pooling risks against the potentially catastrophic costs of long-term care. The research tested reactions to a scheme in which people aged 65 would be automatically enrolled at a cost of about 15000, a National Care Fund, a model that has been proposed by the International Longevity Centre (ILC UK). In return for this payment, individuals would have peace of mind to know that any future care costs would be covered. This report presents findings from the six focus groups which also discussed other ways of pooling risks: National Insurance; an age 40+ income tax; or payment at death. Among key themes emerging were: a perception that the current system of funding care is unfair; support for risk pooling in principle, but that ring fencing is critical; preference for a National Insurance model; and opposition to a charge linked to ownership of assets. There was strong consensus on how the fund would work, and that the care fund should pay for every aspect of care. To understand developments in different countries it is indispensable to work with an international research team that has awareness of historical roots and cultural idiosyncrasies. This was the basis for the OSIS proposal- Origins of security and insecurity (OSIS): the interplay of housing systems with jobs, household structures, finance and social security - which was awarded funding as a Specific Targeted Research Project under the 6th Framework Programme. This offered teams in Belgium, Finland, Germany, Hungary, the Netherlands, Portugal, Sweden, and the United Kingdom the opportunity to deepen their studies by following two avenues of research. The first was a quantitative research approach The second was a qualitative research approach which focused on households perceptions within their own country framework. The main aim of the research was to clarify the extent to which home ownership provides households with security or insecurity. 46
47 Rowlingson K (2006) "Living poor to die rich"? or "Spending the kids' inheritance"?, Journal of Social Policy 35 (2) : A significant and probably increasing proportion of older people are "asset rich, income poor". This raises a number of social policy issues around poverty and living standards in later life. For example, perhaps older people are "living poor to die rich", because they wish to pass on their assets to future generations or because they feel they have an "inalienable right" to their property. Or perhaps they would like to use up their assets but find that difficult, for example, because of concerns around equity release products. This article focuses on attitudes to assets and inheritance, drawing on findings from in-depth interviews and focus groups. The data suggest that people generally take a balanced and pragmatic attitude to their resources. They do not wish to "live poor to die rich", but nor are they keen to spend their resources recklessly as they wish to leave something to their families, while also maintaining a reasonable standard of living in later life. The author concludes by suggesting that the current "asset-based welfare" debate should broaden its focus on asset accumulation to consider issues around asset use. 47
48 Rowlingson K and McKay S ; Joseph Rowntree Foundation - JRF; Department of Social and Policy Sciences, University of Bath (2005) Attitudes to inheritance in Britain, Bristol: The Policy Press, for the Joseph Rowntree Foundation : 88 pp The growth of home ownership in the UK has probably increased the number of people who will both bequeath and inherit assets. The authors therefore wanted to discover how much support there is for the concept of inheritance and how this varies within the population. Their report considers expectations of receiving an inheritance, and whether or not they feel they need to inherit assets (referred to as "perceived needs"). The study also focuses on the experience of receiving an inheritance; attitudes to, and ability to leave, bequests; and attitudes to assets. Key findings are: Almost half (46 per cent) of adults have inherited something. Most inheritances involve relatively small amounts; but 5 per cent of people have inherited 50,000 or more. Professional white owner-occupiers are most likely to receive an inheritance. More than half the population think that they are ʻnot at allʼ or ʻnot veryʼ likely to inherit any property. But 14 per cent definitely think that they will and another 14 per cent think that they are very likely to do so. People like the idea of leaving a bequest but most do not think that older people should be careful with money just to do so. Two-thirds of those with some potential to leave a bequest say that they will not worry too much about doing so. Just over a quarter of this group say that they will budget so as to leave something. People over 80 are least likely to prioritise their own needs over bequeathing but even among this group, a majority intend to enjoy life rather than worry about inheritance. A quarter of current or former owner-occupiers have accessed housing equity. Few have taken up Equity Release Schemes; although people like this idea in theory, they find current provision complex, risky and difficult to understand. Inheritance tax is very unpopular but very few people know how it works in practice. The researchers conclude that inheritance plays an important part in many peopleʼs lives but has not generally become entrenched as an expectation or duty. Most older people are willing to use their assets for themselves, rationally using some of their lifetime assets to meet needs in later life. 48
49 Hancock R, Katbamna S, Martin G, Clarke H and Stuchbury R; University of Leicester; Joseph Rowntree Foundation - JRF (2002) Attitudes to inheritance: an exploratory study, York: Joseph Rowntree Foundation - JRF : 22 pp It is often suggested that, in the future, older people will feel less desire to pass on their wealth to their children and more inclined to use it for personal enjoyment, to meet everyday needs of capital expenditures such as the costs of housing repairs, or to pay care costs. Currently older people appear reluctant to draw on their housing equity, which may be due to a desire to pass it on to their children. This exploratory study reviews the research evidence, and gathers available market research and other industry survey evidence. It presents preliminary analyses of existing national household surveys and other population data, and of attitudinal surveys which have readily usable data Emerging evidence suggests that there is very little difference in attitudes towards receiving an inheritance across different age groups and income brackets. Younger respondents gave an outward appearance of not wanting to inherit from their parents, although many, particularly those in a higher income group, had in fact inherited large sums The findings of an FSA review suggested that the respondents tended to make a distinction between the wealth accumulated in their house and other investments. A family home was generally earmarked as a potential inheritance for children following the death of the parents but financial assets were seen as belonging to the individual. The idea of equity release was generally viewed with a great deal of scepticism and suspicion. The house was seen as a source of security and a valuable asset that they would only consider relinquishing in case of an emergency, or if their quality of life was seriously undermined. 49
50 f) Inheritance Study Karagiannaki E (2011) Recent trends in the size and the distribution of inherited wealth in the UK, London: ESRC Centre for Analysis of Social Exclusion - CASE, Suntory-Toyota International Centres for Economics and Related Disciplines - STICERD, London School of Economics and Political Science : 31 pp (CASE paper 146) Findings The central conclusion of this paper is that the size of inheritance has become more important over time and that housing inheritance has played an increasingly important role in the overall value of inheritance. Overall, during the period inheritance rose from 22.2 billion in 1984 to 55.7 billion by 2005 (with the most substantial increase observed after 2000). This took the flow of inheritance from being the equivalent of 3 per cent of GDP in 1984 to about 4.3 per cent in This increase was largely driven by the increase in house prices and to a much lesser extent by the increase in the number of housing estates. The latter finding contrasts to the trends observed in earlier periods and seems to suggest that the spread in owner occupation started to feed into inheritance. The distribution of inheritances is characterized by high degree of inequality. Over time comparisons suggest that this has become more unequal over time. However, the inequality-increasing effect from the greater inequality in the distribution of inheritance was counterbalanced by the increase in the percentage of the population who received inheritance of more than 2,000. The combined effect of the two trends was a slight decrease in the degree of inequality in the distribution of inheritance across the population as a whole in Furthermore the analysis suggested that there is a positive association between inheritance and socio-economic status with some suggestive evidence that this association might have strengthened between and However, the evidence also indicates that there is a considerable heterogeneity in the population of inheritors and a large variation in the value of inheritance among them (with a few large inheritances and a large number of smaller ones). This result is not to suggest that inherited wealth does not reproduce (or even exaggerate) other types of socio-economic advantage but to stress the complexity of any analysis that attempts to quantify the effect of inheritances on the observed levels of wealth inequality. 50
51 Karagiannaki E (2011) The impact of inheritance on the distribution of wealth : evidence from the UK, London: ESRC Centre for Analysis of Social Exclusion - CASE, Suntory-Toyota International Centres for Economics and Related Disciplines - STICERD, London School of Economics and Political Science : 35 pp (CASEpaper 148) Searle B (2011) Recession and housing wealth, Journal of Financial Economic Policy 3 (1) : Lloyd J (2008) Navigating the age of inheritance, London: International Longevity Centre UK - ILC- UK : 36 pp The author uses data on the value of housing wealth and other property and land from the British Household Panel Survey (BHPS) to examine how the distribution of wealth has been changing in the UK over the period 1995 to Also examined is how the sum of inheritance received between 1996 and 2005 contributed to observed trends in wealth accumulation and wealth inequality. The BHPS data confirms the substantial growth in net worth and of a substantial decrease in wealth inequality recorded in the survey. The main driver behind both trends was the rise in house prices and the resulting increase in the housing equity of middle wealth-holders. Inheritances were highly unequal and had a positive (but rather small) correlation with pre-inherited wealth. This meant that inherited wealth accounted for part of the observed inequality of net worth in However, some significant inheritors started with low initial wealth (and this was true within each age group). See: Housing as wealth section (above) Although inheritance transfers are increasing in value, the receipt of such transfers is not universal, and public policy should always recognise this fact. Family wealth transfers generate both positive and negative externalities for public policy, and there is scope to direct the use of such transfers to minimise negative externalities. Decumulation remains a hugely neglected topic. Enabling individuals to decumulate as much of their wealth as they wish should be an objective of social policy. Since annuities are the best retirement income product, all stakeholders should now address themselves to the Total Annuitisation challenge: the challenge to enable individuals to annuitise all of their wealth in retirement if they so choose. The inherent unpredictability, fluctuations and other probems associated with the operation of the housing market have long been a barrier to decumulation. Fixing these problems will be the first task in the age of inheritance. 51
52 Ross A, Lloyd J and Weinhardt M; National Centre for Social Research - NatCen; International Longevity Centre UK - ILC-UK (2008) The age of inheritance: a report of research carried out by the National Centre for Social Research on behalf of the ILC-UK, London: ILC-UK : 36 pp Changing patterns of family wealth transfers in the UK are explored, using two nationally representative panel studies: the British Household Panel Survey (BHPS), and the English Longitudinal Study of Ageing (ELSA). Analysis of the BHPS revealed that within each two year period around 4-4.5% of the population receive an inheritance. The mean amount received has increased from around 21,000 in 1997/8 to around 44,000 in 2003/4. The mean amount reflects both individuals who are the principal beneficiary of a parental estate, as well as individuals receiving modest amounts from distant relatives. Receipt of inheritance varies by age group. The analysis explored inheritance receipts among those aged 16-29, and 50+. The analysis found that each age group had around the same likelihood of receiving an inheritance (4-4.5%), but this probability decreased for the youngest age group over the period Differences exist in the mean amount of inheritance received by each age group. The mean amount received by those aged remained stable at around 10,000 during the period However, the mean amount received by the two older age groups had doubled over the same period, from 17,000 to 31,000 for those aged 30-49, and from 30,000 to 60,000 for those aged 50+. Analysis of the BHPS found evidence that receipt of inheritance varies by socio-economic group. The research used three socio-economic classifications: Professional & Managerial ; Skilled non-manual & Skilled manual, and Semi & Unskilled. A significant relationship exists between socio-economic group and receipt of inheritance. Around 6% of those in the Professional & Managerial group received an inheritance within each two year period, compared to around 4% and 3% for the other two groups. The analysis also found a tentative relationship between socio-economic group and the value of inheritance received between 1997 and However, there was no such relationship identifiable in the years Some of the fluctuation in the average inheritance received may be due to the very small sample sizes. There are no significant differences in the likelihood of receiving an inheritance between parents and non-parents, nor of the mean amounts received by each group. 52
53 Rowlingson K and McKay S ; Joseph Rowntree Foundation - JRF; Department of Social and Policy Sciences, University of Bath (2005) Attitudes to inheritance in Britain, Bristol: The Policy Press, for the Joseph Rowntree Foundation : 88 pp Hancock R, Katbamna S, Martin G, Clarke H and Stuchbury R; University of Leicester; Joseph Rowntree Foundation - JRF (2002) Attitudes to inheritance: an exploratory study, York: Joseph Rowntree Foundation - JRF : 22 pp Izuhara M (2002) Care and inheritance: Japanese and English perspectives on the "generational contract", Ageing and Society, vol 22, part 1 22 (1) : See: Attitudes to housing, wealth and the release of equity section (above) See: Attitudes to housing, wealth and the release of equity section (above) The changing nature and patterns of the "generational contract" are explored, with particular reference to the exchange of nursing care and housing assets between older parents and their adult children. Inheritance practices and attitudes are used to examine the ways in which socio-economic, demographic and policy changes have recently altered the conventional arrangements in Japanese society. The previously defined generational contract is now ambiguous, and the expectations and obligations of different family members are fragmented. Also discussed, is whether such practices in Japan are unique and the ways in which they differ from the English situation. Family obligations and inheritance have been more explicitly connected in the Japanese social and legal systems, while in England there is neither legal obligation to support older parents, nor any constraint on inheritance. This article elucidates the similarities and differences in the patterns of inheritance, and thus the exchange models between care and inheritance in the two societies. 53
54 g) The relationship between health and wealth and the trade-off between home ownership and welfare provision Study McCann M, Grundy E and O'Reilly D (2012) Why is housing tenure associated with a lower risk of admission to a nursing or residential home? Wealth, health and the incentive to keep my home, Journal of Epidemiology and Community Health 66 (2) : Malpass P (2008) Housing and the new welfare state: Wobbly pillar or cornerstone?, Housing Studies 23 (1) : 1-19 Findings Previous research has shown that home ownership is associated with a reduced risk of admission to institutional care. The extent to which this reflects associations between wealth and health, between wealth and ability to buy in care or increased motivation to avoid admission related to policies on charging is unclear. Taking account of the value of the home, as well as housing tenure, may provide some clarification as to the relative importance of these factors. This research analyses the probability of admission to residential and nursing home care according to housing tenure and house value Cox regression was used to examine the association between home ownership, house value and risk of care home admissions over 6 years of follow-up among a cohort of 51?619 people aged 65 years or older drawn from the Northern Ireland Longitudinal Study, a representative sample of 28% of the population of Northern Ireland. Four percent of the cohort (2138) was admitted during follow-up. Homeowners were less likely than those who rented to be admitted to care homes (HR 0.77, 95% CI 0.70 to 0.85, after adjusting for age, sex, health, living arrangement and urban/rural differences). There was a strong association between house value/tenure and health with those in the highest valued houses having the lowest odds of less than good health or limiting long-term illness. However, there was no difference in probability of admission according to house value; HRs of 0.78 (95% CI 0.67 to 0.90) and 0.81 (95% CI 0.70 to 0.95), respectively, for the lowest and highest value houses compared with renters. Conclusions: The requirement for people in the UK with capital resources to contribute to their care is a significant disincentive to institutional admission. This may place an additional burden on carers. See: Housing as wealth section (above) 54
55 Searle B A, Smith S J and Cook N (2006) From housing wealth to well-being: the health implications of savings, spending and debt, Paper prepared for the Sixth European Urban and Regional Studies Conference September, Roskilde, Denmark The positive health effects of owner-occupation, compared to renting, have been well-documented. However, research shows that the owner-occupied sector is not homogenous: some home-owners are at risk from the physical condition of their home and experience stress associated with the management of housing finance. This paper adds to the literature on housing and health by considering whether and to what extent factors associated with the accumulation and decumulation of housing wealth account for variations in well-being among home buyers. To this end we bring together two relatively new areas of social policy the repositioning of housing wealth as an asset base for welfare and the focus on wellbeing within the Government s sustainable development strategy. The authors argue that both the processes of investment into, and consumption from, housing wealth are linked to well-being, albeit in complex ways. They show, for example, that these links are not simply about measures of income or wealth, though they may be partly about the experience of socio-economic inequality. They also suggest that relying on housing wealth is not an unequivocally comforting process. They also show that valuing homes for a range of qualities may more readily be associated with wellbeing than positioning housing as the asset base for welfare. Kim H (2006) Older women's health and its impact on wealth, Journal of Women & Aging 18 (1) : Kim H and Lee J (2006) The impact of comorbidity on wealth changes in later life, Journals of Gerontology: Series B, Psychological Sciences and Social Sciences 61B (6) : S307-S314 Do the negative impacts of health problems cause more serious financial consequences for single older women than for married women? Using the five waves of data from the Asset and Health Dynamics Among the Oldest Old (AHEAD) from 1993 to 2002, this question is empirically investigated. Results indicate that severe chronic conditions result in 4% to 10% greater wealth depletion for single women than for married women. This finding calls for heightened awareness of the negative financial consequences of health problems; and also calls for increased lifetime earning potential, reconsideration of women's retirement benefits and greater attention to preventative care Despite the high prevalence of comorbidity in later life, scientists do not fully understand its financial impact. This study on the impact of compounded health problems on older people's wealth uses data from the Asset and Health Dynamics Among the Oldest Old study (AHEAD) 1995 to 2002 waves. The authors found that comorbidity leads to significant wealth depletion in later life, especially for single older people: their wealth was depleted by 20% to 22% over a 3-year period, especially for those with the combination of heart disease and diabetes. The impact of comorbidity was disproportionately greater than the continued impact of a single health problem. However, the impact of comorbidity did not appear to be significant for married people 55
56 Kemeny J (2005) The Really Big Trade-Off between home ownership and welfare: Castles' evaluation of the 1980 thesis, and a reformulation 25 years on, Housing, Theory and Society 22 (2) : Kemeny J (2004) Home ownership against the welfare state: the thesis and the evidence - Plenary Address, ENHR Conference, Cambridge University 2-6 July 2004, In 1980, on the basis of very general statistics Kemeny argued that countries with high rates of home ownership tended to be countries with poorly-developed welfare states. Nearly 20 years later, in 1998 this thesis was tested by Frank Castles who, using more sophisticated statistical techniques and a larger number of countries, found the thesis to have some validity. He dubbed the phenomenon The really big trade-off between home ownership and public welfare. Both the original thesis and Castles' analysis are reviewed, and a way of testing the thesis a quarter of a century after its formulation is proposed. It is argued that if those countries that still today enjoy a functioning integrated rental market and have low rates of home ownership begin to experience major declines in welfare especially among the elderly we can expect them to begin to transform into monotenural home owning societies. Sweden is taken as an illustrative example of a country with potential for such a transformation. Housing researchers will hopefully monitor such changes in all countries with integrated rental markets to see if declines in welfare can explain increases in home ownership as a means of coping with poverty and ill health in old age. But more important, housing research needs to broaden its focus from housing studies to relating housing to broader issues of welfare and society. Kemeny s overall argument was that home ownership impacted on society in a wide range of privatising ways, including urban form, public transport, life-styles, gender roles, systems of welfare and social security as well as other dimensions of social structure. One of the most interesting characteristics of home ownership is the way it redistributes income within the life-cycle of individuals from youth to old age. This redistribution often begins with saving for a deposit, sometimes long before becoming a firsttime buyer and while living in rental housing or even in the parental home. It continues with cripplingly high mortgage repayments into middle age. Kemeny posited a negative relationship between home ownership and welfare, focusing on 8 OECD countries: three with low home ownership rates (Sweden, West Germany and The Netherlands), two with average home ownerships rates (UK and France) and three with high home ownership rates (USA, Canada and Australia). He compared these countries in terms of three very general aggregate indices of welfare (current government expenditure as a percent of GNP, total taxation as a percent of GNP, and percent of income paid in direct taxes). Without doing any statistical tests on these data they never the less did suggest that there was a negative relationship between home ownership rates and welfare provision. 56
57 Castles F J (1998) The really big trade-off: home ownership and the welfare state in the New world and the Old, Acta Politica 33 : 5-19 This study looked at correlations between home ownership levels and measures of government revenues and expenditures Revenues Outlays Total Social protection expenditure * -.76*** -.75*** *** -.61*** -.81*** *** -.59** -.76*** ** -.54** -.54** The number of asterisks indicate different significance levels: * = < 0.1 ** = <.05 *** = <.01 By any standards, these are strong negative correlations. Castles comments: Although the public health findings contradict a specific aspect of the Kemeny thesis, the overall implications of the findings excluding the Swiss case are extremely supportive of his basic insight. For the past three decades, and dramatically so between 1960 and 1980, high levels of home ownership in Western societies have gone along with weakly developed welfare states, manifested in lower aggregates of government revenues and expenditures and in lower level of pension and other nonhealth, welfare spending. These relationships now appear to be fading, but that the alternative poles of this trade-off matrix have represented quite distinct configurations of policy outcomes for much of the postwar period is clearly revealed by the evidence examined here. 57
58 h) Housing and wealth as contributors to the funding of long term care Study Isden R, Norton M and Abrahams C (2013) The Dilnot social care cap : making sure it delivers for older people, Age UK Fernandez J-L and Forder J (2012) Reforming Long-term Care Funding Arrangements in England: International Lessons, Applied Economic Perspectives and Policy 34 (2) : Findings Summarises the Dilnot Commission proposals on long term care funding, the government response and the likely impact on individual cases of older people needing care. In 2015 the Government should, subject to passage of the Care Bill, introduce a new national eligibility threshold. Although the Government s stated intention is broadly to maintain the current level of care provided by the majority of local authorities, the introduction of new criteria is likely to encourage people to come forward either to be assessed for the first time or to be reassessed. it is likely to be strongly in the financial interests of older people who, following assessment, are categorised as needing to fund their own residential care, to ask the local authority to organise it on their behalf (for a management fee). The right to ask the council to do this is a provision in the Care Bill and it should enable self-funders to benefit from the lower care home fees that councils, with their significant purchasing power, can usually negotiate with providers. Older people will only have the opportunity to benefit from the Dilnot cap and the associated meanstest at all if their assessed needs are sufficient to qualify them for entry to the new scheme. Government has said that it intends that the new national threshold should be set at roughly the equivalent of substantial in the arrangements that apply now. Ever since the failed 1999 Royal Commission, England has been attempting to reform its long-term care funding system. More than a decade later, significant changes to the means tested arrangements are yet to be introduced, whilst the pressure to achieve long-term reform mounts linked to increases in public expenditure and ever growing demand for better services. This paper examines the pros and cons of alternative options for reforming the English long-term care funding arrangements by examining the rationale for and consequences of the recent long-term care developments in Germany, Japan and France. In particular, the paper examines the implications of the reform options adopted in the different countries examined for equity and efficiency in the use of long-term care resources and for the sustainability of the long-term care system as a whole. 58
59 Charlesworth A and Thorlby R (2012) Reforming social care: options for funding, Nuffield Trust This paper examines the current level of funding of social care and the Dilnot Commission s recommendations and suggests ways of funding a fairer, more sustainable system of social care. Key Points: Social care funding is in urgent need of reform. Recent cuts to social care budgets have intensified an underlying mismatch between funding and demand, so that a growing number of people on low incomes are no longer eligible for state support. In addition, many people are forced to sell their homes to meet the costs of residential care. Without action, this situation is likely to worsen. Estimates produced for the Dilnot Commission suggest that even without reform, spending on social care will have to rise from 14.6 billion in 2010/11 to 23 billion by 2025/26. The Dilnot Commission proposals would extend more state funding to the less well-off, and offer some publicly funded care to everyone faced with very high costs of residential care. Implementing these would cost an additional 3.6 billion by 2025/26. The recommendations have received broad support across organisations that represent care users and providers. A better-funded social care system, which includes the Dilnot proposals, will require increased public spending on adult social care. There are various options for paying for this. In the short term, more funds could be made available from the NHS: primary care trusts (PCTs) are currently projecting an underspend of 1.5 billion in 2011/12. The Department of Health should consider using part of this for further transfers to social care. Redirecting some of the 2011/12 NHS surplus will not be enough on its own. Other potential sources of funding include: minimising the cost of the Dilnot recommendations by opting for the higher level of caps proposed; generating more productivity from existing social care services; and exploring options for reallocating elements of the health and welfare budgets to fund a reformed social care system. Social care spending accounts for around six per cent of the 140 billion a year of public spending on older people. It is not clear that the current mix of spending on social care, health and welfare payments for older people is optimal. The Government should consider shifting resources from the welfare payments currently received by better-off older people, to fund long-term reform of social care. It should also explore whether some of the health budget could be more efficiently spent on preventative social care. If the costs of social care cannot be met within the overall sum of state support to older people, some form of higher taxation may also need to be considered. This should be guided by principles of equity between generations as well as between people with differing levels of income and wealth. In particular, the Government should explore options to direct the burden of any tax increases onto wealthier older people. The Government urgently needs to begin a dialogue with the public about how social care will be paid for in the future. Some progress has been made in discussing the principle of individuals contributing their own wealth and assets to pay for their own care. But there has been much less debate on the need for additional public funding. There will need to be a parallel focus on improving the quality of social care provision. It will be difficult to make the case for increased personal contributions to the public costs of care - whether delivered in the home or as residential care - if it is seen as being of poor quality and unable to treat people with dignity. 59
60 Fernández J-L and Forder J (2010) Equity, efficiency, and financial risk of alternative arrangements for funding long-term care systems in an ageing society, Oxford Review of Economic Policy 26 (4) : Partly a reflection of the increasing volume and hence political influence of the older population, recent reforms of long-term care (LTC) systems across developed countries have sought to expand the coverage of the services provided, and have defined increasingly universal levels of state support for people with social-care needs. At the same time, some of the factors leading to the expansion of the objectives and ambitions of the care system, such as the ageing of the population, pose significant challenges to its long-term financial sustainability. In this context, the paper first reviews the main factors likely to contribute to the growth in LTC demand and expenditure, and reflects on the policy priorities associated with state-backed funding systems in the area. Using results from a bespoke dynamic microsimulation model, it then illustrates the discussion through a quantitative analysis of the equity and efficiency implications of alternative funding models discussed in the context of the ongoing reforms of the LTC system in England. 60
61 Resolution Foundation (2010) Funding future care need: the role of councils in supporting individuals to access the capital in their homes, Despite having below average household income, many older people own their own home. As such, where they are deemed by their council to qualify for care under the fair access to care services (FACS) guidelines, they often fail the means-test. Similarly, those older low earners who require help but fail to meet the FACS needs-test set by their local authority can struggle to secure the help they need. Older low earners with care and wellbeing needs can therefore find themselves in two different types of funding gap: (1) Too well to get council support, but too income-poor to self-fund services which could improve their wellbeing or reduce the chances of deterioration; or (2) Sufficiently ill to be considered for state support, but too asset-rich to get assistance and too income-poor to adequately self-fund their care needs. The role of housing wealth: The most popular means of accessing housing wealth in retirement is via tradingdown (moving to property of a lower value) or trading-out (moving to non-owned property). Although relatively simple, such approaches are potentially inefficient ways of accessing funds to pay for care needs because they release all of the available wealth in one hit and are impractical for those individuals needing care in the home or home adaptation rather than residential care. Equity release represents a more flexible means of accessing funds. However, growth in the market has stalled in recent years, with a number of demand- and supply-side failures meaning that take-up has been low, particularly in relation to funding care. Deferred payment: Under Section 55 of the Health and Social Care Act 2001, councils have powers to take a legal charge on a care home resident s main or only home instead of seeking contributions from the individual. The accrued debt can be recouped when the house is sold. Unlike commercial equity release schemes, no interest is charged on the debt until 56 days after the person s death, at which point a reasonable. rate of interest can be introduced. These deferred payments are available to people in residential or nursing homes who have capital (apart from the value of their home) under the local authority limit, cannot meet the full fees of the home from their income and do not wish to sell their home or are unable to sell their home quickly enough to pay for their fees. In relation to the use of deferred payment by councils around the country, we were told that: Some councils fail to offer it at all. Others make it appear like a last resort, asking individuals to first prove that they have considered every other option. Some authorities do not offer deferred payment as a means of allowing residents to use the capital in their home to fund top-ups in their care, arguing that the initial outlay is prohibitive. There is inconsistency across the country in terms of frontline staff knowledge about deferred payment. Reluctance among some councils was explained by: Perceptions of the costs of managing the scheme. Limitations of social care budgets. The grants provided alongside deferred payment following its introduction had helped make the scheme attractive initially to councils, but the absence of similar grants today causes some authorities to consider the expenditure to be prohibitive. 61
62 Forder J and Fernández J-L (2010) The impact of a tightening fiscal situation on social care for older people, Personal Social Services Research Unit - PSSRU, London School of Economics and Political Science - LSE; Age UK : 8 pp (PSSRU Discussion paper 2723) Mayhew L, Karlsson M and Rickayzen B (2010) The Role of Private Finance in Paying for Long Term Care, The Economic Journal 120 (548) : F478-F504 In the current difficult fiscal climate, a cut in funding for social care seems likely. What are the consequences for the numbers of people, according to the severity of their need, who would lose council funding support if budgets were cut? This report assesses the effects of a 6.7% per annum real terms reduction in the total available for social care in the two years after 2010/11 (i.e. to 2012/13). This reduction figure comes from projections made by the Institute for Fiscal Studies (IFS) Green Budget (January 2010). Analysis is based on the PSSRU dynamic micro-simulation model, which makes projections about the social care system for the future based on assumptions concerning population, disability, pensioner income and assets, service costs and informal care. The authors conclude that the reduction in state expenditure would lead to an increase of 23% in the volume of people with social care needs but no services. Their modelling suggests that a reduction in public support would prompt more people to pay privately for care and/or to seek informal care. They also assume that expenditure is managed by raising eligibility thresholds (which has been done by councils in recent years). Although such a policy results in unmet needs, it would provide protection to the poorest people (rather than to the neediest). An ageing population and increased longevity means that long term care will become progressively more expensive. This article considers the role of private finance products under the Partnership option. It finds that few households are able to pay for LTC based on income and savings but the number increases if housing assets are included. It shows that products can be devised for a range of circumstances, although state support would need to continue. It proposes a simplified means testing system based on a combination of income and assets. Key proposals included in the 2009 Green Paper were the creation of a National Care Service in England based on a system that is fair, simple and affordable. It would include a unified system of needs assessment in which everyone would get a proportion of their support costs paid for. The probability of needing social care in later life is high, but for institutional care it is relatively low (about 35% in the case of females); over twice as many females as males are in institutional care but they are least able to afford it. Only around 400,000 households out of 6.5m aged 65+ can afford institutional long term care for more than one year on the basis of income alone but this increases to 3m if savings are included. Only around 400k households out of 6.5m aged 65+ can afford institutional long term care for more than one year on the basis of income alone but this increases to 3m if savings are included. If housing wealth is taken into account then 4.6m households could afford care for more than 1 year. Of the 1.8m households that cannot afford care for more than one year if housing wealth is included, 0.9m are female only, 0.4m male only, 0.4m couple households and 0.1m other. 62
63 Watson M (2009) Planning for the future of assetbased welfare? New Labour, Financialized economic agency and the housing market, Planning, Practice and Research 24 (1) : Lloyd J (2008) Funding long-term care: the building blocks of reform, London: International Longevity Centre - ILC-UK : 30 pp Costa-Font J, Mascarilla-Miro O and Elvira D (2006) Means testing and the heterogeneity of housing assets: funding long-term care in Spain, Social Policy & Administration, 40 (5) : This article focuses on core aspects of the political economy of New Labour and surveys the strategic priorities to which it is likely the planning process will have to adapt. The effects of enhanced Treasury micro-management of the Government's reform agenda has begun to impact upon the field of planning. The prime example in this respect is the Treasury's preference for replacing state provision of welfareenhancing services with the move towards an individualized system of asset-based welfare. The article begins with an analysis of this shift. In contemporary Britain the housing market dominates the accumulation of assets amongst everyday saver-investors. The article concludes by analysing the possible tension that will be introduced into the planning process because of New Labour's twin goals: (1) to defend the current value of asset wealth even as the mortgage lending market has stalled and confidence in the stability of house prices has temporarily evaporated; and (2) to restrict exclusion from private ownership in the housing market so that broadening access can be used to propel a universal move towards an individualized system of asset-based welfare. There is widespread agreement that the UK long-term funding system requires significant reform. This reports sets out the core tasks required of that reform, and provides an accessible introduction and overview of the wide range of available funding options that could be applied to the long-term care system: the "building blocks of reform". The report identifies the different basic models of long-term care funding available, briefly summarising and evaluating each "building block", and exploring how these different models can be integrated and combined. The "building blocks" derive from three funding sources: the state (through general taxation); people of working age (through specific contributions); and retirees (through state and/or personal pension, liquid assets, or property wealth). The access to publicly funded long-term care (LTC) in Spain has been traditionally rationed through the use of means tests based on individuals' current income and needs. However, individuals' wealth - primarily housing assets - is progressively taken into account. This paper examines the current role of housing assets in determining public and private funding for LTC in Spain. The authors examine regional heterogeneity in the processes of public funding criteria determining eligibility to public support for LTC and survey evidence on the individual's willingness to sell (WTS) their housing assets in order to either totally or partially finance access to LTC. Housing assets are the main source of wealth accumulation at old age. Progressively, all Autonomous Communities (AC)s are considering housing assets in the means testing criteria. Interestingly, individuals' willingness to sell their housing assets declines with age and is more common among less skilled and widowed individuals. 63
64 Age Concern England ACE, Policy Unit (2006) Who should pay for care? paying for care in later life, London: Age Concern England - ACE : 52 pp (Age Concern Reports) This report presents results of qualitative research which explored the views of current and future older people on paying for care in later life. Six focus groups were conducted in the north and south of England with people from a mix of socioeconomic and age groups (45-59, 60-74, 75+). The groups were given information about the current charging system for care and discussed two case studies. Overall, the findings show that people are still strongly of the view that the state should provide for care in old age: there is a reluctance for individual wealth to be taken into account. The report defines personal care and health care; and examines people's understanding of care charges, payment for care services and care in different settings. Also discussed are the role of family care; use of one's own wealth to pay for care; and issues about quality of care. 64
65 Glendinning C, Davies B, Pickard L and Comas- Herrera A (2004) Funding long-term care for older people: lessons from other countries, York: Joseph Rowntree Foundation - JRF : 35 pp Debates about the funding of long-term care are taking place in a context of major demographic change, a situation that is not unique to the UK. This briefing paper focuses on the options for funding long-term care, by examining arrangements in Australia, Austria, Denmark, France, Germany, Japan, the Netherlands and the US. The changes recently introduced in Scotland are also examined. Examination of arrangements for funding long-term care in a number of other countries reveals the following conclusions: There are limits to how far any system of funding long-term care can be protected from wider economic pressures and performance. Even Germany, whose longterm care insurance system contains a substantial number of highly effective mechanisms for controlling social insurance expenditure, is not immune to pressures arising from continuing high unemployment and budget deficits. Moreover, as the proportion of total spending from social insurance is held constant and that from private sources correspondingly increases, the equity and other performance criteria of the scheme may be adversely affected. None of the countries included in this study has introduced a funded insurance scheme for long-term care. Requiring one generation effectively to pay twice for long-term care appears substantially to risk intergenerational conflict, without any obvious counterbalancing gains in sustainability. Countries such as Germany, the Netherlands and (in part) Japan that have adopted social insurance principles for funding long-term care have all introduced pay-as-you go schemes. Other countries rely on mixtures of national and local taxation (with varying levels of private contributions from user co-payments and means tests). Funding the care needs of current generations of older people through current taxation and/or insurance contributions (including those paid by more affluent older people themselves) therefore appears to be the only viable option. Moreover, in none of the countries that have adopted this approach is there any evidence of intergenerational conflict. Debates about the funding of long-term care necessarily need to include both the mechanisms by which revenues are raised and the mechanisms by which these are allocated. Methods of allocating resources particularly the micro-allocation processes associated with individual needs assessments and the incentives attached to more or less costly types of care (including informal care) directly impact on the equity, efficiency and ultimately the sustainability of any particular system. 65
66 Wright F (2002) Asset stripping: local authorities and older homeowners paying for a care home place, Bristol: Policy Press : 40 pp About one in three long-term older residential and nursing home residents meet their own care costs, for which most will have sold their homes to raise the necessary capital. This report is based on a national survey of English and Welsh local authorities, case studies, and interviews with care home providers, self-funding residents and their relatives. It indicates the wide variation in local authority policies and practices, in particular, the use of strategies that discourage older people with assets over the upper capital limit (currently 18,500) from receiving a needs assessment on alternatives. The report describes conflicts between local authorities and independent sector care home providers; raises questions about the well-being of frail older residents in the current market situation; and questions the lack of impartial advice on alternatives to care home admission or on different types of care homes. i) International and comparative studies Study Cowell F A, Karagiannaki E and McKnight A (2013) Accounting for cross-country differences in wealth inequality, London: ESRC Centre for Analysis of Social Exclusion - CASE, Suntory- Toyota International Centres for Economics and Related Disciplines - STICERD, London School of Economics and Political Science : 35 pp (CASEpaper 168) Findings See: Wealth inequality section (above) 66
67 Doling J and Elsinga M (2013) Demographic Change and Housing Wealth: Home-Owners, Pensions and Asset-Based Welfare in Europe, Springer Coe N B and Boyle M A (2013) The Asset and Income Profiles of Residents in Seniors Housing and Care Communities: What Can Be Learned From Existing Data Sets, Research on Aging 35 (1) : Norris M and Winston N (2012) Home Ownership and Income Inequalities in Western Europe: Access, Affordability and Quality - GINI Discussion Paper 41, Across the EU, populations are shrinking and ageing. An increasing burden is being placed on a smaller working population to generate the taxes required for pensions and care costs. Welfare states are weakening in many countries and across Europe, households are being increasingly expected to plan for their retirement and future care needs within this risky environment. At the same time, the proportion of people buying their own home in most countries has risen, so that some two-thirds of European households now own their homes. Housing equity now considerably exceeds total European GDP. This book discusses questions like: to what extent might home ownership provide a potential cure for some of the consequences of ageing populations by realizing housing equity in order to meet the consumption needs of older people? What does this mean for patterns of inheritance and longer-term inequalities across Europe? And to what extent are governments banking on their citizens utilising their housing wealth now and in the future? The authors use existing, nationally representative surveys (USA) to assess the economic characteristics of individuals in three categories of seniors housing and care facilities: independent living communities (ILCs), assisted living residences (ALRs), and continuing care retirement communities (CCRCs). The findings highlight the strengths and weaknesses of using the Health and Retirement Study, National Long-Term Care Survey, and Medicare Current Beneficiary Survey to describe this segment of the population. The results suggest that residents in ILCs and ALRs have lower average incomes than the average costs of these care communities. Conversely, CCRC residents have higher incomes and more assets than those living in private homes, suggesting that CCRCs attract the wealthiest seniors. However, longitudinal analysis is prohibited by the small sample sizes. See: Wealth inequality section (above) 67
68 Cowell F, Karagiannaki E and McKnight A (2012) Mapping and measuring the distribution of household wealth: a cross-country analysis, London, UK: Centre for the Analysis of Social Exclusion, London School of Economics and Political Science Fernandez J-L and Forder J (2012) Reforming Long-term Care Funding Arrangements in England: International Lessons, Applied Economic Perspectives and Policy 34 (2) : Chiuri M C and Jappelli T (2010) Do the elderly reduce housing equity? An international comparison, Journal of Population Economics 23 (2) : In this paper the authors compare the level, composition and distribution of household wealth in five industrial countries: the UK, US, Italy, Finland and Sweden. They exploit the harmonized data within the Luxembourg Wealth Study, extended to allow us to examine trends in the UK and the US between the mid-1990s and the mid- 2000s. They find that the Nordic countries have lower average wealth holdings, smaller absolute gaps between low wealth and high wealth households but high relative measures of wealth inequality. Italian households hold very little debt and are much more likely to own their homes outright, leading to relatively high median levels of wealth. In contrast American households tend to hold much more housing debt well into retirement. Increases in owner occupation and house prices in the UK has led to substantial increases in wealth, particularly median wealth holdings and this had led to falls in relative measures of wealth inequality such as the Gini coefficient even though absolute gaps between high and low wealth households have grown substantially. We show that there are underlying country differences in terms of distributions of age, household composition, educational attainment and income as well as wealth and debt portfolios. Educational loans are increasing in their size and prevalence in some countries and look set to create some marked differences in the distribution of wealth for different age cohorts. See: Funding long term care section (above) The authors explore the pattern of elderly homeownership using 60 microeconomic surveys on about 300,000 individuals residing in 15 OECD countries. In all countries, the survey is repeated over time, permitting construction of an international dataset of repeated cross-sectional data. We find that ownership rates decline considerably after age 60. However, a large part of the decline depends on cohort effects. Adjusting for them, they find that ownership rates start falling after age 70 and reach a percentage point per year decline after age 75. The authors find that differences across country ownership trajectories are correlated with indicators measuring market regulation degree. 68
69 Toussaint J and Elsinga M (2010) Dutch households strategies for old age and the role of housing wealth, Teorija In Praksa 47 (5) : Elsinga M, Jones A, Quilgars D and Toussaint J (2010) Households Perceptions on Old Age and Housing Equity, Debates surrounding pension and care provision for the elderly echo with the term ageing. Dutch households have reason to save and invest more in order to guarantee their future financial wellbeing. An increasing number of people are investing in owner-occupation, and the question is whether this is a deliberate financial strategy. This paper presents the outcomes of interviews held with a number of households as part of the EU Demographic Change and Housing Wealth project. Selling the property or taking out a reverse mortgage in retirement was not necessarily a general plan, although the nonretired were able to imagine doing so. However, housing wealth might prove inadequate as people do not generally intend to repay their mortgage in full. See: Releasing equity from housing wealth section (above) 69
70 Lauridsen J and Skak M (2009) Demographic Change and Housing Wealth, DEMHOW Key findings include: The homeownership rate differs considerably between the European member states with high rates in southern Europe, gradually falling when one travel northwards. Findings on the micro level do not support the hypothesis of substitutability between housing wealth and financial wealth including private pension systems, which were found in the macro cross country study. There is a positive relation between received inheritance and gifts, which shows a transfer of wealth between generations. This intergenerational transfer may include inheritance of both family owned homes not sold on the market, and a transfer of financial means partly in the form of proceeds from a sale of the parents home. Unemployment and disablement reduces the probability for ownership, showing that ownership is not an option for many old age households in high need for public support. The study also shows a trajectory for ownership over the ages with falling probability after 68 years of age, which indicates a use of housing equity for consumption purposes simply by selling the home and moving into rental housing during the pension ages - although this cross section study covers age, cohort and year effects and formally cannot be interpreted as an age trajectory. A regression on the percentage of outstanding mortgage shows a significant age profile where home owning old age households continue to reduce the mortgage after retirement. Using housing equity for consumption by the way of increasing the mortgage debt is in general not used by old age European pensioners. Financial wealth covers deposits on bank accounts, holdings of bonds and shares, and pension savings systems. It is less than ten percent of total household wealth in southern Europe and above thirty percent in Nordic countries. A regression on financial wealth reveals an age profile with a top point around the age of 68 after which the financial wealth is run down in accordance with the life cycle model. Ownership has no significant effect on non-housing consumption per equivalised person, but old age homeowners have significantly higher consumption when housing consumption including imputed rent for owners is added. An analysis of economic distress among old age European households gives significantly lower stress for homeowners after controlling for differences in other variables including income and wealth. Both gifts given and the chance of leaving inheritance is positively affected by the size of housing wealth, but not affected by the size of financial wealth. Moreover homeowners have 30 per cent higher probability than tenants for giving gifts and nine times higher probability for expressing a positive chance of leaving inheritance. 70
71 Toussaint J and Elsinga M (2009) Exploring housing and asset-based welfare can the UK be held up as an example for Europe?, Housing Studies 24 (5) : Vorms B (2009) Home ownership as wealth over the life cycle. European Household Motivation for Residential Assets - Current situation and future prospects, Christelis D, Jappelli T, Paccagnella O and Weber G (2009) Income, wealth and financial fragility in Europe, Journal of European Social Policy 19 (4) : In the UK, homeownership has become increasingly important as a financial asset used for welfare needs, particularly during old age. It has been suggested that other European countries will follow the example of the UK. Traditionally, homeownership has been regarded positively because of the low housing expenses associated with outright ownership and the financial benefit of having a nest-egg that can be released, if needed, by selling. New mortgage equity release products reduce liquidity constraints and are regarded as promising in the context of changing welfare states. This research focuses on household strategies. It finds that housing assets play a role in households' financial planning in all countries within the study, particularly where welfare levels are low or decreasing. Homeownership was used in the traditional way in all countries, but it is only in the UK that households have adopted mortgage equity release products to cash in their housing equity for welfare needs. See: Attitudes to housing, wealth and the release of equity section (above) The article examines the distribution of income and wealth among the generation of Europeans aged 65 and over, using data drawn from the first wave of the Survey of Health, Ageing and Retirement in Europe (SHARE). It looks at how cross-country comparisons of income, wealth and debt are affected by differences in purchasing power, household size and taxation, and shows that some seemingly wide international differences appear less so when the proper adjustments are made. The article reveals wide differences in income, wealth and indebtedness of older households in Europe, and provides background information on social issues such as the adequacy of savings at retirement, and older people's financial fragility. 71
72 Dol K and Neuteboom P (2009) Macro change and micro behaviour: the effects of aging on tenure choice, and households strategies towards the use of housing wealth, Delft, The Netherlands: Delft University of Technology / Research Institute OTB This study tested four hypotheses: A - In countries with a (relatively) substandard pension system, in combination with a low developed mortgage market, households will turn to homeownership more often, and will repay their mortgage debt earlier in order to reduce housing costs. >> Hypothesis confirmed. B - In countries with a (relatively) substandard pension system, in combination with a high-developed mortgage market, households will use housing wealth as collateral for new mortgages in order to increase their income flow for pension financing. >> Hypothesis rejected. C - In countries with a (relatively) advanced pension system, in combination with a low developed mortgage market, households will be more often renters, and housing wealth remain unused (i.e. intergenerational transfers). >> Hypothesis confirmed. D - In countries with a (relatively) advanced pension system, in combination with a high-developed mortgage market, households will use housing wealth as collateral for new mortgages in order to increase their income flow over the life cycle. >> Hypothesis confirmed. Parkinson S, Searle B A, Smith S J, Stokes A and Wood G A (2009) Mortgage equity withdrawal in Australia and Britain: towards a wealth-fare state?, European Journal of Housing Policy 9 (4) : Reifner U, Clerc-Renaud S, Pérez-Carrillo E F, Tiffe A and Knobloch M (2009) Study on Equity Release Schemes in the EU - Part I: General Report, Hamburg: Institut für Finanzdienstleistungen e.v. See: Releasing equity from housing wealth section (above) See: Releasing equity from housing wealth section (above) 72
73 Haffner M E A (2008) Savings for old age? Housing wealth of the Dutch elderly, Housing, Theory and Society 25 (2) : Elsinga M, De Decker P, Teller N and Toussaint J (2007) Home ownership: beyond asset and security. Perceptions of housing related security and insecurity in eight European countries, Amsterdam: IOS Press Costa-Font J, Mascarilla-Miro O and Elvira D (2006) Means testing and the heterogeneity of housing assets: funding long-term care in Spain, Social Policy & Administration, 40 (5) : Glendinning C, Davies B, Pickard L and Comas- Herrera A (2004) Funding long-term care for older people: lessons from other countries, York: Joseph Rowntree Foundation - JRF : 35 pp Izuhara M (2002) Care and inheritance: Japanese and English perspectives on the "generational contract", Ageing and Society, vol 22, part 1 22 (1) : Beal D J (2001) Use of housing wealth by older Australians, Australasian Journal on Ageing 20 (3) : A combination of the demographic trend of an ageing population and the increase in wealth in owneroccupied dwellings over the last decade raises a new research question in the Netherlands. How do the Dutch elderly spend their housing wealth and what can be predicted about their future behaviour? They may use their housing equity to provide an income in old age, or they may pass on their housing wealth to descendants. By compiling evidence available in the Netherlands, this article examines the use(s) to which the Dutch elderly put their housing wealth. The analysis is based on data, literature and information collected during interviews with elderly people. The main conclusion is that housing wealth will, for the greater part, keep on functioning as unused savings for the Dutch elderly for the foreseeable future. See: Attitudes to housing, wealth and the release of equity section (above) See: Funding long term care section (above) See: Funding long term care section (above) See: Inheritance section (above) See: Housing as wealth section (above) 73
74 j) Statistical sources Study Office for National Statistics (ONS) (2014) Property Wealth, Wealth in Great Britain In: Wealth in Great Britain Wave 3, Release, Key Points Findings Aggregate net property wealth for all private households in Great Britain increased by 149 billion (4%) to 3,528 billion in current prices between 2008/10 and 2010/12. However, aggregate net property wealth was still lower than the value seen in 2006/08 ( 3,532 billion). In 2010/12, half of all households had net property wealth of 150,000 or more. The highest median value of net property wealth was seen amongst households in London, where half of all households had net property wealth of 239,000 or more. Half of all households with a mortgage on their main residence owed 80,000 or more in 2010/12. Dilnot A (2011) Briefing note on the Report of the Commission on Funding of Care and Support, Summary statistical data to backup the Report of the Commission on Funding of Care and Support. 74
75 Daffin C (ed), Office of National Statistics (ONS) (2009) Wealth in Great Britain: main results from the wealth and assets survey, 2006/08, The survey estimated total wealth (including private pension wealth) in Great Britain in 2006/08 at 9.0 trillion. Property wealth (net) and private pension wealth each accounted for 39 per cent of total wealth in 2006/08 ( 3.5 trillion), while financial wealth (net) and physical wealth each contributed 11 per cent ( 1.0 trillion). The median household wealth was 204,500 in 2006/08. Over two-thirds of households in Great Britain owned their home in 2006/08; 32 per cent of households did not own their home, 30 per cent owned their home outright and 38 per cent were buying with the help of a mortgage. In 2006/08, 98 per cent of households had net financial wealth either positive balances, if assets were greater than liabilities (75 per cent), or negative balances if liabilities were greater than assets (23 per cent). Median values of financial wealth in 2006/08 were much lower than mean values, indicating a skewed distribution. Half of all households in Britain had gross financial wealth of 7,200 or less and net financial wealth of 5,200 or less. The analysis also shows that 25 percent of households had net financial wealth that was negligible: a large number of households at the lower end of the distribution had negligible, zero or negative net financial wealth. In 2006/08, the median value of physical wealth was 29,900. A quarter of households had total physical wealth of 15,000 or less (first quartile value), and a quarter had physical wealth of 50,300 or more (third quartile value). 75
76 References Age Concern England - ACE [Opinion Leader] (2009) It's a heck of a gamble, isn't it? Attitudes of older people towards the use of assets for pooling risk of care costs, London: Age Concern Reports : 39 pp Age Concern England - ACE, Policy Unit (2006) Who should pay for care? paying for care in later life, London: Age Concern England - ACE : 52 pp (Age Concern Reports) Appleyard L and Rowlingson K (2010) Home-ownership and the distribution of personal wealth : a review of the evidence, Joseph Rowntree Foundation Banks J, Crawford R and Tetlow G; Department for Work and Pensions - DWP; Institute for Fiscal Studies - IFS (2010) What does the distribution of wealth tell us about future retirement resources? a report of research carried out by the Institute for Fiscal Studies on behalf of the Department for Work and Pensions, London: Department for Work and Pensions - DWP : 90 pp (Department for Work and Pensions Research report 665) Bastagli F and Hills J (2012) Wealth accumulation in Great Britain : the role of house prices and the life cycle, London: ESRC Centre for Analysis of Social Exclusion - CASE, Suntory-Toyota International Centres for Economics and Related Disciplines - STICERD, London School of Economics and Political Science : 30 pp (CASEpaper 166) Beal D J (2001) Use of housing wealth by older Australians, Australasian Journal on Ageing 20 (3) : Boreham R and Lloyd J; National Centre for Social Research - NatCen; International Longevity Centre UK - ILC UK (2007) Asset accumulation across the life course: a report of research carried out by the National Centre for Social Research on behalf of the International Longevity Centre - UK, London: International Longevity Centre - ILC-UK : 35 pp Burgess G, Monk S and Williams P (2013) Equity release amongst older homeowners, Cambridge Centre for Housing and Planning Research Castles F J (1998) The really big trade-off: home ownership and the welfare state in the New world and the Old, Acta Politica 33 : 5-19 Charlesworth A and Thorlby R (2012) Reforming social care: options for funding, Nuffield Trust 76
77 Chiuri M C and Jappelli T (2010) Do the elderly reduce housing equity? An international comparison, Journal of Population Economics 23 (2) : Christelis D, Jappelli T, Paccagnella O and Weber G (2009) Income, wealth and financial fragility in Europe, Journal of European Social Policy 19 (4) : Coe N B and Boyle M A (2013) The Asset and Income Profiles of Residents in Seniors Housing and Care Communities: What Can Be Learned From Existing Data Sets, Research on Aging 35 (1) : Costa-Font J, Gil J and Mascarilla O (2010) Housing Wealth and Housing Decisions in Old Age: Sale and Reversion, Housing Studies 25 (3) : Costa-Font J, Mascarilla-Miro O and Elvira D (2006) Means testing and the heterogeneity of housing assets: funding long-term care in Spain, Social Policy & Administration, 40 (5) : Cowell F A, Karagiannaki E and McKnight A (2013) Accounting for cross-country differences in wealth inequality, London: ESRC Centre for Analysis of Social Exclusion - CASE, Suntory-Toyota International Centres for Economics and Related Disciplines - STICERD, London School of Economics and Political Science : 35 pp (CASEpaper 168) Cowell F, Karagiannaki E and McKnight A (2012) Mapping and measuring the distribution of household wealth: a cross-country analysis, London, UK: Centre for the Analysis of Social Exclusion, London School of Economics and Political Science Denton M and Boos L (2007) The gender wealth gap: structural and material constraints and implications for later life, Journal of Women and Aging 19 (3/4) : Dilnot A (2011) Briefing note on the Report of the Commission on Funding of Care and Support, Dol K and Neuteboom P (2009) Macro change and micro behaviour: the effects of aging on tenure choice, and households strategies towards the use of housing wealth, Delft, The Netherlands: Delft University of Technology / Research Institute OTB Doling J and Elsinga M (2013) Demographic Change and Housing Wealth: Home-Owners, Pensions and Asset-Based Welfare in Europe, Springer 77
78 Doling J and Ronald R (2010) Home ownership and asset-based welfare, Journal of Housing and the Built Environment 25 (2) : Dunning J (28 January 2010) Released from worry [equity release schemes], Community Care, issue 1803 : Elsinga M, De Decker P, Teller N and Toussaint J (2007) Home ownership: beyond asset and security. Perceptions of housing related security and insecurity in eight European countries, Amsterdam: IOS Press Elsinga M, Jones A, Quilgars D and Toussaint J (2010) Households Perceptions on Old Age and Housing Equity, Fernández J-L and Forder J (2010) Equity, efficiency, and financial risk of alternative arrangements for funding long-term care systems in an ageing society, Oxford Review of Economic Policy 26 (4) : Fernandez J-L and Forder J (2012) Reforming Long-term Care Funding Arrangements in England: International Lessons, Applied Economic Perspectives and Policy 34 (2) : Forder J and Fernández J-L (2010) The impact of a tightening fiscal situation on social care for older people, Personal Social Services Research Unit - PSSRU, London School of Economics and Political Science - LSE; Age UK : 8 pp (PSSRU Discussion paper 2723) Glendinning C, Davies B, Pickard L and Comas-Herrera A (2004) Funding long-term care for older people: lessons from other countries, York: Joseph Rowntree Foundation - JRF : 35 pp Haffner M E A (2008) Savings for old age? Housing wealth of the Dutch elderly, Housing, Theory and Society 25 (2) : Hancock R, Katbamna S, Martin G, Clarke H and Stuchbury R; University of Leicester; Joseph Rowntree Foundation - JRF (2002) Attitudes to inheritance: an exploratory study, York: Joseph Rowntree Foundation - JRF : 22 pp Hills J, Bastagli F, Cowell F, Glennerster H, Karagiannaki E, and McKnight A (2013) Wealth in the UK: Distribution, Accumulation, and Policy, Oxford University Press : 256pp Housing and Finance Working Group (2013) Department of Health Steering Group - Housing and Equity, 78
79 International Longevity Centre UK - ILCUK (2004) Asset accumulation and lifestage - an analysis of the wealth of households as they approach and pass the retirement age, Electronic format : 25 pp Isden R, Norton M and Abrahams C (2013) The Dilnot social care cap : making sure it delivers for older people, Age UK Izuhara M (2002) Care and inheritance: Japanese and English perspectives on the "generational contract", Ageing and Society, vol 22, part 1 22 (1) : Jones A, Geilenkeuser T, Helbrecht I and Quilgars D (2012) Demographic Change and Retirement Planning: Comparing Households Views on the Role of Housing Equity in Germany and the UK, International Journal of Housing Policy 12 (1) : Joseph Rowntree Foundation - JRF (2005) Attitudes to inheritance in Britain, York: Joseph Rowntree Foundation - JRF Findings, 0385 : 4 pp Karagiannaki E (2011) Recent trends in the size and the distribution of inherited wealth in the UK, London: ESRC Centre for Analysis of Social Exclusion - CASE, Suntory-Toyota International Centres for Economics and Related Disciplines - STICERD, London School of Economics and Political Science : 31 pp (CASEpaper 146) Karagiannaki E (2011) The impact of inheritance on the distribution of wealth : evidence from the UK, London: ESRC Centre for Analysis of Social Exclusion - CASE, Suntory-Toyota International Centres for Economics and Related Disciplines - STICERD, London School of Economics and Political Science : 35 pp (CASEpaper 148) Kemeny J (2004) Home ownership against the welfare state: the thesis and the evidence - Plenary Address, ENHR Conference, Cambridge University 2-6 July 2004, Kemeny J (2005) The Really Big Trade-Off between home ownership and welfare: Castles' evaluation of the 1980 thesis, and a reformulation 25 years on, Housing, Theory and Society 22 (2) : Kim H (2006) Older women's health and its impact on wealth, Journal of Women & Aging 18 (1) : Kim H and Lee J (2006) The impact of comorbidity on wealth changes in later life, Journals of Gerontology: Series B, Psychological Sciences and Social Sciences 61B (6) : S307-S314 79
80 Lauridsen J and Skak M (2009) Demographic Change and Housing Wealth, DEMHOW Levin E and Price G (2010) Delivering Changes in Housing Wealth Inequality, Department for Communities and Local Government Levin E J and Pryce G (2011) The dynamics of spatial inequality in UK housing wealth, Housing Policy Debate 21 (1) : Lloyd J (2008) Funding long-term care: the building blocks of reform, London: International Longevity Centre - ILC-UK : 30 pp Lloyd J (2008) Navigating the age of inheritance, London: International Longevity Centre UK - ILC-UK : 36 pp Lloyd J; International Longevity Centre UK - ILC UK (2007) Asset accumulation in focus: the challenges ahead, London: International Longevity Centre - ILC-UK : 35 pp Lowe S G, Searle B A and Smith S J (2011) From Housing Wealth to Mortgage Debt: The Emergence, Social Policy & Society 11 (1) : Malpass P (2008) Housing and the new welfare state: Wobbly pillar or cornerstone?, Housing Studies 23 (1) : 1-19 Mayhew L, Karlsson M and Rickayzen B (2010) The Role of Private Finance in Paying for Long Term Care, The Economic Journal 120 (548) : F478-F504 McCann M, Grundy E and O'Reilly D (2012) Why is housing tenure associated with a lower risk of admission to a nursing or residential home? Wealth, health and the incentive to keep my home, Journal of Epidemiology and Community Health 66 (2) : Norris M and Winston N (2012) Home Ownership and Income Inequalities in Western Europe: Access, Affordability and Quality - GINI Discussion Paper 41, Office for National Statistics (ONS) (2014) Property Wealth, Wealth in Great Britain In: Wealth in Great Britain Wave 3, Release, Office of National Statistics (ONS) (2009) Wealth in Great Britain: main results from the wealth and assets survey, 2006/08, 80
81 Ong R, Parkinson S, Searle B A, Smith S J and Wood G A (2013) Channels from Housing Wealth to Consumption, Housing Studies 28 (7) : Orton M and Rowlingson K (2007) A problem of riches: towards a new social policy research agenda on the distribution of economic resources, Journal of Social Policy 36 (1) : Overton L (2010) Housing and Finance in Later Life: A Study of Equity Release Customers, London: Age UK Parkinson S, Searle B A, Smith S J, Stokes A and Wood G A (2009) Mortgage equity withdrawal in Australia and Britain: towards a wealth-fare state?, European Journal of Housing Policy 9 (4) : Personal Finance Research Centre (PFRC), University of Bristol; International Longevity Centre UK - ILC-UK (2013) The mortgage debt of older households and the effect of age: an analysis using the Wealth and Assets Survey , London: International Longevity Centre UK : 12 pp Poterba J M, Venti S F and Wise D A (2011) The Composition and Draw-down of Wealth in Retirement [NBER Working Paper No ], Cambridge, MA: National Bureau of Economic Research Reifner U, Clerc-Renaud S, Pérez-Carrillo E F, Tiffe A and Knobloch M (2009) Study on Equity Release Schemes in the EU - Part I: General Report, Hamburg: Institut für Finanzdienstleistungen e.v. Resolution Foundation (2010) Behind the balance sheet - the financial health of low earning households, London: The Resolution Foundation (electronic format only) : 42 pp Resolution Foundation (2010) Funding future care need: the role of councils in supporting individuals to access the capital in their homes, Ross A, Lloyd J and Weinhardt M; National Centre for Social Research - NatCen; International Longevity Centre UK - ILC-UK (2008) The age of inheritance: a report of research carried out by the National Centre for Social Research on behalf of the ILC-UK, London: ILC-UK : 36 pp Rowlingson K (2006) "Living poor to die rich"? or "Spending the kids' inheritance"?, Journal of Social Policy 35 (2) : Rowlingson K and McKay S D (2011) Wealth and the wealthy: Exploring and tackling inequalities between rich and poor, Policy Press 81
82 Rowlingson K and McKay S ; Joseph Rowntree Foundation - JRF; Department of Social and Policy Sciences, University of Bath (2005) Attitudes to inheritance in Britain, Bristol: The Policy Press, for the Joseph Rowntree Foundation : 88 pp Searle B (2011) Recession and housing wealth, Journal of Financial Economic Policy 3 (1) : Searle B A, Smith S J and Cook N (2006) From housing wealth to well-being: the health implications of savings, spending and debt, Paper prepared for the Sixth European Urban and Regional Studies Conference September, Roskilde, Denmark Smith S J and Searle B A (2008) Dematerialising Money? Observations on the flow of wealth from, Housing Studies 23 (1) : Terry R and Gibson R (2006) Obstacles to equity release, Joseph Rowntree Foundation Terry R and Gibson R (2007) Overcoming obstacles to equity release, Housing, Care and Support 10 (1) : Toussaint J and Elsinga M (2009) Exploring housing and asset-based welfare can the UK be held up as an example for Europe?, Housing Studies 24 (5) : Toussaint J and Elsinga M (2010) Dutch households strategies for old age and the role of housing wealth, Teorija In Praksa 47 (5) : Turner A (2014) Wealth, Debt, Inequality and Low Interest Rates: Four Big Trends and Some Implications, Cass Business School Vorms B (2009) Home ownership as wealth over the life cycle. European Household Motivation for Residential Assets - Current situation and future prospects, Watson M (2009) Planning for the future of asset-based welfare? New Labour, Financialized economic agency and the housing market, Planning, Practice and Research 24 (1) : Williams P (2010) Home equity: accumulation and decumulation through the life cycle, London: The Resolution Foundation (electronic format) : 46 pp Wright F (2002) Asset stripping: local authorities and older homeowners paying for a care home place, Bristol: Policy Press : 40 pp 82
4 Distribution of Income, Earnings and Wealth
 4 Distribution of Income, Earnings and Wealth Indicator 4.1 Indicator 4.2a Indicator 4.2b Indicator 4.3a Indicator 4.3b Indicator 4.4 Indicator 4.5a Indicator 4.5b Indicator 4.6 Indicator 4.7 Income per
Briefing Paper on Equity Release
 COUNCIL of MORTGAGE LENDERS Briefing Paper on Equity Release What is equity release? 1. Equity is the difference between any mortgage you may have and the value of your home. Equity release is a way of
Household Finance and Consumption Survey
 An Phríomh-Oifig Staidrimh Central Statistics Office Household Finance and Consumption Survey 2013 Published by the Stationery Office, Dublin, Ireland. Available from: Central Statistics Office, Information
Can Equity Release Mechanisms fund long term care costs? Desmond Le Grys
 2001 Health Care Conference Can Equity Release Mechanisms fund long term care costs? Desmond Le Grys 1 Introduction 1.1 Scope This paper attempts to explain why equity release products have rarely been
NERI Quarterly Economic Facts Summer 2012. 4 Distribution of Income and Wealth
 4 Distribution of Income and Wealth 53 54 Indicator 4.1 Income per capita in the EU Indicator defined National income (GDP) in per capita (per head of population) terms expressed in Euro and adjusted for
Article: Main results from the Wealth and Assets Survey: July 2012 to June 2014
 Article: Main results from the Wealth and Assets Survey: July 2012 to June 2014 Coverage: GB Date: 18 December 2015 Geographical Area: Region Theme: Economy Main points In July 2012 to June 2014: aggregate
CAVENDISH EQUITY RELEASE. The Essential Guide. Equity Release TRUSTED & IMPARTIAL ADVICE SINCE 1985
 CAVENDISH Equity Release TRUSTED & IMPARTIAL ADVICE SINCE 1985 EQUITY RELEASE The Essential Guide INDEX Welcome to Cavendish Equity Release 3 How can Equity Release be used? 4 Why is specialist advice
Chapter 3: Property Wealth, Wealth in Great Britain 2010-12
 Chapter 3: Property Wealth, Wealth in Great Britain 2010-12 Coverage: GB Date: 15 May 2014 Geographical Area: GB Theme: Economy Key Points Aggregate net property wealth for all private households in Great
Age, Demographics and Employment
 Key Facts Age, Demographics and Employment This document summarises key facts about demographic change, age, employment, training, retirement, pensions and savings. 1 Demographic change The population
Certificate in Regulated Equity Release
 Unit 1: Fundamentals of Equity Release Certificate in Regulated Equity Release Attainment Level knowledge of: K1 Definition of a Home Reversion (HR) plan & alternative methods of equity release/capital
How To Understand The Economic And Social Costs Of Living In Australia
 Australia s retirement provision: the decumulation challenge John Piggott Director CEPAR Outline of talk Introduction to Australian retirement policy Issues in Longevity Current retirement products in
Equity Release Guide. www.seniorissues.co.uk
 Equity Release Guide www.seniorissues.co.uk For more information or to speak to one of our trained advisers please telephone our Senior Issues Team on 0845 855 4411 The Caesar & Howie Group 7/3/2008 EQUITY
WHAT IS EQUITY RELEASE? WHY CONSIDER EQUITY RELEASE?
 WHAT IS EQUITY RELEASE? Equity Release can free some of the capital tied up in your home, while you continue to live there. This money can be in the form of a tax-free lump sum, a regular income or a combination
Defining Housing Equity Withdrawal
 Housing Reserve Equity Bank of Australia Bulletin February 23 Housing Equity The increase in housing prices in recent years has contributed to rising household wealth and has helped to underpin continued
Is equity release the right choice for you? Protecting yourself If it isn t right for you, what are the alternatives?
 Buyer s Guide : Content Page 1: What is equity release? Page 2: Is equity release the right choice for you? Page 3: Protecting yourself If it isn t right for you, what are the alternatives? Page 4: Lifetime
êéëé~êåü=üáöüäáöüí House Prices, Borrowing Against Home Equity, and Consumer Expenditures lîéêîáéï eçìëé=éêáåéë=~åç=äçêêçïáåö ~Ö~áåëí=ÜçãÉ=Éèìáíó
 êéëé~êåü=üáöüäáöüí January 2004 Socio-economic Series 04-006 House Prices, Borrowing Against Home Equity, and Consumer Expenditures lîéêîáéï The focus of the study is to examine the link between house
For many Australians, their main form of savings over their lifetime is their home. Directing savings towards a home provides two benefits:-
 1. Executive Summary For many Australians, their main form of savings over their lifetime is their home. Directing savings towards a home provides two benefits:- Ø A place to live, with security of tenure.
Questioni di Economia e Finanza
 Questioni di Economia e Finanza (Occasional Papers) Main results of the Eurosystem's Household Finance and Consumption Survey: Italy in the international context by Romina Gambacorta, Giuseppe Ilardi,
Home-ownership and the distribution of personal wealth
 JRF programme paper: Housing Market Taskforce Home-ownership and the distribution of personal wealth A review of the evidence Lindsey Appleyard and Karen Rowlingson September 2010 This paper: outlines
Our Home Reversion Plan. Enjoy your retirement by unlocking the value of your home
 Our Home Reversion Plan Enjoy your retirement by unlocking the value of your home I can now have the garden I ve always wanted. 1 Bridgewater Equity Release Limited the Home Reversion Plan experts Bridgewater
The Burden of Financial and Property Debt, Great Britain, 2010 to 2012
 The Burden of Financial and Property Debt, Great Britain, 2010 to 2012 Coverage: GB Date: 27 July 2015 Geographical Area: Region Theme: Economy Theme: People and Places Foreword Using the Wealth and Assets
largeequityrelease.com EQUITY RELEASE GUIDE Speak to one of our specialists today on 020 3824 0904
 largeequityrelease.com EQUITY RELEASE GUIDE Speak to one of our specialists today on 020 3824 0904 CONTENTS What is equity release?... 3 How much money could I raise through an equity release?... 4 What
Personal debt ON LABOUR AND INCOME
 ON LABOUR AND INCOME Personal debt Although the economy and population are almost times the size of s, the two countries show several similarities. Both have relatively high per-capita income and living
Main Report: The Burden of Property Debt in Great Britain, 2006/08 & 2008/10
 Main Report: The Burden of Property Debt in Great Britain, 2006/08 & 2008/10 Coverage: England and Wales Date: 13 May 2013 Geographical Area: Region Theme: Economy Key Points This release focuses on the
Retirement Income White Paper Insights Presentation
 Retirement Income White Paper Insights Presentation Alun Stevens Jack Ding Nathan Bonarius Agenda Background Preliminary projections What are the risks? What are the possible solutions? Purpose of presentation
Equity Release An easy to understand guide just for you
 TRuE BEARing ChARTEREd e Right direction for Financial Advice Equity Release An easy to understand guide just for you True Bearing Chartered 2 Buckshaw Court, East Terrace Business Park Euxton Lane, Euxton,
Principles and key features of required reform
 3 Principles and key features of required reform Given the realities outlined in Chapters 1 and 2 the Pensions Commission believes that minor changes in policy, tinkering with the present system, will
The self-employed and pensions
 BRIEFING The self-employed and pensions Conor D Arcy May 2015 resolutionfoundation.org [email protected] +44 (0)203 372 2960 The self-employed and pensions 2 The UK s self-employed populace
Reverse Mortgages A Source of Funds for Retirement?
 Reverse Mortgages A Source of Funds for Retirement? Many people make it a goal of their financial lives to invest in a home. It is a great accomplishment when that last mortgage payment is made. Can a
A simple guide to getting more from your future with. Aviva Equity Release. Best Equity Release Lender
 A simple guide to getting more from your future with Aviva Equity Release Best Equity Release Lender J4602_PF011120_1015.indd 1 09/10/15 8:06 pm Contents An introduction to Aviva Equity Release What is
Equity Release. Standards for Appropriate Examinations. AES3/011206 Financial Services Skills Council 2006 1
 Equity Release Standards for Appropriate Examinations AES3/011206 Financial Services Skills Council 2006 1 The Standards The Standards contain the following information: 1. The learning outcomes that must
A Guide to Releasing Capital from your Home
 Advice for older people A Guide to Releasing Capital from your Home Advice provided by Advice for older people FirstStop Advice brings together the expertise of some of the most trusted and respected organisations
Making the most of your retirement
 Making the most of your retirement A guide to equity release and our advice service Provided by Contents Welcome from the Age UK Group 3 Do more with your retirement 4 What is equity release? 5 Is equity
RELEASING CASH FROM YOUR HOME
 RELEASING CASH FROM YOUR HOME As a recommended adviser for the Society of Later Life Advisers (SOLLA) we are frequently asked to advise on home income/equity release plans. These notes are designed to
Monitoring the social impact of the crisis: public perceptions in the European Union (wave 6) REPORT
 REPORT") Eurobarometer Monitoring the social impact of the crisis: public perceptions in the European Union (wave 6) REPORT Fieldwork: December 2011 Publication: April 2012 This survey has been requested by Directorate-General
Eurobarometer Monitoring the social impact of the crisis: public perceptions in the European Union (wave 6) REPORT Fieldwork: December 2011 Publication: April 2012 This survey has been requested by Directorate-General
Chapter 5: Financial Wealth, Wealth in Great Britain 2010-12
 Chapter 5: Financial Wealth, Wealth in Great Britain 201012 Coverage: GB Date: 15 May 2014 Geographical Area: Region Theme: Economy Key points Aggregate net financial wealth for all private households
Inheritance tax planning and the family home
 Inheritance tax planning and the family home An overview and options for lifetime planning technical factsheet Introduction Leading tax and legal experts agree that a family home should only form part
Statistical Bulletin. The Effects of Taxes and Benefits on Household Income, 2011/12. Key points
 Statistical Bulletin The Effects of Taxes and Benefits on Household Income, 2011/12 Coverage: UK Date: 10 July 2013 Geographical Area: UK and GB Theme: Economy Theme: People and Places Key points There
Income Tax Liabilities Statistics 2012-13 to 2014-15
 Coverage: United Kingdom Theme: The Economy Released: 13 February 2015 Next Release: May 2015 Frequency of release: Twice yearly (Jan/Feb and Apr/May) Income Tax Liabilities Statistics 2012-13 to 2014-15
Equity Release Guide. Helping you make the right decision. nationwide service all lenders available personal visits. www.therightequityrelease.co.
 Equity Release Guide 0800 612 5749 www.therightequityrelease.co.uk Helping you make the right decision nationwide service all lenders available personal visits 1 Welcome to The Right Equity Release Who
Your retirement could have even more going for it
 Your retirement could have even more going for it A straightforward guide to equity release For no obligation advice: call 0800 015 0993 www.justretirementsolutions.com Contents Imagine what you could
Contents... 2. Executive Summary... 5. Key Findings... 5. Use of Credit... 5. Debt and savings... 6. Financial difficulty... 7. Background...
 CREDIT, DEBT AND FINANCIAL DIFFICULTY IN BRITAIN, A report using data from the YouGov DebtTrack survey JUNE 2013 Contents Contents... 2 Executive Summary... 5 Key Findings... 5 Use of Credit... 5 Debt
Live Long and Prosper? Demographic Change and Europe s Pensions Crisis
 10 November 2015, Brussels Live Long and Prosper? Demographic Change and Europe s Pensions Crisis Key Note Speech Dr. Jochen Pimpertz Head of Research Unit Public Finance, Social Security, Income and Wealth
Composition of Farm Household Income and Wealth
 Composition of Farm Household Income and Wealth Today it is rare for any household to receive all of its from a single source. Even when only one household member is employed, it is possible to earn from
KEY GUIDE. Financial protection for you and your family
 KEY GUIDE Financial protection for you and your family Protecting what matters most Life and health insurance protection underpins most good financial planning. These types of insurance can ensure that
09 February 2012. Housing Strategy Team Welsh Government Rhydycar Business Park Merthyr Tydfil, CF48 1UZ. Dear Sir/Madam
 09 February 2012 Housing Strategy Team Welsh Government Rhydycar Business Park Merthyr Tydfil, CF48 1UZ Dear Sir/Madam Re: Older people s housing and a new Housing Bill for Wales Thank you for the opportunity
Opening Conference of the GINI Project March 2010 Income inequality in historical and comparative perspective
 Opening Conference of the GINI Project March 10 Income inequality in historical and comparative perspective A B Atkinson, Nuffield College, Oxford and LSE 1 1. Underlying themes 2. Income inequality over
Transfer issues and directions for reform: Australian transfer policy in comparative perspective
 Transfer issues and directions for reform: Australian transfer policy in comparative perspective Peter Whiteford, Social Policy Research Centre, University of New South Wales [email protected] 1
The Reverse Mortgage-a Response to Ageing Polish Society
 2011 International Conference on Financial Management and Economics IPEDR vol.11 (2011) (2011) IACSIT Press, Singapore The Reverse Mortgage-a Response to Ageing Polish Society Iwa Kuchciak 1 + 1 University
SUBMISSION TO INQUIRY INTO AFFORDABLE HOUSING. Prepared by National Policy Office
 SUBMISSION TO INQUIRY INTO AFFORDABLE HOUSING Prepared by National Policy Office March 2014 COTA Australia Authorised by: Ian Yates AM Chief Executive [email protected] 0418 835 439 Prepared by: Jo Root
Home equity: accumulation and decumulation through the life cycle. Peter Williams, Hon Professor, University of York. for the Resolution Foundation
 Home equity: accumulation and decumulation through the life cycle Peter Williams, Hon Professor, University of York for the Resolution Foundation March 2010 This report is published alongside a second
Paying for your own residential care
 Paying for your own residential care June 2015 Page 1 Contents How will I know whether my needs have to be met by residential care?... 3 How do I find a home?... 3 How much will I have to pay towards the
4. Work and retirement
 4. Work and retirement James Banks Institute for Fiscal Studies and University College London María Casanova Institute for Fiscal Studies and University College London Amongst other things, the analysis
2012 HOUSEHOLD FINANCIAL PLANNING SURVEY
 2012 HOUSEHOLD FINANCIAL PLANNING SURVEY A Summary of Key Findings July 23, 2012 Prepared for: Certified Financial Planner Board of Standards, Inc. and the Consumer Federation of America Prepared by: Princeton
A Guide to Equity Release in Retirement
 A Guide to Equity Release in Retirement 1. Introduction For the retirement you deserve 2. What is Equity Release? 3. Equity Release Plans The options available to you 4. The Application Process 5. Questions
Council of Mortgage Lenders Equity release leaflet unlocking the value of your home
 Council of Mortgage Lenders Equity release leaflet unlocking the value of your home What is equity release? Equity is the difference between any mortgage you may have and the value of your home. Equity
BS2551 Money Banking and Finance. Institutional Investors
 BS2551 Money Banking and Finance Institutional Investors Institutional investors pension funds, mutual funds and life insurance companies are the main players in securities markets in both the USA and
Saga Equity Release Advice Guide
 Your guide to Equity Release Expert advice with no obligation Your introduction to equity release Your retirement should give you the freedom to do all the things in life you haven t had time for. However,
Construction of variables from CE
 Online Appendix for Has Consumption Inequality Mirrored Income Inequality? by Mark Aguiar and Mark Bils In this appendix we describe construction of the variables in our data set and the impact of sample
Public and Private Sector Earnings - March 2014
 Public and Private Sector Earnings - March 2014 Coverage: UK Date: 10 March 2014 Geographical Area: Region Theme: Labour Market Theme: Government Key Points Average pay levels vary between the public and
Measuring National Well-being - Personal Finance, 2012
 Measuring National Well-being - Personal Finance, 2012 Author Name(s): Carla Seddon Office for National Statistics Abstract This article is published as part of the Office for National Statistics (ONS)
The Return of Saving
 Martin Feldstein the u.s. savings rate and the global economy The savings rate of American households has been declining for more than a decade and recently turned negative. This decrease has dramatically
The Economists Voice
 The Economists Voice Volume 2, Issue 1 2005 Article 8 A Special Issue on Social Security Saving Social Security: The Diamond-Orszag Plan Peter A. Diamond Peter R. Orszag Summary Social Security is one
Challenger Retirement Income Research. How much super does a retiree really need to live comfortably? A comfortable standard of living
 14 February 2012 Only for use by financial advisers How much super does a retiree really need to live comfortably? Understanding how much money will be needed is critical in planning for retirement One
Policy Response Buy to Let Tax Relief
 Savills World Research Policy Response Buy to Let Tax Relief Autumn 215 savills.co.uk/research In his May budget the Chancellor announced a limit on mortgage interest relief for buy to let investors in
An international comparison of apprentice pay: Executive Summary. Low Pay Commission
 An international comparison of apprentice pay: Low Pay Commission October 2013 About is one of Europe's leading specialist economics and policy consultancies and has its head office in London. We also
RELEASING CASH FROM YOUR HOME
 RELEASING CASH FROM YOUR HOME As a recommended SOLLA adviser we are frequently asked to advise on home income/equity release plans. These notes are designed to provide some general background to clients
Impact on households: distributional analysis to accompany Spending Review and Autumn Statement 2015
 Impact on households: distributional analysis to accompany Spending Review and Autumn Statement 2015 November 2015 Impact on households: distributional analysis to accompany Spending Review and Autumn
The Saga Guide to Paying for Care
 The Saga Guide to Paying for Care Welcome An active and secure retirement is something we like to think we re all entitled to and we find it hard to imagine a time beyond that, when we may need care from