Beyond the IT Department: Empowering business users to leverage data. Lee Eckersley Head of Business Analysis alpharooms.com
|
|
|
- Charleen Williams
- 8 years ago
- Views:
Transcription
1 Beyond the IT Department: Empowering business users to leverage data Lee Eckersley Head of Business Analysis alpharooms.com


2 About alpharooms.com New RWD website released in Nov 2013

3 A simplistic view of how an OTA Marketing operates Attract the right people to the site at the lowest possible cost. Sales Funnel Right Product Overheads Right Price Marketing Commission/ Margin

4 The Starting Point Never had a dedicated Business Intelligence Analyst. Existing reporting designed and developed by DBA s/developers in IT. Most reporting came from a single SSAS cube accessed through Excel, that gave a view of the company General Ledger. No visualisation except for charts in Excel. SSRS (2005) was used for some reporting but was found to be slow to develop and poor in visualisation. Only people comfortable with Excel pivots could get any sort of performance reporting.

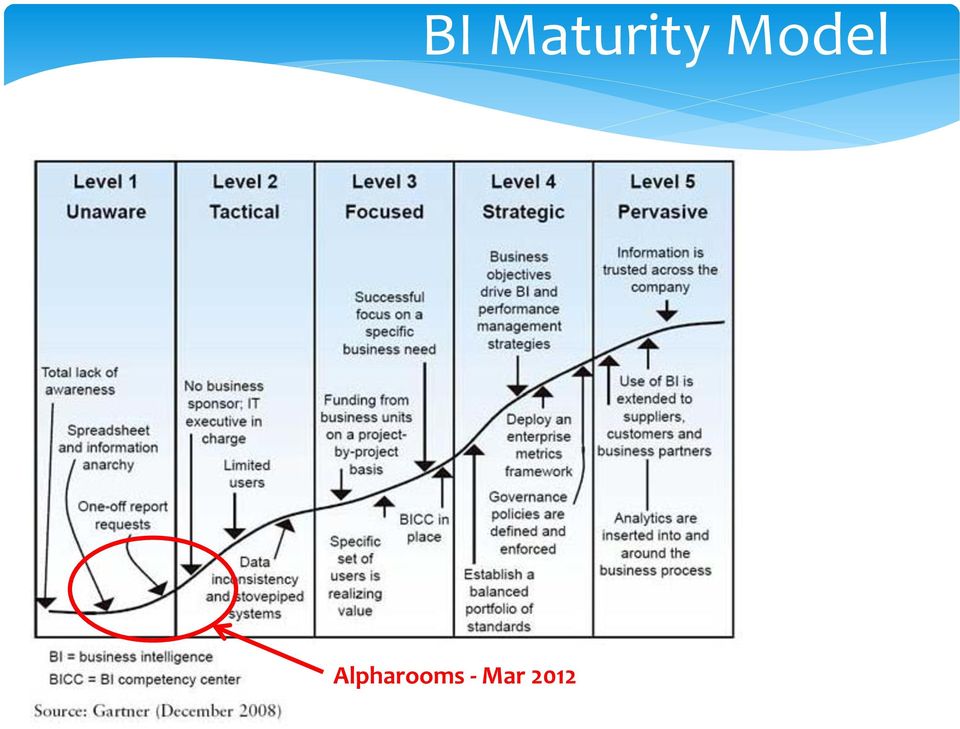
5 BI Maturity Model Alpharooms - Mar 2012

6 The first challenge The Booking view of the Business The General Ledger view of the business had a number of pitfalls, so a booking view of the business was required. Reporting required on an individual, product sale level, taking generic information from the Itin and Booking Level, without the complications of financial comings and goings like cancellations and modifications. This was only available through SQL queries, so a new platform for this data was required that would allow self service reporting.


7 The Selection Process What I had used Too Expensive Too Expensive What I heard of Within Budget But required Consultants What I could find Too Expensive Could not get to grips with it

8 Why we chose SiSense Prism Elasticube Manager provided an extremely easy way to connect to our database. Report development environment was easy to use and extremely fast to build up dashboards and reports with instant results. Two click publishing to the web, easy to share dashboards. Crunched large amounts of data very fast. Ease of creating Hierarchies with drill down and expand functionality. No IT overhead required, no consultants required.


9 Elasticube Manager Data Connectors Elasticube Manger, allows you to access a number of sources of data without the need for any coding, just point it at your data sets.

10 Elasticube Manager Once you have used the data connector you can then use drag and drop functionality to join all your data sets together, using the table s Primary and Foreign keys. This creates a full outer join between the tables, so when you use the BI studio to create dashboards, you can just link to one table, or retrieve data from multiple tables that have a relationship. This was perfect for the booking view of the Business to allow reporting at the different levels required.

11 Self Service Reporting A suite of interactive, self service dashboard style reporting was created for our overseas hotel contracting team, allowing them to look at several views of the data, to get the insight required from the data


12 Typical Self Service Report Typical self service report allows a number of filters on the data, in this case so that the information can be filtered at a Destination Level all the way down to Hotel. A range of date filters can be applied. The user can choose which metric columns they wish to be displayed in the Pivot. They key KPI s are shown in graphical format. The Pivot allows drill down/expand functionality to look at the data at a deeper level.


13 Hierarchies Drill Down and Expand Hierarchies are created through just simple drag and drop, and allow you to drill down in to any data field you wish, you do not have to have pre-programmed specific Geographical and Channel hierarchies, in the below example the user can drill down through geographical hierarchies like Destination, Resort and Hotel and then jump in to rate provider details. It also allows you to jump from any level above to any level below, so for example you can see a breakdown of all vendors at a Destination level, you do not have to drill down to a specific hotel first.

14 BI Maturity Model Revisited Alpharooms - Sep 2012

15 One Down Many to go Web Analytics Google Analytics/Dc Storm/Raw SQL Call Centre Sales SSRS/Excel/Phone software provider Marketing DC Storm/Google Adwords/SSAS/Excel Customer Services SSAS/Phone software provider Content SSRS- List reports Competitor Pricing Raw SQL/Excel

16 Further Empower the Business Users All Business data imported into Data Warehouse and governed by the Business Analysis department. Business Analysis department creates Elasticubes for most business units. Business Users given access to the development environment. UK based product employees who regularly travel given full install on their laptops, and carry a cached version of the data. 20 out of the 30 Users given access to Development environment.

17 Time for an upgrade What we had Business Intelligence data spread across 3 reporting servers, the main one was around 8 years old, which had a few sticky plasters attached,running on Windows Server 2008 R2. Prism was installed on a standard developer spec PC with just 8GB of RAM. Now New reporting server built, has multiple multi-core processors, 32GB of RAM, SSD drives, and runs on Windows Server Prism reinstalled on this server and Elasticubes saved on the SSD drives. Prism Web users updated from individual sign on to Active Directory access.


18 The right tool for the job

19 The right tool for the job Whilst the rest of the company was seeing a bit of a data revolution, in a dark corner of IT a new report was being created, it was to interact with the Adwords API and our sales database. MongoDB was chosen as the platform A complete website was developed with the plan of multiple functionality. The most important part was the reporting. 9 Months of development. 2 Month of attempted upgrades and bug fixing. Approx Six Figure Development. After all this was not delivering what was required.

20 The right tool for the job Rethink was required. Exported data from Adwords Client Reporting and created an Import routine into SQL tables. SQL used to create reporting tables. Prism used for Reporting UI. Total development time, two days to get to what we had. Backlog of nice to have s completed in the third day. Solution to automatically update the reporting completed by the fifth day. IT project de-comissioned by day six.

21 The Impact BI has on an Alpharooms customer Right Product BI helps to identify poor content (low image counts/short descriptions, missing facilities) BI helps make sure we have every wholesaler which is available to the Hotel. BI helps identify Hotels/Airlines/Routes missing from the site. BI helps identify Destination s needing attention. BI helps identify issues with searches on site through conversion monitoring. Right Price BI helps the buying team to get the best rates available. BI helps the pricing team set competitive rates, allowing checking of tens of thousands of prices daily. After Sales Customer enquiries are being dealt with in sufficient time. Staffing levels are correct for shorter call waiting. Recurring issues are identified and resolved at source.
22 BI Maturity Model Revisited Alpharooms Nov 2013
23 Questions
Business Intelligence & Product Analytics
 2010 International Conference Business Intelligence & Product Analytics Rob McAveney www. 300 Brickstone Square Suite 904 Andover, MA 01810 [978] 691 8900 www. Copyright 2010 Aras All Rights Reserved.
Business Intelligence and Healthcare
 Business Intelligence and Healthcare SUTHAN SIVAPATHAM SENIOR SHAREPOINT ARCHITECT Agenda Who we are What is BI? Microsoft s BI Stack Case Study (Healthcare) Who we are Point Alliance is an award-winning
MITS Distributor Analytics
 Product Datasheet For TrulinX Users MITS Distributor Analytics A powerful combination of reporting features MITS Distributor Analytics gives you a competitive edge when it comes to making decisions that
Sisense. Product Highlights. www.sisense.com
 Sisense Product Highlights Introduction Sisense is a business intelligence solution that simplifies analytics for complex data by offering an end-to-end platform that lets users easily prepare and analyze
Implementing Data Models and Reports with Microsoft SQL Server
 Course 20466C: Implementing Data Models and Reports with Microsoft SQL Server Course Details Course Outline Module 1: Introduction to Business Intelligence and Data Modeling As a SQL Server database professional,
CRGroup Whitepaper: Digging through the Data. www.crgroup.com. Reporting Options in Microsoft Dynamics GP
 CRGroup Whitepaper: Digging through the Data Reporting Options in Microsoft Dynamics GP The objective of this paper is to provide greater insight on each of the reporting options available to you within
Business Intelligence for Dynamics GP. Presented By: Rob Jackson, Business Intelligence Consultant Brent Keilin, GP Consultant
 Business Intelligence for Dynamics GP Presented By: Rob Jackson, Business Intelligence Consultant Brent Keilin, GP Consultant Agenda Business Intelligence Concepts Business Intelligence for GP: Reporting
Together we can build something great
 Together we can build something great Financial Reports, Ad Hoc Reporting and BI Tools Joanna Broszeit and Dawn Stenbol Education Track Boston Room Monday, May 2nd 2:40 pm Reporting Options with NAV ERP
DATA WAREHOUSE BUSINESS INTELLIGENCE FOR MICROSOFT DYNAMICS NAV
 www.bi4dynamics.com DATA WAREHOUSE BUSINESS INTELLIGENCE FOR MICROSOFT DYNAMICS NAV True Data Warehouse built for content and performance. 100% Microsoft Stack. 100% customizable SQL code. 23 languages.
QLIKVIEW DEPLOYMENT FOR BIG DATA ANALYTICS AT KING.COM
 QLIKVIEW DEPLOYMENT FOR BIG DATA ANALYTICS AT KING.COM QlikView Technical Case Study Series Big Data June 2012 qlikview.com Introduction This QlikView technical case study focuses on the QlikView deployment
Combined Knowledge Business Intelligence with SharePoint 2013 and SQL 2012 Course
 Combined Knowledge Business Intelligence with SharePoint 2013 and SQL 2012 Course COURSE OVERVIEW Mark Macrae Suggested Course Outline: Day 1 Overview and Personal BI - 09:00 : 0 Course Overview - 09:30
Excel 2013 for Business Intelligence (Part 1) Tom Jones President, Iridium Technology LLC
 Tom Jones President, Iridium Technology LLC") Excel 2013 for Business Intelligence (Part 1) Tom Jones President, Iridium Technology LLC Business Intelligence for Law Firms. Period 2013 Iridium Technology LLC Why Two Parts? Two factors Huge interest
Excel 2013 for Business Intelligence (Part 1) Tom Jones President, Iridium Technology LLC Business Intelligence for Law Firms. Period 2013 Iridium Technology LLC Why Two Parts? Two factors Huge interest
In-Memory or Live Reporting: Which Is Better For SQL Server?
 In-Memory or Live Reporting: Which Is Better For SQL Server? DATE: July 2011 Is in-memory or live data better when running reports from a SQL Server database? The short answer is both. Companies today
Ad Hoc Analysis of Big Data Visualization
 Ad Hoc Analysis of Big Data Visualization Dean Yao Director of Marketing Greg Harris Systems Engineer Follow us @Jinfonet #BigDataWebinar JReport Highlights Advanced, Embedded Data Visualization Platform:
How To Use Microsoft Dynamics Gpa
 Business intelligence with Microsoft Dynamics GP Microsoft Dynamics GP: The proven solution for efficiency and insight across your business. More than 40,000 customers use Microsoft Dynamics GP. And for
Cincom Business Intelligence Solutions
 CincomBI Cincom Business Intelligence Solutions Business Users Overview Find the perfect answers to your strategic business questions. SIMPLIFICATION THROUGH INNOVATION Introduction Being able to make
How To Use Sisense Prism
 BUSINESS INTELLIGENCE TOOLS REVIEWS FROM REAL USERS SiSense Prism 2014 IT Central Station is a trusted, objective review site, where real users of BI and other enterprise tech products review the products
Business Benefits From Microsoft SQL Server Business Intelligence Solutions How Can Business Intelligence Help You? PTR Associates Limited
 Business Benefits From Microsoft SQL Server Business Intelligence Solutions How Can Business Intelligence Help You? www.ptr.co.uk Business Benefits From Microsoft SQL Server Business Intelligence (September
In-Memory or Live Data: Which is Better?
 In-Memory or Live Data: Which is Better? AUTHOR: Ellie Fields, Director Product Marketing, Tableau Software DATE: July 2011 The short answer is: both. Companies today are using both to deal with ever-larger
Big Data Visualization with JReport
 Big Data Visualization with JReport Dean Yao Director of Marketing Greg Harris Systems Engineer Next Generation BI Visualization JReport is an advanced BI visualization platform: Faster, scalable reports,
Lost in Space? Methodology for a Guided Drill-Through Analysis Out of the Wormhole
 Paper BB-01 Lost in Space? Methodology for a Guided Drill-Through Analysis Out of the Wormhole ABSTRACT Stephen Overton, Overton Technologies, LLC, Raleigh, NC Business information can be consumed many
Vendor briefing Business Intelligence and Analytics Platforms Gartner 15 capabilities
 Vendor briefing Business Intelligence and Analytics Platforms Gartner 15 capabilities April, 2013 gaddsoftware.com Table of content 1. Introduction... 3 2. Vendor briefings questions and answers... 3 2.1.
Implementing Data Models and Reports with Microsoft SQL Server 20466C; 5 Days
 Lincoln Land Community College Capital City Training Center 130 West Mason Springfield, IL 62702 217-782-7436 www.llcc.edu/cctc Implementing Data Models and Reports with Microsoft SQL Server 20466C; 5
Developing Business Intelligence and Data Visualization Applications with Web Maps
 Developing Business Intelligence and Data Visualization Applications with Web Maps Introduction Business Intelligence (BI) means different things to different organizations and users. BI often refers to
Indiana University Business Intelligence Getting Started: PowerPivot bi.iu.edu
 Indiana University Business Intelligence Getting Started: PowerPivot PowerPivot What Is It? PowerPivot for Excel is a data analysis tool that delivers unmatched computational power directly within the
Embedded Analytics & Big Data Visualization in Any App
 Embedded Analytics & Big Data Visualization in Any App Boney Pandya Marketing Manager Greg Harris Systems Engineer Follow us @Jinfonet Our Mission Simplify the Complexity of Reporting and Visualization
BI4Dynamics provides rich business intelligence capabilities to companies of all sizes and industries. From the first day on you can analyse your
 BI4Dynamics provides rich business intelligence capabilities to companies of all sizes and industries. From the first day on you can analyse your data quickly, accurately and make informed decisions. Spending
How Microsoft IT India s Test Organization Enabled Efficient Business Intelligence
 How Microsoft IT India s Test Organization Enabled Efficient Business Intelligence December 2013 The following content may no longer reflect Microsoft s current position or infrastructure. This content
Welcome to. Business Intelligence 101
 Welcome to Business Intelligence 101 Hi There! Before choosing a (BI) partner, you ll want to understand the essentials about BI including the various categories of analytics, what sort of insight is possible,
End to End Microsoft BI with SQL 2008 R2 and SharePoint 2010
 www.etidaho.com (208) 327-0768 End to End Microsoft BI with SQL 2008 R2 and SharePoint 2010 5 Days About This Course This instructor-led course provides students with the knowledge and skills to develop
Choosing the right Mobile BI tool: SSRS vs Power BI vs Datazen
 Choosing the right Mobile BI tool: SSRS vs Power BI vs Datazen Andrea Martorana Tusa @bruco441 andrea.martoranatusa@gmail.com Sponsors Organizers getlatestversion.it Speaker @bruco441 Analyst/Developer
MicroStrategy Course Catalog
 MicroStrategy Course Catalog 1 microstrategy.com/education 3 MicroStrategy course matrix 4 MicroStrategy 9 8 MicroStrategy 10 table of contents MicroStrategy course matrix MICROSTRATEGY 9 MICROSTRATEGY
Microsoft 20466 - Implementing Data Models and Reports with Microsoft SQL Server
 1800 ULEARN (853 276) www.ddls.com.au Microsoft 20466 - Implementing Data Models and Reports with Microsoft SQL Server Length 5 days Price $4070.00 (inc GST) Version C Overview The focus of this five-day
Big Data Visualization and Dashboards
 Big Data Visualization and Dashboards Boney Pandya Marketing Manager Greg Harris Systems Engineer Follow us @Jinfonet #BigDataWebinar JReport Highlights Advanced, Embedded Data Visualization Platform:
The Microsoft Business Intelligence 2010 Stack Course 50511A; 5 Days, Instructor-led
 The Microsoft Business Intelligence 2010 Stack Course 50511A; 5 Days, Instructor-led Course Description This instructor-led course provides students with the knowledge and skills to develop Microsoft End-to-
www.ducenit.com Self-Service Business Intelligence: The hunt for real insights in hidden knowledge Whitepaper
 Self-Service Business Intelligence: The hunt for real insights in hidden knowledge Whitepaper Shift in BI usage In this fast paced business environment, organizations need to make smarter and faster decisions
idashboards FOR SOLUTION PROVIDERS
 idashboards FOR SOLUTION PROVIDERS The idashboards team was very flexible, investing considerable time working with our technical staff to come up with the perfect solution for us. Scott W. Ream, President,
Microsoft Business Intelligence
 Microsoft Business Intelligence P L A T F O R M O V E R V I E W M A R C H 1 8 TH, 2 0 0 9 C H U C K R U S S E L L S E N I O R P A R T N E R C O L L E C T I V E I N T E L L I G E N C E I N C. C R U S S
Enterprise Data Visualization and BI Dashboard
 Strengths Key Features and Benefits Ad-hoc Visualization and Data Discovery Prototyping Mockups Dashboards The application is web based and can be installed on any windows or linux server. There is no
Scalability and Performance Report - Analyzer 2007
 - Analyzer 2007 Executive Summary Strategy Companion s Analyzer 2007 is enterprise Business Intelligence (BI) software that is designed and engineered to scale to the requirements of large global deployments.
Report Builder. Microsoft SQL Server is great for storing departmental or company data. It is. A Quick Guide to. In association with
 In association with A Quick Guide to Report Builder Simon Jones explains how to put business information into the hands of your employees thanks to Report Builder Microsoft SQL Server is great for storing
Making Business Intelligence Relevant for Mid-sized Companies. Improving Business Results through Performance Management
 Making Business Intelligence Relevant for Mid-sized Companies Improving Business Results through Performance Management mydials Inc. 2009 www.mydials.com - 1 Contents Contents... 2 Executive Summary...
How To Choose A Business Intelligence Toolkit
 Background Current Reporting Challenges: Difficulty extracting various levels of data from AgLearn Limited ability to translate data into presentable formats Complex reporting requires the technical staff
Workshop Schedule 2015 4 th Quarter
 Workshop Schedule 2015 4 th Quarter October: 10/6 PDS DASH 10/15 Understanding the IBM Cognos 7 Toolset 10/20 Understanding the IBM Cognos 10 Web Toolset 10/29 PDS Producer November: 11/5 PDS DASH Advanced
The Jet Reports Suite of Products
 The Jet Reports Suite of Products The Jet Reports Suite of Products is an integrated reporting and business intelligence solution that ranges from individual ad-hoc reporting to enterprise level reporting
INSIGHT NAV. White Paper
 INSIGHT Microsoft DynamicsTM NAV Business Intelligence Driving business performance for companies with changing needs White Paper January 2008 www.microsoft.com/dynamics/nav/ Table of Contents 1. Introduction...
Choosing the Right Reporting Tool. Brenda Arnold Jeff Smith
 Choosing the Right Reporting Tool Brenda Arnold Jeff Smith Session Objectives Help your organization get the maximum return on investment in Microsoft Dynamics GP by making you aware of its powerful reporting
Google AdWords, 248 Google Analytics tools, 248 GoogleAdsExtract.xlsx file, 161 GoogleAnalytics, 161
 Index A AccountName table, 20 achieving targets, 41, 47 Activity Goals gauge, 236 Activity level metric, 45, 48, 50 ActivityLevel dataset, 70, 79 Actual close date dimension, 146 Actual value measure,
Need for Business Intelligence
 Wisdom InfoTech Need for Business Intelligence INFORMATION AT YOUR FINGER TIPS May 2007 ABRAHAM PABBATHI Principal Consultant BI Practice Wisdom InfoTech 18650 W. Corporate Drive Suite 120 Brookfield WI
How To Choose A Microsoft Biz (Windows) For Business
 For Business") Data Visualization Choices SQL Saturday #198, Vancouver, BC Paul Turley Mentor, SolidQ SQL Server MVP Presenter Introduction Mentor BI Solution Architect Microsoft certified consultant & trainer Author
Data Visualization Choices SQL Saturday #198, Vancouver, BC Paul Turley Mentor, SolidQ SQL Server MVP Presenter Introduction Mentor BI Solution Architect Microsoft certified consultant & trainer Author
MS 50511A The Microsoft Business Intelligence 2010 Stack
 MS 50511A The Microsoft Business Intelligence 2010 Stack Description: This instructor-led course provides students with the knowledge and skills to develop Microsoft End-to-End business solutions using
Self Service Business Intelligence - how to bring Oracle and DB2 z/os data together
 Self Service Business Intelligence - how to bring Oracle and DB2 z/os data together During my work as presales consultant I found in a lot of big companies this typical data environment: legacy applications,
Whitepaper. Building Effective Dashboards: Measuring for Success. www.sisense.com
 Whitepaper Building Effective Dashboards: Measuring for Success The Fast Lane to BI An increasing number of managers yearn for data to help them make major decisions in the organization, so a dashboard
IBM Cognos Training: Course Brochure. Simpson Associates: SERVICE www.simpson associates.co.uk
 IBM Cognos Training: Course Brochure Simpson Associates: SERVICE www.simpson associates.co.uk Information Services 2013 : 2014 IBM Cognos Training: Courses 2013 2014 +44 (0) 1904 234 510 training@simpson
SMB Intelligence. Reporting
 SMB Intelligence Reporting Introduction Microsoft Excel is one of the most popular business tools for data analysis and light accounting functions. The SMB Intelligence Reporting powered by Solver is designed
Implementing Data Models and Reports with Microsoft SQL Server 2012 MOC 10778
 Implementing Data Models and Reports with Microsoft SQL Server 2012 MOC 10778 Course Outline Module 1: Introduction to Business Intelligence and Data Modeling This module provides an introduction to Business
Getting Started Guide SAGE ACCPAC INTELLIGENCE
 Getting Started Guide SAGE ACCPAC INTELLIGENCE Table of Contents Introduction... 1 What is Sage Accpac Intelligence?... 1 What are the benefits of using Sage Accpac Intelligence?... 1 System Requirements...
Tableau Visual Intelligence Platform Rapid Fire Analytics for Everyone Everywhere
 Tableau Visual Intelligence Platform Rapid Fire Analytics for Everyone Everywhere Agenda 1. Introductions & Objectives 2. Tableau Overview 3. Tableau Products 4. Tableau Architecture 5. Why Tableau? 6.
Business Intelligence and intuitive reporting in one comprehensive solution
 Business Intelligence and intuitive reporting in one comprehensive solution Business Intelligence Jet Enterprise is Business Intelligence and intuitive reporting in one solution that enables analysis and
IBM Cognos Express. Breakthrough BI and planning for midsize companies. Overview
 IBM Cognos Express Breakthrough BI and planning for midsize companies Overview IBM Cognos Express is the first and only integrated business intelligence (BI) and planning solution purpose-built to meet
Power Tools for Pivotal Tracker
 Power Tools for Pivotal Tracker Pivotal Labs Dezmon Fernandez Victoria Kay Eric Dattore June 16th, 2015 Power Tools for Pivotal Tracker 1 Client Description Pivotal Labs is an agile software development
Implementing Data Models and Reports with Microsoft SQL Server
 CÔNG TY CỔ PHẦN TRƯỜNG CNTT TÂN ĐỨC TAN DUC INFORMATION TECHNOLOGY SCHOOL JSC LEARN MORE WITH LESS! Course 20466C: Implementing Data Models and Reports with Microsoft SQL Server Length: 5 Days Audience:
Turnkey Hardware, Software and Cash Flow / Operational Analytics Framework
 Turnkey Hardware, Software and Cash Flow / Operational Analytics Framework With relevant, up to date cash flow and operations optimization reporting at your fingertips, you re positioned to take advantage
Course 50561A: Visualizing SharePoint Business Intelligence with No Code
 3 Riverchase Office Plaza Hoover, Alabama 35244 Phone: 205.989.4944 Fax: 855.317.2187 E-Mail: rwhitney@discoveritt.com Web: www.discoveritt.com Course 50561A: Visualizing SharePoint Business Intelligence
Sage 300 ERP Intelligence Reporting Getting Started Guide. Debra Holder March 2014
 Sage 300 ERP Intelligence Reporting Getting Started Guide Debra Holder March 2014 Table of Contents Introduction... 1 Who Should Read This Guide... 1 About Sage Intelligence Reporting... 1 Benefits of
IBM Cognos Express Essential BI and planning for midsize companies
 Data Sheet IBM Cognos Express Essential BI and planning for midsize companies Overview IBM Cognos Express is the first and only integrated business intelligence (BI) and planning solution purposebuilt
How To Use Sap Business Objects For Microsoft (For Microsoft) For Microsoft (For Pax) For Pax (For Sap) For Spera) For A Business Intelligence (Bio) Solution
 For Microsoft (For Pax) For Pax (For Sap) For Spera) For A Business Intelligence (Bio) Solution") SAP BusinessObjects FOR MICROSOFT ENVIRONMENTS MAKE BETTER DECISIONS TODAY SAP Solution Brief SAP BusinessObjects Business Intelligence Solutions SAP BusinessObjects FOR MICROSOFT ENVIRONMENTS SAP BusinessObjects
SAP BusinessObjects FOR MICROSOFT ENVIRONMENTS MAKE BETTER DECISIONS TODAY SAP Solution Brief SAP BusinessObjects Business Intelligence Solutions SAP BusinessObjects FOR MICROSOFT ENVIRONMENTS SAP BusinessObjects
The difference between. BI and CPM. A white paper prepared by Prophix Software
 The difference between BI and CPM A white paper prepared by Prophix Software Overview The term Business Intelligence (BI) is often ambiguous. In popular contexts such as mainstream media, it can simply
124 Cromwell Road, London, SW7 4ET www.softelegance.co.uk
 SOFTWARE Frameworks For Business Applications And Product Development SoftElegance USA: 4771 Sweetwater Blvd., Sugar Land, Houston, TX 77479 www.softeleganceusa.com SoftElegance U.K.: 124 Cromwell Road,
Cognos Performance Troubleshooting
 Cognos Performance Troubleshooting Presenters James Salmon Marketing Manager James.Salmon@budgetingsolutions.co.uk Andy Ellis Senior BI Consultant Andy.Ellis@budgetingsolutions.co.uk Want to ask a question?
CorHousing. CorHousing provides performance indicator, risk and project management templates for the UK Social Housing sector including:
 CorHousing CorHousing provides performance indicator, risk and project management templates for the UK Social Housing sector including: Corporate, operational and service based scorecards Housemark indicators
QAD Business Intelligence Dashboards Demonstration Guide. May 2015 BI 3.11
 QAD Business Intelligence Dashboards Demonstration Guide May 2015 BI 3.11 Overview This demonstration focuses on one aspect of QAD Business Intelligence Business Intelligence Dashboards and shows how this
Business Intelligence with Clinical and Operational Data
 Turning Numbers Nate Moore CPA, MBA, FACMPE Business Intelligence with Clinical and Operational Data Learning Objectives Communicate your data vision to IT staff by speaking their language Report on and
Using Tableau Software with Hortonworks Data Platform
 Using Tableau Software with Hortonworks Data Platform September 2013 2013 Hortonworks Inc. http:// Modern businesses need to manage vast amounts of data, and in many cases they have accumulated this data
The Brave New World of Power BI and Hybrid Cloud
 The Brave New World of Power BI and Hybrid Cloud Bhavik.Merchant@nec.com.au 27 th August 2015 Agenda Intro Session Goals Short History Lesson Overview of Power BI Components + Demos Transitioning and Future
SAP Business One and SAP HANA
 SAP Business One and SAP HANA High Performance Analytic Appliance Supernova Forum May, 2014 Hana Adoption Continued innovation Key message HANA innovations adds more value for you the customer Key elements
Izenda & SQL Server Reporting Services
 Izenda & SQL Server Reporting Services Comparing an IT-Centric Reporting Tool and a Self-Service Embedded BI Platform vv Izenda & SQL Server Reporting Services The reporting tools that come with the relational
ORACLE OLAP. Oracle OLAP is embedded in the Oracle Database kernel and runs in the same database process
 ORACLE OLAP KEY FEATURES AND BENEFITS FAST ANSWERS TO TOUGH QUESTIONS EASILY KEY FEATURES & BENEFITS World class analytic engine Superior query performance Simple SQL access to advanced analytics Enhanced
Microsoft Dynamics AX. Reporting and Business Intelligence in Microsoft Dynamics AX
 INSIGHT Microsoft Dynamics AX Reporting and Business Intelligence in Microsoft Dynamics AX White Paper A roadmap for managing business performance with Microsoft Dynamics AX Date: September 2006 http://www.microsoft.com/dynamics/ax/
Reporting Services. White Paper. Published: August 2007 Updated: July 2008
 Reporting Services White Paper Published: August 2007 Updated: July 2008 Summary: Microsoft SQL Server 2008 Reporting Services provides a complete server-based platform that is designed to support a wide
Business Intelligence
 Microsoft Dynamics NAV 2009 Business Intelligence Driving insight for more confident results White Paper November 2008 www.microsoft.com/dynamics/nav Table of Contents Overview... 3 What Is Business Intelligence?...
Business Intelligence
 Microsoft Dynamics NAV 2009 Business Intelligence Driving insight for more confident results White Paper November 2008 www.microsoft.com/dynamics/nav Table of Contents Overview... 3 What Is Business Intelligence?...
August 2014 San Antonio Texas The Power of Embedded Analytics with SAP BusinessObjects
 August 2014 San Antonio Texas The Power of Embedded Analytics with SAP BusinessObjects Speaker: Kevin McManus Founder, LaunchWorks Learning Points Eliminate effort and delay of moving data to the cloud
Embedding Customized Data Visualization and Analysis
 Embedding Customized Data Visualization and Analysis Boney Pandya Marketing Manager Leo Zhao Systems Engineer Follow us @Jinfonet JReport Highlights Advanced, Embedded Data Visualization Platform: High
Data Mining, Predictive Analytics with Microsoft Analysis Services and Excel PowerPivot
 www.etidaho.com (208) 327-0768 Data Mining, Predictive Analytics with Microsoft Analysis Services and Excel PowerPivot 3 Days About this Course This course is designed for the end users and analysts that
Empowered Self-Service with SAP HANA and SAP Lumira. Dennis Scoville BI Evangelist Business Intelligence & Technology Honeywell Aerospace
 Empowered Self-Service with SAP HANA and SAP Lumira Dennis Scoville BI Evangelist Business Intelligence & Technology Honeywell Aerospace Agenda About Honeywell Introduction Self-Service Business Intelligence
BUSINESS INTELLIGENCE
 BUSINESS INTELLIGENCE Microsoft Dynamics NAV BUSINESS INTELLIGENCE Driving better business performance for companies with changing needs White Paper Date: January 2007 www.microsoft.com/dynamics/nav Table
M4 Systems. Batch & Document Management (BDM) Brochure
 Brochure") M4 Systems Batch & Document Management (BDM) Brochure M4 Systems Ltd Tel: 0845 5000 777 International: +44 (0)1443 863910 www.m4systems.com www.dynamicsplus.net Table of Contents Introduction ------------------------------------------------------------------------------------------------------------------
M4 Systems Batch & Document Management (BDM) Brochure M4 Systems Ltd Tel: 0845 5000 777 International: +44 (0)1443 863910 www.m4systems.com www.dynamicsplus.net Table of Contents Introduction ------------------------------------------------------------------------------------------------------------------
Understanding BI. The Top 10 Business Questions That Drive Your BI Technology Requirements
 Understanding BI The Top 10 Business Questions That Drive Your BI Requirements Question 1: Do you need to analyze data in your transactional applications (Salesforce.com, Oracle, SAP, etc ) A business
PROVIDING INSIGHT FOR OPERATIONAL SUCCESS
 idashboards for Operations Management PROVIDING INSIGHT FOR OPERATIONAL SUCCESS idashboards helped Precoat move from manual data mining and paper reports to a system that allows us to identify best practices
IAF Business Intelligence Solutions Make the Most of Your Business Intelligence. White Paper November 2002
 IAF Business Intelligence Solutions Make the Most of Your Business Intelligence White Paper INTRODUCTION In recent years, the amount of data in companies has increased dramatically as enterprise resource
Five Levels of Embedded BI From Static to Analytic Applications
 5 Five Levels of Embedded BI From Static to Analytic Applications Introduction The expanding role of data in business management promises smarter operational applications that manage and automate better
Maximizing Your Storage Investment with the EMC Storage Inventory Dashboard
 Maximizing Your Storage Investment with the EMC Storage Inventory Dashboard Matt Roberts Application Development Practice Lead Copyright 2008 EMC Corporation. All rights reserved. Today s Agenda Complexity
Business Intelligence with Maximizer CRM 10:
 Technical White Paper Business Intelligence with Maximizer CRM 10: Actionable Insight through Dashboards, Reports, and Analytics Contents Introduction...3 Maximizer CRM Dashboards...4 Reporting... 7 Crystal
Pastel Evolution BIC. Getting Started Guide
 Pastel Evolution BIC Getting Started Guide Table of Contents System Requirements... 4 How it Works... 5 Getting Started Guide... 6 Standard Reports Available... 6 Accessing the Pastel Evolution (BIC) Reports...
Deltek Vision 5.1 Analysis and Reporting
 WHITE PAPER Deltek Vision 5.1 Analysis and Reporting Using Microsoft SQL Server 2005 Analysis Services and Microsoft Excel Contents Overview of Analysis Cubes...1 Learning How to Configure and Use Vision
Case Study. Analyzer SaaS BI Helps Millennium Research Group Attract 6% More Clients in Just a Few Months
 Case Study Analyzer SaaS BI Helps Millennium Research Group Attract 6% More Clients in Just a Few Months millennium R E S E A R C H G R O U P A Decision Resouices, Inc.Company Millennium Research Group
Introducing CXAIR. E development and performance
 Search Powered Business Analytics Introducing CXAIR CXAIR has been built specifically as a next generation BI tool. The product utilises the raw power of search technology in order to assemble data for
In-Memory or Live Data: Which Is Better?
 In-Memory or Live Data: Which Is Better? Author: Ellie Fields, Director Product Marketing, Tableau Software July 2011 p2 The short answer is: both. Companies today are using both to deal with ever-larger
MOC 55072 Visualizing Data with SharePoint 2013, Report Builder, PowerPivot & PowerView with NO CODE
 To register or for more information call our office (208) 898-9036 or email register@leapfoxlearning.com MOC 55072 Visualizing Data with SharePoint 2013, Report Builder, PowerPivot & PowerView with NO