Graphing Information
|
|
|
- Catherine Richardson
- 8 years ago
- Views:
Transcription
1 Parts of a Typical Graph Graphing Information In the typical graph used to evaluate behavior, time and behavior are the two variables considered. Each data point on a graph gives two pieces of information: when the behavior was recorded (time) and the level of the behavior at that time (frequency or duration or other dimension). There are six basic components of a graph: The x- and y-axis. Data are presented in a graph within a boundary containing two axes. The horizontal axis is called the x-axis and the vertical axis is referred to as the y-axis. These two axes meet at the bottom left side of the page. In most graphs, the x-axis is longer than the y-axis, especially if repeated observations of the behavior have been made. The labels for the x- and y-axis. The x-axis label usually describes the unit of time during which the behavior was recorded (e.g., sessions, days, weeks). The y-axis label tells you the behavior that is being recorded (e.g., disruptions per session, tantrums per day, depressive episodes per week). In Figure 2, the y-axis is "Number of Checks" and the x- axis is "Days." This would be represented as the rate of checks or number of checks per day. The numbers on the x-and y-axis. On the x-axis the numbers indicate the units of the measurement of time. On the y-axis, the numbers indicate the units of measurement of the behavior. In Figure 2, the numbers on the x-axis are consecutive days (until the follow-up phase) and the y-axis indicates the total number of checks per day. This number is usually set at the highest possible level of the behavior (or the highest recorded level of the behavior). The scale of the y-axis can be an important variable when interpreting graphs. If the scale is set too high or too low, the trends in the data can be misleading. The data points. The data points must be plotted correctly to indicate the level of behavior that occurred at each particular time period. The information on the level of behavior and the time period being documented is taken from the data sheet or other behaviorrecording instrument. Sometimes the frequency taken from the data sheet or other instrument needs to be summarized or added together before a data point can be entered on the graph. For example, if disruptions were being measured during a 45-minute class, the total disruptions that occurred would be added and divided by 45 to obtain a number of disruptions per minute. For this reason, it is important that the total observation time is noted so that these calculations can be made. Once the data point has been calculated (if necessary), each data point is connected to the next point by a line. Phase lines. Each time there is a change that may have an impact on behavior, a vertical line is drawn on the graph. This phase change line can denote the move from baseline (no modifications to the environment) to intervention or from one intervention to another. Data points are not connected across phase change lines. In addition, phase change lines can be used to denote other changes that may impact the behavior (e.g., a change in living

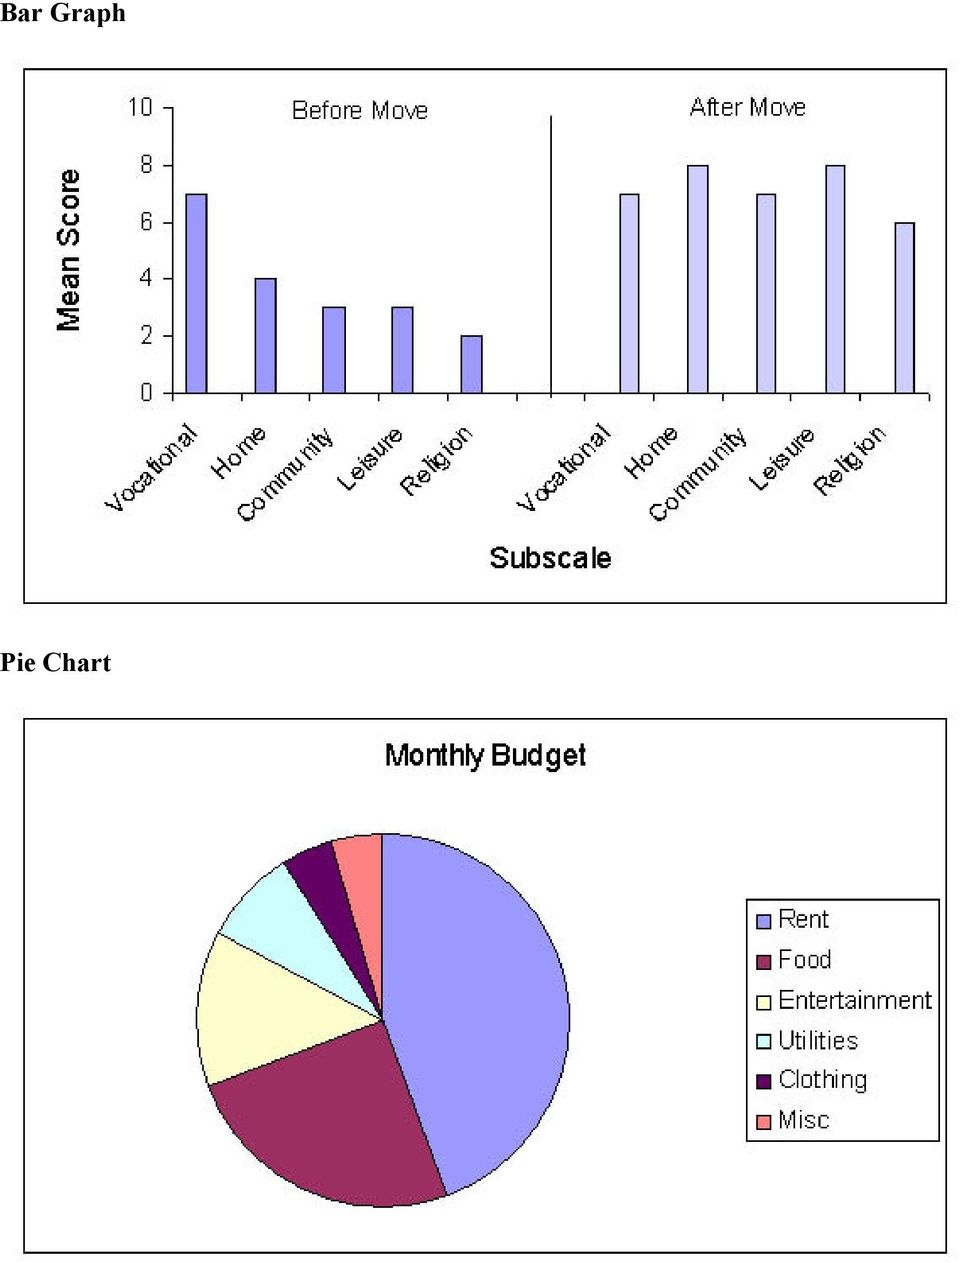
2 placement, a change in teacher or supervisor). If these changes are temporary (e.g., presence of a substitute teacher, illness, dad gone on a trip), then arrows are often used to mark the beginning and end of these temporary factors rather than phase change lines. Phase labels. Each phase in a graph must be labeled. The phase label appears at the top of the graph above the data representing that particular phase. The label for the treatment should be fairly descriptive; in other words, using a term like "Intervention" is usually not clear enough, particularly when more than one intervention is being evaluated. In Figure 2, the phase labels are "Baseline", "1 mg of Medication", and "2 mgs of Medication". Line Graph Note: Line graphs are appropriate with frequency data while bar graphs are commonly used to display information from questionnaires, and other forms of data that use summary scores.

3 Bar Graph Pie Chart
4 Scatter Plot Visual Analysis Although there are no formal rules for using visual analysis, there are properties that are common to all behavioral data. These properties are examined both within phases and across conditions and are related to variability in the data, the level of the data, and trends in the data. Variability Variability refers to the extent to which measures of behavior under the same environmental conditions differ from one another. Fewer data points will be sufficient when there is a high degree of stability in the data. When a lot of variability in performance occurs during a given condition, additional data are needed before moving to a new condition. Levels of behavior The evaluation of the level of a behavior refers to the increase or decrease in a behavior from the beginning to the end of a phase. It is important to evaluate the magnitude and direction of change that has occurred before moving to a new condition. The bigger level of change that occurs, the more powerful the effect of the intervention.

5 Trend Trend refers to the overall direction taken by the path of the data. Trends are described in terms of the direction (for instance, there may be a decreasing, increasing, or zero trend), the degree or "slant" of the trend, and the extent of the variability of the data points around the trend line. Sometimes these lines can be visually represented in a set of data by drawing a line of "best fit" that most closely fits the path of the data. By looking at the steepness and direction of the line, decisions can be made about how effective an intervention has been. Useful References Alberto, P. C., & Troutman, A. C. (1999). Applied behavior analysis for teachers (5 th ed.). Columbus, OH: Merrill.

6 Carr, J. E. & Burkholder, E. O. (1998). Creating single-subject design graphs with Microsoft Excel. Journal of Applied Behavior Analysis, 31, Miltenberger, R. G. (2001). Behavior modification: Principles and procedures. Belmont, CA: Wadsworth/Thomson Learning.
. Behavior modification: Principles and procedures.")