REVENUE AND EXPENDITURE/EXPENSE ANALYSIS
|
|
|
- Grant Terry
- 8 years ago
- Views:
Transcription
1 THE UNIVERSITY OF TEXAS SYSTEM OFFICE OF THE CONTROLLER REVENUE AND EXPENDITURE/EXPENSE ANALYSIS Update 201 Seventh Street, ASH 5 th Floor Austin, Texas

2 Management Discussion Total U. T. System Revenue & Expenditure Analysis Pie Charts Summary of Actual Revenue & Expenditure Trends Graphs of Actual Revenue Trends Graphs of Actual Expenditure Trends Total U. T. Academic Institutions Revenue & Expenditure Analysis Pie Charts Summary of Actual Revenue & Expenditure Trends Graphs of Actual Revenue Trends Graphs of Actual Expenditure Trends Total U. T. Health Institutions Revenue & Expenditure Analysis Pie Charts Summary of Actual Revenue & Expenditure Trends Graphs of Actual Revenue Trends Graphs of Actual Expenditure Trends U. T. System Administration Revenue & Expenditure Analysis Pie Charts Summary of Actual Revenue & Expenditure Trends Graphs of Actual Revenue Trends Graphs of Actual Expenditure Trends U. T. Arlington Revenue & Expenditure Analysis Pie Charts Summary of Actual Revenue & Expenditure Trends Graphs of Actual Revenue Trends Graphs of Actual Expenditure Trends U. T. Austin Revenue & Expenditure Analysis Pie Charts Summary of Actual Revenue & Expenditure Trends Graphs of Actual Revenue Trends Graphs of Actual Expenditure Trends U. T. Brownsville Revenue & Expenditure Analysis Pie Charts Summary of Actual Revenue & Expenditure Trends Graphs of Actual Revenue Trends Graphs of Actual Expenditure Trends

3 U. T. Dallas Revenue & Expenditure Analysis Pie Charts Summary of Actual Revenue & Expenditure Trends Graphs of Actual Revenue Trends Graphs of Actual Expenditure Trends U. T. El Paso Revenue & Expenditure Analysis Pie Charts Summary of Actual Revenue & Expenditure Trends Graphs of Actual Revenue Trends Graphs of Actual Expenditure Trends U. T. Pan American Revenue & Expenditure Analysis Pie Charts Summary of Actual Revenue & Expenditure Trends Graphs of Actual Revenue Trends Graphs of Actual Expenditure Trends U. T. Permian Basin Revenue & Expenditure Analysis Pie Charts Summary of Actual Revenue & Expenditure Trends Graphs of Actual Revenue Trends Graphs of Actual Expenditure Trends U. T. San Antonio Revenue & Expenditure Analysis Pie Charts Summary of Actual Revenue & Expenditure Trends Graphs of Actual Revenue Trends Graphs of Actual Expenditure Trends U. T. Tyler Revenue & Expenditure Analysis Pie Charts Summary of Actual Revenue & Expenditure Trends Graphs of Actual Revenue Trends Graphs of Actual Expenditure Trends U. T. Southwestern Medical Center Dallas Revenue & Expenditure Analysis Pie Charts Summary of Actual Revenue & Expenditure Trends Graphs of Actual Revenue Trends Graphs of Actual Expenditure Trends U. T. Medical Branch Galveston Revenue & Expenditure Analysis Pie Charts Summary of Actual Revenue & Expenditure Trends Graphs of Actual Revenue Trends Graphs of Actual Expenditure Trends

4 U. T. Health Science Center Houston Revenue & Expenditure Analysis Pie Charts Summary of Actual Revenue & Expenditure Trends Graphs of Actual Revenue Trends Graphs of Actual Expenditure Trends U. T. Health Science Center San Antonio Revenue & Expenditure Analysis Pie Charts Summary of Actual Revenue & Expenditure Trends Graphs of Actual Revenue Trends Graphs of Actual Expenditure Trends U. T. M. D. Anderson Cancer Center Revenue & Expenditure Analysis Pie Charts Summary of Actual Revenue & Expenditure Trends Graphs of Actual Revenue Trends Graphs of Actual Expenditure Trends U. T. Health Science Center Tyler Revenue & Expenditure Analysis Pie Charts Summary of Actual Revenue & Expenditure Trends Graphs of Actual Revenue Trends Graphs of Actual Expenditure Trends

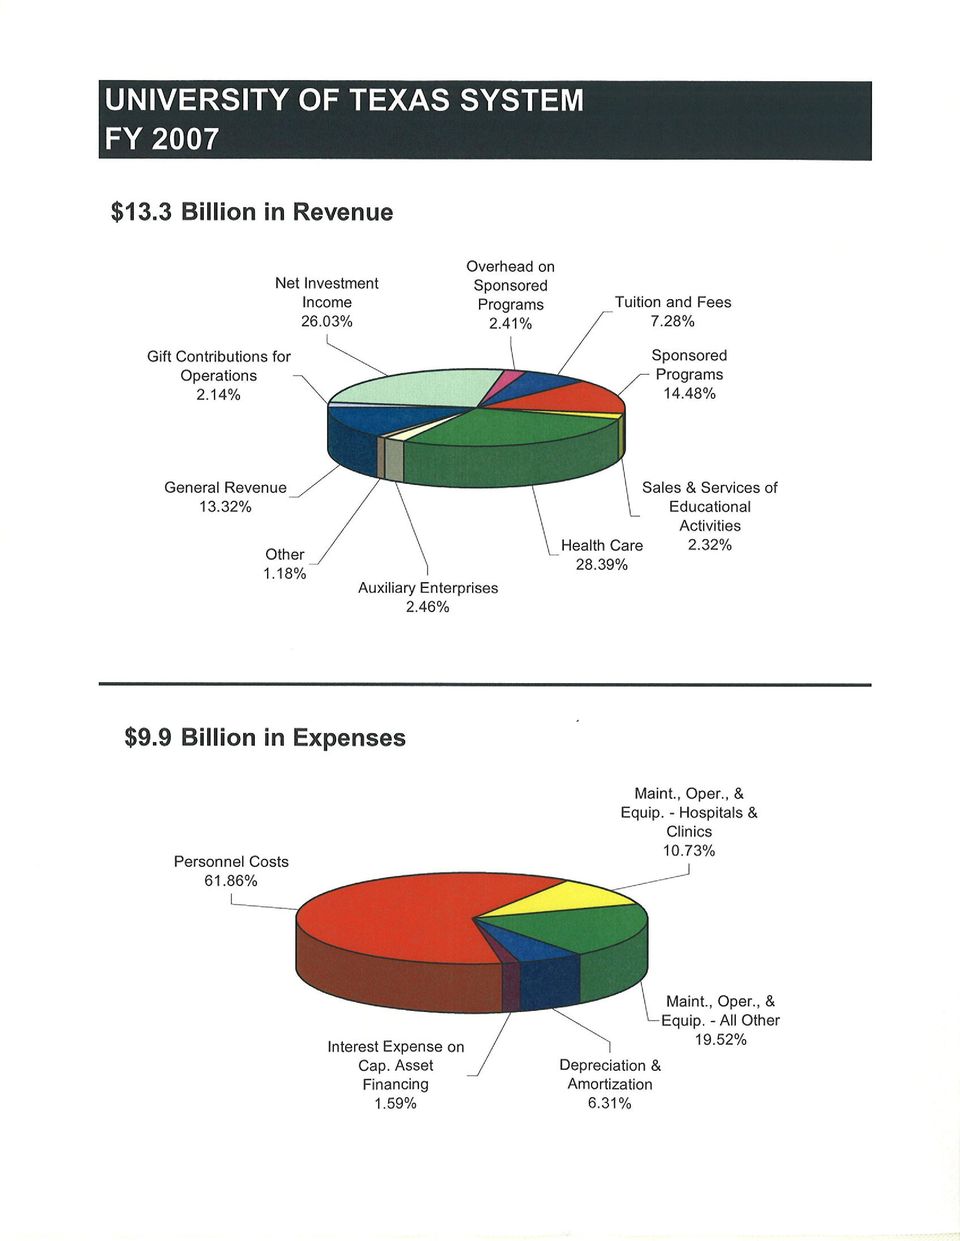
5 The University of Texas System Revenue and Expenditure/Expense Analysis Fiscal Years During the year ended August 31, 2002, the University of Texas System (the System) adopted Governmental Accounting Standards Board (GASB) Statement No. 35, Basic Financial Statements Management s Discussion and Analysis for Public Colleges and Universities, as amended by GASB Statements No. 37, Basic Financial Statements and Management s Discussion and Analysis for State and Local Governments: Omnibus, and GASB Statement No. 38, Certain Financial Statement Note Disclosures. These statements establish standards for external financial reporting for public colleges and universities and require that financial statements be presented on a consolidated basis to focus on the entity as a whole. Previously, financial statements focused on the accountability of individual fund groups rather than on the entity as a whole. Because of the change in the financial reporting model, certain differences exist between the amounts reported as revenue and expenditures in FY 1999 through FY 2001 and the revenue and expense totals for FY 2002 through FY The Revenue and Expenditure Analyses prepared in years prior to FY 2002 were prepared under the old method of financial reporting and differ from the categorization of revenues and expenses on the FY 2002 and future Statements of Revenues, Expenses and Changes in Net Assets (SRECNA). On the tenyear comparative graphs presented in this analysis, similar items from both models (e.g. general revenue, tuition and fees) have been plotted on the same charts; however, in most cases, variations exist between years before and after the change. A detailed discussion of each component of revenues and expenditures/expenses follows: Revenues: TUITION AND FEES All student tuition and fee revenues earned at the U. T. institution for educational purposes. Beginning with FY 2002, an adjustment to discount tuition and related scholarship/fellowship activities in accordance with GASB rules has been recorded. Tuition and fee income paid from institutional scholarship funds is not discounted in the prior years. SPONSORED PROGRAMS Funding received from local, state and federal governments or private agencies, organizations or individuals. Includes amounts received for services performed on grants, contracts, and agreements from these entities for current operations. In years prior to FY 2002, this primarily included sponsored research and services paid from Restricted funds. Contract and grant income such as that related to the Texas Southmost College/U. T. Brownsville agreement or TEXAS Grants were not included because they were recorded in other fund groups (i.e. E&G, Designated). Beginning with FY 2002, sponsored programs includes all related revenues without regard to fund group. Although Overhead on Sponsored Projects (Indirect Cost Recoveries) is reported as in the SRECNA for 2002 through 2008, it has been separately reported for purposes of this analysis in all years. NET SALES AND SERVICES OF EDUCATIONAL ACTIVITIES Revenues that are related to the conduct of instruction, research, and public service and revenues from activities that exist to provide an instructional and laboratory experience for students that create goods and services that may be sold. This category was not reported prior to FY HEALTH CARE Revenues (net of discounts, allowances, and bad debt expense) generated from U.T. health institutions daily patient care, special or other services, as well as revenues from health clinics that are part of a hospital. Also includes revenues (net of discounts, allowances, and bad debt expense) derived from the fees charged by the professional staffs at U.T. health institutions as part of the Medical Practice Plans. Examples of such fees include doctor s fees for clinic visits, medical and dental procedures, professional opinions, and anatomical procedures, such as analysis of specimens

6 after a surgical procedure, etc. In all years, correctional care related activities at U. T. Medical Branch at Galveston have been included in this category. Except for the potential for income from certain contracts within the practice plans to be reflected as, significant differences do not appear to exist in the methodology for this line item. AUXILIARY ENTERPRISES Revenues derived from a service to students, faculty, or staff in which a fee is charged that is directly related to, although not necessarily equal to the cost of the service (e.g., bookstores, dormitories, dining halls, snack bars, intercollegiate athletic programs, etc.). Differences for years before and after FY 2002 may exist due to adjustments made for scholarship/fellowship activities in a manner similar to the discounting of tuition and in accordance with GASB rules. OTHER For FY 2002 and future years, this includes Operating Revenue and Nonoperating Revenues reported on the SRECNA. Operating Revenues are generated from sales or services provided to meet current fiscal year operating expenses, which are not included in one of the preceding categories. Nonoperating Revenues are those not directly associated with the primary missions of System institutions and not included in another category. In prior years, included a variety of revenue and nonrevenue items such as the Texas Southmost College/U. T. Brownsville agreement and Available University Fund Support for U. T. Austin and U. T. System Administration. GENERAL REVENUE Appropriations from the State Fund, which supplement the U. T. institutional revenue in meeting operating expenses, such as faculty salaries, utilities, and institutional support. Also includes Higher Education Assistance Funds (HEAF), which is a source of state appropriated general revenue to U. T. Brownsville and U. T. Pan American. HEAF is appropriated for construction, library and equipment expenses for Texas public universities that do not benefit from the Permanent University Fund (PUF) bond proceeds. Differences exist for years before and after FY 2002 due to the inclusion of Statepaid staff benefits on the 2002 and future SRECNAs and exclusion of those benefits from prior year totals. GIFT CONTRIBUTIONS FOR OPERATIONS Consist of public and private gifts used in current operations, excluding gifts for capital acquisition and endowment gifts. In years prior to 2002, this category was based on the Gifts and Grants and included endowment income that supported restricted activities such as scholarships, fellowships and endowed chairs/professorships. NET INVESTMENT INCOME Interest and dividend income, Long Term Fund and Permanent Health Fund distributions paid from current year income and patent and royalty income. Unrealized gains or losses on investment assets of the System are also included. No comparable figures exist for years prior to FY DESIGNATED ACTIVITIES This category is not comparable between FY 2002 and prior years. In years prior it included all income recorded in Designated Funds that was not related to tuition and fees, correctional care or practice plan activities. In FY 2002 and future years, this revenue has been included in the appropriate SRECNA categories (primarily Sales and Services of Educational Activities, and ). Expenditures/Expenses: PERSONNEL COSTS Costs of salaries, wages and associated fringe benefits for faculty and staff. This category differs for years before FY 2002 due to the exclusion of Statepaid staff benefits in those prior years. MAINTENANCE, OPERATIONS, EQUIPMENT HOSPITALS AND CLINICS Nonpersonnel expenditures of U. T. healthrelated institutions with teaching hospital affiliations for costs associated with providing patient care and operating the entity (i.e., labs, pharmacies, etc.)
.")
7 MAINTENANCE, OPERATIONS, EQUIPMENT ALL OTHER Nonpersonnel expenditures by U. T. institutions for departmental operations, maintenance of facilities, utilities, etc. and not related to hospital and clinic activities. DEPRECIATION AND AMORTIZATION Systematic allocation of longlived assets such as buildings, infrastructure and equipment to current period operations. Depreciation was not included in the System s financial statements prior to FY INTEREST EXPENSE ON CAPITAL ASSET FINANCING Interest expense associated with bond and note borrowings utilized to finance capital improvement projects. With the exception of Constitutional Appropriation Bonds at U. T. Pan American and debt associated with the Suida Manning Art Collection at U. T. Austin, U. T. System Administration reports all interest expense as the debt legally belongs to the Board of Regents. In prior years, this total, along with associated principal repayments, was reported as part of Capital Projects and Debt Service. CAPITAL PROJECTS AND DEBT SERVICE This category is no longer used beginning with FY In prior years, this category included capital outlay paid from operating funds and principal and interest payments on debt. Notes: The Revenues and Expenses totals presented for the System agree to those in the System s consolidated Annual Financial Report. Also included in this report are combined totals for the health institutions, the academic institutions and the U. T. System Administration. To prevent the double counting of the same funds as revenue and expenses, eliminations are made during the Systemwide consolidation process. Because these eliminations have not been reflected in the totals of the health institutions, academic institutions and the U. T. System Administration presented in this report, it is not possible to add these three summaries together to arrive at the amounts presented for the System. Due to the implementation of GASB Statement 45, Accounting and Financial Reporting by Employers for Postemployment Benefits than Pensions (OPEB) in 2008, the System reported $422.7 million for the net OPEB obligation liability. GASB 45 requires accrualbased measurement and recognition of OPEB expenses, such as retiree medical and dental costs, over the employees years of service, along with the related liability. Pursuant to GASB 45, the System has accrued the liability and is recognizing it over a 30year period so that the increase in the liabilities does not occur all in one year. The System is not required to fund the OPEB liability; instead, the difference between the OPEB cost and the System s contributions to the plan will increase the unfunded actuarial accrued liability. As a result, the expense category of Maintenance, Operation, and Equipment All shows a significant increase between 2007 and 2008 for both the combined System and for the U. T. System Administration, where the liability and expense are recorded.

8 UNIVERSITY OF TEXAS SYSTEM FY 2008 $10.3 Billion in Revenue 40% 38.92% 35% 30% 25% 20% 20.16% 19.21% 15% 10% 9.97% 5% 2.86% 3.33% 0.94% 3.59% 2.26% 3.29% 0% 5% $11.2 Billion in Expenses Equip. Hospitals & Clinics 10.03% 59.46% Interest Expense on Cap. Asset Financing 1.45% Depreciation & Amortization 6.08% Equip. All 22.98%

9
10 UNIVERSITY OF TEXAS SYSTEM FY 2006 $11.3 Billion in Revenue Net Investment Income Net 20.34% Gift Contributions for Investment Income Gift 2.25% Contributions for 20.34% 2.25% Overhead on Sponsored Programs Overhead on Tuition and Fees 2.46% Sponsored 7.54% Programs Designated Tuition Activities and Fees 2.46% 0.00% 7.54% Sponsored Programs 16.40% 16.40% 15.42% 15.42% 2.65% 0.99% 0.99% 2.65% Health Care 29.73% Health Care 29.73% Sales & Services of Educational Activities Sales 2.23% & Services of Educational Activities 2.23% $9.4 Billion in Expenses 61.67% 61.67% Interest Expense on Cap. Asset Financing 1.81% Equip. Hospitals & Clinics Equip. Hospitals 10.97% & Clinics 10.97% Equip. All 19.61% Depreciation & Capital Interest Projects Expense & on Amortization Debt Cap. Service Asset Equip. All 5.93% 0.00% Financing 19.61% Depreciation 1.81% & Amortization 5.93%

11 UNIVERSITY OF TEXAS SYSTEM FY 2005 $11.6 Billion in Revenue Net Investment Income 28.17% Net Investment Income 28.17% Gift Contributions for Gift Contributions for 2.30% 2.30% 13.52% 13.52% 2.48% 0.97% 0.97% 2.48% Overhead on Sponsored Programs Overhead on Tuition and Fees 2.56% Sponsored 6.80% Programs Designated Tuition Activities and Fees 2.56% 0.00% Sponsored 6.80% Programs 14.50% 14.50% Health Care 26.57% Health Care 26.57% Sales & Services of Educational Activities 2.14% Sales & Services of Educational Activities 2.14% $8.6 Billion in Expenses 62.06% Equip. Hospitals & Equip. Hospitals & Clinics Clinics 10.81% 10.81% Equip. All 20.03% 62.06% Interest Expense on Cap. Asset Financing 1.56% Depreciation Equip. & All Capital Interest Projects Expense & on Amortization20.03% Debt Cap. Service Asset 5.53% Depreciation 0.00% Financing & Amortization 1.56% 5.53%

12 UNIVERSITY OF TEXAS SYSTEM FY 2004 $9.4 Billion in Revenue Net Investment Income 19.03% Net Investment Gift Contributions for Income Gift Contributions for 19.03% 1.94% 1.94% 16.88% 16.88% Auxiliary Enterprises 1.96% 1.96% 2.61% 2.61% Overhead on Sponsored Overhead on Tuition and Fees Programs Sponsored 7.19% 2.96% Programs Designated Tuition Activities and Fees 2.96% 0.00% 7.19% Sponsored Programs 17.45% 17.45% Health Care 27.59% Health Care 27.59% Sales & Services of Educational Activities Sales 2.39% & Services of Educational Activities 2.39% $7.8 Billion in Expenses 63.23% Equip. Hospitals & Equip. Hospitals & Clinics Clinics 10.12% 10.12% 63.23% Interest Expense on Cap. Asset Financing 1.17% Equip. All 20.67% Interest Depreciation Expense on & Capital Projects Equip. & All Cap. Amortization Debt Service Asset 20.67% Financing 4.81% Depreciation 0.00% & Amortization 1.17% 4.81%

13 UNIVERSITY OF TEXAS SYSTEM FY 2003 $8.7 Billion in Revenue Net Investment Income 18.40% Gift Contributions for Net Investment Income Gift 2.23% Contributions for 19.03% 1.94% 18.34% 16.88% 1.96% 2.61% 2.17% 2.80% Overhead on Sponsored Overhead on Tuition and Fees Programs Sponsored 6.83% 2.98% Programs Designated Tuition Activities and Fees 2.96% 0.00% 7.19% Sponsored Programs 17.50% 17.45% Health Care 27.59% Health Care 26.77% Sales & Services of Educational Activities Sales 2.39% & Services of Educational Activities 1.98% $7.3 Billion in Expenses 63.86% Maint., Oper., Maint., & Oper., & Equip. Hospitals Equip. Hospitals & & Clinics Clinics 10.12% 10.05% 63.23% Interest Expense on Cap. Asset Financing 1.22% Equip. All 20.67% Interest Depreciation Expense on & Capital Projects Equip. & All Cap. Amortization Debt Service Asset 20.33% Financing 4.81% Depreciation 0.00% & Amortization 1.17% 4.54%

14 UNIVERSITY OF TEXAS SYSTEM FY 2002 $6.2 Billion in Revenue 40% 35% 34.02% 30% 25% 22.68% 26.12% 20% 15% 10% 8.48% 5% 2.83% 3.50% 3.69% 3.17% 3.76% 0% 8.26% 5% 10% Tuition and Fees Sponsored Programs Sales & Services of Educational Activities Health Care Auxiliary Enterprises General Revenue Gift Contributions for Net Investment Income Overhead on Sponsored Programs $6.9 Billion in Expenses 63.23% 62.53% Equip. Hospitals Maint., & Oper., & ClinicsEquip. Hospitals & 10.06% Clinics 10.12% Equip. All 21.81% Interest Expense on Cap. Asset Financing 1.17% Interest Depreciation Expense & on Amortization Cap. Asset Financing 4.81% 1.31% Maint., Depreciation Oper., & Equip. Amortization All 20.67% 4.29%

15 UNIVERSITY OF TEXAS SYSTEM FY 2001 $6.4 Billion in Revenue Overhead on Gift Contributions for Sponsored Programs 4.76% 2.64% Gift Contributions 21.34% for 4.76% Overhead on Sponsored Programs Designated 2.64% Activities 9.01% Designated Activities Tuition 9.01% and Fees 8.35% Sponsored Programs Tuition and Fees 15.87% 8.35% Sponsored Programs 15.87% 21.34% 2.94% 2.94% 4.08% 4.08% Health CareHealth Care 31.01% 31.01% $6.0 Billion in Expenditures 60.39% 60.39% Equip. Hospitals & Clinics 13.10% Equip. Hospitals & Clinics Maint., 13.10% Oper., & Equip. All 21.14% Capital Projects & Debt Service 5.38% Capital Projects & Debt Service 5.38% Equip. All 21.14%

16 UNIVERSITY OF TEXAS SYSTEM FY 2000 $6.0 Billion in Revenue Overhead on Sponsored Gift Contributions Programs for 2.57% 3.01% Gift Contributions for General 3.01% Revenue 22.76% 22.76% Overhead on Sponsored Designated Activities Programs 8.94% Designated 2.57% Activities Tuition and Fees 8.94% 7.92% Tuition and Fees 7.92% Sponsored Programs Sponsored 16.08% Programs 16.08% 3.72% 3.72% Auxiliary Enterprises 5.03% 5.03% Health Health Care Care 29.97% 29.97% $5.5 Billion in Expenditures 61.48% 61.48% Equip. Hospitals & Clinics 12.98% Equip. Maint., Oper., Hospitals & & Equip. Clinics All 20.25% 12.98% Capital Projects & Debt Service 5.29% Equip. All 20.25% Capital Projects & Debt Service 5.29%

17 UNIVERSITY OF TEXAS SYSTEM FY 1999 $5.3 Billion in Revenue Overhead on on Sponsored Programs Designated Designated Activities Activities 2.62% 2.62% 7.27% 7.27% Gift Contributions for Gift Contributions for 3.22% 3.22% General 23.80% Revenue 23.80% Tuition Tuition and and Fees Fees 8.37% 8.37% Sponsored Programs 16.51% 2.70% 2.70% Auxiliary 4.92% 4.92% Health Care 30.60% Health Care 30.60% $5.1 Billion in Expenditures Personnel 61.67% Costs 61.67% Equip. Hospitals & Clinics 11.68% Equip. Hospitals & Clinics 11.68% Capital Projects & Debt Service 6.06% Maint., Oper., Equip. & All Capital Projects & Equip. All 20.59% Debt Service 20.59% 6.06%

18 UNIVERSITY OF TEXAS SYSTEM SUMMARY OF ACTUAL REVENUE AND EXPENDITURE/EXPENSE TRENDS FISCAL YEAR 1999 THROUGH 2008 REVENUES FY 99 FY 00 FY 01 FY 02 FY 03 FY 04 FY 05 FY 06 FY 07 FY 08 Tuition and Fees $ 441,593, ,672, ,740, ,797, ,010, ,107, ,460, ,460, ,296,162 1,024,009, ,580, ,409,686 1,022,138,050 1,409,187,200 1,519,564,418 1,638,600,150 1,677,960,211 1,858,257,010 1,926,180,085 2,071,205,233 Sales & Services of Educational Activities 175,801, ,897, ,277, ,278, ,493, ,473, ,708,853 Health Care 1,613,737,086 1,792,133,846 1,997,547,594 2,113,497,392 2,325,104,781 2,590,472,141 3,074,917,686 3,368,160,973 3,775,970,733 3,999,306, ,549, ,096, ,504, ,379, ,586, ,642, ,052, ,920, ,421, ,064, ,236, ,166, ,089, ,177, ,389, ,728, ,483, ,987, ,620,745 96,638,179 1,255,065,982 1,361,166,793 1,374,458,227 1,622,530,012 1,592,777,843 1,585,193,463 1,564,669,950 1,747,137,850 1,772,102,752 1,973,719,229 Gift Contributions for 170,046, ,782, ,680, ,089, ,936, ,915, ,764, ,782, ,498, ,785,870 Net Investment Income (513,212,808) 1,598,249,292 1,786,973,201 3,260,531,186 2,305,134,824 3,462,461,171 (232,273,247) Overhead on 138,256, ,827, ,104, ,800, ,547, ,200, ,833, ,489, ,378, ,561,534 Designated Activities 383,310, ,910, ,442,110 $ 5,274,376,063 5,980,166,669 6,440,706,621 6,212,048,808 8,685,063,256 9,389,110,156 11,573,952,075 11,330,825,256 13,302,403,725 10,274,724,911 EXPENDITURES/EXPENSES FY 99 FY 00 FY 01 FY 02 FY 03 FY 04 FY 05 FY 06 FY 07 FY 08 $ 3,135,885,591 3,394,633,812 3,645,104,581 4,336,459,736 4,692,814,569 4,901,407,292 5,359,523,174 5,797,291,777 6,147,293,245 6,646,066,422 Equip. Hospitals & Clinics 593,884, ,577, ,461, ,704, ,483, ,324, ,997,881 1,031,224,354 1,066,205,200 1,121,061,333 Equip. All 1,047,018,786 1,118,064,306 1,276,042,852 1,512,448,306 1,494,277,610 1,602,705,900 1,729,834,476 1,843,017,932 1,939,477,679 2,568,741,421 Depreciation & Amortization 297,507, ,414, ,830, ,825, ,751, ,913, ,831,346 Interest Expense on Cap. Asset Financing 90,644,496 89,697,527 90,945, ,004, ,567, ,987, ,687,052 Capital Projects & Debt Service 308,118, ,879, ,460,962 $ 5,084,907, ,521,155, ,036,069, ,934,764, ,348,688, ,752,212, ,636,185,403 9,399,853, ,937,876, ,177,387, % CHANGE IN REVENUES FY 99 FY 00 FY 01 FY 02 FY 03 FY 04 FY 05 FY 06 FY 07 FY 08 Tuition and Fees 7.10% 7.26% 13.53% 2.03% 12.57% 13.84% 16.49% 8.65% 13.32% 5.75% 8.27% 10.43% 6.32% 37.87% 7.83% 7.83% 2.40% 10.74% 3.66% 7.53% Sales & Services of Educational Activities N/A N/A N/A N/A 2.22% 30.47% 10.26% 2.11% 22.17% 4.79% Health Care 7.23% 11.05% 11.46% 5.80% 10.01% 11.41% 18.70% 9.54% 12.11% 5.91% 12.21% 16.01% 12.82% 17.19% 12.06% 0.43% 17.34% 4.48% 9.17% 4.47% 21.18% 56.20% 14.89% 21.20% 17.80% 2.47% 38.78% 0.44% 39.86% 38.30% 0.96% 8.45% 0.98% 18.05% 1.83% 0.48% 1.29% 11.66% 1.43% 11.38% Gift Contributions for 19.62% 5.73% 70.58% 35.73% 1.60% 6.20% 46.09% 4.13% 11.66% 29.63% Net Investment Income N/A N/A N/A N/A % 11.81% 82.46% 29.30% 50.21% % Overhead on 4.75% 11.26% 10.58% 37.45% 10.58% 7.60% 6.70% 6.18% 15.04% 5.36% Designated Activities 2.22% 39.55% 8.51% N/A N/A N/A N/A N/A N/A N/A 4.95% 13.38% 7.70% 3.55% 39.81% 8.11% 23.27% 2.10% 17.40% 22.76% % CHANGE IN EXPENDITURES/EXPENSES FY 99 FY 00 FY 01 FY 02 FY 03 FY 04 FY 05 FY 06 FY 07 FY % 8.25% 7.38% 18.97% 8.22% 4.44% 9.35% 8.17% 6.04% 8.11% Equip. Hospitals & Clinics 15.91% 20.66% 10.31% 11.73% 5.84% 6.21% 19.08% 10.41% 3.39% 5.14% Equip. All 5.57% 6.79% 14.13% 18.53% 1.20% 7.26% 7.93% 6.54% 5.23% 32.45% Depreciation & Amortization N/A N/A N/A N/A 12.07% 11.82% 28.16% 16.73% 12.40% 8.44% Interest Expense on Cap. Asset Financing N/A N/A N/A N/A 1.04% 1.39% 48.45% 26.34% 7.38% 2.34% Capital Projects & Debt Service 26.40% 5.27% 11.16% N/A N/A N/A N/A N/A N/A N/A 7.33% 8.58% 9.33% 14.89% 5.97% 5.49% 11.40% 8.84% 5.72% 12.47%

19 UNIVERSITY OF TEXAS SYSTEM SUMMARY OF ACTUAL REVENUE TRENDS FISCAL YEAR 1999 THROUGH ,200 Tuition and Fees 2,500 1, ,024 2,000 1,500 1, ,022 1,409 1,520 1,639 1,678 1,858 1,926 2, Sales & Services of Educational Activities 4,000 Health Care 3,776 3, ,500 3,000 2,500 2,000 1,500 1,614 1,792 1,998 2,113 2,325 2,590 3,075 3, ,

20 UNIVERSITY OF TEXAS SYSTEM SUMMARY OF ACTUAL REVENUE TRENDS FISCAL YEAR 1999 THROUGH ,000 1,800 1,600 1,255 1,400 1,361 1,374 1,623 1,593 1,585 1,565 1,747 1,772 1, Gift Contributions for ,200 1, ,500 Net Investment Income 3,261 3,462 Overhead on ,000 2,500 2,000 1,598 1,787 2, ,500 1, (500) (513) (232) 50 (1,000) 600 Designated Activities
 (513) (232) 50 (1,000) 600 Designated Activities 535 580 500 400 383 300 200 100 99")
21 UNIVERSITY OF TEXAS SYSTEM SUMMARY OF ACTUAL EXPENDITURE/EXPENSE TRENDS FISCAL YEAR 1999 THROUGH ,000 6,000 5,360 5,797 6,147 6,646 1,200 1,000 Equip. Hospitals & Clinics 1, ,066 1,121 5,000 4,000 3,136 3,395 3,645 4,336 4,693 4, ,000 2, , ,000 Equip. All 700 Depreciation & Amortization ,500 2, ,000 1,500 1,047 1,118 1,276 1,512 1,494 1,603 1,730 1,843 1, , Interest Expense on Cap. Asset Financing Capital Projects & Debt Service
22 UNIVERSITY OF TEXAS ACADEMIC INSTITUTIONS FY 2008 $3.5 Billion in Revenue 26.55% Gift Contributions for 4.15% Net Investment Income 0.11% Overhead on Sponsored Programs 2.99% Tuition and Fees 27.19% 0.70% Auxiliary Enterprises 7.53% Sales & Services of Educational Activities 5.57% Sponsored Programs 25.20% $3.6 Billion in Expenses Equip. All 31.27% 61.55% Interest Expense on Cap. Asset Financing 0.00% Depreciation & Amortization 7.18%
23
24 UNIVERSITY OF TEXAS ACADEMIC INSTITUTIONS FY 2006 $3.3 Billion in Revenue Gift Contributions for 3.40% Net Investment Income 11.15% Overhead on Sponsored Programs 2.81% Tuition and Fees 23.60% 24.07% 0.74% 6.70% Sales & Services of Educational Activities 4.89% Sponsored Programs 22.65% $3.1 Billion in Expenses 62.28% Equip. All 31.09% Interest Expense on Cap. Asset Financing 0.05% Depreciation & Amortization 6.57%
25 UNIVERSITY OF TEXAS ACADEMIC INSTITUTIONS FY 2005 $3.2 Billion in Revenue Gift Contributions for 3.09% 22.90% Net Investment Income 14.56% Overhead on Sponsored Programs 2.77% Tuition and Fees 22.60% 0.67% 6.79% Sales & Services of Educational Activities 4.86% Sponsored Programs 21.75% $2.9 Billion in Expenses 62.23% Equip. All 31.17% Interest Expense on Cap. Asset Financing 0.07% Depreciation & Amortization 6.54%
26 UNIVERSITY OF TEXAS ACADEMIC INSTITUTIONS FY 2004 $2.8 Billion in Revenue Gift Contributions for 2.78% 25.74% Net Investment Income 10.95% Overhead on Sponsored Programs 2.89% Tuition and Fees 22.07% 0.84% 6.77% Sales & Services of Educational Activities 4.70% Sponsored Programs 23.27% $2.6 Billion in Expenses 63.47% Equip. All 30.92% Depreciation & Amortization 5.53% Interest Expense on Cap. Asset Financing 0.08%
27 UNIVERSITY OF TEXAS ACADEMIC INSTITUTIONS FY 2003 $2.6 Billion in Revenue Gift Contributions for 3.66% 28.42% Net Investment Income 7.07% Overhead on Sponsored Programs 3.07% Tuition and Fees 21.38% 0.64% 7.51% Sales & Services of Educational Activities 4.64% Sponsored Programs 23.62% $2.5 Billion in Expenses 64.63% Equip. All 30.02% Depreciation & Amortization 5.26% Interest Expense on Cap. Asset Financing 0.09%
28 UNIVERSITY OF TEXAS ACADEMIC INSTITUTIONS FY 2002 $2.1 Billion in Revenue 40% 35% 34.30% 30% 25% 22.71% 26.54% 20% 15% 10% 5% 4.67% 7.80% 2.58% 4.54% 3.35% 0% 5% 10% Tuition and Fees Sponsored Programs Sales & Services of Educational Activities Auxiliary Enterprises General Revenue Gift Contributions for 6.49% Net Investment Income Overhead on Sponsored Programs $2.4 Billion in Expenses 63.30% Equip. All 31.46% Interest Expense on Cap. Asset Financing 0.03% Depreciation & Amortization 5.21%
29 UNIVERSITY OF TEXAS ACADEMIC INSTITUTIONS FY 2001 $2.3 Billion in Revenue Gift Contributions for 9.47% Overhead on Sponsored Programs 2.13% Designated Activities 7.09% Tuition and Fees 21.89% 27.37% 6.54% 7.26% Sponsored Programs 18.26% $2.1 Billion in Expenditures 60.75% Equip. All 30.94% Capital Projects & Debt Service 8.30%
30 UNIVERSITY OF TEXAS ACADEMIC INSTITUTIONS FY 2000 $2.0 Billion in Revenue Gift Contributions for 5.13% Overhead on Sponsored Programs 2.17% Designated Activities 7.01% Tuition and Fees 21.57% 30.53% 7.18% 7.82% Sponsored Programs 18.59% $1.9 Billion in Expenditures 61.49% Equip. All 30.10% Capital Projects & Debt Service 8.41%
31 UNIVERSITY OF TEXAS ACADEMIC INSTITUTIONS FY 1999 $1.8 Billion in Revenue 30.26% Gift Contributions for 5.61% Overhead on Sponsored Programs 2.30% Designated Activities 6.77% Tuition and Fees 22.51% 5.99% 7.59% Sponsored Programs 18.97% $1.7 Billion in Expenditures 62.13% Equip. All 29.80% Capital Projects & Debt Service 8.07%
32 UNIVERSITY OF TEXAS ACADEMIC INSTITUTIONS SUMMARY OF ACTUAL REVENUE AND EXPENDITURE/EXPENSE TRENDS FISCAL YEAR 1999 THROUGH 2008 REVENUES FY 99 FY 00 FY 01 FY 02 FY 03 FY 04 FY 05 FY 06 FY 07 FY 08 Tuition and Fees $ 405,343, ,395, ,117, ,298, ,222, ,306, ,490, ,730, ,131, ,155, ,712, ,946, ,370, ,320, ,493, ,283, ,322, ,128, ,097, ,339,701 Sales & Services of Educational Activities 99,871, ,456, ,299, ,073, ,179, ,908, ,771, ,696, ,577, ,096, ,613, ,851, ,118, ,110, ,553, ,218, ,724, ,819, ,546, ,777,560 55,198,829 16,442,304 23,855,106 21,426,262 24,822,785 30,144,973 24,100, ,015, ,071, ,662, ,024, ,164, ,370, ,106, ,420, ,512, ,202,237 Gift Contributions for 101,063, ,087, ,512,931 97,107,088 93,560,900 78,813,963 99,243, ,628, ,066, ,780,666 Net Investment Income (138,770,322) 180,773, ,854, ,368, ,132, ,228,516 3,868,078 Overhead on 41,498,122 44,078,618 48,540,207 71,622,359 78,444,368 82,045,844 89,083,527 93,792,503 97,210, ,569,172 Designated Activities 121,878, ,118, ,279,266 $ 1,801,027,302 2,027,821,651 2,275,357,080 2,137,286,239 2,555,409,749 2,837,948,719 3,210,225,525 3,338,389,115 3,847,518,924 3,461,510,779 EXPENDITURES/EXPENSES FY 99 FY 00 FY 01 FY 02 FY 03 FY 04 FY 05 FY 06 FY 07 FY 08 $ 1,081,930,967 1,173,935,769 1,280,416,790 1,498,358,845 1,633,210,879 1,645,208,917 1,782,784,568 1,941,289,134 2,083,667,844 2,210,849,870 Equip. All 518,886, ,739, ,139, ,686, ,658, ,457, ,934, ,087,165 1,022,104,546 1,123,198,176 Depreciation & Amortization 123,210, ,978, ,446, ,286, ,914, ,686, ,923,931 Interest Expense on Cap. Asset Financing 726,288 2,169,654 1,973,607 2,027,193 1,548,832 1,517,935 Capital Projects & Debt Service 140,573, ,590, ,979,748 $ 1,741,390,372 1,909,266,130 2,107,535,652 2,366,982,067 2,527,017,285 2,592,086,490 2,865,032,947 3,116,839,253 3,351,976,814 3,591,971,977 % CHANGE IN REVENUES FY 99 FY 00 FY 01 FY 02 FY 03 FY 04 FY 05 FY 06 FY 07 FY 08 Tuition and Fees 7.30% 7.91% 13.88% 2.57% 12.55% 14.66% 15.84% 8.58% 13.38% 5.38% 1.46% 10.31% 10.19% 36.58% 6.38% 9.41% 5.76% 8.28% 5.82% 9.03% Sales & Services of Educational Activities N/A N/A N/A N/A 18.61% 12.53% 17.08% 4.55% 17.61% 0.45% 2.03% 16.01% 4.11% 0.92% 15.15% 0.14% 13.53% 2.50% 10.59% 5.46% 16.71% 34.99% 2.22% 62.90% 70.21% 45.08% 10.18% 15.85% 21.44% 20.05% 1.18% 13.59% 0.58% 17.72% 0.94% 0.58% 0.65% 9.29% 0.51% 13.83% Gift Contributions for 37.80% 2.99% % 54.94% 3.65% 15.76% 25.92% 14.49% 9.19% 15.89% Net Investment Income N/A N/A N/A N/A % 71.96% 50.35% 20.38% 76.34% 99.41% Overhead on 0.24% 6.22% 10.12% 47.55% 9.52% 4.59% 8.58% 5.29% 3.64% 6.54% Designated Activities 7.12% 16.61% 13.48% N/A N/A N/A N/A N/A N/A N/A 1.84% 12.59% 12.21% 6.07% 19.56% 11.06% 13.12% 3.99% 15.25% 10.03% % CHANGE IN EXPENDITURES/EXPENSES FY 99 FY 00 FY 01 FY 02 FY 03 FY 04 FY 05 FY 06 FY 07 FY % 8.50% 9.07% 17.02% 9.00% 0.73% 8.36% 8.89% 7.33% 6.10% Equip. All 2.08% 10.76% 13.47% 14.19% 1.88% 5.64% 11.41% 8.53% 5.47% 9.89% Depreciation & Amortization N/A N/A N/A N/A 7.93% 7.87% 30.56% 9.41% 19.41% 5.41% Interest Expense on Cap. Asset Financing N/A N/A N/A N/A % 9.04% 2.72% 23.60% 1.99% % Capital Projects & Debt Service 18.41% 14.24% 8.96% N/A N/A N/A N/A N/A N/A N/A 5.11% 9.64% 10.38% 12.31% 6.76% 2.57% 10.53% 8.79% 7.54% 7.16%
33 UNIVERSITY OF TEXAS SYSTEM SUMMARY OF ACTUAL REVENUE TRENDS FISCAL YEAR 1999 THROUGH ,200 Tuition and Fees 2,500 1, ,024 2,000 1,500 1, ,022 1,409 1,520 1,639 1,678 1,858 1,926 2, Sales & Services of Educational Activities 4,000 Health Care 3,776 3, ,500 3,000 2,500 2,000 1,500 1,614 1,792 1,998 2,113 2,325 2,590 3,075 3, ,
34 UNIVERSITY OF TEXAS SYSTEM SUMMARY OF ACTUAL REVENUE TRENDS FISCAL YEAR 1999 THROUGH ,000 1,800 1,600 1,255 1,400 1,361 1,374 1,623 1,593 1,585 1,565 1,747 1,772 1, Gift Contributions for ,200 1, ,500 Net Investment Income 3,261 3,462 Overhead on ,000 2,500 2,000 1,598 1,787 2, ,500 1, (500) (513) (232) 50 (1,000) 600 Designated Activities
35 UNIVERSITY OF TEXAS SYSTEM SUMMARY OF ACTUAL EXPENDITURE/EXPENSE TRENDS FISCAL YEAR 1999 THROUGH ,000 6,000 5,360 5,797 6,147 6,646 1,200 1,000 Equip. Hospitals & Clinics 1, ,066 1,121 5,000 4,000 3,136 3,395 3,645 4,336 4,693 4, ,000 2, , ,000 Equip. All 700 Depreciation & Amortization ,500 2, ,000 1,500 1,047 1,118 1,276 1,512 1,494 1,603 1,730 1,843 1, , Interest Expense on Cap. Asset Financing Capital Projects & Debt Service
36 UNIVERSITY OF TEXAS HEALTH INSTITUTIONS FY 2008 $7.0 Billion in Revenue 56.91% 60% 50% 40% 30% 20% 17.59% 14.90% 10% 1.18% 1.16% 1.15% 3.19% 0.57% 3.32% 0% 10% $7.0 Billion in Expenses Equip. Hospitals & Clinics 16.61% 62.95% Equip. All 14.50% Interest Expense on Cap. Asset Financing 0.00% Depreciation & Amortization 5.94%
37
38 UNIVERSITY OF TEXAS HEALTH INSTITUTIONS FY 2006 $6.5 Billion in Revenue Tuition and Fees 1.03% Overhead on Sponsored Programs 3.39% Sponsored Programs 17.01% Sales & Services of Educational Activities 1.24% Net Investment Income 5.83% Health Care 52.15% Gift Contributions for 2.17% 14.52% 1.48% 1.18% $6.1 Billion in Expenses Equip. Hospitals & Clinics 17.43% 62.90% Equip. All 13.95% Interest Expense on Cap. Asset Financing 0.00% Depreciation & Amortization 5.71%
39 UNIVERSITY OF TEXAS HEALTH INSTITUTIONS FY 2005 $6.0 Billion in Revenue Tuition and Fees 1.02% Overhead on Sponsored Programs 3.46% Sponsored Programs 16.97% Sales & Services of Educational Activities 1.30% Net Investment Income 6.86% Health Care 51.30% Gift Contributions for 2.76% 13.74% 1.46% 1.15% $5.6 Billion in Expenses Equip. Hospitals & Clinics 17.17% 63.27% Equip. All 14.45% Interest Expense on Cap. Asset Financing 0.00% Depreciation & Amortization 5.10%
40 UNIVERSITY OF TEXAS HEALTH INSTITUTIONS FY 2004 $5.4 Billion in Revenue Tuition and Fees 0.91% Overhead on Sponsored Programs 3.65% Sponsored Programs 18.30% Sales & Services of Educational Activities 1.61% Net Investment Income 5.92% Health Care 48.29% Gift Contributions for 1.90% 15.82% 2.62% 0.98% $5.0 Billion in Expenses Equip. Hospitals & Clinics 15.64% 64.86% Equip. All 14.95% Interest Expense on Cap. Asset Financing 0 00% Depreciation & Amortization 4.54%
41 UNIVERSITY OF TEXAS HEALTH INSTITUTIONS FY 2003 $4.9 Billion in Revenue Tuition and Fees 0.96% Overhead on Sponsored Programs 3.70% Sponsored Programs 19.00% Sales & Services of Educational Activities 0.97% Net Investment Income 4.25% Health Care 47.80% Gift Contributions for 2.04% 17.65% 2.56% 1.06% $4.7 Billion in Expenses Equip. Hospitals & Clinics 15.70% 64.52% Depreciation & Amortization 4.23% Equip. All 15.54%
42 UNIVERSITY OF TEXAS HEALTH INSTITUTIONS FY 2002 $4.3 Billion in Revenue 60% 50% 48.64% 40% 30% 20% 19.50% 20.28% 10% 1.69% 1.17% 3.44% 2.29% 3.73% 0% 1.70% 10% Sponsored Programs Sales & Services of Educational Activities Health Care Auxiliary Enterprises General Revenue Gift Contributions for Net Investment Income Overhead on Sponsored Programs $4.5 Billion in Expenses 63.33% Equip. Hospitals & Clinics 15.67% Depreciation & Amortization 3.88% Equip. All 17.13%
43 UNIVERSITY OF TEXAS HEALTH INSTITUTIONS FY 2001 $4.1 Billion in Revenue Designated Activities 9.70% Tuition and Fees 0.97% Sponsored Programs 14.75% Overhead on Sponsored Programs 2.98% Gift Contributions for 2.16% Health Care 48.92% 18.19% 0.97% 1.37% $3.9 Billion in Expenditures 60.19% Equip. Hospitals & Clinics 20.12% Capital Projects & Debt Service 3.81% Equip. All 15.88%
44 UNIVERSITY OF TEXAS HEALTH INSTITUTIONS FY 2000 $3.8 Billion in Revenue Designated Activities 9.87% Overhead on Sponsored Programs 2.92% Gift Contributions for 2.01% Tuition and Fees 0.96% Sponsored Programs 13.70% 19.63% 2.01% 1.24% Health Care 47.66% $3.6 Billion in Expenditures 61.48% Equip. Hospitals & Clinics 19.84% Capital Projects & Debt Service 3.63% Equip. All 15.04%
45 UNIVERSITY OF TEXAS HEALTH INSTITUTIONS FY 1999 $3.3 Billion in Revenue Designated Activities 7.03% Overhead on Sponsored Programs 2.93% Tuition and Fees 1.10% Sponsored Programs 14.47% Gift Contributions for 2.09% 21.38% 1.01% 1.18% Health Care 48.82% $3.3 Billion in Expenditures 61.43% Equip. Hospitals & Clinics 17.76% Capital Projects & Debt Service 5.01% Equip. All 15.80%
46 UNIVERSITY OF TEXAS HEALTH INSTITUTIONS SUMMARY OF ACTUAL REVENUE AND EXPENDITURE/EXPENSE TRENDS FISCAL YEAR 1999 THROUGH 2008 REVENUES FY 99 FY 00 FY 01 FY 02 FY 03 FY 04 FY 05 FY 06 FY 07 FY 08 Tuition and Fees $ 36,250,061 36,276,733 39,623,255 41,498,881 46,788,010 48,800,518 60,970,444 66,730,190 75,164,612 82,853, ,365, ,129, ,222, ,286, ,367, ,638,682 1,017,086,037 1,098,299,279 1,159,616,988 1,235,763,324 Sales & Services of Educational Activities 73,471,374 47,325,777 86,249,511 77,625,394 79,911,408 88,430,610 83,020,149 Health Care 1,613,737,086 1,792,133,846 1,997,547,594 2,113,497,392 2,325,104,781 2,590,472,141 3,074,917,686 3,368,160,973 3,775,970,733 3,999,306,027 39,066,024 46,595,473 56,113,357 50,766,222 51,735,593 52,523,926 68,942,004 76,367,258 80,203,049 81,339,682 33,501,239 75,750,045 39,512, ,600, ,532, ,621,404 87,324,872 95,600,390 76,649,664 80,622, ,840, ,070, ,528, ,041, ,324, ,765, ,491, ,561, ,774,224 1,047,079,771 Gift Contributions for 68,972,700 75,695,070 88,097,179 99,537,430 99,215, ,959, ,691, ,275, ,356, ,968,849 Net Investment Income (73,923,344) 206,836, ,358, ,008, ,419, ,516,702 (40,341,334) Overhead on 96,757, ,749, ,563, ,178, ,102, ,020, ,123, ,062, ,575, ,287,722 Designated Activities 232,273, ,097, ,906,294 $ 3,305,764,993 3,760,498,394 4,083,114,995 4,344,955,615 4,864,333,568 5,364,410,128 5,994,180,858 6,458,387,892 7,212,259,374 7,026,900,839 EXPENDITURES/EXPENSES FY 99 FY 00 FY 01 FY 02 FY 03 FY 04 FY 05 FY 06 FY 07 FY 08 $ 2,053,954,624 2,220,698,043 2,364,687,791 2,820,656,233 3,034,907,696 3,253,196,291 3,558,582,942 3,836,061,666 4,032,176,722 4,400,292,782 Equip. Hospitals & Clinics 593,884, ,577, ,461, ,703, ,483, ,324, ,779,881 1,063,006,354 1,095,223,167 1,161,384,071 Equip. All 528,132, ,324, ,903, ,772, ,140, ,017, ,870, ,980, ,621,735 1,013,427,297 Depreciation & Amortization 172,709, ,935, ,776, ,067, ,346, ,871, ,586,048 Interest Expense on Cap. Asset Financing 72,922 42,680 Capital Projects & Debt Service 167,545, ,289, ,481,214 $ 3,343,517, ,611,889,745 3,928,534, ,453,842, ,703,468, ,015,387,465 5,624,343, ,098,394, ,409,893,199 6,990,690, % CHANGE IN REVENUES FY 99 FY 00 FY 01 FY 02 FY 03 FY 04 FY 05 FY 06 FY 07 FY 08 Tuition and Fees 4.89% 0.07% 9.22% 4.73% 12.75% 4.30% 24.94% 9.45% 12.64% 10.23% 7.98% 7.69% 16.91% 40.69% 9.10% 6.20% 3.61% 7.98% 5.58% 6.57% Sales & Services of Educational Activities N/A N/A N/A N/A 35.59% 82.25% 10.00% 2.94% 10.66% 6.12% Health Care 7.30% 11.05% 11.46% 5.80% 10.01% 11.41% 18.70% 9.54% 12.11% 5.91% 2.39% 19.27% 20.43% 9.53% 1.91% 1.52% 31.26% 10.77% 5.02% 1.42% 33.15% % 47.84% % 16.76% 12.92% 37.90% 9.48% 19.82% 5.18% 0.46% 4.42% 0.60% 18.65% 2.58% 1.11% 2.98% 13.85% 2.80% 8.64% Gift Contributions for 0.23% 9.75% 16.38% 12.99% 0.32% 2.77% 62.51% 15.34% 13.60% 40.55% Net Investment Income N/A N/A N/A N/A % 53.43% 29.51% 8.42% 62.19% % Overhead on 7.05% 13.43% 10.77% 33.41% 11.05% 8.84% 5.66% 5.76% 1.60% 4.81% Designated Activities 7.04% 59.77% 6.69% N/A N/A N/A N/A N/A N/A N/A 4.90% 13.76% 8.58% 6.41% 11.95% 10.28% 11.74% 7.74% 11.67% 2.57% % CHANGE IN EXPENDITURES/EXPENSES FY 99 FY 00 FY 01 FY 02 FY 03 FY 04 FY 05 FY 06 FY 07 FY % 8.12% 6.48% 19.28% 7.60% 7.19% 9.39% 7.80% 5.11% 9.13% Equip. Hospitals & Clinics 15.91% 20.66% 10.31% 11.73% 5.84% 6.21% 23.14% 10.07% 3.03% 6.04% Equip. All 9.25% 2.88% 14.83% 22.26% 4.15% 2.58% 8.38% 4.69% 6.42% 11.90% Depreciation & Amortization N/A N/A N/A N/A 15.19% 14.50% 26.03% 21.35% 8.19% 10.27% Interest Expense on Cap. Asset Financing N/A N/A N/A N/A N/A N/A 41.47% % N/A N/A Capital Projects & Debt Service 33.99% 21.64% 13.86% N/A N/A N/A N/A N/A N/A N/A 8.52% 8.03% 8.77% 13.37% 5.60% 6.63% 12.14% 8.43% 5.11% 9.06%
47 UNIVERSITY OF TEXAS HEALTH INSTITUTIONS SUMMARY OF ACTUAL REVENUE TRENDS FISCAL YEAR 1999 THROUGH Tuition and Fees ,400 1,200 1, , ,017 1,160 1, Sales & Services of Educational Activities ,000 3,500 Health Care 3,075 3,368 3,776 3, ,000 2,500 2,000 1,614 1,792 2,113 1,998 2,325 2, , ,
48 UNIVERSITY OF TEXAS HEALTH INSTITUTIONS SUMMARY OF ACTUAL REVENUE TRENDS FISCAL YEAR 1999 THROUGH 2008 Gift Contributions for 1,200 1, , Net Investment Income Overhead on (74) (40) 50 (100) 400 Designated Activities
49 UNIVERSITY OF TEXAS HEALTH INSTITUTIONS SUMMARY OF ACTUAL EXPENDITURE/EXPENSE TRENDS FISCAL YEAR 1999 THROUGH ,500 4,000 3,500 3,000 2,500 2,000 2,054 2,221 3,253 3,035 2,821 2,365 3,836 3,559 4,032 4,400 1,200 1, Equip. Hospitals & Clinics ,095 1,063 1,161 1, , Equip. All Depreciation & Amortization 1, , , Interest Expense on Cap. Asset Financing In Thousands Capital Projects & Debt Service
50 UNIVERSITY OF TEXAS SYSTEM ADMINISTRATION FY 2008 ($526.3) Million in Revenue 20% 0% 4.32% 3.40% 0.26% 1.41% 0.20% % 20% 40% 60% 80% 100% 120% Sponsored Programs Sales & Services of Educational Activities Gift Contributions for Net Investment Income $666.0 Million in Expenses Equip. All 69.42% 5.32% Interest Expense on Cap. Asset Financing 24.31% Depreciation & Amortization 0.95%
51
52 UNIVERSITY OF TEXAS SYSTEM ADMINISTRATION FY 2006 $1.9 Billion in Revenue Net Investment Income 97.47% 0.95% Gift Contributions for 0.05% Sales & Services of Educational Activities 0.49% 0.69% 0.32% $256.0 Million in Expenses 12.54% Equip. All 16.82% Depreciation & Amortization 2.08% Interest Expense on Cap. Asset Financing 68.56%
53 UNIVERSITY OF TEXAS SYSTEM ADMINISTRATION FY 2005 $3.0 Billion in Revenue Net Investment Income 98.43% 0.35% Gift Contributions for 0.03% Sales & Services of Educational Activities 0.46% 0.51% 0.20% $197.1 Million in Expenses Equip. All 19.02% Depreciation & Amortization 2.02% 14.83% Interest Expense on Cap. Asset Financing 64.14%
54 UNIVERSITY OF TEXAS SYSTEM ADMINISTRATION FY 2004 $1.5 Billion in Revenue Net Investment Income 95.01% 0.54% Gift Contributions for 0.07% 0.39% Sales & Services of Educational Activities 0.31% 3.67% $194.0 Million in Expenses 12.59% Equip. All 40.75% Depreciation & Amortization 0.83% Interest Expense on Cap. Asset Financing 45.82% The $1.4 billion of excess revenues over expenses are primarily comprised of reinvested earnings of the Permanent University Fund and other endowment funds. In the future, these reinvested funds will be used to make distributions to the Available University Fund and to the institutions.
55 UNIVERSITY OF TEXAS SYSTEM ADMINISTRATION FY 2003 $1.5 Billion in Revenue Net Investment Income 93.71% 0.12% Gift Contributions for 0.08% Sales & Services of Educational Activities 0.41% 5.13% 0.55% $194.0 Million in Expenses 15.27% Equip. All 28.51% Depreciation & Amortization 0.95% Interest Expense on Cap. Asset Financing 55.27% The $1.4 billion of excess revenues over expenses are primarily comprised of reinvested earnings of the Permanent University Fund and other endowment funds. In the future, these reinvested funds will be used to make distributions to the Available University Fund and to the institutions.
56 UNIVERSITY OF TEXAS SYSTEM ADMINISTRATION FY 2002 ($617.7) Million in Revenue 20% 7.03% 0.65% 0.40% 0% 1.37% 0.07% 20% 40% 60% 80% 100% 120% Sales & Services of Educational Activities Gift Contributions for % Net Investment Income $142.4 Million in Expenses Equip. All 21.33% Depreciation & Amortization 1.11% 14.41% Interest Expense on Cap. Asset Financing 63.15%
57 UNIVERSITY OF TEXAS SYSTEM ADMINISTRATION FY 2001 $18.0 Million in Revenue Designated Activities 44.19% Gift Contributions for 4.43% 51.37% $34.1 Million in Expenditures 60% 52.93% 50.22% 50% 40% 30% 20% 10% 3.15% 0% 10% Equip. All Capital Projects & Debt Service
58 UNIVERSITY OF TEXAS SYSTEM ADMINISTRATION FY 2000 $74.2 Million in Revenue Designated Activities 93.41% 5.42% Gift Contributions for 1.17% $43.2 Million in Expenditures 40.17% Equip. All 50.09% Capital Projects & Debt Service 9.74%
59 UNIVERSITY OF TEXAS SYSTEM ADMINISTRATION FY 1999 $54.6 Million in Revenue Designated Activities 92.45% 5.88% Gift Contributions for 1.68% $34.0 Million in Expenditures Equip. All 42.35% 54.02% Capital Projects & Debt Service 3.63%
60 UNIVERSITY OF TEXAS SYSTEM ADMINISTRATION SUMMARY OF ACTUAL REVENUE AND EXPENDITURE/EXPENSE TRENDS FISCAL YEAR 1999 THROUGH 2008 REVENUES FY 99 FY 00 FY 01 FY 02 FY 03 FY 04 FY 05 FY 06 FY 07 FY 08 $ 4,000,000 1,812,000 8,321,512 10,287,876 18,174,453 13,027,006 22,761,025 Sales & Services of Educational Activities 2,459,036 6,114,654 4,728,244 13,579,656 9,402,489 28,134,264 17,917,696 43,404,872 77,456,167 56,869,955 15,201,593 13,096,601 55,755,465 (1,391,417) 3,210,072 4,025,173 9,266,883 8,464,162 8,288,165 6,057,411 6,071,989 6,156, ,190 7,437,221 Gift Contributions for 915, , , ,088 1,160,003 1,141, , ,514 1,075,135 1,036,355 Net Investment Income (676,426,518) 1,413,608,465 1,470,567,775 2,920,363,476 1,859,433,931 2,821,106,280 (574,796,406) Overhead on 134, , , , ,640 Designated Activities 50,502,865 69,333,421 7,971,381 $ 54,628,400 74,228,471 18,038,009 (617,653,360) 1,508,439,454 1,547,820,278 2,966,961,087 1,907,713,621 2,920,506,874 (526,330,885) EXPENDITURES/EXPENSES FY 99 FY 00 FY 01 FY 02 FY 03 FY 04 FY 05 FY 06 FY 07 FY 08 $ 18,362,266 17,351,327 18,037,725 20,512,286 24,180,159 24,434,081 29,226,983 32,101,666 32,616,265 35,459,672 Equip. All 14,393,398 21,636,097 17,114,615 30,369,655 45,146,064 79,060,196 37,483,655 43,072,168 33,796, ,356,437 Depreciation & Amortization 1,587,391 1,500,349 1,607,386 3,972,908 5,316,845 5,355,076 6,321,367 Interest Expense on Cap. Asset Financing 89,918,208 87,527,873 88,898, ,439, ,514, ,809, ,890,636 Capital Projects & Debt Service 1,234,804 4,208,497 (1,074,348) $ 33,990,468 43,195,921 34,077, ,387, ,354, ,000, ,123, ,005, ,576, ,028,113 % CHANGE IN REVENUES FY 99 FY 00 FY 01 FY 02 FY 03 FY 04 FY 05 FY 06 FY 07 FY 08 N/A N/A N/A N/A 54.70% % 23.63% 76.66% 28.32% 74.72% Sales & Services of Educational Activities N/A N/A N/A N/A % 22.67% % 30.76% % 36.31% N/A N/A N/A N/A 78.45% 26.58% 73.27% 13.85% % % % 25.39% % 8.66% 2.08% 26.91% 0.24% 1.38% 86.74% % Gift Contributions for 2.91% 4.98% 8.06% 44.35% % 1.61% 27.32% 5.91% 22.38% 3.61% Net Investment Income N/A N/A N/A N/A % 4.03% 98.59% 36.33% 51.72% % Overhead on N/A N/A N/A N/A N/A N/A % 8.84% 3.67% 18.92% Designated Activities % 37.29% 88.50% N/A N/A N/A N/A N/A N/A N/A % 35.88% 75.70% % % 2.61% 91.69% 35.70% 53.09% % % CHANGE IN EXPENDITURES/EXPENSES FY 99 FY 00 FY 01 FY 02 FY 03 FY 04 FY 05 FY 06 FY 07 FY % 5.51% 3.96% 13.72% 17.88% 1.05% 19.62% 9.84% 1.60% 8.72% Equip. All 35.34% 50.32% 20.90% 77.45% 48.66% 75.12% 52.59% 14.91% 21.54% % Depreciation & Amortization N/A N/A N/A N/A 5.48% 7.13% % 33.83% 0.72% 18.04% Interest Expense on Cap. Asset Financing N/A N/A N/A N/A 2.66% 1.57% 42.23% 38.81% 6.67% 1.17% Capital Projects & Debt Service 10.90% % % N/A N/A N/A N/A N/A N/A N/A 16.88% 27.08% 21.11% % 11.21% 22.51% 1.61% 29.87% 7.98% %
MONTHLY FINANCIAL REPORT (unaudited)
") T HE U NIVERSITY OF T EXAS S YSTEM O FFICE OF THE C ONTROLLER MONTHLY FINANCIAL REPORT (unaudited) MARCH 2009 201 Seventh Street, ASH 5 th Floor Austin, Texas 78701 512.499.4527 www.utsystem.edu/cont THE
T HE U NIVERSITY OF T EXAS S YSTEM O FFICE OF THE C ONTROLLER MONTHLY FINANCIAL REPORT (unaudited) MARCH 2009 201 Seventh Street, ASH 5 th Floor Austin, Texas 78701 512.499.4527 www.utsystem.edu/cont THE
THE UNIVERSITY OF TEXAS SYSTEM OPERATING BUDGET SUMMARIES FISCAL YEAR 2015 AUGUST 2014 AND RESERVE ALLOCATIONS FOR LIBRARY, EQUIPMENT, REPAIR
 THE UNIVERSITY OF TEXAS SYSTEM OPERATING BUDGET SUMMARIES AND RESERVE ALLOCATIONS FOR LIBRARY, EQUIPMENT, REPAIR AND REHABILITATION AND FACULTY STARS FISCAL YEAR 2015 AUGUST 2014 The University of Texas
The University of Texas at San Antonio 2014 Summary of Financial Condition. Financial Condition: Satisfactory
 The University of Texas at San Antonio 2014 Summary of Financial Condition Financial Condition: Satisfactory Composite Financial Index Operating Expense Coverage Ratio 4.0 3.7 3.3 3.3 3.2 (in months) 7.0
THE UNIVERSITY OF TEXAS SYSTEM
 THE UNIVERSITY OF TEXAS SYSTEM CONSOLIDATED FINANCIAL STATEMENTS FOR THE YEARS ENDED AUGUST 31, 2015 AND 2014 AND INDEPENDENT AUDITORS REPORT The University of Texas at Arlington The University of Texas
T HE U NIVERSITY OF T EXAS S YSTEM A DMINISTRATION
 T HE U NIVERSITY OF T EXAS S YSTEM A DMINISTRATION A LLOCATION OF P ERMANENT U NIVERSITY F UND B OND P ROCEEDS R ESERVES FOR L IBRARY, E QUIPMENT, R EPAIR AND R EHABILITATION A ND F ACULTY STARS F ISCAL
Tuition and Fees. Jim Brunjes Vice Chancellor and Chief Financial Officer. Fiscal Year 2016. March 5, 2015
 Tuition and Fees Fiscal Year 2016 Jim Brunjes Vice Chancellor and Chief Financial Officer March 5, 2015 Hazlewood Exemption Page 2 Hazlewood Exemption Fiscal Years 2011 to 2014 Texas Tech University FY11
THE UNIVERSITY OF TEXAS SYSTEM ANNUAL FINANCIAL REPORT FISCAL YEAR 2014 PRIMARY FINANCIAL STATEMENTS
 THE UNIVERSITY OF TEXAS SYSTEM ANNUAL FINANCIAL REPORT PRIMARY FINANCIAL STATEMENTS FISCAL YEAR 2014 The University of Texas at Arlington The University of Texas at Austin The University of Texas at Brownsville
A BILL TO BE ENTITLED AN ACT. relating to establishing a health science center and medical school
 By:AALucio S.B.ANo.A0 A BILL TO BE ENTITLED AN ACT relating to establishing a health science center and medical school in the Rio Grande Valley. BE IT ENACTED BY THE LEGISLATURE OF THE STATE OF TEXAS:
Texas Retirement Fundamentals 2012
 THE UNIVERSITY OF TEXAS SYSTEM ANNUAL FINANCIAL REPORT PRIMARY FINANCIAL STATEMENTS FISCAL YEAR 2012 The University of Texas at Arlington The University of Texas at Austin The University of Texas at Brownsville
FUND ACCOUNTING TRAINING
 FUND ACCOUNTING TRAINING Module 2 Current Funds The University of Texas System OBJECTIVES Obtain understanding of: Difference between Current Funds and Noncurrent Funds Difference between Unrestricted
WITH REPORTS OF INDEPENDENT AUDITORS
 As of and for the Years Ended JUNE 30, 2013 AND JUNE 30, 2014 Financial Statements and Schedule of Expenditures of Federal Awards WITH REPORTS OF INDEPENDENT AUDITORS AUDITED FINANCIAL STATEMENTS Independent
FUND ACCOUNTING TRAINING
 FUND ACCOUNTING TRAINING Module 7 Financial Statements The University of Texas System OBJECTIVES Identify three principal financial statements of colleges and universities Describe basic content and layout
Accounting for Colleges & Universities. Chapter 17
 Accounting for Colleges & Universities Chapter 17 Learning Objectives Understand why most government C&Us choose to report as business-type only special purpose governments Explain unique aspects of C&U
University of California, Berkeley MANAGEMENT S DISCUSSION AND ANALYSIS (UNAUDITED)
") The objective of Management s Discussion & Analysis (MD&A) is to help readers of the financial statements of the University of California, Berkeley (Berkeley) better understand the financial position and
The objective of Management s Discussion & Analysis (MD&A) is to help readers of the financial statements of the University of California, Berkeley (Berkeley) better understand the financial position and
The California State University GAAP Reporting Manual Effective June 2012 CHAPTER 6 STATEMENT OF CASH FLOWS
 CHAPTER 6 STATEMENT OF CASH FLOWS OVERVIEW GASB Statement No. 34 requires the presentation of a statement of cash flows based on the provisions of GASB Statement No. 9. It further requires the use of the
1. U. T. System: Recommendation to Approve Chancellor s Docket No. 108 RECOMMENDATION. It is recommended that Chancellor s Docket No. 108 be approved.
 1. U. T. System: Recommendation to Approve Chancellor s Docket No. 108 RECOMMENDATION It is recommended that Chancellor s Docket No. 108 be approved. It is requested that the Committee confirm that authority
Case Western Reserve University Consolidated Financial Statements for the Year Ending June 30, 2001
 Contents Report of Independent Accountants 1 Part 1 Consolidated Financial Statements Consolidated Balance Sheet 2 Consolidated Statement of Activities 3 Consolidated Statement of Cash Flows 4 Part 2 Summary
A Transparent Approach to Higher Education Accountability
 A Transparent Approach to Higher Education Accountability Developed and Implemented by The University of Texas System Our Commitment to Accountability One of the highest priorities of the Chancellor and
T HE U NIVERSITY OF T EXAS S YSTEM A DMINISTRATION
 T HE U NIVERSITY OF T EXAS S YSTEM A DMINISTRATION A LLOCATION OF P ERMANENT U NIVERSITY F UND B OND P ROCEEDS R ESERVES FOR L IBRARY, E QUIPMENT, R EPAIR AND R EHABILITATION A ND F ACULTY STARS F ISCAL
The University of Texas System Rules and Regulations of the Board of Regents Rule: 40601. Institutions Comprising The University of Texas System
 1. Title Institutions Comprising The University of Texas System 2. Rule and Regulation Sec. 1 Official Titles. The U. T. System is composed of the institutions and entities set forth below. To ensure uniformity
University of South Florida System and DSO/Component Unit Quarterly Financial Reports QUARTER 3 FOR FISCAL YEAR 2014-2015
 University of South Florida System and DSO/Component Unit Quarterly Financial Reports QUARTER 3 FOR FISCAL YEAR 2014-2015 Period Ended March 31, 2015 FY 2015 QUARTER 3 REPORT MARCH 31, 2015 INDEX University
Account Groups. Table of Contents. VII. 32 accounts - Loan Funds Purpose, Source of Funds, Typical Expenditures, Transfers, Restrictions
 Account Groups Table of Contents I. 14 accounts - Education and General Funds Purpose, Source of funds, Typical Expenditures, Transfers, Restrictions, Travel, Balance II. 18 accounts - Service Center Revolving
THE UNIVERSITY OF TEXAS AT DALLAS OPERATING BUDGET FISCAL YEAR ENDING AUGUST 31, 2015. Adopted by the U. T. System Board of Regents August 21, 2014
 OPERATING BUDGET FISCAL YEAR ENDING AUGUST 31, 2015 Adopted by the U. T. System Board of Regents August 21, 2014 OPERATING BUDGET FISCAL YEAR ENDING AUGUST 31, 2015 Adopted by the U. T. System Board of
LEGISLATIVE BUDGET BOARD STAFF. Financing Higher Education in Texas
 LEGISLATIVE BUDGET BOARD Financing Higher Education in Texas Legislative Primer LEGISLATIVE BUDGET BOARD STAFF SUBMITTED TO THE 83RD TEXAS LEGISLATURE FIFTH EDITION FEBRUARY 2013 Financing Higher Education
Preparing and Submitting Legislative Appropriation Requests in ABEST for Institutions and Agencies of Higher Education, Schedules 1 9
 LEGISLATIVE BUDGET BOARD Preparing and Submitting Legislative Appropriation Requests in ABEST for Institutions and Agencies of Higher Education, Schedules 1 9 Data Entry Instructions for Institutions and
Accounting and Reporting for Public Colleges and Universities. Objectives
 Accounting and Reporting for Public Colleges and Universities 2012-2013 NACUBO Intermediate Accounting Objectives Upon completion of these materials, you will be able to Comprehend the reporting and recognition
CALIFORNIA STATE UNIVERSITY, SAN MARCOS. Financial Statements. June 30, 2005 and 2004. (With Independent Auditors Report Thereon)
") Financial Statements (With Independent Auditors Report Thereon) Table of Contents Page Independent Auditors Report 1 Management s Discussion and Analysis 3 Financial Statements: Statements of Net Assets
Financial Statements (With Independent Auditors Report Thereon) Table of Contents Page Independent Auditors Report 1 Management s Discussion and Analysis 3 Financial Statements: Statements of Net Assets
ASSOCIATED STUDENTS OF CALIFORNIA STATE UNIVERSITY, LOS ANGELES, INC. (A Component Unit of California State University, Los Angeles)
") CALIFORNIA STATE UNIVERSITY, LOS ANGELES, INC. (A Component Unit of California State University, Los Angeles) Independent Auditor's Report, Financial Statements and Supplemental Information For the Years
CALIFORNIA STATE UNIVERSITY, LOS ANGELES, INC. (A Component Unit of California State University, Los Angeles) Independent Auditor's Report, Financial Statements and Supplemental Information For the Years
FINANCIAL REPORT. of the UNIVERSITY OF NORTH TEXAS AT DALLAS DALLAS, TEXAS. Ronald T. Brown, President
 FINANCIAL REPORT of the UNIVERSITY OF NORTH TEXAS AT DALLAS DALLAS, TEXAS Ronald T. Brown, President For the fiscal year ended August 31, 2014 TABLE OF CONTENTS Letter of Transmittal... 1 Organizational
Finance 2009-10. GASB (Governmental Accounting Standards Board), using standards of GASB 34 & 35
, using standards of GASB 34 & 35") Finance 2009-10 Institution: University of South Carolina-Columbia (218663) ---_._-----j........... J User ID: 45c0011 Finance - Public institutions Reporting Standard Please indicate which reporting standards
Finance 2009-10 Institution: University of South Carolina-Columbia (218663) ---_._-----j........... J User ID: 45c0011 Finance - Public institutions Reporting Standard Please indicate which reporting standards
TCS Online Data Dictionary
 TCS Online Data Dictionary Label Definition Report Academic year The period of time generally extending from September to June; usually equated to 2 semesters or trimesters, 3 Report Filters quarters,
The University of Alabama in Huntsville
 The University of Alabama in Huntsville FINANCIAL REPORT 2012-2013 Table of Contents Independent Auditor s Report......... 2 Management s Discussion and Analysis (Unaudited)..... 4 Statements of Net Position............
Associated Students Incorporated of California State University, Stanislaus. Financial Statements and Supplemental Information
 Associated Students Incorporated of California State University, Stanislaus Financial Statements and Supplemental Information Years Ended June 30, 2015 and 2014 Financial Statements and Supplemental Information
Strategic Plan Fiscal Years 2012-2016. Creating Value Through Collaboration
 Strategic Plan Fiscal Years 2012-2016 Creating Value Through Collaboration VISION The vision of the UT System Supply Chain Alliance is to be a leader in the delivery of world-class supply chain services
California State University Bakersfield Foundation. FINANCIAL REPORT (Audited)
") California State University Bakersfield Foundation FINANCIAL REPORT (Audited) JUNE 30, 2011 CALIFORNIA STATE UNIVERSITY, BAKERSFIELD, FOUNDATION FINANCIAL REPORT (Audited) JUNE 30, 2011 C O N T E N T S
California State University Bakersfield Foundation FINANCIAL REPORT (Audited) JUNE 30, 2011 CALIFORNIA STATE UNIVERSITY, BAKERSFIELD, FOUNDATION FINANCIAL REPORT (Audited) JUNE 30, 2011 C O N T E N T S
REPORT NO. 2012-123 MARCH 2012 UNIVERSITY OF CENTRAL FLORIDA. Financial Audit
 REPORT NO. 2012-123 MARCH 2012 Financial Audit For the Fiscal Year Ended June 30, 2011 BOARD OF TRUSTEES AND PRESIDENT Members of the Board of Trustees and President who served during the 2010-11 fiscal
CITY OF SIMI VALLEY MEMORANDUM
 CITY OF SIMI VALLEY MEMORANDUM AGENDA ITEM NO. Consent (2) January 12, 215 TO: FROM: City Council Department of Administrative Services SUBJECT: APPROVAL OF A SUPPLEMENTAL BUDGET REQUEST TRANSFERRING S
UNIVERSITY OF NORTH TEXAS HEALTH SCIENCE CENTER AT FORT WORTH
 UNIVERSITY OF NORTH TEXAS HEALTH SCIENCE CENTER AT FORT WORTH General Revenue Fund $ 56,388,382 $ 56,385,726 $ 48,483,181 $ 48,481,790 $ 38,619,071 Account No. 770 4,444,842 4,444,842 4,334,078 4,313,305
Kent State University
 Kent State University Financial Report June 30, 2012 Table of Contents June 30, 2012 and 2011 Page(s) Management s Discussion and Analysis (unaudited)... 1-8 Financial Statements Report of Independent
TABLE OF CONTENTS FOR AUDIT, COMPLIANCE, AND MANAGEMENT REVIEW COMMITTEE
 TABLE OF CONTENTS FOR AUDIT, COMPLIANCE, AND MANAGEMENT REVIEW COMMITTEE Brenda Pejovich, Chairman Wallace L. Hall, Jr. R. Steven Hicks Jeffery D. Hildebrand Robert L. Stillwell Committee Meeting: /4/203
ARKANSAS DEPARTMENT OF HIGHER EDUCATION ADHE 17-1 SUMMARY OF INCOME FOR ALL FUND GROUPS (SEE INSTRUCTIONS)
") ADHE 17-1 SUMMARY OF INCOME FOR ALL FUND GROUPS FICE CODE 001109 COMPLETED BY: Cliff Ferren INSTITUTION DATE COMPLETED: 9/8/2014 FISCAL YEAR 2014 TELEPHONE NO. (501) 686-6810 INCOME (and other additions)
ADHE 17-1 SUMMARY OF INCOME FOR ALL FUND GROUPS FICE CODE 001109 COMPLETED BY: Cliff Ferren INSTITUTION DATE COMPLETED: 9/8/2014 FISCAL YEAR 2014 TELEPHONE NO. (501) 686-6810 INCOME (and other additions)
EXECUTIVE PERFORMANCE INCENTIVE COMPENSATION PLAN
 EXECUTIVE PERFORMANCE INCENTIVE COMPENSATION PLAN For The University of Texas System Presidents and System Administration Executive Officers Effective September 1, 2012 TABLE OF CONTENTS 1. Background...
Accounting for Fiduciary Activities Agency and Trust Funds
 Chapter 8 Accounting for Fiduciary Activities Agency and Trust Funds McGraw-Hill/Irwin Copyright 2010 by The McGraw-Hill Companies, Inc. All rights reserved. 8-2 Learning Objectives After studying Chapter
CONTENTS. Independent Auditors Report... 1. Consolidated Statements of Financial Position... 2. Consolidated Statements of Activities...
 CONTENTS Independent Auditors Report... 1 Consolidated Statements of Financial Position... 2 Consolidated Statements of Activities...3-4 Consolidated Statements of Cash Flows... 5 Notes to the Consolidated
Office of the President Phone: 774.455.7710 333 South Street, Suite 400 Fax: 774-455-7730
 Office of the President Phone: 774.455.7710 333 South Street, Suite 400 Fax: 774-455-7730 Shrewsbury, Massachusetts 01545 www.massachusetts.edu As part of the Commonwealth s budget process, the University
The University of Texas System. Accountability and Performance Report 2003-2004
 The University of Texas System Briefing Book The University of Texas System Board of Regents Accountability and Performance Report 2003-2004 The University of Texas at Arlington l The University of Texas
REPORT NO. 2012-144 MARCH 2012 UNIVERSITY OF SOUTH FLORIDA. Financial Audit
 REPORT NO. 2012-144 MARCH 2012 Financial Audit For the Fiscal Year Ended June 30, 2011 BOARD OF TRUSTEES AND PRESIDENT Members of the Board of Trustees and President who served during the 2010-11 fiscal
FUND ACCOUNTING TRAINING
 FUND ACCOUNTING TRAINING Module 6 Plant Funds The University of Texas System OBJECTIVES Define each of the three subgroups of Plant Funds Describe sources and uses of funds for each subgroup Explain interrelationship
West Virginia Council for Community and Technical College Education
 West Virginia Council for Community and Technical College Education Combined Financial Statements Years Ended June 30, 2013 and 2012 and Independent Auditor s Reports TABLE OF CONTENTS INDEPENDENT AUDITOR
Fund Accounting for Governmental Organizations. Published June 2010
 Fund Accounting for Governmental Organizations Published June 2010 Learning Objectives To understand: Basics of fund accounting: What is it? Why do we use it? Fund accounting at the University Fund accounting
Gov. Rec. FY 2015. Agency Req. FY 2016
 UNIVERSITY OF KANSAS Actual FY 2014 Agency Est. Agency Req. Agency Req. FY 2017 FY 2017 Operating Expenditures: State General Fund $ 135,402,775 $ 137,384,253 $ 137,168,039 $ 136,930,098 $ 135,932,220
Owens State Community College (a component unit of the State of Ohio) Financial Report with Supplemental Information June 30, 2013 and 2012
 Financial Report with Supplemental Information June 30, 2013 and 2012") (a component unit of the State of Ohio) Financial Report with Supplemental Information June 30, 2013 and 2012 Board of Trustees Owens State Community College PO Box 10000 Toledo, Ohio 43699-1947 We have
(a component unit of the State of Ohio) Financial Report with Supplemental Information June 30, 2013 and 2012 Board of Trustees Owens State Community College PO Box 10000 Toledo, Ohio 43699-1947 We have
West Virginia School of Osteopathic Medicine. Financial Statements Years Ended June 30, 2012 and 2011 and Independent Auditors Reports
 West Virginia School of Osteopathic Medicine Financial Statements Years Ended June 30, 2012 and 2011 and Independent Auditors Reports TABLE OF CONTENTS INDEPENDENT AUDITORS REPORT 3-4 MANAGEMENT S DISCUSSION
CREIGHTON UNIVERSITY. Consolidated Financial Statements. June 30, 2014 and 2013. (With Independent Auditors Report Thereon)
") Consolidated Financial Statements (With Independent Auditors Report Thereon) Table of Contents Page(s) Independent Auditors Report 1 2 Consolidated Statements of Financial Position 3 Consolidated Statements
Consolidated Financial Statements (With Independent Auditors Report Thereon) Table of Contents Page(s) Independent Auditors Report 1 2 Consolidated Statements of Financial Position 3 Consolidated Statements
How To Teach At A University
 Texas Higher Education Coordinating Board Accountability in Higher Education: Promoting Excellence in Texas Public Universities through Institutional Groupings, Peers, and Benchmarks BACKGROUND Texas Closing
Fas t. Facts. 2014 The University of Texas System Nine Universities. Six Health Institutions. Unlimited Possibilities.
 Fas t Facts 013 2014 The University of Texas System Nine Universities. Six Health Institutions. Unlimited Possibilities. www.utsystem.edu/ www.utsystem.edu fastfacts At a Glance Enrollment & Degrees undergrad
Quarterly Report of the Controller-Treasurer Ending 6/30/14
 1. STATE OF THE DISTRICT S EMPLOYEE PENSIONS AND OTHER OBLIGATIONS Background In 2008, the District implemented GASB 50 (previously GASB 27 implemented in 1998) and 45 which required disclosure and recognition
Southern West Virginia Community and Technical College Financial Statements. Years Ended June 30, 2012 and 2011 and Independent Auditors Reports
 Southern West Virginia Community and Technical College Financial Statements Years Ended June 30, 2012 and 2011 and Independent Auditors Reports SOUTHERN WEST VIRGINIA COMMUNITY AND TECHNICAL COLLEGE TABLE
FY14 ANNUAL FINANCIAL STATEMENTS Financial Statements for the Years Ended June 30, 2014 and 2013 and Independent Auditor s Report. Including Schedule
 FY14 ANNUAL FINANCIAL STATEMENTS Financial Statements for the Years Ended June 30, 2014 and 2013 and Independent Auditor s Report. Including Schedule of Expenditures of Federal Awards and Single Audit
Accounting for Health Care Organizations. Chapter 13
 Accounting for Health Care Organizations Chapter 13 Learning Objectives Account for unique hospital revenue sources Prepare journal entries for hospital transactions Prepare government hospital financial
FY 2016 EXECUTIVE SUMMARY FISCAL YEAR ENDING AUGUST 31, 2016
 FY 2016 EXECUTIVE SUMMARY FISCAL YEAR ENDING AUGUST 31, 2016 System Members Universities Prairie View A&M University President: George C. Wright Established: 1876 Tarleton State University President: F.
The University of Michigan Reports on Federal Awards in Accordance with OMB Circular A-133 For the Year Ended June 30, 2005
 The University of Michigan Reports on Federal Awards in Accordance with OMB Circular A-133 For the Year Ended June 30, 2005 The University of Michigan Contents Pages (s) Part I Financial Information Report
UNIVERSITY OF TEXAS ARLINGTON
 UNIVERSITY OF TEXAS ARLINGTON Total Academic Cost Proposed Fall 2016 Proposed Fall 2017 Fall 2016 $4,646 $4,808 $162 $4,976 $168 $10,764 $11,460 $696 $12,201 $741 $4,259 $4,409 $150 $4,564 $155 $8,136
Accountability and Performance Report
 The University of Texas System Briefing Book The University of Texas System Board of Regents Accountability and Performance Report 2004-2005 The University of Texas at Arlington The University of Texas
CREIGHTON UNIVERSITY. Consolidated Financial Statements. June 30, 2015 and 2014. (With Independent Auditors Report Thereon)
") Consolidated Financial Statements (With Independent Auditors Report Thereon) Table of Contents Page(s) Independent Auditors Report 1 2 Consolidated Statements of Financial Position 3 Consolidated Statements
Consolidated Financial Statements (With Independent Auditors Report Thereon) Table of Contents Page(s) Independent Auditors Report 1 2 Consolidated Statements of Financial Position 3 Consolidated Statements
The Colleges of the Seneca Financial Statements May 31, 2007 and 2006
 Financial Statements PricewaterhouseCoopers LLP 1100 Bausch & Lomb Place Rochester NY 14604-2705 Telephone (585) 232 4000 Facsimile (585) 454 6594 Report of Independent Auditors To the Board of Trustees
Giving to the UT System. www.utsystem.edu/giving
 FAST FACTS 2012 An overview of statistics from across The University of Texas System The 15 institutions of The University of Texas System bring transformative opportunities to Texas opportunities for
UNIVERSITY OF ALASKA. (A Component Unit of the State of Alaska) Financial Statements. June 30, 2005 and 2004
 Financial Statements. June 30, 2005 and 2004") UNIVERSITY OF ALASKA (A Component Unit of the State of Alaska) Financial Statements June 30, 2005 and 2004 (With Independent Auditors' Report Thereon) University of Alaska (A Component Unit of the State
UNIVERSITY OF ALASKA (A Component Unit of the State of Alaska) Financial Statements June 30, 2005 and 2004 (With Independent Auditors' Report Thereon) University of Alaska (A Component Unit of the State
STRATEGIC FINANCIAL PLANNING SANTA CLARA UNIVERSITY GUIDELINES FOR BUDGETING AND FINANCIAL MANAGEMENT OF CURRENT OPERATIONS
 STRATEGIC FINANCIAL PLANNING SANTA CLARA UNIVERSITY GUIDELINES FOR BUDGETING AND FINANCIAL MANAGEMENT OF CURRENT OPERATIONS INTRODUCTION The University faces a significant challenge in providing the financial
Southern West Virginia Community and Technical College Financial Statements Years Ended June 30, 2014 and 2013
 Southern West Virginia Community and Technical College Financial Statements Years Ended June 30, 2014 and 2013 and Independent Auditor s Reports SOUTHERN WEST VIRGINIA COMMUNITY AND TECHNICAL COLLEGE TABLE
Dartmouth College Report on Federal Awards in Accordance with OMB Circular A-133 June 30, 2014 EIN #020222111
 Report on Federal Awards in Accordance with OMB Circular A-133 June 30, 2014 EIN #020222111 Report on Federal Awards in Accordance with OMB Circular A-133 Index June 30, 2014 Page(s) Independent Auditor
Financial Report to the Board of Trustees
 Financial Report to the Board of Trustees February 27, 2013 FY12 Closeout and FY13 Six Month Update Financial Report to the Board of Trustees February 27 2013 Table of Contents Page(s) University of Connecticut
FASB/GASB Recognition and Reporting Differences: A Nonprofit Sector Perspective
 FASB/GASB Recognition and Reporting Differences: A Nonprofit Sector Perspective Treba Marsh Stephen F. Austin State University Mary Fischer University of Texas at Tyler The financial statement users, investors,
University of Central Florida Foundation, Inc. (A Discrete Component Unit of the University of Central Florida)
") University of Central Florida Foundation, Inc. (A Discrete Component Unit of the University of Central Florida) Single Audit Report Year Ended June 30, 2015 Contents Independent Auditor s Report 1 Management
University of Central Florida Foundation, Inc. (A Discrete Component Unit of the University of Central Florida) Single Audit Report Year Ended June 30, 2015 Contents Independent Auditor s Report 1 Management
How To Read A University Or College'S Financial Statement
 Understanding College and University Financial Statements By Rudy Fichtenbaum Professor of Economics Department of Economics Wright State University Dayton, OH 45435 (937) 775-3085 rfichtenbaum@sbcglobal.net
Financial Statements. October 31, 2012
 Financial Statements October 31, 2012 TABLE OF CONTENTS Title Page Graphs 1-3 Statement of Net Assets 4-6 Statement of Revenues, Expenses and Changes in Net Assets 7 Statement of Cash Flows 8 Total Expenditures
Southern West Virginia Community and Technical College Financial Statements. Years Ended June 30, 2011 and 2010 and Independent Auditors Reports
 Southern West Virginia Community and Technical College Financial Statements Years Ended June 30, 2011 and 2010 and Independent Auditors Reports SOUTHERN WEST VIRGINIA COMMUNITY AND TECHNICAL COLLEGE TABLE
Kent State University (a component unit of the State of Ohio)
") Kent State University (a component unit of the State of Ohio) Financial Report June 30, 2013 Board of Trustees Kent State University 224 Michael Schwartz Center P.O. Box 5190 Kent, Ohio 44242 We have
Kent State University (a component unit of the State of Ohio) Financial Report June 30, 2013 Board of Trustees Kent State University 224 Michael Schwartz Center P.O. Box 5190 Kent, Ohio 44242 We have
THE CITADEL THE MILITARY COLLEGE OF SOUTH CAROLINA
 THE MILITARY COLLEGE OF SOUTH CAROLINA CHARLESTON, SOUTH CAROLINA YEAR ENDED JUNE 30, 2013 FINANCIAL STATEMENTS AND INDEPENDENT AUDITOR S REPORT TABLE OF CONTENTS Page INDEPENDENT AUDITOR S REPORT 1-2
REPORT NO. 2012-115 MARCH 2012 FLORIDA INTERNATIONAL UNIVERSITY. Financial Audit
 REPORT NO. 2012-115 MARCH 2012 Financial Audit For the Fiscal Year Ended June 30, 2011 BOARD OF TRUSTEES AND PRESIDENT Members of the Board of Trustees and President who served during the 2010-11 fiscal
SACRAMENTO EMPLOYMENT AND TRAINING AGENCY
 SACRAMENTO EMPLOYMENT AND TRAINING AGENCY INDEPENDENT AUDITOR S REPORT AND FINANCIAL STATEMENTS FINANCIAL STATEMENTS AND SINGLE AUDIT REPORT FINANCIAL SECTION TABLE OF CONTENTS PAGE Independent Auditor
Other Postemployment Benefits: A Plain-Language Summary of GASB Statements No. 43 and No. 45
 Governmental Accounting Standards Board Other Postemployment Benefits: A Plain-Language Summary of GASB Statements No. 43 and No. 45 Please note: This document, prepared by the GASB staff, has not been
COAST COMMUNITY COLLEGE DISTRICT ORANGE COUNTY
 ORANGE COUNTY REPORT ON AUDIT OF FINANCIAL STATEMENTS AND SUPPLEMENTARY INFORMATION INCLUDING REPORTS ON COMPLIANCE AUDIT REPORT CONTENTS Page INDEPENDENT AUDITOR S REPORT MANAGEMENT S DISCUSSION AND ANALYSIS...
WESTERN WASHINGTON UNIVERSITY BELLINGHAM, WASHINGTON ASSOCIATED STUDENTS BOOKSTORE FINANCIAL REPORT JUNE 30, 2005
 WESTERN WASHINGTON UNIVERSITY BELLINGHAM, WASHINGTON ASSOCIATED STUDENTS BOOKSTORE FINANCIAL REPORT JUNE 30, 2005 C O N T E N T S Page INDEPENDENT AUDITORS' REPORT...1 MANAGEMENT DISCUSSION AND ANALYSIS...
West Virginia School of Osteopathic Medicine. Financial Statements Years Ended June 30, 2007 and 2006 and Independent Auditors Reports
 West Virginia School of Osteopathic Medicine Financial Statements Years Ended June 30, 2007 and 2006 and Independent Auditors Reports TABLE OF CONTENTS 2 INDEPENDENT AUDITORS REPORT 3-4 MANAGEMENT S DISCUSSION
Western Michigan University. General Purpose Financial Report June 30, 2015
 General Purpose Financial Report June 30, 2015 Contents Report Letter 1-2 Management s Discussion and Analysis 3-13 Financial Statements Statement of Net Position 14 Statement of Revenue, Expenses, and
Employment Related Liabilities. Index POLICY APPENDIX POLICY .100 POLICY STATEMENT. Section: Human Resources Title: Employment Related Liabilities
 Employment Related Liabilities Section: Human Resources Title: Employment Related Liabilities Number: 57.300 Index POLICY.100 POLICY STATEMENT.110 POLICY RATIONALE.120 AUTHORITY.130 APPROVAL AND EFFECTIVE
Financial Statements. C.S. Mott Community College Flint, Michigan. June 30, 2014 and 2013
 Financial Statements C.S. Mott Community College Flint, Michigan June 30, 2014 and 2013 Table of Contents Page Independent Auditors Report on Financial Statements 1-2 Management s Discussion and Analysis
FINANCIAL STATEMENTS AND INDEPENDENT AUDITORS' REPORT FACULTY ASSOCIATES, INC. GAINESVILLE, FLORIDA JUNE 30, 2011
 FINANCIAL STATEMENTS AND INDEPENDENT AUDITORS' REPORT JUNE 30, 2011 FINANCIAL STATEMENTS AND INDEPENDENT AUDITORS' REPORT JUNE 30, 2011 TABLE OF CONTENTS Independent Auditors' Report... 1-2 Management's
TULANE UNIVERSITY financial statements
 TULANE UNIVERSITY financial statements 20052006 TULANE UNIVERSITY Financial Statements For The Year Ended June 30, 2006 CONTENTS I N D E P E N D E N T A U D I T O R S R E P O R T...............................
Expenditure Accounting: Governmental Funds. Chapter 6
 Expenditure Accounting: Governmental Funds Chapter 6 Learning Objectives Define expenditures Understand & apply expenditure recognition guidance Understand multiple classifications of expenditures Account
Space Projection Model Instructions
 Space Projection Model Instructions PURPOSE OF THE MODEL The Space Planning Model provides a fair and equitable assessment of space needs at Texas public universities, technical colleges, the Lamar State
Section I. Financial Statements
 Section I Financial Statements Balance Sheets At ASSETS Cash and cash equivalents (Notes B and D) $ 10,092 $ 10,209 Accounts and notes receivable, net United States government 209,368 196,614 Other 29,762
TOWN OF PROSPECT, CONNECTICUT
 BASIC FINANCIAL STATEMENTS AND SUPPLEMENTARY INFORMATION FOR THE YEAR ENDED JUNE 30, 2015 ANNUAL REPORT FOR THE YEAR ENDED JUNE 30, 2015 Table of Contents Independent Auditor's Report 4 Management's Discussion
THE JOHNS HOPKINS UNIVERSITY. Consolidated Financial Statements. June 30, 2013 and 2012
 Consolidated Financial Statements (With Independent Auditors Report Thereon) KPMG LLP 1 East Pratt Street Baltimore, MD 21202-1128 Independent Auditors Report The Board of Trustees The Johns Hopkins University:
MULTNOMAH BIBLE COLLEGE AND SEMINARY INDEPENDENT AUDITOR S REPORT AND FINANCIAL STATEMENTS
 MULTNOMAH BIBLE COLLEGE AND SEMINARY INDEPENDENT AUDITOR S REPORT AND FINANCIAL STATEMENTS JUNE 30, 2007 AND 2006 CONTENTS PAGE INDEPENDENT AUDITOR S REPORT 1 FINANCIAL STATEMENTS Statements of financial
FORT HAYS STATE UNIVERSITY
 FORT HAYS STATE UNIVERSITY Actual FY 2014 Agency Est. FY 2015 FY 2015 Agency Req. Agency Req. FY 2017 FY 2017 Operating Expenditures: State General Fund $ 32,656,997 $ 34,036,691 $ 33,988,112 $ 33,921,728
A SPECIAL REPORT FOR THE SOUTHERN ASSOCIATION OF COLLEGES AND SCHOOLS ON THE UNIVERSITY OF HOUSTON
 Table of Contents THE UNIVERSITY OF HOUSTON State Auditor s Report... 1 Current Funds Balance Sheet at August 31, 1996... 5 Statement of Current Funds Expenditures for the Fiscal Year Ended August 31,
Consolidated Financial Statements and Report of Independent Certified Public Accountants Abilene Christian University May 31, 2007 and 2006
 Consolidated Financial Statements and Report of Independent Certified Public Accountants Abilene Christian University Report of Independent Certified Public Accountants Board of Trustees Abilene Christian
Boston College Financial Statements May 31, 2007 and 2006
 Financial Statements Index Page(s) Report of Independent Auditors... 1 Financial Statements Statement of Financial Position... 2 Statement of Activities... 3 Statement of Cash Flows... 4...5-15 PricewaterhouseCoopers