Health and Social Services Needs in Whitman County Community Needs Assessment Results General Report COMMUNITY REPORT OF RESULTS
|
|
|
- Basil Allison
- 8 years ago
- Views:
Transcription
1 COMMUNITY REPORT OF RESULTS This report contains an overview of the results collected by the Health and Social Services Needs in Whitman County Survey. A description of Whitman County, the survey process, and key results from the survey are included. For a more thorough analysis of the survey results, please see the Topic Areas Report. Prepared by: Katherine Bittinger Contact: kbittinger@wsu.edu Health and Social Services Needs in Whitman County 2015 Community Needs Assessment Results General Report

2 Executive Summary To help address the needs of Whitman County residents, in conjunction with the Social and Economic Sciences Research Center, the Community Action Center, Pullman Regional Hospital, and other stakeholder agencies (see Organizations Involved ), created an extensive survey about life in Whitman County in the spring of The survey contained 266 questions about respondents quality of life, economic circumstances, employment, health, housing, food security, and use of social services. Over 1,000 Whitman County residents responded to the survey. This report highlights key findings and/or overall trends from the random sample and convenience sample data. As such, not all questions that were asked in the survey are represented in this report. A full report, containing all aggregated responses, will be available in March Tables, Figures, and Graphs with the abbreviation RS in the title denote data from the Random Sample. CS denotes data from the Convenience Sample. Conclusions made from the random sample are generalizable to the rest of Whitman County residents. However, conclusions made from the convenience sample are not generalizable to the rest of Whitman County. CS results are only applicable to those who completed the survey in the convenience sample. There are a multitude of conclusions and insights that can be drawn from this report. The wealth of data produced from this questionnaire will be useful to all health and social service agencies in Whitman County. However, there are five areas for improvement that stand out: 1) Extreme need for affordable dental care 2) Transportation to services 3) Access to nutritious food 4) Access to preventative medical care 5) Access to social services for low-income non-pullman residents Final_1

3 Contents Executive Summary... 1 About Whitman County... 3 Population Demographics... 3 Poverty in Whitman County... 4 Community Needs Assessment Survey... 7 Organizations Involved... 7 Survey Respondents Demographics... 7 Findings... 8 Overall Quality of Life... 8 Employment and Economic Development Health and Well-Being Food Security Housing Need for Services Services Needed in Community and by Household Conclusions and Recommendations References Appendix 1: Whitman County Demographic Information Appendix 2: Random Sample Respondent Demographics Appendix 3: Convenience Sample Respondent Demographics Appendix 4: Survey Methodology Final_2

4 About Whitman County The following data are from the American Community Survey (unless otherwise specified). Three Whitman County report areas are highlighted: Whitman County (all); Pullman; and non-pullman. Numbers from Washington State and the United States are also included for comparison purposes. Differentiating between Pullman and non-pullman Whitman County is important as shown in some of the data below. The demographics of the population of Pullman and non-pullman are, at times, extremely different and reflect the various, sometimes disparate needs of the populations in these two areas, and the difficulty in managing services that meet the needs of these communities. Population/Population Change Reported population change between the 2000 U.S. Census and 2013 ACS estimated population is shown in the below figure. There is a substantial increase in population in Pullman (+23.17%). This change is considerably higher than the population increase in Washington and more than double the population change in the United States. However, non-pullman Whitman County saw a decrease in population (-5.87%). Area Total Population Total Population (2000 U.S. Census) Population Change Percent Change Pullman 30,388 24, , % Non-Pullman 15,124 16, % Whitman County 45,512 40, , % Washington 6,819,579 5,894, , % United States 311,536, ,421, ,114, % Population Density The difference in population density between Pullman and non-pullman (3,076 people per square mile versus 7 people per square mile respectively) highlights the agricultural nature of the majority of Whitman County. The high population density in Pullman is likely attributed to Washington State University. Area Total Population Total Land Area in Sq. Miles Population Density per Sq. Mile Pullman 30, Non-Pullman 15,124 2, Whitman County 45,512 2, Washington 6,819,579 66, United States 311,536,591 3,531, Population Demographics A complete breakdown of the population demographics of Whitman County can be found in Appendix 1. Final_3

5 Age and Gender Demographics Population numbers and percentages by age and gender are shown below for the Pullman, non- Pullman, and Whitman County areas. Pullman has a greater percentage of year olds for both males and females. This is undoubtedly due to the high concentration of WSU students in Pullman. Non-Pullman Whitman County has a substantially higher percentage of the population who are 64 and older. The gender ratio is very similar across the board: approximately 49.5% female, 51.5% male. Race Demographics There is a substantial difference in the racial make-up of Pullman and non-pullman Whitman County. While both areas are predominately Caucasian, Pullman has a much higher percentage of non-caucasian residents (approximately 20% compared to less than 5% in non-pullman areas). Whitman County has a lower percentage of African Americans and a higher percentage of Asian Americans than the state of Washington and the United States. Ethnicity Demographics As with the race demographics, Pullman has a greater proportion of residents who identify as Hispanic. Pullman, non-pullman, and Whitman County have a much lower percentage of the population who identify as Hispanic than in Washington or the U.S. as a whole. Veterans Demographics (Age and Gender) 5.55% of Pullman residents identify as veterans, lower than the national average. However, non- Pullman Whitman County has a higher percentage of veterans than the national average (9.88% and 6.83% respectively). Overall, Whitman County is home to over 2,500 veterans. Educational Attainment Educational attainment is calculated for persons 25 and over. Pullman has a substantially higher percentage of Bachelors (31.6%) and Graduate/Professional degrees (30.1%) compared to the national average (18.1% and 10.8% respectively) and a substantially lower percentage of high school only (12.0% vs. 28.1%) or no high school diploma (3.4% vs %). Non-Pullman Whitman County is fairly consistent with national averages. Poverty in Whitman County Poverty in Whitman County is a highly discussed topic. As of 2015, Whitman County had the highest poverty rate in Washington State. A substantial portion of those in poverty in Whitman County, particularly in the city of Pullman, are college students. While college students residing with parents or relatives and those residing in college dormitories are not included in official poverty rate calculations, those living off-campus are. A 2013 report by Alemayehu Bishaw examined the effect of off-campus college students on poverty rates across the nation. Bishaw excluded offcampus college students (defined as those reporting being enrolled in a college or university within the last three months) from the poverty rate calculation. This exclusion of college students substantially reduces the poverty rate in Pullman from 44.8% to 20.9% and reduces the Whitman County poverty rate to 16.7% (the exclusion of off-campus college students has no perceptible impact on non-pullman poverty rates). Final_4

6 The Bishaw (2013) report and the below figure illustrate the concentration of extremely high rates of poverty in three census tracts located within the Pullman city limits (darkest blue shading). These three census tracts also have a high concentration of college student housing. The persons living in these census tracts are likely to have a different poverty experience than those living in poverty elsewhere in the county. This should not discount the well documented negative impacts that poverty can have for all persons, college students or otherwise. However, it does suggest that the services needed by these persons in poverty may be very different than those living in poverty throughout the county. Area Total Population (1) Population in Poverty (1) % Population in Poverty (1) % Non-Student Population in Poverty (2) Pullman 24,338 10, % 20.9% Non-Pullman 14, % -- Whitman County 39,170 12, % 16.7% Washington 6,686, , % -- United States 303,692,064 46,663, % -- (1) 2013 American Community Survey (2) Bishaw 2013 Percent Poverty by Census Tract in Whitman County % Poverty % % % % It is important to note, students do not make up the entire population in poverty and, as with the rest of the nation, poverty is not equally distributed among family types. In particular, femaleheaded households are at extreme risk of poverty. Within Whitman County, 40% of those in poverty have female-headed households (37% in non-pullman and 51% in Pullman). Each of these poverty rates are above the state and national averages. Area Poverty Rate All Types % Poverty Married Couples % Poverty Female Head of Household Pullman 17.8% 11.6% 51.0% Non-Pullman 9.05% 5.7% 37.37% Whitman County 13.3% 8.4% 40.5% Washington 9.0% 4.6% 28.2% United States 11.3% 5.6% 30.6% Final_5

7 Poverty is also unequally distributed by age. Seniors (and children) tend to be more vulnerable to being in poverty. Given the high concentration of people aged 65 and up in Whitman County, this is a population service providers must account for in program design. For this category, Whitman County has poverty rates that are slightly lower than the state and national average. However, when broken into Pullman and non-pullman areas, Pullman s senior poverty rate is higher than the state and national average, while non-pullman s is lower. Area Seniors Total Seniors in Poverty Senior Poverty Rate Pullman 1, % Non-Pullman 2, % Whitman County 3, % Washington 851,875 66, % United States 40,544,640 3,793, % Final_6

8 Community Needs Assessment Survey In conjunction with the Social and Economic Sciences Research Center, the Community Action Center, Pullman Regional Hospital, and other stakeholder agencies (see below, Organizations Involved ), an extensive survey was created about life in Whitman County. The survey contained 266 questions about respondents quality of life, economic development, employment, health, housing, food security, and use of social services. An online and a paper/pencil version of the final questionnaire were developed. Appendix 4 details the methodology for the random and convenience samples. Organizations Involved The Social and Economic Sciences Research Center designed, distributed, and collected the data from this questionnaire. In addition, a multitude of organizations took part in the development and implementation of this questionnaire. The support of the following organizations was invaluable and greatly appreciated: Cost Sharing Organizations - Pullman Regional Hospital - Community Action Center in Pullman - Council on Aging and Human Services in Colfax - Palouse Alliance for Healthy Individuals, Families, and Communities - Palouse River Counseling - Pullman School District - Pullman United Way - Whitman County Public Health - Washington State University Center for Civic Engagement Other Organizations Involved - Family Promise of the Palouse - Alternatives to Violence of the Palouse - Whitman Hospital and Medical Center - Friends of Hospice - BOOST Collaborative - City of Colfax - City of Palouse - City of Pullman - Washington State Department of Social and Health Services Survey Respondents Demographics Each survey respondent was asked to respond to a series of questions asking about their demographics. In comparing the random sample demographics (shown in Appendix 2), the respondents match fairly well with the 2013 American Community Survey percentages. This was expected as the random sampling procedures were designed to produce a representative look at people living within the area. Sex of respondents is the only category in the random sample where respondents did not match the ACS data. However, this is not surprising as research has shown that females are more likely to respond to surveys than males. Final_7

9 The convenience sample demographics (shown in Appendix 3) are fairly representative as well. However, there are a few areas where the differences between the 2013 American Community Survey and the respondent demographics are more pronounced. Given the sampling procedures, the results from the convenience sample can only be generalized to the respondents who took the survey. However, valuable information can still be gained from the convenience sample, as it emphasizes issues in the community and the need for some services, as discussed later. Findings The results presented in this report highlight key findings and/or overall trends from the random sample and convenience sample data. As such, not all questions asked in the survey are represented in this report. A full report, containing all aggregated responses, will be available separately at a later date. Tables, Figures, and Graphs with the abbreviation RS in the title denote data from the Random Sample. CS denotes data from the Convenience Sample. Conclusions made from the random sample are generalizable to the rest of Whitman County residents. However, conclusions made from the convenience sample are not generalizable to the rest of Whitman County. The CS results are only applicable to those who completed the survey in the convenience sample. Given the importance of place of residence to this study, only responses that contained information about the respondent s place of residence were included in this analysis. The final sample size for the random sample was 346 respondents and the convenience sample contained 618 respondents. In addition, as many health and social service agencies serve low-income respondents, average household monthly income was used to generate a low-income category of respondents. Respondents who reported having a monthly household income less than $2,000 were considered to be low-income. While this does not take into account the number of individuals in a household (an essential component of the federal poverty line), households who fall into this categorization are almost certain to be below the poverty line. A single person household with an annual income of less than $12,000 (or $1,000 a month) is considered to be below the poverty line. Indeed, it is likely there are households who are not in this category that do fall below the federal poverty line. However, household size information was not consistently reported in either sample, making an approximate variable necessary. Overall Quality of Life Respondents were asked a series of questions about their overall quality of life, state of their finances, and their overall health compared to the previous year. In addition, respondents answered questions about their community and neighborhood quality. Overall, people in Whitman County report they are doing well. The majority of respondents in both the random and convenience samples reported that their overall quality of life was good or excellent. However, when asked about their health and finances compared to the previous year, low income respondents more frequently reported that their finances and health were worse than last year, particularly those living outside of Pullman. This is a recurring theme throughout this study: low income residents are more likely to encounter difficulties and living outside of Pullman seems to compound those difficulties. Final_8

10 For example, low-income residents of Whitman County were less likely to rate their overall quality of life as excellent and more likely to rate their overall quality of life as fair. In particular, lowincome residents outside of Pullman were more likely to rate their overall quality of life as poor or very poor. However, the majority of Whitman County residents rated their overall quality of life as good or excellent. Final_9

11 The majority of Whitman County residents reported their quality of life was about the same or better compared to a year ago. However, low-income residents in all areas across the county more frequently reported their quality of life as somewhat worse or much worse than the past year. Final_10

12 Low-income residents, non-pullman residents, and in particular, low-income non-pullman residents more frequently reported their household s financial situation as worse than a year ago. 34% of non-pullman low-income residents reported a worsening financial situation in their household in the random sample. Final_11

13 A significant portion of low-income, non-pullman residents (23%) reported worse health than the past year and had a much smaller proportion of respondents reporting a similar or improved heath situation. However, all other categories of respondents primarily reported steady or improved health. - Final_12

14 Employment and Economic Development Questions about the respondents employment status, employer type, military service status, and benefits or public assistance were asked to gain an understanding of employment in Whitman County and to identify places for economic development. Whitman County has a higher than average number of veteran s compared to the rest of Washington State. In the random sample, 13% of respondents have served or are actively serving in the U.S. Armed Forces and 10% of respondents had members of their household who have served or are actively serving in the U.S. armed forces. A high percentage of those living outside of Pullman are retired (approximately 45%), with lowincome respondents being slightly more likely to be retired than non-low-income respondents. Pullman low-income respondents were more likely to be employed part-time or not employed than non-low-income Pullman respondents. Pullman respondents were also primarily employed in two sectors: for-profit and state government. This is likely due to the presence of Washington State University (state government) and Schweitzer Engineering Laboratories (for-profit) as the larger employers in Pullman. Another finding of note is that 15% of low-income non-pullman respondents who received income from benefits or public assistance had their benefits reduced or stopped in the past year. Also, of those who are unemployed, 40% have been unemployed for less than a year, while 60% have been unemployed for more than a year. Final_13

15 80% 70% 60% 50% 40% 30% 20% 10% Employment Status by Residence & Income (CS) Which one of the following categories best describes your current employment status? Employed Full-Time Employed Part-Time Not Employed Retired 0% All Pullman Resident Low-Income Pullman Resident Non-Pullman Resident Low-Income Non-Pullman Resident Final_14

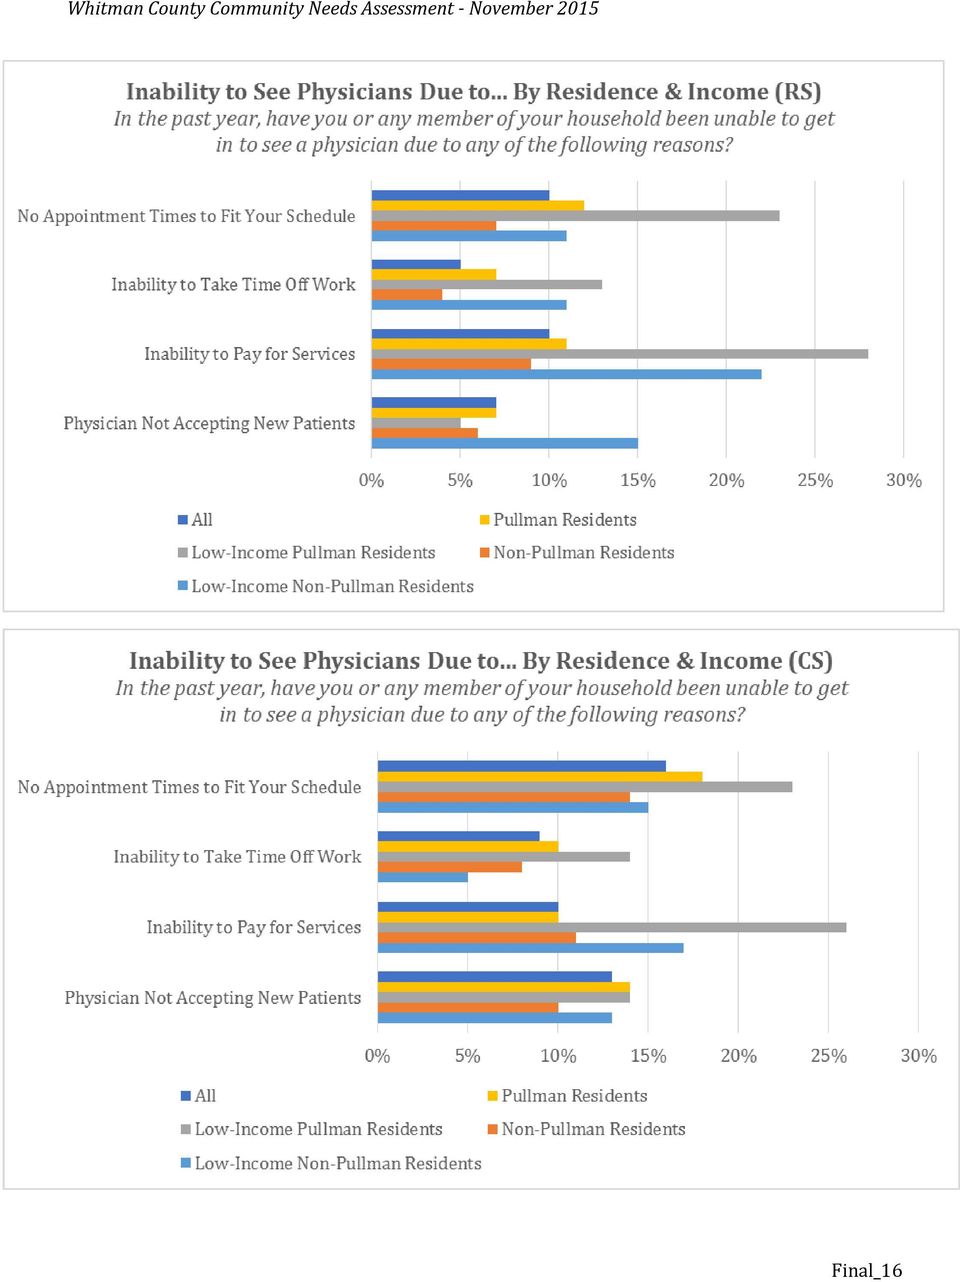
16 Health and Well-Being Questions about insurance coverage, access to health care, and most common health conditions reveal opportunities to increase service access. While 94-96% of residents are covered by a health insurance plan, only 85% of low-income non-pullman residents are covered by a health insurance plan in the random sample. In addition, 15% of households report someone in the household having a disability that limits one or more of their usual daily activities. Low income residents in both Pullman and non-pullman have more difficulty accessing physicians and indicated a lack of adequate access to medical care. A surprisingly high percentage of respondents across residence and income were unable to access preventative care in the past year (over 30%). While allergies were the most prevalent health condition (with 49% of households reporting at least one person within the household having allergies), the next most common health condition varied by residence and income: - Pullman: obesity - Pullman low-income: mental health - Non-Pullman: physical disability - Non-Pullman low-income: dental disease. The convenience sample respondents reported different health conditions, though mental health, obesity, and physical disabilities remain highly reported conditions. Final_15

17 Final_16
18 Final_17

19 Most Common Health Conditions in Households by Residence & Income (RS) Rank All Pullman Resident 1 Obesity Obesity (21%) (19%) 2 Asthma (16%) 3 Diabetes (16%) 4 Physical Disability (16%) 5 Dental Disease (14%) Low-Income Pullman Non-Pullman Resident Low-Income Non-Pullman Mental Health Physical Dental Disease (21%) Disability (30%) (22%) Asthma (18%) Obesity (18%) Diabetes (21%) Physical Disability (26%) Diabetes (12%) Asthma (15%) Dental Disease (17%) Mental Health (19%) Mental Health Dental Disease Obesity (17%) Diabetes (15%) (12%) (13%) Dental Disease (11%) Behavioral Issues (10%) Asthma (14%) Obesity (15%) Most Common Health Conditions in Households by Residence and Income (CS) Rank All Pullman Resident 1 Obesity Obesity (28%) (30%) 2 Asthma (25%) 3 Mental Health (17%) 4 Dental Disease (14%) 5 Diabetes (14%) Asthma (27%) Mental Health (18%) Dental Disease (12%) Diabetes (11%) Low-Income Pullman Mental Health (30%) Obesity (28%) Asthma (23%) Dental Disease (21%) Physical Disabilities (14%) Non-Pullman Resident Asthma (22%) Physical Disability (19%) Diabetes (19%) Dental Disease (17%) Mental Health (15%) Low-Income Non-Pullman Physical Disability (41%) Obesity (33%) Dental Disease (25%) Mental Health (22%) Special Needs (22%) Final_18
 Asthma (14%) Obesity (15%) Most Common Health Conditions in Households by Residence and Income (CS) Rank All Pullman Resident 1 Obesity Obesity (28%) (30%) 2 Asthma (25%) 3 Mental Health (17%)")
20 Food Security A substantial proportion of low-income residents in both Pullman and non-pullman reported being concerned about having enough food for their family. 10% of low-income Pullman and 19% of lowincome non-pullman residents reported going hungry in the last year because they were not able to get enough food. The most common source of food assistance was the food bank (9% of all respondents in the random sample). However, food banks are heavily relied on by low-income residents: in non- Pullman, 33% of respondents (compared to 55% in the convenience sample) and 22% of lowincome respondents from Pullman in the convenience sample. Other sources of food include: family or friends, senior center meals, Meals on Wheels program, and churches or faith community members. About 30% of the respondents said they would be somewhat likely or very likely to use a public or community garden if it was available to them. This percentage was higher among the low-income residents of Pullman, with 59% responding they would be somewhat or very likely to use a public or community garden. Final_19
 and 22% of lowincome respondents from Pullman in the")
21 Housing Low-income Pullman respondents were the most likely group to be living in apartments (affected by WSU student status). The majority of other respondents lived in houses, though the rates vary slightly by place of residence. Final_20
22 In the random sample, no respondents reported having their place of residence in foreclosure. A small percentage (1-2%) of respondents were one or more months behind in their rent or house payment. These percentages were similar in the convenience sample, with the exception of having less than 1% of respondents whose place of residence was in foreclosure. A small percentage of respondents (less than 1%) reported being homeless in the last three years in the random sample. A slightly large percentage of respondents in the convenience sample report being homeless in the last three years (2-3%). Respondents were also asked about internet access in their home. As many services require internet access, an understanding of availability of internet access is important. Internet access in Pullman is higher than the state and national averages. However, low-income, non-pullman residents have lower than average internet access. Internet Access in the Random Sample Convenience Sample Residence % Yes % No % Yes % No All 90% 10% 95% 5% Low Income 87% 10% 88% 11% Pullman 95% 5% 96% 3% Low-Income Pullman 97% 3% 95% 2% Non-Pullman 84% 15% 92% 8% Low Income Non-Pullman 74% 22% 82% 18% Area % Yes % No Washington 79.99% 20.01% United States 74.4% 25.6% Final_21
23 Need for Services Transportation In the random sample, 8% of respondents expressed difficulty finding transportation to access services, with 30% of low-income non-pullman residents expressing difficulty. Services Accessed A count of the services indicated as being accessed by a household in the past year was used to determine how many different types of services were accessed per household. This does not indicate how many times a particular service was used only if it was used at least once. Number of Services Accessed per Household in the Past Year by Residence & Income (RS) Accessed 1 or 2 Accessed 3 or More No Services Accessed Total Services Services All 70 20% 17 5% % 346 Low Income 16 24% 5 7% 47 69% 68 Pullman 41 21% 5 3% % 197 Low-Income 8 21% 2 5% 29 74% 39 Pullman Non-Pullman 29 21% 11 8% % 140 Low Income Non-Pullman 8 30% 3 12% 16 59% 27 Number of Services Accessed per Household in the Past Year by Residence & Income (CS) Accessed 1 or 2 Accessed 3 or More No Services Accessed Total Services Services All % 56 9% % 618 Low Income 30 26% 32 27% 55 47% 117 Pullman 77 21% 29 8% % 359 Low-Income 13 23% 15 26% 29 51% 57 Pullman Non-Pullman 48 19% 27 10% % 259 Low Income Non-Pullman 7 28% 17 28% 26 43% 60 Services Needed in Community and by Household Respondents were also asked to identify social service needs for both their community and their own household. Access to affordable dental care was the primary need identified in almost every case, pointing to an extreme need for affordable dental care across Whitman County. Access to affordable medical care and childcare were also commonly cited needs. For non-pullman respondents, and particularly for non-pullman low-income respondents, transportation, help with heating/utility bills, and access to nutritious food are social service needs. For Pullman low-income Final_22
24 respondents, mortgage/rental assistance and access to nutritious food are frequently cited as needed social services. The following four tables are particularly clear examples of different needs across Whitman County. Additional analyses (not included in this report), examining the needs of the student and nonstudent population in Whitman County, were also run. Contrary to expectations, the identified social service needs of students and non-students had few differences. Affordable dental care, medical care, and childcare were primary needs, as well as assistance with heating/utility bills and mortgage/rental assistance. Final_23
25 Top 10 Identified Needs Within the Community by Residence & Income (RS) Rank All % Pullman % Low-Income Pullman 1 Affordable Dental 65% Affordable Dental 72% Affordable Dental 2 Affordable Medical 63% Affordable Medical 71% Affordable Medical 3 Affordable Child 63% Affordable Child 68% Affordable Child 4 Transportation 57% Drug/alcohol 66% Drug/alcohol treatment and/or treatment and/or 5 Food (help getting enough food) 6 Drug/alcohol treatment and/or 7 Mental health services/family 8 Help with heating, water, and/or utility bills 56% Mental health services/family 56% Help finding a job/living wage job 54% Food (help getting enough food) 53% Family violence advocacy/ treatment/ 62% Help finding a job/living wage job 61% Family violence advocacy/ treatment/ 61% Food (help getting enough food); % Non-Pullman % Low-Income Non-Pullman 69% Affordable Dental 72% Affordable Dental 69% Affordable Child 68% Affordable Medical 62% Transportation 56% Food (help getting enough food); 62% Affordable Medical 54% Mortgage/Rental Assistance 59% Help with heating, 54% Help with heating, water, and/or water, and/or utility bills utility bills 56% Food (help getting enough food) 54% Help finding a job/living wage job 61% Transportation; Drug/alcohol treatment and/or Family Planning 9 10 Legal Help Family violence advocacy/ treatment/ 51% 51% Legal Help Transportation 60% 58% Mental health services/family 51% Mortgage/Rental Assistance; Mental Health Services; Preschool Educ. 51% Affordable Child ; 47% Mental health services/family 45% Transportation; 44% Drug/alcohol treatment and/or ; Help finding a job/living wage job % 63% 52% 44% 41% 37% 33% Final_24
26 Top 10 Identified Services Needs Within the Household by Residence & Income (RS) Single category of need is a combination of slight, moderate, and strong need categories Much lower percentage of respondents identified a need in their own household (compared to needs in the community) Rank All % Pullman % Low-Income Pullman % Non-Pullman % Low-Income Non-Pullman 1 Affordable Dental 37% Affordable Dental 38% Affordable Dental 56% Affordable Dental 37% Affordable Dental 2 Affordable Medical 32% Access to Library 36% Affordable Medical 54% Access to Library 26% Help with heating, System System water or utility bill 3 Access to library 31% Affordable Medical 35% Mortgage/Rental 31% Affordable Medical 24% Affordable Medical services Assistance 4 Legal Help 20% Legal Help 20% Food (help getting 28% Legal Help 19% Access to Library enough food) System 5 Help finding a 15% Help finding a 17% Mental health 26% Help with heating, 16% Food (help getting job/living wage job job/living wage job services/family water or utility bill enough food) 6 Mental health 14% Mental health 16% ; Transportation; 14% Help buying fuel services/family services/family for transportation 7 Food (help getting enough food) 12% Mortgage/Rental Assistance Help finding a Food (help getting 14% job/living wage enough food) Mortgage/Rental job; Assistance; % 63% 48% 44% 33% 30% 26% 22% Access to Library System 8 Help with heating, 12% Food (help getting 11% Help with heating, 21% Help finding a water or utility bill enough food) water or utility bill job/living wage job 9 Mortgage/Rental 12% Affordable Child 10% Help buying fuel 18% Mental health Assistance ; for transportation services/family 10 Transportation 11% Transportation Legal Help 15% Help buying fuel for transportation 13% 12% 11% Legal Help; Mental health services/family ; Help finding a job/living wage job Final_25
27 Top 10 Identified Needs Within the Community by Residence & Income (CS) Rank All % Pullman % Low-Income Pullman % Non-Pullman % Low-Income Non-Pullman 1 Affordable Child 80% Affordable Child 80% Food (help getting 77% Affordable Child 81% Affordable Dental enough food); ; 2 Affordable Dental 75% Food (help getting 78% Affordable Dental 74% ; enough food) Transportation Affordable Medical 3 Food (help getting Affordable Medical 76% Affordable Dental 75% Food (help getting 70% Food (help getting enough food) ; ; enough food); enough food); % 82% 80% 4 Affordable Medical 73% Affordable Dental ; Affordable Medical ; Affordable Medical Help with heating, water, and/or utility bills 78% 5 Mental health services/family ; 71% Mental health services/family Affordable Child Help finding a job/living wage job 69% Affordable Child 77% 6 Drug/alcohol 72% Mental health 73% Transportation 68% Help finding a 75% Help finding a treatment and/or services/family job/living wage job job/living wage job ; 7 Transportation 69% Family violence 70% Help with heating, 66% Transportation 72% Help finding a advocacy/ water, and/or job/living wage job treatment/ utility bills 8 Drug/alcohol treatment and/or 68% Family violence advocacy/ treatment/ 71% Drug/alcohol treatment and/or ; 68% Mental health services/family 9 Help with heating, water, and/or utility 67% Transportation 70% Preschool Education Drug/alcohol treatment and/or bills; 10 Preschool 69% Legal Help; Family violence Education Help with bills; advocacy/treatment Help finding a job: / Family Planning 64% Parenting Support 70% 63% Mental health services/family 67% Drug/alcohol treatment; Family violence advocacy 68% 67% Final_26
28 Top 10 Identified Services Needs Within the Household by Residence & Income (CS) Single category of need is a combination of slight, moderate, and strong need categories. Much lower percentage of respondents identified a need in their own household (compared to needs in the community). Rank All % Pullman % Low-Income Pullman 1 Affordable Dental 35% Affordable Medical 35% Affordable Dental ; ; 2 Affordable Medical Affordable Medical Affordable Dental ; 3 Access to library 33% Help with heating, services Access to Library water or utility bill System 4 Mental health 18% Mental health 21% Mortgage/Rental services/family services/family Assistance ; 5 Affordable Child 20% Food (help getting % Non-Pullman % Low-Income Non-Pullman 56% Affordable Dental 36% Affordable Dental 47% Affordable Medical 35% Affordable Medical bill 42% Access to Library System 29% Food (help getting enough food) 40% Legal Help 22% Help with heating, water or utility 39% Help with heating, 17% Mortgage/Rental 35% Legal Help enough food) water or utility bill Assistance 6 Affordable Child 17% Mortgage/Rental 16% Mental health 37% Mental health 14% Help buying fuel 33% Assistance services/family services/family for transportation; ; 7 Help with heating, 15% Legal Help; 15% Access to Library 33% Access to library water or utility bill; System Mortgage/rental system 8 Transportation Transportation 32% assistance; Legal Help 30% Mortgage/Rental Assistance Help buying fuel for transportation 9 Transportation; 14% Parenting Support; 14% Help buying fuel 28% Help finding a 13% Transportation 28% for transportation job/living wage 10 Help finding a Help finding a Legal Help 25% job; Help finding a 25% job/living wage job job/living wage job job/living wage job Transportation % 53% 48% 45% 42% Final_27
29 Conclusions and Recommendations There is a multitude of conclusions and insights to be drawn from this report, and the wealth of data drawn from responses to the questionnaire will be useful to health and social service agencies in Whitman County. Initial review of the responses indicates there are five areas for improvement that stand out: 1) Extreme need for affordable dental care: Affordable dental care was reported as the highest need within households and communities across both random and convenience samples and across income and other demographic groupings. Currently in Whitman County, there is a large gap in affordable coverage, particularly for low-income, non- Pullman residents and patients with Medicaid coverage only. 2) Transportation to services: A substantial proportion of respondents reported having difficulty finding transportation to services, particularly those living outside of Pullman. While some transportation infrastructure exists outside of Pullman, it is limited and may be creating a barrier to accessing services for some. 3) Access to nutritious food: Between the number of residents who reported concern about having enough food for their family, those who reported going hungry in the past year, and those who would utilize community gardens if access was available, access to nutritious food continues to be an area needing growth. 4) Access to preventative care. A surprising percentage of respondents reported not being able to access preventative health care services in the past year. While medical services have expanded in the past year (notably the creation of a free clinic in Pullman), there appears to be a gap in medical coverage access when it comes to preventative care. 5) Access to social services for low-income non-pullman residents: Throughout this report, there is a multitude of examples where low-income non-pullman residents are at a significant disadvantage for accessing all types of social services. Thus, it is clear that working towards extending/improving social service access for those in the more rural parts of Whitman County should be a topic of concern for all community members and social service agencies. Final_28
30 References American Community Survey ( Bishaw, Alemayehu Examining the Effect of Off-Campus College Students on Poverty Rates. U.S. Census Bureau, Social, and Economic & Housing Statistics Division, Poverty Statistics Branch. Social and Economic Sciences Research Center. 2015a. Whitman County Health and Social Service Needs Assessment (Scientific Sample). Social and Economic Sciences Research Center. 2015b. Whitman County Health and Social Service Needs Assessment (Convenience Sample) U.S. Census ( U.S. Census Bureau. American FactFinder ( Final_29
31 Appendix 1: Whitman County Demographic Information Age and Gender Demographics Population numbers and percentages by age and gender are shown below for the Pullman, non- Pullman, and Whitman County areas. Pullman has a greater percentage of year olds for both males and females. This is undoubtedly due to the high concentration of WSU students in Pullman. Non-Pullman Whitman County has a substantially higher percentage of their population who are 64 and older. The gender ratio is very similar across the board: approximately 49.5% female to 51.5% male. Area 0 4 % of Pop % of Pop % of Pop. 64+ % of Pop. Male Male Male Male Pullman % % 13, % % Non-Pullman % 1, % 4, % 1, % Whitman County % 2, % 17, % 1, % Washington 226, % 585, % 2,198, % 350, % Area 0 4 % of Pop % of Pop % of Pop. 64+ % of Pop. Female Female Female Female Pullman % % 12, % % Non-Pullman % 1, % 4, % 1, % Whitman County 1, % 2, % 16, % 2, % Washington 215, % 558, % 2,164, % 479, % Area 0 4 % of Pop % of Pop % of Pop. 64+ % of Pop. Total Total Total Total Pullman % % 25, % % Non-Pullman % % % % Whitman County 1, % 4, % 34, % 4, % Washington 441, % 1,143, % 4,363, % 830, % Area Median Male % of Pop. Female % of Pop. Age Total Total Pullman , % 15, % Non-Pullman , % 7, % Whitman County , % 22, % Washington ,360, % 3,418, % Race Demographics There is a substantial difference in the racial make-up of Pullman and non-pullman Whitman County. While both areas are predominately Caucasian, Pullman has a much higher percentage of non-caucasian residents (approximately 20% compared to less than 5%). Whitman County has a Final_30
32 lower percentage of African Americans and a higher percentage of Asian Americans than the state of Washington and the United States. Area Caucasian % of Pop. African % of Pop. American % of Pop. American Indian Pullman 24, % % % Non-Pullman 14, % % % Whitman County 38, % % % Washington 5,350, % 245, % 94, % United States 230,592, % 39,167, % 2,540, % Area Asian % of Pop. Native % of Pop. Mixed Race % of Pop. Hawaiian Pullman 3, % % 1, % Non-Pullman % % % Whitman County 3, % % 1, % Washington 489, % 40, % 324, % United States 15,231, % 526, % 8,732, % Ethnicity Demographics As with the race demographics, Pullman has a greater proportion of residents who identify as Hispanic. Pullman, non-pullman, and Whitman County have a much lower percentage of the population who identify as Hispanic than in Washington or the U.S. as a whole. Area Hispanic % of Pop. Pullman 1, % Non-Pullman % Whitman County 2, % Washington 783, % United States 51,786, % Veterans Demographics (Age and Gender) 5.55% of Pullman residents identify as veterans, lower than the national average. However, non- Pullman Whitman County has a higher percentage of veterans than the national average. Area Veterans % of Pop. Veterans % of Pop. Veterans % of Pop. Total Male Female Pullman 1, % % % Non-Pullman % % % Whitman County 2, % 2, % % Washington 582, % 532, % 50, % United States 21,263, % 19,709, % 1,554, % Final_31
33 Area Veterans, % of Pop. Veterans, % of Pop. Age Age 64+ Pullman % % Non-Pullman % % Whitman County 1, % 1, % Washington 353, % 228, % United States 10,719, % 9,286, % Educational Attainment Education attainment is calculated for persons aged 25 and over. Pullman has a substantially higher percentage of Bachelors and Graduate/Professional degrees compared to the national average, with a substantially lower percentage of high school only or no high school diploma. Non-Pullman Whitman County is fairly consistent with national averages. Area % No High School Diploma % High School Only % Some College/ A.A. Degree % Bachelor s Degree % Graduate/ Professional Degree Pullman 3.4% 12.0% 23.1% 31.6% 30.1% Non-Pullman 5.3% 28.3% 38.3% 18.5% 8.8% Whitman County 3.78% 18.5% 28.8% 26.1% 22.8% Washington 9.98% 23.6% 34.6% 20.4% 11.5% United States 13.98% 28.1% 29.1% 18.1% 10.8% Final_32
34 Appendix 2: Random Sample Respondent Demographics Note: Demographic totals may not add up to 100% due to non-response Random Sample Group Number of Male Total % of Pop. Female Total % of Pop. Respondents All Respondents % % Low Income % % Pullman % % Non-Pullman % % Pullman, Low Income % % Non-Pullman, Low Income % % Student % % Non-Student % % Random Sample Group Caucasian % of Pop. African % of Pop. American % of Pop. American Indian All Respondents % % % Low Income % % % Pullman % % % Non-Pullman % % % Pullman, Low Income % % % Non-Pullman, Low Income % % % Student % % Non-Student % % Random Sample Group Asian % of Pop. Native % of Pop. Other % of Pop. Hawaiian All Respondents % 0 0% % Low Income % 0 0% % Pullman % 0 0% % Non-Pullman % 0 0% % Pullman, Low Income % 0 0% % Non-Pullman, Low Income % 0 0% % Student % 0 0% % Non-Student % 0 0% % Random Sample Group Hispanic % of Pop. Hispanic % of Pop. (Self) (In Household) All Respondents % % Low Income % % Pullman % % Non-Pullman % % Pullman, Low Income % % Non-Pullman, Low Income % % Student % % Non-Student % % Final_33
35 Random Sample Group No High School % of Pop High School % of Pop Diploma Only All Respondents % % Low Income % % Pullman % % Non-Pullman % % Pullman, Low Income % % Non-Pullman, Low Income % % Student % % Non-Student % % Random Sample Group Some College / % of Pop Bachelor s % of Pop A.A. Degree Degree or More All Respondents % % Low Income % % Pullman % % Non-Pullman % % Pullman, Low Income % % Non-Pullman, Low Income % % Student % % Non-Student % % Random Sample Group Internet Access % of Pop No Internet % of Pop Access All Respondents % % Low Income % % Pullman % % Non-Pullman % % Pullman, Low Income % % Non-Pullman, Low Income % % Student % % Non-Student % % Final_34
36 Appendix 3: Convenience Sample Respondent Demographics Note: Demographic totals may not add up to 100% due to non-response Convenience Sample Group Number of Male Total % of Pop. Female Total % of Pop. Respondents All Respondents % % Low Income % % Pullman % % Non-Pullman % % Pullman, Low Income % % Non-Pullman, Low Income % % Student % % Non-Student % % Convenience Sample Group Caucasian % of Pop. African % of Pop. American % of Pop. American Indian All Respondents % % % Low Income % % % Pullman % % % Non-Pullman % % % Pullman, Low Income % % % Non-Pullman, Low Income % % % Student % % % Non-Student % % % Convenience Sample Group Asian % of Pop. Native % of Pop. Other % of Pop. Hawaiian All Respondents % % % Low Income % % % Pullman % % % Non-Pullman % % % Pullman, Low Income % % % Non-Pullman, Low Income % % % Student % % % Non-Student % % % Convenience Sample Group Hispanic % of Pop. Hispanic % of Pop. (Self) (In Household) All Respondents % % Low Income % % Pullman % % Non-Pullman % % Pullman, Low Income % % Non-Pullman, Low Income % % Student % % Non-Student % % Final_35
37 Convenience Sample Group No High School % of Pop High School % of Pop Diploma Only All Respondents % % Low Income % % Pullman % % Non-Pullman % % Pullman, Low Income % % Non-Pullman, Low Income % % Student % % Non-Student % % Convenience Sample Group Some College / % of Pop Bachelor s % of Pop A.A. Degree Degree or More All Respondents % % Low Income % % Pullman % % Non-Pullman % % Pullman, Low Income % % Non-Pullman, Low Income % % Student % % Non-Student % % Convenience Sample Group Internet Access % of Pop No Internet % of Pop Access All Respondents % % Low Income % % Pullman % % Non-Pullman % % Pullman, Low Income % % Non-Pullman, Low Income % % Student % % Non-Student % % Final_36
38 Appendix 4: Survey Methodology Random Sample The study population for this survey included the estimated 38,035 adults living in Whitman County during the winter months of A random sample of 1,500 addresses, from across the county was drawn from the United States Postal Service database of active mailing addresses (SESRC 2015a). Respondents were first sent information about accessing the questionnaire via the web, with follow-up reminders and a paper copy of the questionnaire sent to non-responding households (see timeline below). Random Sample Timeline February 12, 2015 February 25, 2015 March 6, 2015 April 1, 2015 Invitation describing the study and instructions on how to access the survey online with their assigned ID number was mailed to residences Reminder postcard was mailed to all non-responding households Reminder letter and paper/pencil copy of questionnaire (and return envelope) was mailed to non-respondents Final reminder postcard sent to non-respondents The response rate is the ratio of completed and partially completed questionnaires to the total eligible survey group For the random sample, 369 out of 1,500 households completed or partially completed the survey resulting in a 24.6% response rate (SESRC 2015a). This response rate far exceeded expectations, and over half the respondents completed the survey on the web (see below). Random Sample Frequency Percent Completed survey on web % Partially completed survey on web % Completed mail survey (paper) % Convenience Sample A convenience sample was also used to increase the information gained from the non-pullman portions of Whitman County, as well as from low-income respondents throughout Whitman County. Invitations to complete the survey online were given to people visiting various service organizations and events in Whitman County during the months of May and June of 2015 [after the random sample had been closed]. Paper versions of the survey were also made available. The results of this phase of the survey can only be examined in terms of the individuals who completed it and cannot be extended or generalized to any larger population (SESRC 2015b). Convenience Sample Frequency Percent Completed survey on web % Partially completed survey on web % Completed mail survey (paper) % Final_37
Demographic Analysis of the Salt River Pima-Maricopa Indian Community Using 2010 Census and 2010 American Community Survey Estimates
 Demographic Analysis of the Salt River Pima-Maricopa Indian Community Using 2010 Census and 2010 American Community Survey Estimates Completed for: Grants & Contract Office The Salt River Pima-Maricopa
Selected Socio-Economic Data. Baker County, Florida
 Selected Socio-Economic Data African American and White, Not Hispanic www.fairvote2020.org www.fairdata2000.com 5-Feb-12 C03002. HISPANIC OR LATINO ORIGIN BY RACE - Universe: TOTAL POPULATION Population
The New indicator of Minnesota - A SimpleYet Complex Idea
 J Minnesota will have sustainable, strong economic growth Previous wording: Minnesota will have sustained, above average, strong economic growth that is consistent with environmental protection 1990 1993
Neighborhood Checkup
 Promise Neighborhoods Research Consortium (PNRC) Neighborhood Checkup Survey of Current Supports for Successful Youth Development First, we are going to ask you a few questions about your. For this survey,
Custodial Mothers and Fathers and Their Child Support: 2011
 Custodial Mothers and Fathers and Their Child Support: 2011 Current Population Reports By Timothy Grall Issued October 2013 P60-246 IntroductIon This report focuses on the child support income that custodial
SELECTED POPULATION PROFILE IN THE UNITED STATES. 2013 American Community Survey 1-Year Estimates
 S0201 SELECTED POPULATION PROFILE IN THE UNITED STATES 2013 American Community Survey 1-Year Estimates Supporting documentation on code lists, subject definitions, data accuracy, and statistical testing
Customer Experience Survey Findings, 2014 Wisconsin s Publicly Supported Outpatient Substance Use Services
 Division of Mental Health and Substance Abuse Services Customer Experience Survey Findings, 2014 Wisconsin s Publicly Supported Outpatient Substance Use Services P-01059 (06/2015) TABLE OF CONTENTS INTRODUCTION
An Equity Profile of the Kansas City Region. Summary. Overview. The Equity Indicators Framework. central to the region s economic success now and
 An Equity Profile of the Kansas City Region PolicyLink and PERE An Equity Profile of the Kansas City Region Summary Overview Across the country, regional planning organizations, community organizations
Technical Report # 15-034. Submitted by: Danna Moore, Ph.D. Arina Gertseva, Ph.D.
 CIVIL LEGAL PROBLEMS EXPERIENCED BY VICTIMS OF DOMESTIC VIOLENCE AND SEXUAL ASSAULT IN WASHINGTON STATE Findings from 2014 Civil Legal Needs Study Update Technical Report # 15-034 Submitted by: Danna Moore,
Working Beyond Retirement-Age
 Working Beyond Retirement-Age Kelly A. Holder and Sandra L. Clark U.S. Census Bureau Housing and Household Economics Division Labor Force Statistics Branch Presented at the American Sociological Association
A Portrait of Seattle s Low-Income Working Population
 A Portrait of Seattle s Low-Income Working Population December 2011 Support provided by the City of Seattle Office of Economic Development 1 INTRODUCTION The Great Recession, now over two years gone, has
The goal is to transform data into information, and information into insight. Carly Fiorina
 DEMOGRAPHICS & DATA The goal is to transform data into information, and information into insight. Carly Fiorina 11 MILWAUKEE CITYWIDE POLICY PLAN This chapter presents data and trends in the city s population
Employment-Based Health Insurance: 2010
 Employment-Based Health Insurance: 2010 Household Economic Studies Hubert Janicki Issued February 2013 P70-134 INTRODUCTION More than half of the U.S. population (55.1 percent) had employment-based health
Race Matters. Household Asset Poverty by Race in North Carolina. Child Poverty by County
 Race Matters Children of color are more likely to grow up in both income poverty and asset poverty. This double burden creates a difficult barrier for children to overcome. As adults, children of color
Demographic Profile of Wichita Unemployment Insurance Beneficiaries Q2 2014
 Demographic Profile of Wichita Unemployment Insurance Beneficiaries Q2 2014 The Bureau of Labor Statistics defines an unemployed person as one 16 years and older having no employment and having made specific
Demographic Profile of Wichita Unemployment Insurance Beneficiaries Q3 2015
 Demographic Profile of Wichita Unemployment Insurance Beneficiaries Q3 2015 The Bureau of Labor Statistics defines an unemployed person as one 16 years and older having no employment and having made specific
A SNAPSHOT OF ALPENA COUNTY
 A SNAPSHOT OF ALPENA COUNTY agbioresearch.msu.edu msue.msu.edu About the Data This County Profile is to be used with the 2015-2016 Issue Identification process for State University Extension. Unless otherwise
The Health Insurance Marketplace in Iowa: The consumer perspective
 The Health Insurance in Iowa: The consumer perspective Final report to the Iowa Dept. of Public Health Peter Damiano* Suzanne Bentler* Daniel Shane* University of Iowa Public Policy Center* and College
Summary of Census Data Indicator Number Percentage People living below 100% of the poverty line
 OCCORD Policy Brief: Earnings, Poverty and Income in Orange County Analysis of Regional Data from the US Census Bureau 2007 American Community Survey August 26, 2008 I. Summary Summary of Census Data Indicator
THE PROFESSIONAL AND TECHNICAL WORKFORCE
 Fact Sheet 2013 THE PROFESSIONAL AND TECHNICAL WORKFORCE Introduction The professional and technical workforce is defined to include all workers in the U.S. Bureau of Labor Statistics (BLS) category management,
Demography. Focus on the three contributors to population change: Fertility, mortality, and migration
 1 Formal Demography Demography Focus on the three contributors to population change: Fertility, mortality, and migration Social Demography Focus on relationship between social, economic, and demographic
Demographic and Economic Profile. Mississippi. Updated May 2006
 Demographic and Economic Profile Mississippi Updated May 2006 Metro and Nonmetro Counties in Mississippi Based on the most recent listing of core based statistical areas by the Office of Management and
2012 Demographics PROFILE OF THE MILITARY COMMUNITY
 2012 Demographics PROFILE OF THE MILITARY COMMUNITY Acknowledgements ACKNOWLEDGEMENTS This report is published by the Office of the Deputy Assistant Secretary of Defense (Military Community and Family
Seattle Seniors. A Report prepared by the Seattle Office of Housing --- November 14, 2008
 Seattle Seniors A Demographic Tidal Wave: numbers / needs Affordable Housing: today / looking ahead Strategies: addressing a significant demographic shift A Report prepared by the Seattle Office of Housing
Iowa School District Profiles. Central City
 Iowa School District Profiles Overview This profile describes enrollment trends, student performance, income levels, population, and other characteristics of the Central City public school district. The
Recovery or Bust: Georgia s Poor Left Behind Melissa Johnson March 4, 2014. www.gbpi.org
 Recovery or Bust: Georgia s Poor Left Behind Melissa Johnson March 4, 2014 www.gbpi.org 1 50 th Anniversary of the War on Poverty in 2014 2 Why are Georgia s Poor Increasing in Number? 3 Agenda Who Georgia
Women, Wages and Work A report prepared by the UNC Charlotte Urban Institute for the Women s Summit April 11, 2011
 A report prepared by the UNC Charlotte Urban Institute for the Women s Summit April 11, 2011 A report prepared for the Women s Summit by the UNC Charlotte Urban Institute 1 Table of Contents Table of Contents...
HEALTH INSURANCE COVERAGE STATUS. 2009-2013 American Community Survey 5-Year Estimates
 S2701 HEALTH INSURANCE COVERAGE STATUS 2009-2013 American Community Survey 5-Year Estimates Supporting documentation on code lists, subject definitions, data accuracy, and statistical testing can be found
Access to Health Services
 Ah Access to Health Services Access to Health Services HP 2020 Goal Improve access to comprehensive, quality health care services. HP 2020 Objectives Increase the proportion of persons with a usual primary
New York State s Racial, Ethnic, and Underserved Populations. Demographic Indicators
 New York State s Racial, Ethnic, and Underserved Populations While much progress has been made to improve the health of racial and ethnic populations, and increase access to care, many still experience
Changes in Health Insurance Coverage in the Great Recession, 2007-2010 John Holahan and Vicki Chen The Urban Institute Executive Summary
 I S S U E P A P E R kaiser commission on medicaid and the uninsured Changes in Health Insurance Coverage in the Great Recession, 2007-2010 John Holahan and Vicki Chen The Urban Institute Executive Summary
Summary of 2011 AARP Survey of Virginians 18+: State Health Insurance Exchange Prepared by Jennifer H. Sauer State Research, AARP.
 Summary of 2011 AARP Survey of Virginians 18+: State Health Insurance Exchange Prepared by Jennifer H. Sauer State Research, AARP State health insurance exchanges are a provision of the new health law
Profile of Rural Health Insurance Coverage
 Profile of Rural Health Insurance Coverage A Chartbook R H R C Rural Health Research & Policy Centers Funded by the Federal Office of Rural Health Policy www.ruralhealthresearch.org UNIVERSITY OF SOUTHERN
HAWAI`I HEALTH SURVEY HHS INTRODUCTION 2002
 HAWAI`I HEALTH SURVEY HHS INTRODUCTION 2002 Hawai`i Department of Health Office of Health Status Monitoring Alvin T. Onaka, State Registrar, and Chief Brian Horiuchi, Supervisor Research & Statistics Honolulu,
Community Information Book Update October 2005. Social and Demographic Characteristics
 Community Information Book Update October 2005 Public Health Department Social and Demographic Characteristics The latest figures from Census 2000 show that 36,334 people lived in San Antonio, an increase
Who is making ends meet in the Portland region?
 Who is making ends meet in the Portland region? A profile of poverty and self-sufficiency among greater Portland families CC image courtesy of Holly Hayes on Flickr June 2015 Jamin Kimmell, M.U.R.P. Sheila
Highlights from State Reports to the National Youth in Transition Database, Federal Fiscal Year 2011
 Data Brief #1 Highlights from State Reports to the National Youth in Transition Database, Federal Fiscal Year 2011 September 2012 Background In 1999, Public Law 106-169 established the John H. Chafee Foster
Office for Oregon Health Policy and Research. Health Insurance Coverage in Oregon 2011 Oregon Health Insurance Survey Statewide Results
 Office for Oregon Health Policy and Research Health Insurance Coverage in Oregon 2011 Oregon Health Insurance Survey Statewide Results September 2011 Table of Contents Executive Summary... ii 2011 Health
JEFFREY A. LOWE, ESQ. Global Practice Leader - Law Firm Practice Managing Partner - Washington, D.C.
 JEFFREY A. LOWE, ESQ. Global Practice Leader - Law Firm Practice Managing Partner - Washington, D.C. TABLE OF CONTENTS Background... 4 The Survey... 4 Methodology... 5 Statistical Terms Used... 6 Key Findings...
Awareness of New Jersey s Family Leave Insurance Program Is Low, Even As Public Support Remains High and Need Persists
 NEW JERSEY S FAMILY LEAVE INSURANCE PROGRAM A CENTER FOR WOMEN AND WORK ISSUE BRIEF OCTOBER 2012 Awareness of New Jersey s Family Leave Insurance Program Is Low, Even As Public Support Remains High and
Racial and Ethnic Disparities in Women s Health Coverage and Access To Care Findings from the 2001 Kaiser Women s Health Survey
 March 2004 Racial and Ethnic Disparities in Women s Health Coverage and Access To Care Findings from the 2001 Kaiser Women s Health Survey Attention to racial and ethnic differences in health status and
Lake County. Government Finance Study. Supplemental Material by Geography. Prepared by the Indiana Business Research Center
 County Government Finance Study Supplemental Material by Geography Prepared by the Indiana Business Research www.ibrc.indiana.edu for Sustainable Regional Vitality www.iun.edu/~csrv/index.shtml west Indiana
The Status of Maryland s Children
 The Status of Maryland s Children Maryland has the highest median family income ($82,404) in the U.S. Families with children in Maryland have a median family income of $80,265. Yet, in 2007, over 10% of
Broome County Community Health Assessment 2013-2017 1 APPENDIX A
 Community Health Assessment 2013-2017 1 APPENDIX A 2 Community Health Assessment 2013-2017 Table of Contents: Appendix A A Community Report Card will be developed based on identified strengths and opportunities
Mental Health Professionals in Delaware, 2014
 Mental Health Professionals in Delaware, 2014 by Tibor Tóth, Ph.D. Center for Applied Demography & Survey Research Mental Health Professionals in Delaware 2014 prepared for Delaware Department of Health
Oklahoma county. Community Health Status Assessment
 Oklahoma county Wellness Score 2014 Community Health Status Assessment Mental and Social Health Overall Mental Health score The World Health Organization defines mental health as a state of well-being
BMA LIFE OUTCOMES DASHBOARD
 Leadership. Sustainability. Impact. BMA LIFE OUTCOMES DASHBOARD Developed by the Institute for Black Male Achievement, the BMA Life Outcomes Dashboard is a leading source of data on a select set of indicators
Fact Sheet: Unequal Opportunity Disparate Mortgage Origination Patterns for Women in the Chicago Area
 Fact Sheet: Unequal Opportunity Disparate Mortgage Origination Patterns for Women in the Chicago Area Introduction This fact sheet examines women s access to mortgages following the collapse of the housing
The NAIS Demographic Center 2013 Local Area Reports
 Page 1 of 9 The NAIS Demographic Center 2013 Local Area Reports CBSA : Los Angeles-Long Beach-Anaheim, CA Local Area Reports summarize key demographic changes for a specific geographic region, suggest
The Status of Women in Cumberland County, North Carolina
 IWPR #R366 January 2013 The Status of Women in Cumberland County, North Carolina Women in Cumberland County, and in North Carolina as a whole, have made significant progress during the last few decades,
2010 SURVEY OF 18+ REGISTERED VOTERS IN WASHINGTON ABOUT STATE SERVICES AND THE STATE BUDGET SURVEY-IN-BRIEF
 2010 SURVEY OF 18+ REGISTERED VOTERS IN WASHINGTON ABOUT STATE SERVICES AND THE STATE BUDGET AARP s Washington State Office commissioned this survey to explore the views of its 18+ registered voters about
Survey of Nurses 2012
 Survey of Nurses 2012 EXECUTIVE SUMMARY In 2012, the Michigan Center for Nursing conducted the ninth annual survey of nurses licensed in Michigan. The samples for this survey and previous surveys were
APPLICATION FOR FREE HOME REPAIRS
 APPLICATION FOR FREE HOME REPAIRS P.O. Box 641250 Chicago, IL 60664-1250 312.201.1188 fax 312.977.3805 www.rebuildingtogether-chi.com This application is the first step of the Rebuilding Together Metro
Salaries 2014. Analysis of the American Chemical Society's 2014 Comprehensive Salary and Employment Status Survey
 Salaries 2014 Analysis of the American Chemical Society's 2014 Comprehensive Salary and Employment Status Survey Prepared by: Steve and Clint Marchant Data Based Insights, Inc. on behalf of the ACS Department
Washington State 2014 Child Care Survey. June 2015 TECHNICAL REPORT 15-024. Child Care Rate and Resources in Washington State.
 TECHNICAL REPORT 15-024 Washington State 2014 Child Care Survey Child Care Rate and Resources in Washington State June 2015 Prepared for Washington State Department of Early Learning P.O. Box 40970 Olympia,
2013 Demographics PROFILE OF THE MILITARY COMMUNITY
 2013 Demographics PROFILE OF THE MILITARY COMMUNITY Acknowledgements ACKNOWLEDGEMENTS This report is published by the Office of the Deputy Assistant Secretary of Defense (Military Community and Family
County Demographics, Economy & Housing Market
 County Demographics, Economy & Housing Market County Demographics Palm Beach County is Florida's third most populous county with 7% of Florida's population. The county's total estimated population for
The National Survey of Children s Health 2011-2012 The Child
 The National Survey of Children s 11-12 The Child The National Survey of Children s measures children s health status, their health care, and their activities in and outside of school. Taken together,
CDPHP CAHPS 4.0 Adult Medicaid Health Plan Survey
 CAHPS 4.0 Adult Medicaid Health Plan Survey Continuous Quality Improvement Report February 2012 3975 Research Park Drive Ann Arbor, MI 48108 Table of Contents Background 1 Executive Summary 2 CAHPS 4.0
VETERANS INNOVATIONS PROGRAM APPLICATION
 VETERANS INNOVATIONS PROGRAM APPLICATION COUNTY: APPLICATION DATE: PROGRAM: Defenders Fund Individual Grant PERSONAL INFORMATION Full Name (last, first, middle) Social Security Number Phone Number Message
The Benefits of Community Service Employment (PY2006)
") The Benefits of Community Service Employment (PY2006) Prepared for Senior Service America, Inc. By The Charter Oak Group, LLC April 2008 The Benefits of Community Service The customer satisfaction data
The Benefits of Community Service Employment (PY2006) Prepared for Senior Service America, Inc. By The Charter Oak Group, LLC April 2008 The Benefits of Community Service The customer satisfaction data
The traditional work schedule for an
 A time to work: recent trends in work and flexible schedules Numerous U.S. workers have work schedules different from the standard 9 a.m.-to-5 p.m., Monday-through-Friday, work ; the demands of the industry
RESULTS FROM HIGH SCHOOL EXIT SURVEYS 5/6/2015 SYSTEM PLANNING AND PERFORMANCE PORTLAND PUBLIC SCHOOLS HIGHLIGHTS
 RESULTS FROM HIGH SCHOOL EXIT SURVEYS 5/6/2015 HIGHLIGHTS The majority of PPS high school seniors plan to graduate and to enroll in some type of higher education. Historically underserved racial groups
Welcome & Introductions. A Study of Population Health. What Is the Family Health Survey?
 The Bureau of Health Information and Policy presents Welcome & Introductions The Wisconsin Family Health Survey: A Study of Population Health Christine Hill, Section Chief Bureau of Health Information
Health Status, Health Insurance, and Medical Services Utilization: 2010 Household Economic Studies
 Health Status, Health Insurance, and Medical Services Utilization: 2010 Household Economic Studies Current Population Reports By Brett O Hara and Kyle Caswell Issued July 2013 P70-133RV INTRODUCTION The
Transforming Health Care: American Attitudes On Shared Stewardship
 Transforming Health Care: American Attitudes On Shared Stewardship An Aspen Institute- Survey Submitted by zogby international may 2008 2008 Report Overview A new Aspen Institute/Zogby interactive survey
School, Work, and the Transition to Adulthood of Youth in the San Joaquin Valley
 I N S T I T U T E F O R P U B L I C A N T H R O P O L O G Y C A L I F O R N I A S T A T E U N I V E R S I T Y, F R E S N O School, Work, and the Transition to Adulthood of Youth in the San Joaquin Valley
Task 7: Study of the Uninsured and Underinsured
 75 Washington Avenue, Suite 206 Portland, Maine04101 Phone: 207-767-6440 Email: research@marketdecisions.com www.marketdecisions.com Task 7: Study of the Uninsured and Underinsured Vermont Office of Health
Characteristics of College Students Who Graduate with No Debt
 Student Aid Policy Analysis Characteristics of College Students Who Graduate EXECUTIVE SUMMARY Mark Kantrowitz Publisher of Fastweb.com and FinAid.org August 24, 2011 About two fifths of undergraduate
17% of cell phone owners do most of their online browsing on their phone, rather than a computer or other device
 JUNE 26, 2012 17% of cell phone owners do most of their online browsing on their phone, rather than a computer or other device Most do so for convenience, but for some their phone is their only option
San Francisco s Widening Income Inequality
 San Francisco s Widening Income Inequality May 2014 San Francisco Human Services Agency Economic Trends May 2014 San Francisco Human Services Agency San Francisco Human Services Agency 3 100% 90% 80% 70%
Application for Vocational Rehabilitation Services
 Strong Families Make a Strong Kansas Application for Vocational Rehabilitation Services Is Vocational Rehabilitation the right program for you? Some brief information about the Vocational Rehabilitation
Racial and Ethnic Health Disparities in Health and Health Care Kansas City Regional Data
 Racial and Ethnic Health Disparities in Health and Health Care Kansas City Regional Data By Debbie Chase, MPA Consultant, Center for Health Policy University of Missouri -- Columbia 1 Quantitative Data
What It s Worth: Field of Training and Economic Status in 2009
 What It s Worth: Field of Training and Economic Status in 2009 Household Economic Studies Issued February 2012 P70-129 INTRODUCTION The relationship between educational attainment and economic outcomes
Orlando Housing Authority
 Orlando Housing Authority Orlando Housing Authority Primary Business Address Your Address Line 2 Your Address Line 3 Your Address Line 4 Phone: 555-555-5555 Fax: 555-555-5555 E-mail: someone@example.com
Racial Disparities in US Healthcare
 Racial Disparities in US Healthcare Paul H. Johnson, Jr. Ph.D. Candidate University of Wisconsin Madison School of Business Research partially funded by the National Institute of Mental Health: Ruth L.
Supplemental Appendix to the Report on the Economic Well-Being of U.S. Households in 2013
 Supplemental Appendix to the Report on the Economic Well-Being of U.S. Households in 2013 July 2014 BOARD OF GOVERNORS OF THE FEDERAL RESERVE SYSTEM Supplemental Appendix to the Report on the Economic
BizBuySell.com Small Business Buyer & Seller Demographic Study
 BizBuySell.com Small Business Buyer & Seller Demographic Study Table of Contents Report Executive Summary Younger, More Diverse Buyers Look to Acquire Retiring Baby Boomer Businesses Female Business Buyers
New York State Profile
 New York State Profile Jennifer Guinn EDUC 547 FALL 2008 According to 2006 U.S. Census estimates, with a total population of over 19 million people, 20 percent of New York State s population were foreign-born
Logan City. Analysis of Impediments to Fair Housing
 Logan City Analysis of Impediments to Fair Housing 2009-13 Consolidated Plan Page 36 of 92 EXECUTIVE SUMMARY Analysis of Impediments The Analysis of Impediments (AI) is a comprehensive review of a jurisdiction
Minnesota s Registered Nurse Workforce, 2011-2012
 Office of Rural Health and Primary Care P.O. Box 64882 St. Paul, MN 55164-0882 651-201-3838 Minnesota s Registered Nurse Workforce, 2011-2012 The Minnesota Department of Health (MDH), in cooperation with
UNH Graduate Education Department. Quarterly Assessment Report
 First Quarter Assessment Report UNH Graduate Education Department Quarterly Assessment Report First Quarter i First Quarter Assessment Report Table of Contents Introduction... Section - Purpose of the
Bryant T. Aldridge Rehabilitation Center Unit Specific Inclusive Diversity Analysis: CULTURAL COMPETENCY AND DIVERSITY PLAN February 2015
 Bryant T. Aldridge Rehabilitation Center Unit Specific Inclusive Diversity Analysis: CULTURAL COMPETENCY AND DIVERSITY PLAN February 2015 Prepared by Brian Agan A Cultural Competency and Inclusive Diversity
REACHING THE REMAINING UNINSURED IN MASSACHUSETTS: CHALLENGES AND OPPORTUNITIES
 REACHING THE REMAINING IN MASSACHUSETTS: CHALLENGES AND OPPORTUNITIES MARCH 2013 Sharon K. Long Dana Goin Victoria Lynch Urban Institute EXECUTIVE SUMMARY While Massachusetts has the lowest uninsurance
How To Get Health Insurance For Women
 APRIL 2007 Issue Brief Women and Health Coverage: The Affordability Gap Elizabeth M. Patchias and Judy Waxman National Women s Law Center For more information about this study, please contact: Elizabeth
Durham County Community Health. Assessment? What Is a Community Health
 Durham County Community Health Assessment This document presents key findings from the 2011 Durham County Community Health Assessment. The goal of the assessment was to provide a compilation of valid and
Income is the most common measure
 Income Goal A healthy standard of living for all Income is the most common measure of socioeconomic status, and a strong predictor of the health of an individual or community. When assessing the health
Poverty. Worth County Estimates. Poverty Status of Individuals. Families at Selected Ratios of Income to Poverty Level
 Poverty And Food Needs, Iowa Poverty and food insecurity impact the welfare of individuals, families, and communities. This profile describes indicators of poverty, food insecurity, and other measures
Santa Ana College, School of Continuing Education, Centennial Education Center. Data collection reports. Prepared by: Jarek Janio, CEC
 Santa Ana College, School of Continuing Education, Centennial Education Center Data collection reports Prepared by: Jarek Janio, CEC Friday, December 20 th, 2013 Glossary of terms and abbreviations: ABE
WHO LEAVES TEACHING AND WHERE DO THEY GO? Washington State Teachers
 www.erdc.wa.gov ERDC Research Brief 2011-01 Longitudinal Studies January 2011 WHO LEAVES TEACHING AND WHERE DO THEY GO? Washington State Teachers The Washington State Education Research & Data Center (ERDC)
New Jersey Kids Count 2014 The State of Our Children
 New Jersey Kids Count 2014 The State of Our Children April 24, 2014 Advocates for Children of New Jersey 35 Halsey Street Newark, NJ 07102 973.643.3876 Advocates for Children of New Jersey 2014 What is
Demographic and Economic Profile. North Carolina. Updated June 2006
 Demographic and Economic Profile North Carolina Updated June 2006 Metro and Nonmetro Counties in North Carolina Based on the most recent listing of core based statistical areas by the Office of Management
Survey of Nurses 2013
 Survey of Nurses 2013 Survey of Nurses Report Summary Since 2004, the Michigan Center for Nursing has conducted an annual survey of Michigan nurses in conjunction with the licensure renewal process for
9. WILL THE INFORMATION I GIVE BE CHECKED? Yes and we may also ask you to send written proof.
 Dear Parent/Guardian: Children need healthy meals to learn. Your child s school offers healthy meals every school day. Your childr en may qualify for free meals or for reduced price meals. 1. DO I NEED
Research. Dental Services: Use, Expenses, and Sources of Payment, 1996-2000
 yyyyyyyyy yyyyyyyyy yyyyyyyyy yyyyyyyyy Dental Services: Use, Expenses, and Sources of Payment, 1996-2000 yyyyyyyyy yyyyyyyyy Research yyyyyyyyy yyyyyyyyy #20 Findings yyyyyyyyy yyyyyyyyy U.S. Department
Workforce Training Results Report
 Report December 2008 Secondary Career and Technical Education (CTE) Secondary CTE serves high school age youth in approximately 238 school districts and 10 Skills Centers throughout the state, preparing
Suggested Citation: Institute for Research on Higher Education. (2016). College Affordability Diagnosis: Massachusetts. Philadelphia, PA: Institute
. College Affordability Diagnosis: Massachusetts. Philadelphia, PA: Institute") MASSACHUSETTS Suggested Citation: Institute for Research on Higher Education. (2016). College Affordability Diagnosis: Massachusetts. Philadelphia, PA: Institute for Research on Higher Education, Graduate
MASSACHUSETTS Suggested Citation: Institute for Research on Higher Education. (2016). College Affordability Diagnosis: Massachusetts. Philadelphia, PA: Institute for Research on Higher Education, Graduate
CONGRESSIONAL DISTRICT REPORT For the 113th Congress. California District 47. Representative Alan Lowenthal (D)
") CONGRESSIONAL DISTRICT REPORT For the 113th Congress District 47 Representative Alan Lowenthal (D) National Association of REALTORS 500 New Jersey Avenue, NW Washington, D.C. Congressional Districts 113th
CONGRESSIONAL DISTRICT REPORT For the 113th Congress District 47 Representative Alan Lowenthal (D) National Association of REALTORS 500 New Jersey Avenue, NW Washington, D.C. Congressional Districts 113th
BY Aaron Smith NUMBERS, FACTS AND TRENDS SHAPING THE WORLD FOR RELEASE NOVEMBER 19, 2015 FOR FURTHER INFORMATION ON THIS REPORT:
 NUMBERS, FACTS AND TRENDS SHAPING THE WORLD FOR RELEASE NOVEMBER 19, 2015 BY Aaron Smith FOR FURTHER INFORMATION ON THIS REPORT: Aaron Smith, Associate Director, Research Dana Page, Senior Communications
Technical Report 1: Regional Demographic Profile
 Technical Report 1: Regional Demographic Profile Compiled by the Piedmont Triad Regional Council January, 2013 Triad Tomorrow Figure 1. Piedmont Triad Region CONTEXT The Piedmont Triad region consists