CWU Teacher Time Study: How Washington Public School Teachers Spend Their Work Days
|
|
|
- Jennifer Walters
- 10 years ago
- Views:
Transcription
1 CWU Teacher Time Study: How Washington Public School Teachers Spend Their Work Days

2

3 CWU Teacher Time Study: How Washington Public School Teachers Spend Their Work Days Executive Summary The Washington State Operating Budget (3ESSB 5034, section 609) directed the College of Education at Central Washington University to conduct a study identifying the duties encompassed in the typical workday of a state-funded teacher. The legislature directed that the study should determine what percentage of that day is spent on teaching-related duties and what percentage is spent on duties not directly related to teaching. METHODOLOGY CWU randomly selected 5,000 teachers from the nearly 50,000 teachers in Washington State s S-275 database, maintained by the Office of the Superintendent of Public Instruction. Eleven hundred elementary, secondary, and specialist teachers volunteered to participate in the study. After eliminating part-time teachers, the sample was reduced to 693. The sample was representative geographically (see Appendix A) as well as representative of the diverse size and demographic profiles of Washington s public schools (see Tables 1 and 2). The study tracked specific activities, selected as a result of feedback received from a team of teachers, principals, and superintendents. Those activities were: 1. Classroom planning or assessment 2. Direct contact time with students 3. Preparation for required standardized state exams 4. Assigned building or district duties 5. Professional learning communities 6. Professional development 7. Communications with parents 8. Other Tasks THE STUDY USED A THREE-TIERED DESIGN. TIER-I Surveys The first group of 693 teachers were randomly assigned to survey panels, or groups of participants, with each panel randomly assigned to report what the teacher did on three specified days, one each during the fall, winter, and spring. Each panel was randomly assigned to different days, which allowed data-collecting every workday in the academic year. TIER- II Time logs Out of the original group, 40 teachers were provided a Microsoft Surface Tablet with a timer and activity log to capture the amount of time and the time of day on each specific activity and report when teachers and students were directly engaged. Each Tier-II teacher was randomly assigned to a panel of 10 teachers and each panel was then randomly assigned to nine specific weeks of teaching so the entire year could be coded. Each teacher coded an activity as it started and stopped, resulting in the coding of nine weekly logs for each of the 40 weeks of the school year. A total of 15,006 records were coded and analyzed to produce the results. 1

4 TIER-III Interviews Thirty-six of the Tier-II teachers were interviewed, using a scripted questionnaire to further assess the consistency in responses. Interviews also collected feedback about participating in the study. Interview responses were recorded, transcribed, and logged into the database. REVIEW OF LITERATURE This review identified only three studies with comparable research questions. None, however, were executed with anywhere near the breadth of this report. WASHINGTON STATE STUDY RESULTS This survey revealed two key findings: 1. On the average, teachers report spending 1.4 hours longer than the contracted day and 2.4 hours longer than the instructional day completing non-instructional activities. 2. Teachers in the Tier-I survey reported 72.9 percent of their time was spent with students in direct instruction. Further, 15 to 17.8 percent of teachers instruction time was devoted to preparing students for state tests. During the remaining school day (27.2 percent), teachers were engaged in a variety of other activities, including parent communication, professional development, other duties as assigned, and participation in professional learning communities. 2

5 CWU Teacher Time Study: How Washington Public School Teachers Spend Their Work Day In the operating budget, the Washington State Legislature directed CWU to, Survey teachers to identify the duties encompassed in a state-funded teacher s typical workday and provide an estimate of the percent of a teacher s day that is spent on teaching-related duties and the percent of the teacher s day that is spent on duties that are not directly related to teaching (3ESSB 5034, section 609). The budget language originally directed CWU to deliver the results of this study to legislative committees by December 1, 2013, but researchers pointed out that a more complete understanding of teacher s work day would result from studying the entire school year. Therefore legislative committees agreed to extend the study period to June 30, A review of research about public teachers work days identified only three studies that specifically referred to the time teachers spent in the classroom. The Center for Teaching Quality study (2007) 1 surveyed 10 teachers; the Vannest et al., (2009) 2 study used a self-monitoring method with four female special education teachers. The Organization for Economic Cooperation and Development (OECD, 2013) 3 surveyed schools internationally to compare differences in a required number of teaching days. While it is well understood that teachers spend numerous hours grading, planning, and communicating with parents outside of the school day, the research team identified no study that used a large sample to describe the nuances of time in a teachers contracted day or the actual time they spend in the act of teaching students. PRINCIPAL INVESTIGATOR The principal investigator for the study was the CWU Executive Director of Organizational Effectiveness, James DePaepe, PhD. DePaepe was the director for the Office of Research, Evaluation, and Assessment for the CWU College of Education for seven years, conducting applied and evaluative research using rigorous systematic and empirical standards of scientific investigation. He has published 75 research papers and has been awarded $3 million in grants and contracts. DePaepe served as director of the Center for Teaching and Learning at CWU for nearly six years, coordinating 35 graduate and undergraduate education programs across three colleges of the university, coordinating accreditation efforts, and approving curriculum. He currently serves as the Policy Research Analyst for the Washington Association of Colleges for Teacher Educators. In 2013, the Professional Educators Standards Board asked DePaepe to analyze the relationship between the Scholastic Aptitude Test (SAT) and Washington Educator Skills Test Basic (WEST-B) scores and report the finding to the Board. The study, which used more than 4,000 student records from four Washington universities, was insightful and resulted in a revision in the Washington Administrative Code. RESEARCH METHODOLOGY On August 7, 2013, CWU s research team presented a three-tiered research plan to the Washington State House Education Committee, which approved the plan and directed the team to move forward on the study. On August 13, the CWU Human Subjects Review Committee (HSRC) approved the research design, questions, and consent form. The three-tiered research plan consisted of surveys (Tier-I), daily time logs (Tier-II), and interviews (Tier-III). Tier-I engaged 693 teachers. Of these, 40 participated in Tier-II, and 36 of those 40 teachers participated in Tier-III. The study participants were selected from the , S-275 database of elementary and secondary state-contracted teachers (49,782), which is maintained by the Office of the Superintendent of Public Instruction (OSPI). Five thousand individuals were randomly selected and recruited for the study; part-time teachers were eliminated from the sample. 1 Center for Teaching Quality. (2007). Strategies to Create Non-instructional Time for Elementary School Teachers. Governor Easley s Teacher Working Conditions Initiative Changing Teacher Time by Kimberly J. Vannest, Denise A. Soares, Judith R. Harrison, Leanne Brown, and Richard I. Parker, The OECD (2013), Indicator 4, How Much Time Do Teachers Spend Teaching. Education at a Glance 2013: OECD Indicators

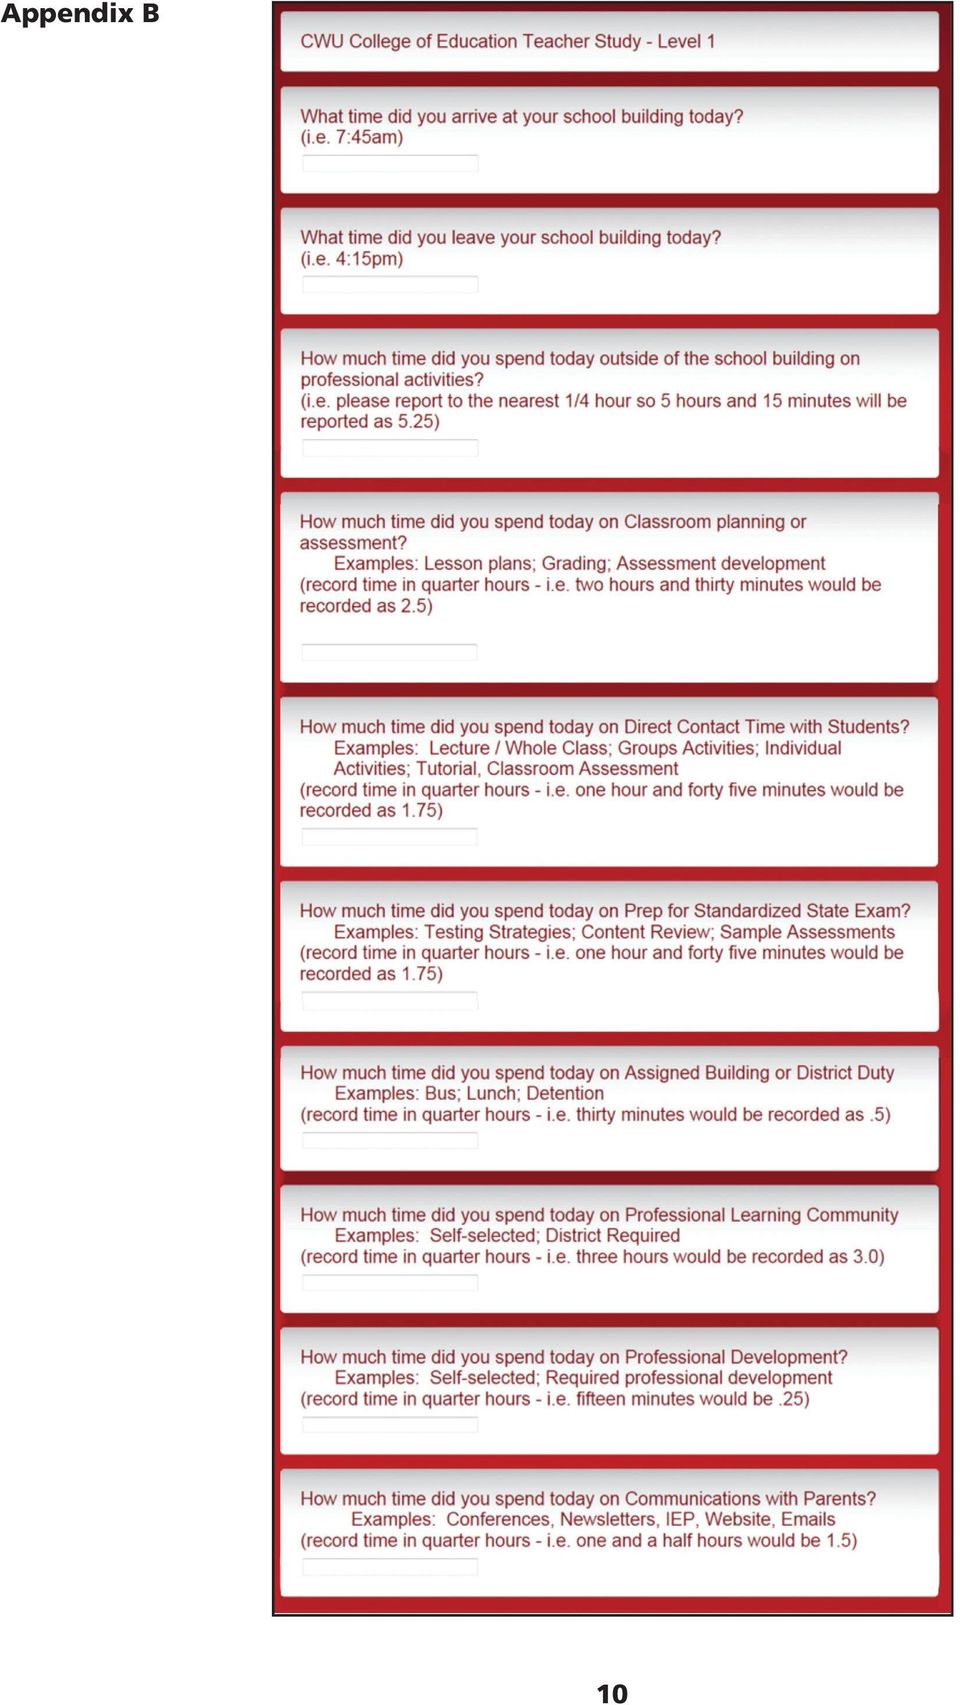
6 Six hundred and ninety three elementary, secondary, and specialist teachers agreed to participate, representing 159 school districts (54 percent of the state total), 224 high schools, 172 middle schools, and 297 elementary schools (see Appendix A, which maps participating districts). Participants in the study closely represented the state s teacher population. Table 1 provides demographics of the participants in comparison to the Washington teacher population. Table 2 shows similarities in teaching experience. Surveys for 82 participants lacked demographic information and were not included in the table. TABLE 1. Teacher Time Participants Demographics and All WA State Teachers Tier-I Participants WA State Teachers Variable N = 611* N = 49,782 N Percentage N Percentage Gender/Sex Female , Male , Ethnicity Latino , Race African American/Black American Indian/Native American Asian American , European American/White , Pacific Islander Multiracial Unknown *Unclassified in database n=82 TABLE 2. Years Teaching Experience Mean Median Teacher Time Participants N = 611 WA State Teachers N = 49,782 Tier-I teachers were randomly assigned to 64 survey panels. Each panel was randomly assigned to complete the electronic survey (see Appendix B) during three assigned days, one each during the fall, winter, and spring. All panels were randomly assigned to different days each term, which allowed data to be collected every day of the academic year, with the exception of holidays and weekends. Tier-II teachers were provided a Microsoft Surface Tablet that contained a built-in timer and activity log (see Appendix C), which captured actual time spent on eight typical daily activities. To develop categories of typical activities, researchers consulted a team of teachers, principals, and superintendents. 4

7 The activity categories included the following: Teaching-related activities 1. Direct instructional contact with students 2. Preparing students for mandatory standardized state tests 1 Activities not directly related to teaching 3. Classroom planning or assessment, including developing lesson plans and grading student work 4. Participating in professional learning communities designed to align instruction with implementation of common core standards 5. Performing assigned building or district duty, such as supervision of playground or lunchroom activities 6. Completing professional development, including state-required, in-service training 7. Communicating with parents, for example, parent-teacher conferences and phone or follow-up on student concerns 8. Other tasks, such as field trips and staff meetings Each Tier-II teacher was randomly assigned to a panel of ten teachers. Each panel was then randomly assigned to nine specific weeks of teaching so the entire year could be coded. Using the tablets, teachers selected an activity that started a timer and ended the timer when they transitioned to a different activity. Teachers continued this process throughout their school day. Thus, nine weekly logs were coded for each of the 40 weeks of the school year. The research team conducted phone interviews with Tier-III teachers using a scripted questionnaire to further assess the consistency in responses. Feedback about participating in the study was also collected. Interview responses were recorded, transcribed, and logged into a database. All transcriptions were entered into a qualitative analysis program to understand what themes emerged among all of the teachers interviewed. KEY FINDINGS The consistency in reporting arrival and departure times across elementary, middle, and high schools confirms the actual time teachers typically spend in Washington public schools. The average instructional day when students are present was reported as 6 hours and 30 minutes. The contracted workday was reported as 7 hours and 30 minutes. On the average, teachers reported working 1.4 hours longer than the contracted day and 2.4 hours more than the instructional day (see Table 3 below). TABLE 3. Reported Teacher Workday by Level School Level Reported Arrival Time Reported Departure Time Mean Hours/Day Elementary 7:38 a.m. 4:37 p.m Middle School 7:14 a.m. 4:09 p.m High School 7:03 a.m. 4:07 p.m Mean Time 7:18 a.m. 4:18 p.m The percentage of time Tier-I teachers allocated to various activities was examined in three different ways depending on whether the work was directly or not directly related to teaching. Activities that were teaching related were assigned to the 6.5-hour instructional day. The non-teaching-related activities were accomplished both when students were present and not present, so those activities were calculated using the average time teachers reported and by the contracted work day (see Table 4 below). 1 Required tests include the Smarter Balanced English Language Arts (ELA) Test, the Smarter Balanced Math Test, and Measurements of Student Progress. For more information about required testing please see 5

8 TABLE 4. Teaching related activities by percent of reported time, contracted time, and instruction time for Tier-1 teachers Reported Contracted Instructional Activity 8.94 hrs. 7.5 hrs. 6.5 hrs. Instructional Time 72.9% (Direct Contact with Students) Planning and Assessment 21.9% 26.1% Standardized State Test Prep 17.8 Bldg. or District Assigned Duties Professional Learning 13.5 Communities 11.3 Professional Development Parent Communication To put these percentages in perspective, students were present during 6.5 hours of the school day; therefore the most precise percentage of time teachers spent on direct instruction was approximately 73 percent, leaving about 27 percent of the 6.5-hour day for duties not directly related to teaching. Teachers reported 17.8 percent of their instruction time was committed to preparing students for state testing. During the Tier-III interviews, many teachers indicated that it was a challenge to separate direct instructional time from state test preparation time in their survey responses. This resulted in an overlap of the two largest portions of the day directly related to teaching, with a smaller portion of the day spent in planning and assessment, building and or district duties, professional learning community, professional development, parent communication, and/or other tasks. While it is clear there was overlapping in activity reporting in Tier-I, the data collection process for Tier-II prevented double-counting time. Analyses for Tier-II data demonstrate that overlapping in the Tier-I reporting accounted for less than 3 percent of the variance (see Table 5). Moreover, a comparison of the other activities demonstrates less than 5 percent variation between Tier-I and Tier-II responses. This level of agreement provides confidence that the 693 teachers who answered the survey did so accurately and consistently. TABLE 5. Percentage of Time of Directly Related to Teaching When Students are in School by Tier-I and Tier-II. Elementary School Middle School High School Mean 6.5 Hours 6.5 Hours 6.5 Hours 6.5 Hours Instructional Contact Time Tier I 70% 73% 75% 73% Tier II Standardized Test Prep Tier I Tier II

9 TABLE 6. Percentage of Time Not Directly Related to Teaching During the Reported Hours and Contract Hours by Tier-I and Tier-II Activities Reported The percentages of teaching time in Tier-I were calculated with the average reported time of 8.94 hours per day. Percentages for Tier-II were calculated with the average reported time of 8.8 hours per day. This further supports the consistency and accuracy of the reporting. Elementary Middle High Mean School School School Reported Contract Reported Contract Reported Contract Reported Contract Hours Hours Hours Hours Hours Hours Hours Hours Planning & Assessment I 21.5% 25.6% 20.4% 24.3% 23.9% 28.5% 21.9% 26.1% II Assigned Duties I II PLC I II Professional Dev. I II Parent Comm. I II Other Tasks I II TIER-III TEACHER COMMENTS Tier-III included telephone interviews of 36 teachers. Interviews were conducted using a set questionnaire (see Appendix D). The most frequently occurring comments were: Teachers felt their roles were moving away from teaching as the primary focus of their work and moving toward preparing students for state-mandated tests, filling out paperwork (forms), and communicating with parents. Teachers said the need to communicate with parents is growing exponentially, placing an increasing demand on the teachers time both during and after school. Respondents said that district, state, and federal requirements come and go before implementation strategies can be carried out or their effectiveness measured. Teachers felt the study restricted categorization of their activities too narrowly. Teachers said they would have liked the opportunity to report weekend work related activities. FURTHER STUDY Whereas this study generated some interesting results, it also presented more opportunities for future research that would further the depth and breadth of knowledge about how Washington K-12 teachers spend their work days. The study generated several ideas for improved measurement of teacher activities, including the creation of a new smartphone application that would allow teachers to code activities more easily. Increasing the sample size and using the new app for coding could refine this study s outcomes and generate new inquiries. The study also suggests the need for further research on teacher time. Subsequent research could compare the use of the school day by teachers in Washington to that of educators in other states. Additional studies also could examine teacher time before and after the contracted day in greater detail, and expand the categories of teacher activities. 7

10 CENTRAL WASHINGTON UNIVERSITY TEACHER TIME RESEARCH TEAM Dr. James DePaepe Executive Director Organizational Effectiveness Daniel Matthews Director Analytics and Research, Organizational Effectiveness Dr. Kirk Mathias Associate Director Analytics and Research, Organizational Effectiveness- Education Stephanie Harris Program Manager Organizational Effectiveness Sigrid Davison Associate Director Analytics and Research, Organizational Effectiveness Dr. Elizabeth Lee Associate Director Analytics and Research, Organizational Effectiveness David Braskamp Research Analyst Analytics and Research, Organizational Effectiveness- Education Neal Howard Graduate Assistant Organizational Effectiveness Emily Williams Anastasia Allen Michael Bunker Summer Graduate Intern Undergraduate Student Intern Undergraduate Student Intern Special thanks to Dean Connie Lambert, CWU College of Education and Professional Studies, and Steve Myers, Superintendent, Educational Service District 105, for their support of this research project. 8

11 Appendix A Map of School Locations of Study Participants 9

12 Appendix B 10
13 Appendix C Sample Tier II Time Log 11

14 Appendix D 12

15

16 CWU is an AA/EEO/Title IX Institution. For accommodation
