The Asia-Pacific Energy Dilemma
|
|
|
- Godwin Clarke
- 8 years ago
- Views:
Transcription
1
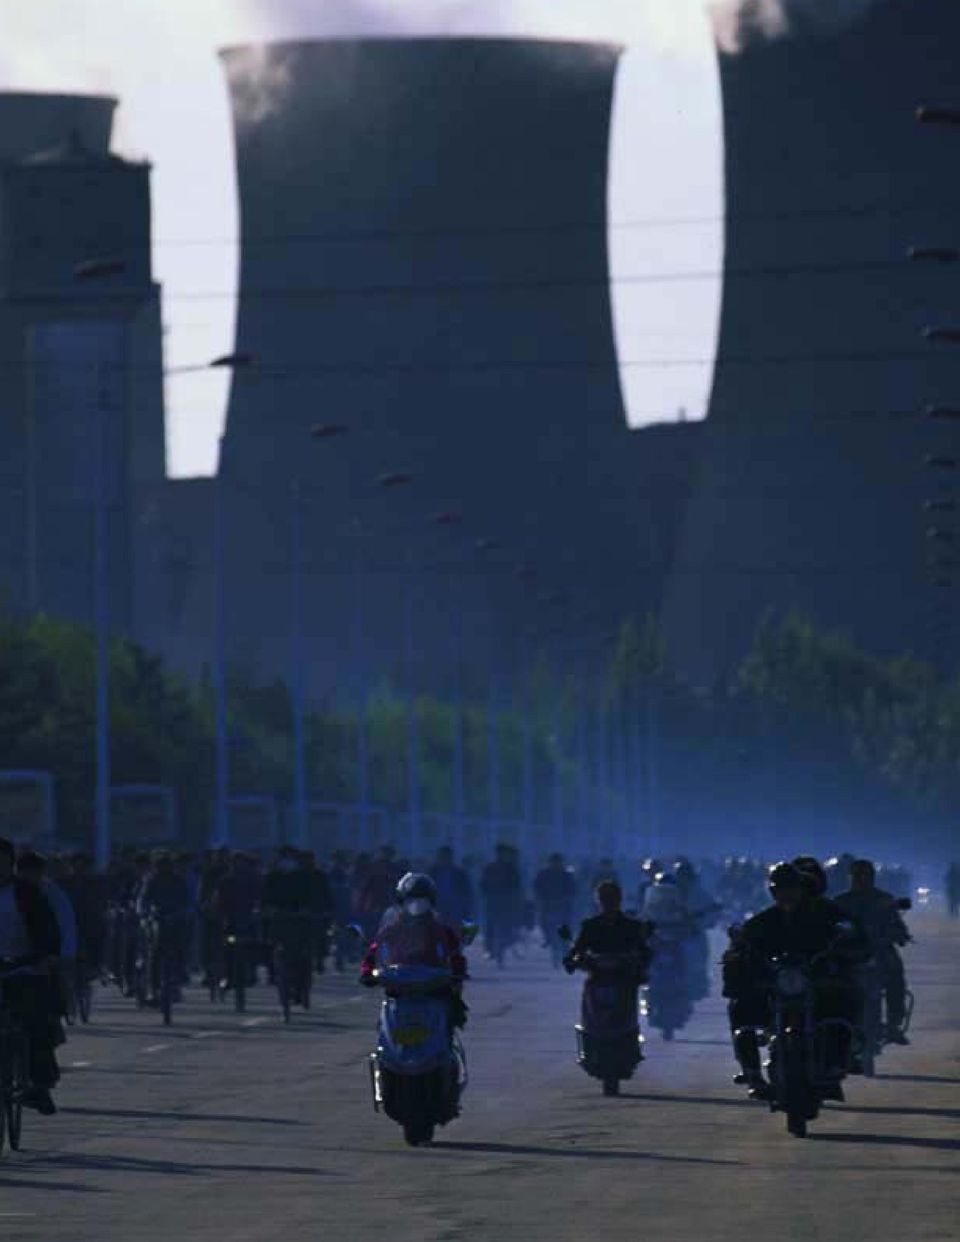
2 CHAPTER ONE The Asia-Pacific Energy Dilemma Kang Wu Jeffrey G. Brown Toufiq A. Siddiqi Traffic near the cooling towers of a nuclear power plant in Baotou, Nei Mongol Autonomous Region, China. Between 25 and 215, China s primary commercial energy consumption, which includes oil, natural gas, coal, nuclear power, and hydropower, is projected to increase by 5 percent a year. Michael S. Yamashita/Corbis The Asia-Pacific region plays a critical role in today s global energy markets. Asian and Pacific countries are large and growing consumers of oil and increasingly important consumers of natural gas. As major importers from the Middle East and other regions, their participation in global oil and gas markets affects the availability and cost of energy everywhere in the world. And their growing dependence on imports is at the heart of concerns about energy security in the region. In addition to oil and natural gas, coal is a particularly important energy source in China, India, the Democratic People s Republic of Korea (North Korea), and other countries of the region. Given the low levels of technology currently in use, heavy dependence on coal in some Asia-Pacific countries raises concerns about harmful air pollution and global warming. Regional information presented in this book is largely based on data from 44 countries and economies. Information on individual countries and economies focuses on the major energy producers and consumers in the region: Bangladesh, India, Nepal, Pakistan, and Sri Lanka in South Asia; Brunei Darussalam, Indonesia, Malaysia, Myanmar, the Philippines, Singapore, Thailand, and Vietnam in Southeast Asia; China, North Korea, Hong Kong Special Administrative Region (SAR), Japan, the Republic of Korea (South Korea), and Taiwan in East Asia; and Australia and New Zealand in the Pacific (Figure 1.1). Sources of energy include fossil fuels (oil, natural gas, and coal), traditional biomass fuels (trees, shrubs, and agricultural and animal wastes), renewable energy sources (hydropower, solar, geothermal, and wind), and nuclear power. Several countries in the region including China, India, Bangladesh, Pakistan, Indonesia, and Vietnam still make considerable use of traditional biomass sources of energy. It is difficult, however, to estimate total energy use in situations where fuel is not traded in the marketplace. For this reason, the discussion focuses mainly on primary commercial energy, which is defined to include oil, natural gas, coal, nuclear power, and hydropower. Traditional biomass fuels, as well as geothermal, solar, and wind energy, will be included in the discussion where relevant data are available. Energy consumption: World s fastest growth Energy consumption is growing more quickly in Asia and the Pacific than in any other region of the world. Between 1965 and 25, primary commercial energy consumption in the region increased sixfold (Figure 1.2). And the rate 1

3 Figure 1.1. Map of the Notes: Major energy producers Other countries/economies Boundaries represented in Asia-Pacific region and consumers in the region are: included in regional totals are: the map are not necessarily Source: East-West Center. Bangladesh, India, Nepal, Afghanistan and Maldives in authoritative. Pakistan, and Sri Lanka in South Asia; Cambodia, South Asia; Brunei Darussalam, Timor-Leste, and Lao People s Indonesia, Malaysia, Myanmar, Democratic Republic in the Philippines, Singapore, Southeast Asia; Macao SAR and Thailand, and Vietnam in Mongolia in East Asia; and the Southeast Asia; China, the Federated States of Micronesia, Democratic People s Republic Fiji, French Polynesia, Guam, of Korea (North Korea), Hong Kiribati, Marshall Islands, Nauru, Kong Special Administrative New Caledonia, Palau, Papua Region (SAR), Japan, the New Guinea, Samoa, Solomon Republic of Korea (South Korea), Islands, Tonga, Tuvalu, and and Taiwan in East Asia; and Vanuatu in the Pacific. Australia and New Zealand 2 (not shown) in the Pacific.

4 Figure 1.2. Trends in total annual energy consumption (million barrels of oil equivalent/day) in major regions of the world, Million barrels of oil equivalent/day Europe/Central Asia North America Asia-Pacific South/Central America Middle East Africa Year Sources: BP (26); FACTS Global Energy (26). Notes: Primary energy is limited to commercially traded fuels. Excluded are traditional biomass fuels such as wood, peat, and agricultural and animal waste, which, although important in many countries, are unreliably documented in consumption statistics. of growth is accelerating. In 1995, Asia and the Pacific accounted for 27 percent of global primary commercial energy consumption. By 25, this share had increased to 32 percent (Appendix Table 1.1). In 215, the region will account for a projected 38 percent of the world s energy consumption. Population alone would suggest that the Asia-Pacific region is an important player in world energy markets. In mid-25, the region accounted for 56 percent of world population, well over twice the size of any other region (Figure 1.3 and Appendix Table 1.2). Fertility is projected to decline somewhat in Asia and the Pacific, but the region will still account for more than one-half of global population in 25 (PRB 25). Although total energy use is large because of the region s large population, citizens of Asia and the Pacific use relatively little energy per capita (Figure 1.4 and Appendix Table 1.3). On average, 1 people in the Asia-Pacific region use about as much energy as two people in Europe or one person in the United States. This current low use of energy per capita points to enormous potential for consumption growth in the future. Will governments in the region be able to meet the future energy demands of their citizens? And at what cost? Energy consumption and economic growth. Rapid growth in energy consumption will stem largely from the Asia-Pacific region s unprecedented economic growth. In fact, trends in the region offer a textbook illustration of how economic growth and primary energy consumption usually go hand in hand. Over a quarter century from 198 to 25, annual economic growth in Asia The Asia-Pacific Energy Dilemma 3

5 Figure 1.3. Proportion of total global population in major regions, mid-25 North America 5.1% Asia-Pacific 55.8% Latin America/ Caribbean 8.6% Africa 14.% Europe/Western Asia 16.5% Source: PRB (25). Note: Proportions in figure are not exactly the same as in Appendix Table 1.2 due to rounding. Figure 1.4. Per-capita annual primary commercial energy consumption (barrels of oil equivalent) in the United States, Russia, and major regions of the world, 25 Barrels of oil equivalent/person U.S. Russia Europe Latin Asia Africa (excluding America Pacific Russia) Sources: BP (26); PRB (25); FACTS Global Energy (26). 4 Asia s Energy Future: Regional Dynamics and Global Implications
 8.5 6.9 2.")
6 Figure 1.5. Primary energy consumption and real gross domestic product (GDP) in the Asia-Pacific region: Annual growth rates Annual growth (percent) Real GDP Primary energy consumption Year -2 Sources: IMF (26); BP (26); OECD/IEA (26); FACTS Global Energy (26). and the Pacific averaged 4.2 percent, while annual growth in primary energy consumption averaged 4.4 percent (Appendix Table 1.4). During the economic boom years of , growth in energy consumption accelerated (Figure 1.5). The economic crisis of slowed both regional economic growth and growth in energy consumption dramatically, but both recovered and began climbing steeply again. While the precise relationship between energy consumption and economic growth is a matter of academic debate, rapid economic growth tends to be associated with large increases in energy consumption at early stages of industrialization. Growth rates for energy consumption and real gross domestic product (GDP) in several developing countries of Asia and the Pacific illustrate this link (Figure 1.6 and Appendix Table 1.4). As economies mature, economic growth typically becomes less energy intensive, and the linkage between economic growth and energy consumption weakens. Two countries at early stages of industrial development stand out as exceptions to this pattern China and, to a lesser extent, India. Why has growth in energy consumption in these two countries lagged behind economic growth, particularly in China? There could be several possible reasons. First, both economies have experienced some degree of structural change, with light industry and the service sector growing faster than the more energy-intensive heavy industrial sector. Second, the introduction of energy-saving measures and the importation of energy-saving machinery have helped both economies move toward greater energy efficiency. A third reason relates to rising energy prices. A policy shift from substantial energy price subsidies to a more market-oriented approach The Asia-Pacific Energy Dilemma 5
. During the economic boom years of 199 1996, growth in energy consumption accelerated (Figure 1.5).")
7 Figure 1.6. Primary energy consumption and real gross domestic product (GDP) in selected developing economies of the Asia-Pacific region: Average annual growth rates, (percent) Thailand Vietnam Bangladesh Indonesia Philippines Primary energy consumption Real GDP China India Percent Sources: IMF (26); BP (26); OECD/IEA (26); FACTS Global Energy (26). with prices increasingly determined by supply and demand has helped both China and India reduce excessive energy use. Despite improvements in efficiency, China and India rank, along with Japan and South Korea, as by far the largest energy consumers in the region. Looking ahead to 215, China is projected to increase energy consumption by 5 percent a year from 31.1 million barrels of oil equivalent per day (boe/d) in 25 to 5.8 million boe/d in 215 (Appendix Table 1.1). Among other Asian and Pacific countries, Bangladesh, Brunei, Myanmar, Nepal, Pakistan, Sri Lanka, and Vietnam are all expected to increase energy consumption by more than 4 percent a year over the same 1-year period (Appendix Table 1.1). In 215, China alone will account for a projected 51 percent of total primary energy consumption in the Asia-Pacific region, up from 45 percent in 25. Energy sources. Among specific energy sources, the Asia-Pacific region uses more coal than the world as a whole and less natural gas (Figure 1.7). Totals for the region are dominated by China and India, however, and both countries are particularly dependent on coal. Without China and India, the energy mix in the rest of the region is dominated by oil. In fact, the Asia-Pacific region, excluding China and India, is more dependent on oil than the world as a whole. Between 1995 and 25, oil consumption in Asia and the Pacific increased 6 Asia s Energy Future: Regional Dynamics and Global Implications

8 HOW IS ENERGY MEASURED? Storage area for oil barrels in Shanghai, China. In 25, nearly one-half (44 percent) of the oil consumed in China was imported. REUTERS/Aly Song/Landov It is difficult to compare the amount of energy produced or consumed from different sources because different types of energy are measured in different ways. Crude oil and petroleum products are generally measured in terms of barrels, with one barrel equivalent to about 159 liters or 42 U.S. gallons. Coal is measured in metric tons (tonnes), equal to 1, kilograms. Natural gas is measured in terms of volume as cubic meters (m 3 ) or standard cubic feet (scf) or in terms of heat as British thermal units (Btu). Liquefied natural gas (LNG) is measured in tonnes. Hydropower and nuclear power, used to generate electricity, are measured in watt hours. All of these energy sources can be compared in terms of barrels of oil equivalent (boe) as a common unit, using the following conversion factors (BP 26). One boe is approximately equal to: Coal:.25 tonnes of hard coal or.41 tonnes of lignite Natural gas: 5,37 standard cubic feet (scf) LNG:.11 tonnes Heat: million British thermal units (Btu) Electricity: megawatt hours. For hydropower and nuclear power, the conversion is based on thermal equivalence assuming 38-percent conversion efficiency in a modern thermal power station
, equal to 1, kilograms.")
9 Figure 1.7. Share of oil, natural gas, coal, hydropower, and nuclear power in total primary energy consumption in the world, the Asia-Pacific region, and the Asia-Pacific region without China and India, 25 Percent Nuclear power Hydropower Coal Natural gas Oil World Asia-Pacific Asia Pacific without China and India Sources: BP (26); FACTS Global Energy (26). Note: Estimates of primary energy consumption include only commercially traded fuels. by nearly one-third, or 32 percent (FACTS Global Energy 26). Over the same 1-year period, global oil consumption also increased, but more slowly by 18 percent (BP 26). As a result, the Asia-Pacific region s share in global oil consumption rose from 26 to 29 percent. By 215, the region will account for a projected 33 percent of global oil consumption. Among major countries/economies in the region, oil is the most important source of commercial energy consumption in Japan, South Korea, Taiwan, Indonesia, Singapore, Malaysia, Vietnam, Thailand, the Philippines, and New Zealand (Appendix Table 1.5). Although coal is more important than oil in China s overall energy mix, the Chinese use more oil than any other country in the region (Appendix Table 1.1). And oil consumption is growing fastest in China, more than doubling from 3.2 to 6.5 million barrels per day (b/d) between 1995 and 25 (FACTS Global Energy 26). Although starting from a much smaller base, natural-gas consumption in Asia and the Pacific is growing even faster than the consumption of oil increasing by 82 percent between 1995 and 25 (FACTS Global Energy 26). Over the same 1 years, world consumption of natural gas went up by only 28 percent (BP 26). As a result, the region s share in global consumption rose from 1 to 14 percent. Over the next 1 years, natural-gas consumption is projected to continue growing faster in Asia and the Pacific than in the world as a whole. Natural gas is the most important source of commercial energy in Bangla- 8 Asia s Energy Future: Regional Dynamics and Global Implications
. Note: Estimates of primary energy consumption include only commercially traded fuels. by nearly one-third, or 32 percent (FACTS Global Energy 26).")
10 Figure 1.8. World coal consumption (million tonnes per annum) and share of the Asia-Pacific region (percent), , 6, World coal consumption Share of Asia-Pacific region 6 5 Million tonnes/annum 5, 4, 3, 2, Percent 1, Year Sources: BP (26); FACTS Global Energy (26); OECD/IEA (26). desh, Brunei, and Pakistan (Appendix Table 1.5). Japan is the largest consumer of natural gas in the region, however, followed by China, Indonesia, Malaysia, Taiwan, and India (Appendix Table 1.1). Except for one period of leveling off during the 199s, world coal consumption has increased steadily over the past 4 years (Figure 1.8). Annual increases in global consumption have been particularly steep since 2, primarily because of a surge in coal use in China. Within the Asia-Pacific region, coal is the most important energy source in China, India, Australia, and North Korea (Appendix Table 1.5). Between 1965 and 1995 and, more recently, since 2 nearly all of the incremental growth in global coal consumption has come from the Asia-Pacific region. As a result, the region s share in global consumption increased from 19 percent in 1965 to a whopping 56 percent in 25. While the absolute amount of coal consumed has gone up fairly steadily, the share of coal in regional energy consumption has fluctuated and declined, partly in response to changes in oil prices (Figure 1.9). Persistent increases in international oil prices in and again since 21 prompted some degree of fuel switching from oil to coal, mainly for power generation. In 21, the share of coal in the region s primary commercial energy consumption reached its lowest point, at 42 percent down from 58 percent in By 25, the share had risen again, to 47 percent, mainly because of double-digit growth in coal consumption in China. In 25, the Asia-Pacific region generated and used 74 terawatt hours The Asia-Pacific Energy Dilemma 9
.")
11 Figure 1.9. Coal consumption in the Asia-Pacific region (million tonnes per annum) and share of coal in the region s total primary commercial energy consumption (percent), Million tonnes/annum 4, 3,5 3, 2,5 2, 1,5 1, Coal consumption Share in total primary energy consumption Percent Year Sources: BP (26); FACTS Global Energy (26); OECD/IEA (26). Note: Estimates of primary energy consumption include only commercially traded fuels. (TWh) of hydroelectric power, equivalent to 3.4 million boe/d (see Appendix Table 1.1). In the region as a whole, hydropower accounted for 5 percent of primary commercial energy consumption (Appendix Table 1.5). China was by far the biggest consumer, using over one-half of the regional total, followed by India and Japan (Appendix Table 1.1). Despite growing environmental concerns focusing on huge hydroelectricity projects, the use of hydropower is increasing more quickly in Asia and the Pacific than anywhere else in the world. The regional share of the world total grew by five percentage points over 1 years from 2 percent in 1995 to 25 percent in 25 (BP 26). And regional growth of hydropower is expected to continue to outpace the global average in the years ahead. The majority of new hydropower projects in the region will be in China. In 25, Asia and the Pacific generated and used 553 TWh of nuclear power, equivalent to 2.5 million boe/d (see Appendix Table 1.1). This was 2 percent of the global total, up slightly from 18 percent in Only six countries/economies in the region use nuclear power Japan (consuming more than one-half of the regional total), South Korea, China, Taiwan, India, and Pakistan (Appendix Tables 1.1 and 1.5). Energy production and resource constraints Although energy consumption is growing faster in Asia and the Pacific than anywhere else in the world, growth of energy production has been sluggish. Production growth is restricted by the region s limited domestic supplies of oil and natural gas. 1 Asia s Energy Future: Regional Dynamics and Global Implications
; OECD/IEA (26). Note: Estimates of primary energy consumption include only commercially traded fuels. (TWh) of hydroelectric power, equivalent to 3.4 million boe/d (see Appendix Table 1.1).")
12 Production of specific types of energy varies widely among countries and economies in the region (Appendix Tables 1.6 and 1.7). Natural gas accounts for more than one-half of domestic energy production in Bangladesh, Brunei, Malaysia, Pakistan, and Thailand. Coal accounts for more than one-half of energy production in Australia, China, and India. In Japan, South Korea, and Taiwan, where a large proportion of the energy consumed is supplied by imports, considerably more than one-half of the energy produced domestically is from nuclear power. No country in the region obtains as much as one-half of its domestic primary energy production from oil, although Brunei, Malaysia, and Vietnam come close. Domestic oil production is constrained by the region s limited reserves. Indeed, Asia and the Pacific have the smallest proven oil reserves of any major region in the world. At the beginning of 26, the region had an estimated 4 billion barrels of oil reserves, or slightly more than 3 percent of the world total (BP 26). Within the region, China has by far the largest oil reserves (Appendix Table 1.8), followed by India, Indonesia, Malaysia, and Vietnam. The internationally accepted definition of proven energy reserves is those quantities which geological and engineering information indicates with reasonable certainty can be recovered in the future from known reservoirs under existing economic and operating conditions (BP 26). Individual countries may use their own definitions, however. In China, for example, the government and state corporations usually report larger oil, natural-gas, and coal reserves than the levels recognized (or certified ) internationally. In 25, Asia and the Pacific produced 7.5 million b/d of oil. Production was by far the highest in China, followed by Indonesia, Malaysia, and India (Appendix Table 1.6). A reserve-to-production (R/P) ratio can be calculated as the oil reserves remaining at the end of 25 divided by production over the year (Appendix Table 1.8). The result is an estimated number of years that existing reserves can be expected to last if production continues at the same rate and no new reserves are discovered. Given these assumptions, it is estimated that oil reserves in the Asia-Pacific region will last another 14 years or until 219. Predictions of future energy supplies based on reserve-to-production ratios are only indicative, however. As exploration continues, new sources may be identified, and as extraction technologies improve, more oil may be obtained from existing fields. Yet no matter which standards are applied, there is little doubt that today s proven oil reserves in Asia and the Pacific are inadequate to meet the region s current and future energy needs. The situation is more favorable for natural gas. The Asia-Pacific region has an estimated 8 percent of global natural-gas reserves (BP 26). In 25, the region produced 6. million boe/d of natural gas, or 12 percent of global production. The largest natural-gas reserves in the region are in Indonesia (Appendix Table 1.8), followed in order of size by Australia, Malaysia, and China. The R/P ratio for natural gas is more encouraging than for oil, suggesting that The Asia-Pacific Energy Dilemma 11

13 existing natural-gas reserves in the region will last for nearly 41 years if production remains at 25 levels. In 25, Indonesia was the largest producer of natural gas in the region, followed by Malaysia, China, and Australia. China s natural-gas production was geared toward the large domestic market, while Indonesia, Malaysia, Australia, and Brunei were large natural-gas exporters, in the form of liquefied natural gas (LNG). Coal resources are relatively abundant in Asia and the Pacific. At the beginning of 26, the region held nearly one-third of the world s estimated 99 billion metric tons (tonnes) of proven coal reserves (Appendix Table 1.8) and accounted for 55 percent of global coal production. Despite rapidly increasing consumption in recent years, the region as a whole still manages to produce as much coal as it consumes. With ample domestic reserves in many countries, including China and India, R/P ratios suggest that existing coal reserves will last for nearly 1 years, assuming that production continues at 25 levels. Thus security concerns related to coal focus more on environmental problems than on potential supply limitations. Growing dependence: The Asia-Pacific energy dilemma In 25, the Asia-Pacific region accounted for 33 percent of global energy consumption but only 24 percent of global energy production (Figure 1.1). Combining oil, natural gas, coal, nuclear power, and hydropower, countries in the region consumed 68.2 million boe/d of primary commercial energy but produced only 52.4 million boe/d (Appendix Tables 1.1 and 1.6). The balance of 15.8 million boe/d nearly one-fourth of total consumption was filled by imports. The region as a whole produced almost as much natural gas as it consumed and exported slightly more coal than it imported. Regional consumption of crude oil, however, at 3 percent of the global total, was much larger than the regional share of production, at 1 percent (Figure 1.1). The result of escalating consumption and stagnating production will be a large and growing dependence on imports, particularly of oil. More than 1 years ago, in the early 199s, Asia and the Pacific became the largest oil-importing region in the world. With oil consumption projected to increase by nearly one-third between 25 and 215 (Appendix Table 1.1), the trend toward greater dependence on imports appears inevitable (see Energy Insecurity Index). Natural-gas consumption is still relatively low in the region, but it is expected to increase even more quickly than oil consumption, nearly doubling by 215. Rising natural-gas consumption combined with limited production potential will exacerbate overall dependence on imports from the Middle East. Because of their dependence on imported oil, many economies in Asia and the Pacific are particularly vulnerable to fluctuations in oil prices. This vulnerability is even greater because regional price formulas for natural gas are often 12 Asia s Energy Future: Regional Dynamics and Global Implications
. Coal resources are relatively abundant in Asia and the Pacific.")
14 Figure 1.1. Share of the Asia- Pacific region in global consumption and production of oil, natural gas, coal, hydropower, and nuclear power, 25 (percent) Consumption Production Percent Oil Natural Coal Hydro- Nuclear Total gas power power Sources: BP (26); FACTS Global Energy (26). Note: Estimates of primary energy consumption and production include only commercially traded fuels. linked to crude-oil prices. When oil prices go up, natural-gas prices go up as well. This is particularly true for prices of spot cargos (natural gas purchased for immediate delivery). Spot prices are largely based on current prices at Henry Hub (natural-gas pipeline hub in Louisiana), and these, in turn, are strongly influenced by oil prices. Although some existing LNG contracts have built-in price ceilings, in the long term the prices for new natural-gas contracts and contract renewals will also fluctuate with oil prices. A spike in oil prices can affect a country s economic performance in several ways. Higher oil prices trigger a direct transfer of income from oil-importing countries to oil-exporting countries. Japan, for example, has no oil resources of its own and consumes about 5 million b/d of oil. If oil prices increase by US$1 per barrel, this amounts to an additional income transfer of US$5 million per day from Japan to the countries that supply its oil. It adds up to more than US$18 billion over the course of a year. In addition to this direct transfer of income, higher oil prices increase the cost of industrial production, which reduces output and contributes to inflationary pressure. Consumers feel the pinch as higher prices for petroleum products and a variety of other goods. The cumulative effect is a deterioration in living standards, a slowdown in economic growth, and, ultimately, an increase in unemployment. The impact obviously varies among countries, but overall, the Asia- Pacific region is a major net oil importer, and most economies in the region suffer when oil prices are high. Market observers and researchers have closely watched the impact of oil prices on economic growth since the oil price shocks of the 197s. A study by The Asia-Pacific Energy Dilemma 13

15 Table 1.1. Hypothetical impact of an oil price increase of US$1 per barrel on selected Asian economies, second quarter 24 through fourth quarter 25 (percent) Impact of oil price increase (percent) Country/economy Consumer prices Gross Domestic Product (GDP) China India Indonesia Japan Malaysia Philippines Republic of Korea Singapore Taiwan Thailand Source: Park (24). Oil consumption incremental change Figure Annual incremental change in oil consumption in the Asia-Pacific region and global oil prices, ,2 1, 8 Oil price (Dubai Platt s monthly average) 6 5 Thousand barrels/day US$/barrel Year Source: FACTS Global Energy (26). 14 Asia s Energy Future: Regional Dynamics and Global Implications
. Oil consumption incremental change Figure 1.11.")
16 the Asian Development Bank (Park 24) examines the impact of a US$1-perbarrel increase in the price of oil extending from the second quarter of 24 through the fourth quarter of 25. As might be expected, developing economies that are heavily dependent on oil imports (such as Singapore, the Philippines, and Thailand) are most affected (Table 1.1). More-mature economies (such as Japan and South Korea) and those that are oil exporters (such as Indonesia and to some extent Malaysia) experience a smaller impact. In South, Southeast, and East Asia as a whole, a US$1-per-barrel rise in oil prices would raise consumer prices for all goods by an estimated 1 percent and reduce GDP growth by.6 percent. In Thailand the country worst affected in this hypothetical scenario GDP growth would be reduced by more than 2 percent. Because even small changes in consumption or production can trigger large swings in energy prices, the Asia-Pacific region has also come to play a critical role in global energy markets, particularly in the market for oil. When oil consumption increases in Asia and the Pacific, global prices generally rise (Figure 1.11). Conversely, when oil consumption levels off in the region, global prices generally stagnate, as seen during the Asian economic crisis. Since 23, the dual impact of global supply uncertainty and an enormous increase in Chinese consumption, as well as consumption in the United States and the Middle East, has contributed to a sharp rise in oil prices everywhere in the world. Thus, the Asia-Pacific region s growing dependence on imported energy has helped cause an energy-security dilemma of global proportions. The Asia-Pacific Energy Dilemma 15

Goal 2: Achieve Universal Primary Education
 92 Goal 2: Achieve Universal Primary Education In eight economies in the region including a number from the Pacific, total net enrollment ratios in primary education are below 80%. Eleven economies including
Rush hour in Kolkata (formerly Calcutta), India. Between 1990 and 2000, the number of motor vehicles per capita more than doubled in four
, India. Between 1990 and 2000, the number of motor vehicles per capita more than doubled in four") Rush hour in Kolkata (formerly Calcutta), India. Between 1990 and 2000, the number of motor vehicles per capita more than doubled in four Asia-Pacific nations: South Korea, the Philippines, India, and
Rush hour in Kolkata (formerly Calcutta), India. Between 1990 and 2000, the number of motor vehicles per capita more than doubled in four Asia-Pacific nations: South Korea, the Philippines, India, and
ASIA AND PACIFIC VEHICLE STANDARDS & FLEETS
 ASIA AND PACIFIC VEHICLE STANDARDS & FLEETS 14 vehicles per 1000 people (), up from 11 in 1990 Afghanistan Bangladesh Bhutan Brunei Darussalam Cambodia less than three years old. Importation of used vehicles
UNITED NATIONS Economic and Social Commission for Asia and the Pacific 53 member States 9 associate members
 UNITED NATIONS Economic and Social Commission for Asia and the Pacific 53 member States 9 associate members South and South-West Asia Afghanistan Bangladesh Bhutan India Iran Maldives Nepal Pakistan Sri
Global growth rates Macroeconomic indicators CEDIGAZ Reference Scenario
 Medium and Long Term Natural Gas Outlook CEDIGAZ February 215 Global growth rates Macroeconomic indicators CEDIGAZ Reference Scenario 4 3 %/year 199-213 213-235 6 Main consuming markets - %/year (213-235)
B. SERVICES TRADE: PROMISING GROWTH
 B. SERVICES TRADE: PROMISING GROWTH B. SERVICES TRADE: PROMISING GROWTH 1. COMMERCIAL SERVICES TRADE: DOWN BUT NOT OUT Commercial services trade showed promising growth in the first three quarters of 28,
Macroeconomic Impacts of Energy Prices in the Pacific
 PFTAC Regional Papers Macroeconomic Impacts of Energy Prices in the Pacific 1 P age July 2010 This paper was prepared by Matt Davies (PFTAC) and Craig Sugden (ADB). The views expressed are those of the
World Energy Outlook 2007: China and India Insights. www.worldenergyoutlook.org International Energy Agency
 World Energy Outlook 27: China and India Insights www.worldenergyoutlook.org International Energy Agency Why Focus on China & India? Increase in World Primary Energy Demand, Imports & Energy-Related CO
Growth outlook HIGHLIGHTS
 DECEMBER Asian development OUTLOOK SUPPlement HIGHLIGHTS Growth in developing Asia lost some momentum in the second half of but is still roughly in line with projections in Asian Development Outlook. This
WORLD ENERGY OUTLOOK 2014 FACTSHEET How will global energy markets evolve to 2040?
 How will global energy markets evolve to 2040? In the New Policies Scenario, energy demand grows by 37% to 2040 on planned policies, an average rate of growth of 1.1%. Demand grew faster over the previous
U.S. Trade Overview, 2013
 U.S. Trade Overview, 213 Stephanie Han & Natalie Soroka Trade and Economic Analysis Industry and Analysis Department of Commerce International Trade Administration October 214 Trade: A Vital Part of the
Joseph E. Zveglich, Jr.
 Joseph E. Zveglich, Jr. Assistant Chief Economist, Asian Development Bank 1 Overseas Development Institute London, 12 April 2012 Key messages Developing Asia to maintain growth momentum despite weak global
THE GROWING GLOBAL MARKET OF LNG
 THE GROWING GLOBAL MARKET OF LNG ISSUES & CHALLENGES Dr Naji Abi-Aad April 2013 The Growing Global Market of LNG Outline Characteristics of Liquefied Natural Gas (LNG) & its Trade Increasing Volumes of
GLOSSARY ABTC APEC API ASEAN
 GLOSSARY ABTC APEC Business Travel Card Card used by business travellers from APEC member countries to enable visa-free travel between APEC countries and expedited processing at immigration checkpoints.
Child Survival and Equity: A Global Overview
 Child Survival and Equity: A Global Overview Abdelmajid Tibouti, Ph.D. Senior Adviser UNICEF New York Consultation on Equity in Access to Quality Health Care For Women and Children 7 11 April 2008 Halong
Senate Committee: Education and Employment. QUESTION ON NOTICE Budget Estimates 2015-2016
 Senate Committee: Education and Employment QUESTION ON NOTICE Budget Estimates 2015-2016 Outcome: Higher Education Research and International Department of Education and Training Question No. SQ15-000549
Comparison of Electricity Supply and Tariff Rates in South Asian Countries
 Comparison of Electricity Supply and Tariff Rates in South Asian Countries By Faisal Jamil, Energy Specialist (Economics) Introduction A reliable, accessible and affordable supply of energy produced in
disasters Natural Figure 29.1
 29 Natural disasters Many parts of Asia and the Pacific have seen their economic and social development stalled, or even reversed, by natural disasters. Across the region, people have lost their assets,
Central Statistics Office (CSO). Official Communication, 2 May 2007; and past communication.
. Official Communication, 2 May 2007; and past communication.") Key Indicators of Developing Asian and Pacific Countries 419 SOURCES AFGHANISTAN Mining and Index Coal Electricity Central Statistics Office (CSO). Official Communication, 2 May 2007; and past CSO. Official
Key Indicators of Developing Asian and Pacific Countries 419 SOURCES AFGHANISTAN Mining and Index Coal Electricity Central Statistics Office (CSO). Official Communication, 2 May 2007; and past CSO. Official
PARTICIPATION IN SEACEN TRAINING PROGRAMS
 PARTICIPATION IN SEACEN TRAINING PROGRAMS Participation in the training programs is by invitation. Participants of the training programs comprise mainly middle to senior level staff of the 20 SEACEN Regular
Energy Projections 2006 2030 Price and Policy Considerations. Dr. Randy Hudson Oak Ridge National Laboratory
 Energy Projections 2006 2030 Price and Policy Considerations Dr. Randy Hudson Oak Ridge National Laboratory There is perhaps no single current topic so potentially impacting to all life on this planet
Transforming America s Energy Future. Kentucky. Energy Statistics. Developed by
 Transforming America s Energy Future Kentucky Energy Statistics Developed by 2 2 Summary The first edition of Kentucky Energy Statistics is offered by the National Association for State Energy Officials
Table 1: Resource Exports Per cent of total nominal exports; selected years
 Australia and the Global market for Bulk Commodities Introduction The share of Australia s export earnings derived from bulk commodities coking coal, thermal coal and iron ore has increased over recent
GROWTH PROSPECTS SOFTEN FOR DEVELOPING ASIA
 JULY 2015 Asian development OUTLOOK SUPPlement HIGHLIGHTS With the United States contracting in the first quarter and some underperformance within Asia and the Pacific, growth forecasts for developing
ENERGY SECTOR JOBS TO 2030: A GLOBAL ANALYSIS
 ENERGY SECTOR JOBS TO : A GLOBAL ANALYSIS Final report For Greenpeace International Authors Jay Rutovitz, Alison Atherton Institute for Sustainable Futures UTS 2009 Disclaimer While all due care and attention
ICT Development Index (IDI)
") ITU Regional Forum and Training Workshop on Telecommunication/ICT Indicators: Measuring the Information Society and ITU ASEAN Meeting on Establishing National ICT Statistics Portals and Measuring ASEAN
ITU Regional Forum and Training Workshop on Telecommunication/ICT Indicators: Measuring the Information Society and ITU ASEAN Meeting on Establishing National ICT Statistics Portals and Measuring ASEAN
I. World trade developments
 I. World trade developments World merchandise exports grew by 2 per cent in value terms in 2013 while exports of commercial services increased by per cent. Key developments in 2013: a snapshot Trade data
The global economy in 2007
 Introduction The global economy in 27 Global output grew 3.8 percent in 27, receding slightly from 4 percent in 26. The downturn was greatest in high-income economies, where growth fell from 3 percent
The shaded areas of the map represent ESCAP members and associate members.
 ESCAP is the regional development arm of the United Nations and serves as the main economic and social development centre for the United Nations in Asia and the Pacific. Its mandate is to foster cooperation
Working Paper Research Unit Global Issues Stiftung Wissenschaft und Politik German Institute for International and Security Affairs.
 Working Paper Research Unit Global Issues Stiftung Wissenschaft und Politik German Institute for International and Security Affairs Friedemann Müller Paper presented at KAS CFIE CFISAE AHK International
FY2015 Survey on the International Operations of Japanese Firms JETRO Overseas Business Survey
 Japan External Trade Organization FY2015 Survey on the International Operations of Japanese Firms JETRO Overseas Business Survey March 3, 2016 Japan External Trade Organization (JETRO) Table of contents
Energy Megatrends 2020
 Energy Megatrends 2020 Esa Vakkilainen 1 NOTE The data included in the following is mainly based on International Energy Agency's (IEA) World Energy Outlook 2007 IEA is considered the most reliable source
This is a licensed product of Ken Research and should not be copied
 1 TABLE OF CONTENTS 1. Asia-Pacific Insurance Industry 1.1. Industry Introduction 1.2. Asia-Pacific Insurance Market Size by Direct Written Premium, 2005-2012P 1.3. Asia-Pacific Insurance Market Segmentation
DIGITAL, SOCIAL, AND MOBILE IN APAC 2015 WE ARE SOCIAL & IAB SINGAPORE S COMPENDIUM OF ASIA-PACIFIC DIGITAL STATISTICS.
 we are social DIGITAL, SOCIAL, AND MOBILE IN APAC 2015 WE ARE SOCIAL & IAB SINGAPORE S COMPENDIUM OF ASIA-PACIFIC DIGITAL STATISTICS SIMON KEMP WE ARE SOCIAL MARCH 2015 @wearesocialsg 1 @wearesocialsg
Sikh families board a special train in Amritsar, India, to visit pilgrimage sites in Pakistan. Such cooperation between the two countries is limited.
 Sikh families board a special train in Amritsar, India, to visit pilgrimage sites in Pakistan. Such cooperation between the two countries is limited. There have been discussions, but little progress, toward
Trends in Growth and Poverty in Asia: An Economic Background Paper for ASREP
 Trends in Growth and Poverty in Asia: An Economic Background Paper for ASREP Executive Summary, January 2003 This study examines growth and poverty reduction in the six economies that are most significant
AsiaPacific. Oil in Asia and the Pacific: Production, Consumption, Imports, and Policy Options
 Oil in Asia and the Pacific: Production, Consumption, Imports, and Policy Options KANG WU, FEREIDUN FESHARAKI, SIDNEY B. WESTLEY, AND WIDHYAWAN PRAWIRAATMADJA AsiaPacific I S S U E S No. 85 August 2008
International Energy Outlook 2007
 DOE/EIA-0484(2007) International Energy Outlook 2007 May 2007 Energy Information Administration Office of Integrated Analysis and Forecasting U.S. Department of Energy Washington, DC 20585 This publication
Economic Conditions Snapshot, December 2013
 McKinsey Global Survey results Economic Conditions Snapshot, December 03 Executives economic expectations have reached a high for the year, though they expect only mild improvements in 04 and anticipate
Consumer Credit Worldwide at year end 2012
 Consumer Credit Worldwide at year end 2012 Introduction For the fifth consecutive year, Crédit Agricole Consumer Finance has published the Consumer Credit Overview, its yearly report on the international
P R E S S R E L E A S E
 Hong Kong, May 22, 2013 Survey reveals corporate overdue payment in Asia Pacific region deteriorated in 2012 - Companies are less optimistic about recovery of global economy in 2013 A survey of corporate
Doing Business in Australia and Hong Kong SAR, China
 Doing Business in Australia and Hong Kong SAR, China Mikiko Imai Ollison Private Sector Development Specialist Nan Jiang Private Sector Development Specialist Washington, DC October 29, 2013 What does
RECENT TRADE DEVELOPMENTS AND SELECTED TRENDS IN TRADE
 I A RECENT TRADE DEVELOPMENTS AND SELECTED TRENDS IN TRADE RECENT TRENDS IN INTERNATIONAL TRADE 1. INTRODUCTION: THESTATEOFTHEWORLDECONOMYANDTRADE IN 2006 The year 2006 witnessed robust growth in the world
SECTOR ASSESSMENT (SUMMARY): ENERGY. 1. Sector Performance, Problems, and Opportunities
: ENERGY. 1. Sector Performance, Problems, and Opportunities") Country Operations Business Plan: Philippines, 2013 2015 SECTOR ASSESSMENT (SUMMARY): ENERGY 1. Sector Performance, Problems, and Opportunities 1. Challenges. Economic growth has been impeded in the Philippines
Country Operations Business Plan: Philippines, 2013 2015 SECTOR ASSESSMENT (SUMMARY): ENERGY 1. Sector Performance, Problems, and Opportunities 1. Challenges. Economic growth has been impeded in the Philippines
Electricity & Gas Energy & Energy Services
 Electricity & Gas Energy & Energy Services International Development Executive Training Programme for Young Energy Leaders Energy Charter Secretariat Brussels 29 October 2013 César Ortiz Sotelo Deputy
Issue. September 2012
 September 2012 Issue In a future world of 8.5 billion people in 2035, the Energy Information Administration s (EIA) projected 50% increase in energy consumption will require true all of the above energy
2014 BP Madrid forum on energy & sustainability BP 2014
 14 BP Madrid forum on energy & sustainability BP 14 Contents Global energy trends Liquid fuels Refining implications European focus Energy Outlook 35 BP 14 Primary energy consumption growth slows and the
Overview of East Asia Infrastructure Trends and Challenges
 Overview of East Asia Infrastructure Trends and Challenges Christian Delvoie. Director, Knowledge Strategy Group, The World Bank Until September 28: Director, Sustainable Development, East Asia and Pacific
World Energy Outlook 2009. Presentation to the Press London, 10 November 2009
 World Energy Outlook 29 Presentation to the Press London, 1 November 29 The context The worst economic slump since the 2 nd World War & signs of recovery but how fast? An oil price collapse & then a rebound
SECTOR ASSESSMENT (SUMMARY): ENERGY 1
: ENERGY 1") Country Partnership Strategy: Kazakhstan 2012 2016 SECTOR ASSESSMENT (SUMMARY): ENERGY 1 Sector Road Map 1. Sector Performance, Problems, and Opportunities 1. Overview. Oil accounts for about a quarter
Country Partnership Strategy: Kazakhstan 2012 2016 SECTOR ASSESSMENT (SUMMARY): ENERGY 1 Sector Road Map 1. Sector Performance, Problems, and Opportunities 1. Overview. Oil accounts for about a quarter
THE ICSID CASELOAD STATISTICS SPECIAL FOCUS: SOUTH & EAST ASIA & THE PACIFIC (OCTOBER 2015)
") THE ICSID CASELOAD STATISTICS SPECIAL FOCUS: SOUTH & EAST ASIA & THE PACIFIC (OCTOBER 2015) The ICSID Caseload Statistics Special Focus: South & East Asia & the Pacific Region (October 2015) This issue
THE ICSID CASELOAD STATISTICS SPECIAL FOCUS: SOUTH & EAST ASIA & THE PACIFIC (OCTOBER 2015) The ICSID Caseload Statistics Special Focus: South & East Asia & the Pacific Region (October 2015) This issue
Sending Money Home to Asia. Trends and opportunities in the world s largest remittance marketplace
 200 Sending Money Home to Asia Trends and opportunities in the world s largest remittance marketplace The opinions expressed in this study are those of the authors and do not necessarily represent those
Sending Money Home to Asia
 Enabling poor rural people to overcome poverty 100 Sending Money Home to Asia Trends and opportunities in the world s largest remittance marketplace The opinions expressed in this study are those of the
Germany Energy efficiency report
 Germany Energy efficiency report Objectives: 231 TWh of end-user energy savings by 216 Overview 29 2-29 (% / year) Primary intensity (EU=1) 1 99 + -1.3% - CO 2 intensity (EU=1) 16 - -1.6% - CO 2 emissions
WORLDWIDE RETAIL ECOMMERCE SALES: EMARKETER S UPDATED ESTIMATES AND FORECAST THROUGH 2019
 WORLDWIDE RETAIL ECOMMERCE SALES: EMARKETER S UPDATED ESTIMATES AND FORECAST THROUGH 2019 Worldwide retail sales including in-store and internet purchases will surpass $22 trillion in 2015, up 5.6% from
Results of Electricity Sector Restructuring in Chile
 Case Study From 1 Chile is a leader of the privatization movement in South America. In 1986, to meet the growing demand for energy, Chile began restructuring of the state-owned power sector. Before selling
Introduction. So, What Is a Btu?
 Introduction The way of life that we Americans take for granted every day depends upon a stable and abundant supply of affordable energy. Energy shortages can quickly affect our everyday lives and harm
World Energy Outlook. Dr. Fatih Birol IEA Chief Economist Paris, 27 February 2014
 World Energy Outlook Dr. Fatih Birol IEA Chief Economist Paris, 27 February 2014 The world energy scene today Some long-held tenets of the energy sector are being rewritten Countries are switching roles:
List of tables. I. World Trade Developments
 List of tables I. World Trade Developments 1. Overview Table I.1 Growth in the volume of world merchandise exports and production, 2010-2014 39 Table I.2 Growth in the volume of world merchandise trade
Natural Gas in Asia: History and Prospects
 Natural Gas in Asia: History and Prospects Mikkal Herberg Advance Summit paper from the 2011 Pacific Energy Summit, held February 21-23, 2011, in Jakarta, Indonesia. Available from www.nbr.org. For more
Effect of Increased Natural Gas Exports on Domestic Energy Markets
 Effect of Increased Natural Gas Exports on Domestic Energy Markets as requested by the Office of Fossil Energy January 2012 This report was prepared by the U.S. Energy Information Administration (EIA),
II. Merchandise trade
 II. Merchandise trade Merchandise trade increased by 5 per cent in volume in 211. The strongest momentum was achieved by trade in manufactured goods, which grew by.5 per cent. Key developments in 211:
The Burden of Cancer in Asia
 P F I Z E R F A C T S The Burden of Cancer in Asia Medical Division PG283663 2008 Pfizer Inc. All rights reserved. Printed in USA/December 2008 In 2002, 4.2 million new cancer cases 39% of new cases worldwide
Future possible uses of renewable energy in the V4 countries
 Future possible uses of renewable energy in the V4 countries Róbert Magda Szent István University Institute of Economics, Law and Methodology, Department of Microeconomics Páter Károly út 1. H-2100 Gödöllő,
2004-2008. Geographic Trend Report for GMAT Examinees
 2004-2008 Geographic Trend Report for GMAT Examinees Geographic Trend Report for GMAT Examinees This Asian Geographic Trend Report for GMAT Examinees identifies migratory trends among GMAT examinees applying
1. Electricity production in the world: general forecasts
 Fifteenth inventory 2013 edition Worldwide electricity production from renewable energy sources Stats and figures series This inventory was carried out by Observ ER and Fondation Énergies pour le Monde
WORLD ENERGY INVESTMENT OUTLOOK 2014 FACTSHEET OVERVIEW
 OVERVIEW More than $1.6 trillion was invested in 2013 in energy supply, a figure that has more than doubled in real terms since 2000, and a further $130 billion to improve energy efficiency. Renewables
Fifty years of Australia s trade
 Fifty years of Australia s trade Introduction This edition of Australia s Composition of Trade marks the publication s 50th anniversary. In recognition of this milestone, this article analyses changes
GLOBAL RENEWABLE ENERGY MARKET OUTLOOK 2013
 GLOBAL RENEWABLE ENERGY MARKET OUTLOOK 213 FACT PACK GUY TURNER HEAD OF ECONOMICS AND COMMODITIES APRIL 26, 213 GLOBAL RENEWABLE ENERGY MARKET OUTLOOK, 26 APRIL 213 1 INTRODUCTION This year s Global Renewable
PARTNER COUNTRY SERIES. Developing a Natural Gas Trading Hub in Asia. Obstacles and Opportunities
 PARTNER COUNTRY SERIES Developing a Natural Gas Trading Hub in Asia Obstacles and Opportunities PARTNER COUNTRY SERIES Developing a Natural Gas Trading Hub in Asia Obstacles and Opportunities Warner ten
Brisbane Mining Club June Lunch 2014 David Knox Managing Director & CEO, Santos Limited
 Brisbane Mining Club June Lunch 2014 David Knox Managing Director & CEO, Santos Limited Thursday, 5 June Brisbane Ladies and Gentlemen Thank you for inviting me here today. Today I want to talk to you
I. World trade developments
 I. World trade developments World merchandise exports stagnated in value terms in 2012 while exports of commercial services increased by 2 per cent. Key developments in 2012: a snapshot Trade data List
Draft Discussion Paper Asia-Pacific High-Level Consultation on Financing for Development
 Draft Discussion Paper Asia-Pacific High-Level Consultation on Financing for Development Jakarta, Indonesia 29-30 April 2015 Infrastructure Financing, Public-private Partnerships, and Development in the
Global Student Mobility 2025 Forecasts of the Global Demand for Pathways to Higher Education in the Schools, VET and ELICOS sectors
 Global Student Mobility 2025 Forecasts of the Global Demand for Pathways to Higher Education in the Schools, VET and ELICOS sectors Andrew Hewett IDP Education Australia Agenda and Key Issues Pathways
A Cheaper Renewable Alternative for Belarus
 A Cheaper Renewable Alternative for Belarus Issue paper from INFORSE-Europe 1, by Gunnar Boye Olesen, July 2011 Summary Following the increasing fossil energy prices, the country of Belarus is struggling
Comparisons of Health Expenditure in 3 Pacific Island Countries using National Health Accounts
 Comparisons of Health Expenditure in 3 Pacific Island Countries using National Health Accounts Hopkins Sandra* Irava Wayne. ** Kei Tin Yiu*** *Dr Sandra Hopkins PhD Director, Centre for International Health,
CSCAP MEMORANDUM No. 15 The Security Implications of Climate Change
 CSCAP MEMORANDUM No. 15 The Security Implications of Climate Change A Memorandum from the Council for Security Cooperation in the Asia Pacific (CSCAP) June 2010 CSCAP Memorandum No. 15 The Security Implications
Globalization and International Trade
 12 Globalization and International Trade Globalization refers to the growing interdependence of countries resulting from the increasing integration of trade, finance, people, and ideas in one global marketplace.
Energy supply and consumption
 Energy 2014 Energy supply and consumption 2014, 2nd quarter Total energy consumption fell by 7 per cent in January to June According to Statistics Finland's preliminary data, total energy consumption in
Weiqiao Textile Announces its 2015 Interim Results
 Weiqiao Textile Announces its 2015 Interim Results Seize new opportunities in new normal development phase Continued leadership against the backdrop of industry changes Financial Summary Revenue was approximately
Overview of Asian Insurance Markets
 Overview of Asian Insurance Markets Simon Walpole Session Number: TPS2 Joint IACA, IAAHS and PBSS Colloquium in Hong Kong www.actuaries.org/hongkong2012/ Market Ranking in Asia Notes: 1. Colored boxes
How To Predict The Development Of Developing Asia
 ASIAN DEVELOPMENT OUTLOOK 2015 FINANCING ASIA S FUTURE GROWTH HIGHLIGHTS ASIAN DEVELOPMENT BANK ASIAN DEVELOPMENT OUTLOOK 2015 Financing asia s future GROWTH HIGHLIGHTS VELOPMENT ASIAN DEVELOPMENT BANK
London, 10 November 2015
 London, 10 November 2015 The start of a new energy era? 2015 has seen lower prices for all fossil fuels Oil & gas could face second year of falling upstream investment in 2016 Coal prices remain at rock-bottom
Facilitating Economic Integration in Asia-Pacific through Aid for Trade. 23 April 2014 // Tunis Mia Mikic Teemu Alexander Puutio
 Facilitating Economic Integration in Asia-Pacific through Aid for Trade 23 April 2014 // Tunis Mia Mikic Teemu Alexander Puutio ODA finally on the rebound Globally development aid rose by 6.1% in real
McKinsey on Oil & Gas
 McKinsey on Oil & Gas Capturing value in global gas: Prepare now for an uncertain future There is huge uncertainty about how global gas markets will evolve, but the extent of the value at stake makes it
Adding fuel to the fire North America s hydrocarbon boom is changing everything. Steven Meersman. Roland Rechtsteiner
 Adding fuel to the fire North America s hydrocarbon boom is changing everything Steven Meersman Mark Pellerin Roland Rechtsteiner What if the gasoline that you put in your car came from natural gas instead
energy [r]evolution A Sustainable World Energy Outlook
![energy [r]evolution A Sustainable World Energy Outlook](/thumbs/34/13124261.jpg "energy [r]evolution A Sustainable World Energy Outlook") energy [r]evolution A Sustainable World Energy Outlook Wolfram Krewitt 1th Annual Renewable Energy and Energy Efficiency Expo June 14, 27 Washington Folie 1 > Vortrag > Autor It is not important to predict
energy [r]evolution A Sustainable World Energy Outlook Wolfram Krewitt 1th Annual Renewable Energy and Energy Efficiency Expo June 14, 27 Washington Folie 1 > Vortrag > Autor It is not important to predict
SECTOR ASSESSMENT (SUMMARY): ENERGY 1
: ENERGY 1") Country Partnership Strategy: Uzbekistan 2012 2016 SECTOR ASSESSMENT (SUMMARY): ENERGY 1 Sector Road Map 1. Sector Performance, Problems, and Opportunities 1. The energy sector underpins Uzbekistan s sustained
Country Partnership Strategy: Uzbekistan 2012 2016 SECTOR ASSESSMENT (SUMMARY): ENERGY 1 Sector Road Map 1. Sector Performance, Problems, and Opportunities 1. The energy sector underpins Uzbekistan s sustained
Ghana South Korea United States. Real GDP per capita (2005 dollars) Per centage of 1960 real GDP per capita. 2009 real GDP per capita
 Per centage of 1960 real GDP per capita. 2009 real GDP per capita") Long-Run Economic Growth chapter: 24 9 ECONOMICS MACROECONOMICS 1. The accompanying table shows data from the Penn World Table, Version 7.0, for real GDP in 2005 U.S. dollars for Argentina, Ghana, South
Long-Run Economic Growth chapter: 24 9 ECONOMICS MACROECONOMICS 1. The accompanying table shows data from the Penn World Table, Version 7.0, for real GDP in 2005 U.S. dollars for Argentina, Ghana, South
Please address your inquiries to balances@iea.org.
 Excerpt from: ii - EXCERPT FROM ENERGY BALANCES OF OECD COUNTRIES (215 edition) The following analysis is an excerpt from the publication Energy Balances of OECD Countries (215 edition). Please note that
Service Specifications
 Service Specifications 1. Title Information service concerning politics, economies, and industries of developing countries and regions 2. Description of the service Offering country risk reports on a daily
The Outlook for Nuclear Energy In a Competitive Electricity Business
 1776 I STREET N.W. SUITE 400 WASHINGTON, D.C. 20006 202.739.8000 The Outlook for Nuclear Energy In a Competitive Electricity Business Executive Summary: Nuclear Units Competitive, Profitable in Deregulated
I. World trade developments
 I. World trade developments The value of world merchandise exports increased by 20 per cent in 2011 while exports of commercial services grew by 11 per cent. Key developments in 2011: a snapshot Trade
AUSTRALIA S EXPORTS OF EDUCATION SERVICES 1
 AUSTRALIA S EXPORTS OF EDUCATION SERVICES 1 Introduction Australia s education services exports have continued to grow in importance this decade. Since 1982, education services exports have grown at an
Keisuke Sadamori Director, Energy Markets and Security International Energy Agency Kuala Lumpur, 8 October
 Keisuke Sadamori Director, Energy Markets and Security International Energy Agency Kuala Lumpur, 8 October The context Southeast Asia is a key pillar of Asia s growth A mix of countries with disparate
ASIAN DEVELOPMENT OUTLOOK SUPPLEMENT
 JULY 2016 ASIAN DEVELOPMENT OUTLOOK SUPPLEMENT HIGHLIGHTS Developing Asia s prospects remain largely in line with forecasts in Asian Development Outlook 2016, despite disappointing growth in the United
Australia s position in global and bilateral foreign direct investment
 Australia s position in global and bilateral foreign direct investment At the end of 213, Australia was the destination for US$592 billion of global inwards foreign direct investment (FDI), representing
EXPERT MEETING on. Geneva, 24-25 September 2007. Foreign Direct Investment in Vietnam. Ms. Le Hai Van
 EXPERT MEETING on COMPARING BEST PRACTICES FOR CREATING AN ENVIRONMENT CONDUCIVE TO MAXIMIZING DEVELOPMENT BENEFITS, ECONOMIC GROWTH AND INVESTMENT IN DEVELOPING COUNTRIES AND COUNTRIES WITH ECONOMIES
Natural Gas and LNG Business Today and Tomorrow
 Natural Gas and LNG Business Today and Tomorrow September 7, 2011 Mitsubishi Corporation Energy Business Group Junichi Iseda Senior Vice President, Division COO Natural Gas Business Division B Part 1:
BP Energy Outlook 2035
 BP February 215 bp.com/energyoutlook #BPstats Disclaimer This presentation contains forward-looking statements, particularly those regarding global economic growth, population growth, energy consumption,