Experiment 17. Group 728. Advanced Laboratory in Physics. (Holography) Author: Kay Jahnke Mail: Signature:...
|
|
|
- Derek Bradford
- 8 years ago
- Views:
Transcription
1 Experiment 17 (Holography) Group 728 Advanced Laboratory in Physics Author: Kay Jahnke Mail: Signature:... Author: Matthias Hocker Mail: Signature:... Adviser: Fengzhen Zhang Date of the experiment: Date of the disposal:

2 Contents 1 Theoretical Basics Maxwell Equations The wave character of the light Plane waves spherical waves Bessel waves Interference and Intensity Coherence Time Coherence Spacial Coherence Laser Holography Double-Exposure Procedure Conguration Digital In-line-Holography O-axis-Holography Results Digital In-line-Holography Hair TEM nets AFM-Cantilever O-axis holography Deformation of a sheet metal Rotation of a metal plate Appraisal of results In-line holography O-axis holography References 16 2

3 1 Theoretical Basics 1.1 Maxwell Equations In this experiment we produce Holograms using coherent light. But rst we have to make clear, what light is: Light has both a particle as well as a wave character. In our experiment we use light to do some interference eects so only the waves are important for us. Thats the reason, why we discuss only waves in this report. The light is an electromagnetic wave that is determined by the Maxwell Equations. This equations look the following way: div D = ρ (1) div B = 0 (2) rote = B t roth = j + D t With this four equations you can describe the behavior of every magnetic or electric eld. The rst equation says, that an electric eld is produced by charges. The second equation makes the statement there are no sources and drains in a magnetic eld, so all magnetic eld lines are closed. The statement of the third equation is that an changing magnetic eld produces a magnetic invertebrate eld. In the last equation you can see that a oating current or a change in the electric eld causes an electric invertebrate eld. To have a context between the Maxwell Equations you need the two material equations: (3) (4) D = ɛ 0 ɛr E (5) B = µ 0 µr H (6) ɛ r and µ r are tensors whose appearance depends on the material the magnetic and electric elds are in. In pure vacuum this tensors are the unity matrix. To make it easier to solve the equations the material equations are often projected in one direction, so all the components become the character of a scalar. 1.2 The wave character of the light Now we have some equations that determine the behavior of magnetic and electric elds in general, but how can we evaluate the propagation of the light waves from that? You can get a meaningful dierential equation if you use the rot operation once more on equation (4) and say that you are in vacuum with no current at all: rot(rote) = rot B t = t rot B = 1 D µ 0 t t = 1 2 E µ 0 ɛ 0 t 2 (7) 3

4 The rot(rot E) can be written as E because rot rot = grad div and dive = 0 in pure vacuum. In the End you get the equation: E = 1 2 E µ 0 ɛ 0 t 2 = 1 c 2 2 E t 2 (8) This is the dierential equation which has many dierent possible solutions. Here we will present the three most important kinds of solutions: Plane waves The easiest kind of solutions are the plane wave which can be described in the following way: E( r, t) = E 0 exp(i( k r ± ωt)) k r = const (9) This waves are not localized in space and propagate into the direction k with the velocity c = ω k. The wave fronts of the wave are planes if you look at them at a constant time. That's why they are called plane waves. The waves have a minus in the exponent if the wave is propagating in the direction of the wave vector k and they have a plus if the are propagating against the direction of k spherical waves Apart from Cartesian coordinates their are other coordinates systems. An important one are the spherical coordinates, because they t perfectly into the Huygens principle. This principle says that you can construct every wave by starting new spherical waves on the whole wave front. The transformation from Cartesian coordinates to spherical coordinates is: x = r sin θ cos φ (10) y = r sin θ sin φ (11) z = r cos θ (12) The spherical waves have a spherical symetrie, so the propagation in every direction is the same and you only need to evaluate the part of the equation which depends on the distance from the source of the wave. When you put the transformation on equation (8) you get: r 2 (r E(r, t)) = 1 c 2 (r E(r, t)) (13) t2 The solution of that is: E(r, t) = E 0 exp(i(k r ωt)) (14) r with the relation c = k/ω. As you can see the amplitude of this wave is E 0 /r. This means that the wave gets weaker as the distance from the source becomes bigger. 4
 = E 0 exp(i( k r ± ωt)) k r = const (9) This waves are not localized in space and")
5 1.2.3 Bessel waves The third form of waves we want to discuss here are Bessel waves. This waves have a certain characteristic: they can propagate without diraction. That means that intensity distribution in the direction of their propagation is independent from the intensity distribution in the plane upright to the direction of the propagation. The easiest solution of these waves have the form: E(r, t) = E 0 J 0 (αρ) exp(i(β z ωt)) (15) with the parameters: β 2 = k 2 α, β 0, 0 < α k = 2π/λ, ρ 2 = x 2 + y 2, r = (x, y, z) J 0 is the Bessel equation to the index 0. In general Bessel equations are dened in the following way: ( 1) r ( ) x 2r+n 2 J n (x) = (16) Γ(n + r + 1)r! while the Bessel equation to the index 0 is relatively easy dened as: r=0 J 0 (x) = 1 π π 0 e i x sin ξ dξ (17) The Bessel wave transforms itself into a plane wave, if you set the parameter α = Interference and Intensity Until now we only had a look on the electric eld of the light wave but our eye and the common detectors can not detect this fast oscillating eld. What we see is the intensity of the light. In general the intensity of any wave is dened as energy per area per time. For the light we dene the intensity as: I( r, t) = E( r, t) E( r, t) = E( r, t) 2 (18) This intensity is time dependent because the electric eld is oscillating. But this oscillation is so fast that our eyes and the most of the detector can not resolve it. We can only see the time average of the intensity which can be written as: I( r) = 1 T T/2 T/2 E( r, t 2 dt (19) T is the duration the detector or the eye needs to register the intensity. When the waves of two dierent rays of light are in the same time in the same space there are two situations, at which the rst is only a special case of the second one: 1.) If between the waves of the two rays there is no constant phase respectively the intensities of the two rays are simple add. This is for example the case, if you focus the light of two light bulbs in on spot. 5
 r ( ) x 2r+n 2 J n (x) = (16) Γ(n + r + 1)r!")
6 2.)If between the waves of the two rays there is a constant phase respectively you have to add the two electric elds. I(t) = E 1 (t) + E 2 (t) 2 = E 1 (t) 2 + E 2 (t) 2 + E 1 (t)e 2 (t) cos Θ (20) Θ represents the angle between the two rays. As you can see in equation (20) there are two terms where you simply add the intensity but there is also the third term which causes the interference. When the phase dierence φ between the waves is φ = 0 the resulting intensity is high but when the dierence is φ = π the waves annihilate each other and you can only see darkness. 1.4 Coherence When the waves of two rays of light have a constant phase respectively they are call coherent. The phase respectively can only be constant if the two waves are from the same source out of the same emission tact. For the practical use you dene two dierent kinds of coherence you can measure directly: Time Coherence The time of one emission tact is nite. The Time Coherence is dened as the time τ in which the phase dierence between two waves is smaller then ϕ = 2π. In the sunlight or the light of a light bulb this Time Coherence is very small, for the sun it is in the area of τ = 1ns. That means for the experimenter that it is complicated to do inference eect with such an incoherent light source Spacial Coherence Spacial Coherence means that the dierence of the ways two rays go must be so small, that the phase dierence is smaller than ϕ = 2π. The length in which a laser beam is coherent is called coherence length l c. For sunlight the coherence length is in the area of few micrometers but for lasers the coherence length may be up to a couple of kilometers. The best way to measure the Spacial Coherence is to use a Michelson Interferometer. The light from the source is split into two rays at the Beam Splitter. One ray is reected by the stationary mirror and reected back to the Beam Splitter from where it runs to the detector. The second ray is reected by the moving mirror back to the Beam Splitter and also runs into the detector. Now you can variegate the location of the moving mirror to change the way dierence between the two rays. If the way dierence is smaller than the coherence length you will get interference in the detector. But if it is larger than the coherence length the intensities will simply be added and you only get one bright dot. 6

7 Figure 1: The design of the Michelson Interferometer [2] 1.5 Laser To have a large coherence length, we use a laser as light source for our experiments. The word Laser is articial and only a simplication for the expression "`Light Amplication by Stimulated Emission of Radiation"'. The most simple concept of a laser contains only three dierent parts: ˆ The gain medium is a transparent material that emits the the photons which build up the laser beam. ˆ It has to be supplied with power by a pump light. ˆ befor the light leaves the laser it is reected inside through the gain medium by an optical cavity. 7

8 Figure 2: Energy levels of a laser [3] The pump light lifts the electrons from the basic energy level E 0 to the higher level E 3. this level has a very short lifetime and falls back into the level E 2 very fast. The upper laser level E 2 has a relatively long lifetime whilst the lower laser level E 1 has a short lifetime additionaly the electrons fall very fast from E 1 to E 0. With this conditions we have a population inversion between E 2 and E 1. This is one of the conditions for stimulated emission. The second condition is, that there is an other photon in the same space as the excited electron with the exact energy of hν = E = E 2 E 1. This condition can be fullled by photons that are reected by the optical cavity and run through the gain medium several times. If it is possible for the experimenter to get the stimulated emission to dominate over the spontaneous emission the light in the medium is amplied and you get a strong coherent beam, because the photon emitted by the stimulated emission has the exact same phase as the original photon. 8

9 1.6 Holography Holography was invented in 1947 by the physicist Dennis Gabor. He developed a method to improve the resolution in the microscopy. Because of the early time, laser had not been invented jet, so he used a mercury arc lamp as light source. The light had a pretty small coherence length, so his results were not of a good quality, but he could show that the concept would work. To produce his hologram he use the In-Line-Holography, as we call it nowadays: Figure 3: Design of the apparatus to produce an In-Line-Hologram [4] In this kind of holography you position the laser, the object and the photo plate on which you want to capture the hologram in one line. The waves of the coherent beam are scattered on the object. This means with the Huygens principle there are starting new elementary wave fronts from the surface of the object. This new waves have other phases then the original reference wave. So when the reference wave and the elementary waves meet on the photo plate there might be an interference. The condition for interference is that the depth of the object is maximal the size of the coherence length. To reconstruct the hologram, you rst have to develop the photo plate. Then you can hold the plate in the pure reference beam and look at it from the back of the photo plate. Now you can see the hologram as a 3D image of the original object. If you change your perspective the picture changes too. This is because in the hologram all the informations about the absolute intensity and the wavelength as well as the informations about the phase of the object are saved. In contrast in a conventional picture only the information about the intensity and the 9

10 wavelength is saved while you loose every information about the phase. Because you use interference eects to reconstruct your picture there is an other new eect in hologram: you can cut the hologram into pieces and every piece contains the information about the whole object. But by cutting the hologram in pieces you loose intensity as well as resolution when reconstructing the object. After the discovery of the laser in the year 1960 the quality of the holograms became much better. And in 1963 E. Leith and Upatnjeks invented a new, better way to produce holograms: the O-Axis-Procedure. Figure 4: Design of the apparatus to produce an O-Axis-Hologram [5] In the O-Axis-Holography You use a Beam Splitter to separate the reference beam from the object beam. It is advantageous to adjust the Beam Splitter in a way that the object beam has a higher intensity then the reference beam, because the object beam looses a lot of his intensity when it is scattered on the object. With this design you can take holograms of much bigger objects then with the In-Line- Holography. An other advantage is, that you have only one, the real picture, and not an overlay of the real and the virtual picture, you would have with the In-Line-Holography. Due to this advantages the O-Axis-Holography is used for very accurate measurements. In the following we will discuss the method we used to measure small deformations of a bar and the rotation of a metal object. 10

11 1.6.1 Double-Exposure Procedure In the Double-Exposure Procedure you rst take a hologram of the object with the O- Axis-Holography. then then you change the object a bit and take an other hologram on the same photo plate as the rst. You have to be careful and do only very small changes in the area of the wavelength of the light you use, because otherwise you can not measure the interference eects. In this experiment we rst will deform a bar out of metal. Now we want to derive a formula which tells us how big was the deformation when we know the interference stripes. Let E 1 and E 2 be the amplitudes of the electric elds of the two rays (reference wave and object wave): E 1 = Ee iϕ 1 E 2 = Ee iϕ 2 (21) The intensity I is proportional the square of the the sum of the amplitudes of the electric elds. So you get: I = 2E 2 (1 + cos(ϕ 2 ϕ 1 )) (22) The dierence ϕ 2 ϕ 1 is the phase dierence between the two waves and named ϕ. To express the phase dierence in terms of the deformation we say that the movement is upright to the surface and Θ 1 and Θ 2 are the angle of incidence and the emergent angle measured from normal of the surface. You get for the way dierence of the two waves: d = D(cos Θ 1 + cos Θ 2 ) (23) While D is the movement of the surface. For the phase dierence you get from this: φ = 2π λ D(cos Θ 1 + cos Θ 2 ) (24) When you put this in the formula for the intensity, you get: ( )) 2π I = 2E (1 ( 2 + cos λ D(cos Θ 1 + cos Θ 2 ) = 4E 2 cos 2 π ) λ D(cos Θ 1 + cos Θ 2 ) (25) So, the intensity is proportional to cos 2 (x), while x is proportional to the movement. So we can conclude that the movement for two interference stripes is: D = When you count N stripes on the bar, the deformation is: For the rotation of the object you get the relation: λ cos Θ 1 + cos Θ 2 (26) λ D = N (27) cos Θ 1 + cos Θ 2 α = N r λ cos Θ 1 + cos Θ 2 [rad] (28) 11

12 2 Conguration 2.1 Digital In-line-Holography Figure 5 shows the schematic conguration of the digital in-line-holography. The laserbeam projects the object onto the screen. This image of the object is taken by a digital camera. Afterwards, another picture of the screen without the object is taken as reference. For technical reasons, the images are converted to greyscale. Then, the hologram is reconstructed by a computer. Because the distance between the object and the laser is not known exactly, we let the software calculate with a range of 2 millimeters. At the end, the best image is selected from the 50 calculated holograms. The quality of the pictures is evaluated by the sharpness of the edges of the three dierent objects. We have taken the holograms of three dierent objects. An hair, an AFM cantilever and a TEM nets. The width of the screen is known, so we can calculate the scale of the resulting hologram. With this scale, the parameters of the lattice and the dimensions of the candelabra can be measured in the digital hologram. 2.2 O-axis-Holography In gure 6, the schematic conguration for the o-axis holography is shown. The laser beam is splitted into two parts: The major beam goes straight through the splitter and illuminates the object, we want to image. The beam is scattered at the surface of the object. The scattered light exposures a photoplate. The minor part of the laser exposures the photoplate directly without any scattering. This is the reference beam. The interference of the two laser beams creates the hologram on the photoplate. Then the photoplate has to be processed before the hologram can be seen. To display the image, the photoplate is illuminated with an unsplitted laserbeam. 3 Results 3.1 Digital In-line-Holography In the digital hologram, the dimensions of the pictured object can be measured in pixels. To get the scale to calculate the real dimensions in SI-units, we need one xed dimension in the image. The real width of the square is 10.0 cm. The width of the digital image (not the hologram) is 2048 pixels, the height 1536 pixels. With the software ImageJ, we measured the width of the screen in pixels in the image as well. So we can set up the following equation: 10 cm 1950 px = x 2048 px = y 1536 px (29) where x and y are the dimensions in cm of the real image on the screen. To reconstruct the holograms on the computer we need also the distances between the laser and the object, and between the object and the screen. The distance between the laser and the screen constitutes 42.7 cm. For the distance between the laser and the 12

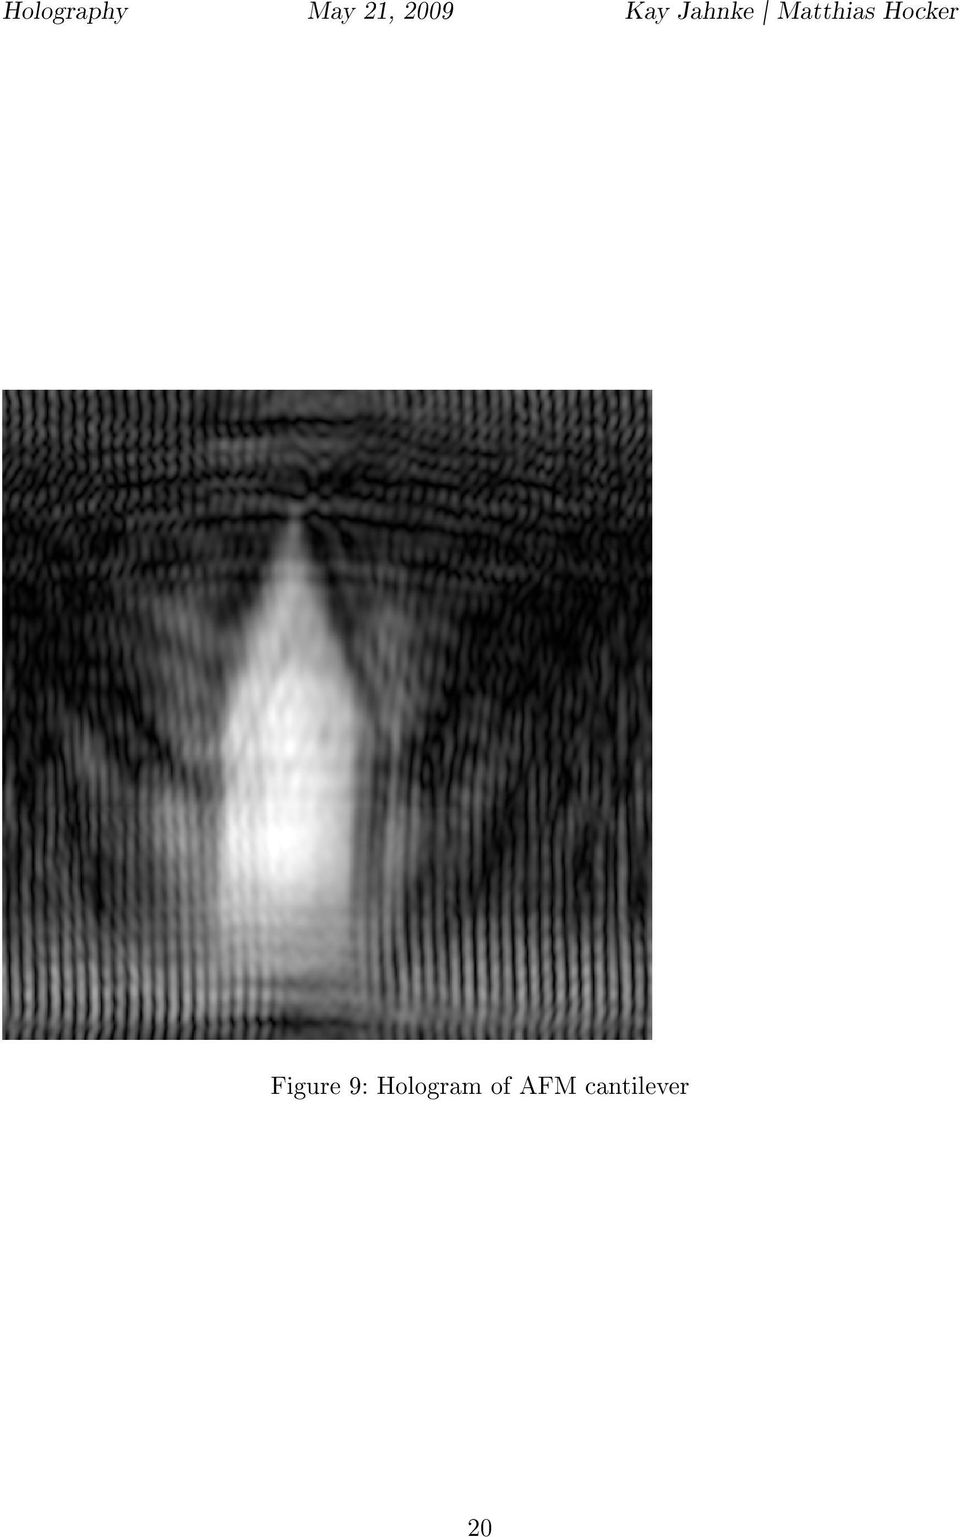
13 object, we could only approximate the value. For all of the three measurements, we approximated a value of 0.1 cm. The program which reconstructs the hologram, oers the possibility to input a range for this distance. We took a range from 0.0 cm to 0.2 cm and let the program calculate the holograms in 50 steps. Afterwards, the best image could be chosen. The last measurements we need are the dimensions of the backwards projection of the screen into the layer of the object. We can set up a simple equation via the ratios: x x = y y = 0.1 cm 42.7 cm (30) where x and y are the dimensions of the projection. The others variables are the same as in (29) above. The 0.1 cm are the distance between object and laser. Latter value can be calculated more exactly afterwards by choosing the best of the 50 reconstructed holograms. Later, we want to measure the dimensions of the pictured objects. The values v are measured in pixels with the software ImageJ again. The image size of the digital hologram is pixels, so the real size S of our object in cm is: Hair S = x v 512 px (31) Figure 7 shows the digital reconstructed hologram of one hair. With ImageJ we can measure the thickness of the hair. The average of 5 measurements is pixel with 2.9 pixels of standart deviation. So we get a real thickness of the hair of (1.134 ± 0.066) 10 4 m. In some cases one can reconstruct the hologram one more time from the rst hologram. But this second iteration of reconstruction was not useful in this case TEM nets Figure 8 shows the hologram of a TEM (transmission electron microscope) nets. In the hologram we measured the distances between the two outer edges and the distance between the two inner edges of one notch of the lattice. The results are: ˆ ˆ Distance of inner edges: (5.56 ± 0.29) 10 5 m Distance of outer edges: (14.47 ± 0.65) 10 5 m AFM-Cantilever In gure 9, the hologram of a AFM (atomic force microscope) cantilever is shown. We measured the height, the width and the angle at the top of the object. The height is only the height of the visible part of the cantilever. The results are: ˆ Width: (5.25 ± 0.36) 10 5 m 13
 where x and y are the dimensions of the projection. The others variables are the same as in (29) above. The 0.")
14 ˆ Height: (8.52 ± 0.45) 10 5 m ˆ Top angle: ± 3.92 Because the top angular doesn't have to be converted, the error is represented by the standard deviation. 3.2 O-axis holography The rst hologram we created was a simple intake of a little motorbike without changing at the object during the exposure time. The exposure time was about 2 minutes. We expected a good quality of the hologram but the result was not usable. Only some edges can be seen in the hologram. At the image of taken with the same digital camera as in the in-axis apparatus, nothing can be seen, except the diuse red light from the laserbeam. The quality of the other holograms was much better than this one and can be used to decree the deformation and the rotation of the two objects Deformation of a sheet metal A small sheet metal was xed at the bottom. We used the double-exposure procedure to measure the deformation caused by a micrometer calliper. The sheet metal is exposured twice: First one minute in the original state, the second time after the deformation. Figure 10 shows the resulting hologram. By counting the stripes caused by the interference, the deformation D of the sheet metal can be calculated. From the top to the button of the sheet, 28 stripes can be counted. Because of the very weak contrast at the button of the sheet, we dene the individual error of this number as 2 for the calculation of the maximum deviation. The two angles are: Θ 1 = 10 ± 3 and Θ 2 = 30 ± 3. So we get a deformation: D = N λ sin Θ 1 + sin Θ 2 = (9.57 ± 0.87) 10 6 m (32) The wave length λ of the laser is nm, N is the number of interference stripes. The error is calculated by: D = λ N λ N + cos Θ 1 + cos Θ 2 (cos Θ 1 + cos Θ 2 ) 2 ( sin Θ 1 Θ 1 + sin Θ 2 Θ 2 ) Rotation of a metal plate The conguration of the experiment is the same as for the deformation measurement. Instead of the deformation, the plate was turned a very small angle between the two exposures. The illumination of the plate is much more equable than the illumination of the sheet metal. The interference stripes can be counted exactly. Figure 11 shows the digital image of the hologram. So we get an angle (in radian): D = N r (33) λ cos Θ 1 + cos Θ 2 = (3.42 ± 0.12) 10 4 rad (34) 14

15 where N = 60 is the number of stripes again and r = 60 mm the width of the object. The other parameters are the same like in the calculation for the deformation of the sheet metal. The error is: D = N r λ cos Θ 1 + cos Θ 2 4 Appraisal of results 4.1 In-line holography ( sin Θ1 Θ 1 + sin Θ 2 Θ 2 cos Θ 1 + cos Θ 2 + N N + r ) r The normal thickness of a hair is between 0.04 and 0.12 millimeters 1 (full developed hairs). The diameter of the hair we measured is about 0.11 millimeters. So our calculated value is realistic. For the other two object, we haven't got other values to compare with. But compared with the diameter of the hair, these values seem to be in a realistic range. The quality of the in-axis holography is not very good. Some things of the conguration of the experiment can be improved: The screen where the image of the object and the reference image are projected, is not very plain. There are some scratches and blains in it. The fastening of the digital camera is not very tight, so that the camera can tilt over a bit while the releaser is pressed or the conguration of the camera is manipulated. The software we used oers the possibility to recalculate the hologram with the new parameters got from the rst calculated image. But in none of our three holograms the second calculation resulted in an usable new image. 4.2 O-axis holography The quality of the rst hologram of the motorbike was very bad. One can see only some edges from the top of the object. The contrast between the scattered light and the reference beam seems to be very low. Maybe the problem can be solved by moving the motorbike closer to the photoplate where the hologram is taken, so that more scattered light illuminates the photoplate. The other holograms are much more useable. The objects are imaged clearly and the interference stripes can be seen well. Only at the bottom of the sheet metal, the contrast is weak again, so we calculated with a deviation of 2 for the number of stripes. On the plate which was rotated a bit, the stripes can be counted easily because the contrast is very good and the edges are sharp enough to distinguish between bright and dark stripes. The most inexact values are likely the two angles Θ 1 and Θ 2 in the last two measurements. Maybe it would be helpfull to draw a line onto the table under the parts of the assembling so the second angle could be measured more exactly. (35) 1 from: [6] 15

16 5 References References [1] Holographic Nondestructive Testing: Robert K. Erf; Academic Press, Inc.; Orlando, Florida: 1974 [2] [3] [4] [5] [6] 16
![chemgapedia.de/vsengine/media/vsc/de/ch/13/pc/spektroskopie/spektrometer/laser/ima 10.05.09 [4] http://www.physics.nyu.](/docs-images/52/12085977/images/page_16.jpg "edu/grierlab/index10b/img19.png, 10.05.09 [5] http://mikelow.net/notebook/pics/holography.jpg, 10.05.09 [6] http://de.wikipedia.")
17 Figure 5: Schematic conguration for digital in-line-holography Figure 6: Schematic conguration for o-axis-holography 17

18 Figure 7: Hologram of an hair 18

19 Figure 8: Hologram of a TEM nets 19

20 Figure 9: Hologram of AFM cantilever 20
21 Figure 10: Hologram of a deformed sheet metal with double-exposure procedure 21
22 Holography May 21, 2009 Kay Jahnke Matthias Hocker Figure 11: Hologram of rotated plate, recorded with double-exposure procedure 22
Interference. Physics 102 Workshop #3. General Instructions
 Interference Physics 102 Workshop #3 Name: Lab Partner(s): Instructor: Time of Workshop: General Instructions Workshop exercises are to be carried out in groups of three. One report per group is due by
AP Physics B Ch. 23 and Ch. 24 Geometric Optics and Wave Nature of Light
 AP Physics B Ch. 23 and Ch. 24 Geometric Optics and Wave Nature of Light Name: Period: Date: MULTIPLE CHOICE. Choose the one alternative that best completes the statement or answers the question. 1) Reflection,
Fundamentals of Electromagnetic Fields and Waves: I
 Fundamentals of Electromagnetic Fields and Waves: I Fall 2007, EE 30348, Electrical Engineering, University of Notre Dame Mid Term II: Solutions Please show your steps clearly and sketch figures wherever
EXPERIMENT O-6. Michelson Interferometer. Abstract. References. Pre-Lab
 EXPERIMENT O-6 Michelson Interferometer Abstract A Michelson interferometer, constructed by the student, is used to measure the wavelength of He-Ne laser light and the index of refraction of a flat transparent
Revision problem. Chapter 18 problem 37 page 612. Suppose you point a pinhole camera at a 15m tall tree that is 75m away.
 Revision problem Chapter 18 problem 37 page 612 Suppose you point a pinhole camera at a 15m tall tree that is 75m away. 1 Optical Instruments Thin lens equation Refractive power Cameras The human eye Combining
Polarization of Light
 Polarization of Light References Halliday/Resnick/Walker Fundamentals of Physics, Chapter 33, 7 th ed. Wiley 005 PASCO EX997A and EX999 guide sheets (written by Ann Hanks) weight Exercises and weights
Physics 202 Problems - Week 8 Worked Problems Chapter 25: 7, 23, 36, 62, 72
 Physics 202 Problems - Week 8 Worked Problems Chapter 25: 7, 23, 36, 62, 72 Problem 25.7) A light beam traveling in the negative z direction has a magnetic field B = (2.32 10 9 T )ˆx + ( 4.02 10 9 T )ŷ
Theremino System Theremino Spectrometer Technology
 Theremino System Theremino Spectrometer Technology theremino System - Theremino Spectrometer Technology - August 15, 2014 - Page 1 Operation principles By placing a digital camera with a diffraction grating
Modern Classical Optics
 Modern Classical Optics GEOFFREY BROOKER Department of Physics University of Oxford OXPORD UNIVERSITY PRESS Contents 1 Electromagnetism and basic optics 1 1.1 Introduction 1 1.2 The Maxwell equations 1
6) How wide must a narrow slit be if the first diffraction minimum occurs at ±12 with laser light of 633 nm?
 How wide must a narrow slit be if the first diffraction minimum occurs at ±12 with laser light of 633 nm?") Test IV Name 1) In a single slit diffraction experiment, the width of the slit is 3.1 10-5 m and the distance from the slit to the screen is 2.2 m. If the beam of light of wavelength 600 nm passes through
Test IV Name 1) In a single slit diffraction experiment, the width of the slit is 3.1 10-5 m and the distance from the slit to the screen is 2.2 m. If the beam of light of wavelength 600 nm passes through
Study of the Human Eye Working Principle: An impressive high angular resolution system with simple array detectors
 Study of the Human Eye Working Principle: An impressive high angular resolution system with simple array detectors Diego Betancourt and Carlos del Río Antenna Group, Public University of Navarra, Campus
3.5.4.2 One example: Michelson interferometer
 3.5.4.2 One example: Michelson interferometer mirror 1 mirror 2 light source 1 2 3 beam splitter 4 object (n object ) interference pattern we either observe fringes of same thickness (parallel light) or
P R E A M B L E. Facilitated workshop problems for class discussion (1.5 hours)
") INSURANCE SCAM OPTICS - LABORATORY INVESTIGATION P R E A M B L E The original form of the problem is an Experimental Group Research Project, undertaken by students organised into small groups working as
INSURANCE SCAM OPTICS - LABORATORY INVESTIGATION P R E A M B L E The original form of the problem is an Experimental Group Research Project, undertaken by students organised into small groups working as
Physics 30 Worksheet # 14: Michelson Experiment
 Physics 30 Worksheet # 14: Michelson Experiment 1. The speed of light found by a Michelson experiment was found to be 2.90 x 10 8 m/s. If the two hills were 20.0 km apart, what was the frequency of the
FIFTH GRADE TECHNOLOGY
 FIFTH GRADE TECHNOLOGY 3 WEEKS LESSON PLANS AND ACTIVITIES SCIENCE AND MATH OVERVIEW OF FIFTH GRADE SCIENCE AND MATH WEEK 1. PRE: Interpreting data from a graph. LAB: Estimating data and comparing results
Does Quantum Mechanics Make Sense? Size
 Does Quantum Mechanics Make Sense? Some relatively simple concepts show why the answer is yes. Size Classical Mechanics Quantum Mechanics Relative Absolute What does relative vs. absolute size mean? Why
PHYS 222 Spring 2012 Final Exam. Closed books, notes, etc. No electronic device except a calculator.
 PHYS 222 Spring 2012 Final Exam Closed books, notes, etc. No electronic device except a calculator. NAME: (all questions with equal weight) 1. If the distance between two point charges is tripled, the
Physics 116. Nov 4, 2011. Session 22 Review: ray optics. R. J. Wilkes Email: ph116@u.washington.edu
 Physics 116 Session 22 Review: ray optics Nov 4, 2011 R. J. Wilkes Email: ph116@u.washington.edu ! Exam 2 is Monday!! All multiple choice, similar to HW problems, same format as Exam 1!!! Announcements
Physical Science Study Guide Unit 7 Wave properties and behaviors, electromagnetic spectrum, Doppler Effect
 Objectives: PS-7.1 Physical Science Study Guide Unit 7 Wave properties and behaviors, electromagnetic spectrum, Doppler Effect Illustrate ways that the energy of waves is transferred by interaction with
Color holographic 3D display unit with aperture field division
 Color holographic 3D display unit with aperture field division Weronika Zaperty, Tomasz Kozacki, Malgorzata Kujawinska, Grzegorz Finke Photonics Engineering Division, Faculty of Mechatronics Warsaw University
PHYS 39a Lab 3: Microscope Optics
 PHYS 39a Lab 3: Microscope Optics Trevor Kafka December 15, 2014 Abstract In this lab task, we sought to use critical illumination and Köhler illumination techniques to view the image of a 1000 lines-per-inch
Introduction to acoustic imaging
 Introduction to acoustic imaging Contents 1 Propagation of acoustic waves 3 1.1 Wave types.......................................... 3 1.2 Mathematical formulation.................................. 4 1.3
Specific Intensity. I ν =
 Specific Intensity Initial question: A number of active galactic nuclei display jets, that is, long, nearly linear, structures that can extend for hundreds of kiloparsecs. Many have two oppositely-directed
Automatic and Objective Measurement of Residual Stress and Cord in Glass
 Automatic and Objective Measurement of Residual Stress and Cord in Glass GlassTrend - ICG TC15/21 Seminar SENSORS AND PROCESS CONTROL 13-14 October 2015, Eindhoven Henning Katte, ilis gmbh copyright ilis
Synthetic Sensing: Proximity / Distance Sensors
 Synthetic Sensing: Proximity / Distance Sensors MediaRobotics Lab, February 2010 Proximity detection is dependent on the object of interest. One size does not fit all For non-contact distance measurement,
Robot Perception Continued
 Robot Perception Continued 1 Visual Perception Visual Odometry Reconstruction Recognition CS 685 11 Range Sensing strategies Active range sensors Ultrasound Laser range sensor Slides adopted from Siegwart
Optical Metrology. Third Edition. Kjell J. Gasvik Spectra Vision AS, Trondheim, Norway JOHN WILEY & SONS, LTD
 2008 AGI-Information Management Consultants May be used for personal purporses only or by libraries associated to dandelon.com network. Optical Metrology Third Edition Kjell J. Gasvik Spectra Vision AS,
Microscopy. MICROSCOPY Light Electron Tunnelling Atomic Force RESOLVE: => INCREASE CONTRAST BIODIVERSITY I BIOL1051 MAJOR FUNCTIONS OF MICROSCOPES
 BIODIVERSITY I BIOL1051 Microscopy Professor Marc C. Lavoie marc.lavoie@cavehill.uwi.edu MAJOR FUNCTIONS OF MICROSCOPES MAGNIFY RESOLVE: => INCREASE CONTRAST Microscopy 1. Eyepieces 2. Diopter adjustment
Lenses and Apertures of A TEM
 Instructor: Dr. C.Wang EMA 6518 Course Presentation Lenses and Apertures of A TEM Group Member: Anup Kr. Keshri Srikanth Korla Sushma Amruthaluri Venkata Pasumarthi Xudong Chen Outline Electron Optics
INTERFERENCE OBJECTIVES PRE-LECTURE. Aims
 53 L4 INTERFERENCE Aims OBJECTIVES When you have finished this chapter you should understand how the wave model of light can be used to explain the phenomenon of interference. You should be able to describe
Introduction to Optics
 Second Edition Introduction to Optics FRANK L. PEDROTTI, S.J. Marquette University Milwaukee, Wisconsin Vatican Radio, Rome LENO S. PEDROTTI Center for Occupational Research and Development Waco, Texas
Scanning Near Field Optical Microscopy: Principle, Instrumentation and Applications
 Scanning Near Field Optical Microscopy: Principle, Instrumentation and Applications Saulius Marcinkevičius Optics, ICT, KTH 1 Outline Optical near field. Principle of scanning near field optical microscope
Cathode Ray Tube. Introduction. Functional principle
 Introduction The Cathode Ray Tube or Braun s Tube was invented by the German physicist Karl Ferdinand Braun in 897 and is today used in computer monitors, TV sets and oscilloscope tubes. The path of the
FTIR Instrumentation
 FTIR Instrumentation Adopted from the FTIR lab instruction by H.-N. Hsieh, New Jersey Institute of Technology: http://www-ec.njit.edu/~hsieh/ene669/ftir.html 1. IR Instrumentation Two types of instrumentation
The Basics of Scanning Electron Microscopy
 The Basics of Scanning Electron Microscopy The small scanning electron microscope is easy to use because almost every variable is pre-set: the acceleration voltage is always 15kV, it has only a single
Finite Difference Time Domain and BPM: Flexible Algorithm Selection Technology
 Finite Difference Time Domain and BPM: Flexible Algorithm Selection Technology 1. Introduction This application note shows the use of the Finite Difference Time Domain (FDTD) module in the calculation
How To Understand Light And Color
 PRACTICE EXAM IV P202 SPRING 2004 1. In two separate double slit experiments, an interference pattern is observed on a screen. In the first experiment, violet light (λ = 754 nm) is used and a second-order
Overview. What is EMR? Electromagnetic Radiation (EMR) LA502 Special Studies Remote Sensing
 LA502 Special Studies Remote Sensing") LA502 Special Studies Remote Sensing Electromagnetic Radiation (EMR) Dr. Ragab Khalil Department of Landscape Architecture Faculty of Environmental Design King AbdulAziz University Room 103 Overview What
LA502 Special Studies Remote Sensing Electromagnetic Radiation (EMR) Dr. Ragab Khalil Department of Landscape Architecture Faculty of Environmental Design King AbdulAziz University Room 103 Overview What
CREOL, College of Optics & Photonics, University of Central Florida
 OSE6650 - Optical Properties of Nanostructured Materials Optical Properties of Nanostructured Materials Fall 2013 Class 3 slide 1 Challenge: excite and detect the near field Thus far: Nanostructured materials
ILLUSTRATIVE EXAMPLE: Given: A = 3 and B = 4 if we now want the value of C=? C = 3 + 4 = 9 + 16 = 25 or 2
 Forensic Spectral Anaylysis: Warm up! The study of triangles has been done since ancient times. Many of the early discoveries about triangles are still used today. We will only be concerned with the "right
To explain the basics of how lasers work and let visitors experiment with laser properties.
 Laser Lights Activity Goal To explain the basics of how lasers work and let visitors experiment with laser properties. NGSS Domain(s) PS1.A Structure of Matter PS3.B Definitions of Energy PS4.A Wave Properties
v = fλ PROGRESSIVE WAVES 1 Candidates should be able to :
 PROGRESSIVE WAVES 1 Candidates should be able to : Describe and distinguish between progressive longitudinal and transverse waves. With the exception of electromagnetic waves, which do not need a material
Holography 1 HOLOGRAPHY
 Holography 1 HOLOGRAPHY Introduction and Background The aesthetic appeal and commercial usefulness of holography are both related to the ability of a hologram to store a three-dimensional image. Unlike
Diffraction of Laser Light
 Diffraction of Laser Light No Prelab Introduction The laser is a unique light source because its light is coherent and monochromatic. Coherent light is made up of waves, which are all in phase. Monochromatic
Interferometers. OBJECTIVES To examine the operation of several kinds of interferometers. d sin = n (1)
") Interferometers The true worth of an experimenter consists in his pursuing not only what he seeks in his experiment, but also what he did not seek. Claude Bernard (1813-1878) OBJECTIVES To examine the
Interferometers The true worth of an experimenter consists in his pursuing not only what he seeks in his experiment, but also what he did not seek. Claude Bernard (1813-1878) OBJECTIVES To examine the
Lesson 33: Photoelectric Effect
 Lesson 33: Photoelectric Effect Hertz Experiment Heinrich Hertz was doing experiments in 1887 to test some of Maxwell's theories of EMR. One of the experiments involved using a coil of wire as a receiver
Energy. Mechanical Energy
 Principles of Imaging Science I (RAD119) Electromagnetic Radiation Energy Definition of energy Ability to do work Physicist s definition of work Work = force x distance Force acting upon object over distance
Examples of Uniform EM Plane Waves
 Examples of Uniform EM Plane Waves Outline Reminder of Wave Equation Reminder of Relation Between E & H Energy Transported by EM Waves (Poynting Vector) Examples of Energy Transport by EM Waves 1 Coupling
ME 472 Engineering Metrology
 ME 472 Engineering Metrology and Quality Control Chp 6 - Advanced Measurement Systems Mechanical Engineering University of Gaziantep Dr. A. Tolga Bozdana Assistant Professor Coordinate Measuring Machines
AS COMPETITION PAPER 2008
 AS COMPETITION PAPER 28 Name School Town & County Total Mark/5 Time Allowed: One hour Attempt as many questions as you can. Write your answers on this question paper. Marks allocated for each question
DOING PHYSICS WITH MATLAB COMPUTATIONAL OPTICS RAYLEIGH-SOMMERFELD DIFFRACTION INTEGRAL OF THE FIRST KIND
 DOING PHYSICS WITH MATLAB COMPUTATIONAL OPTICS RAYLEIGH-SOMMERFELD DIFFRACTION INTEGRAL OF THE FIRST KIND THE THREE-DIMENSIONAL DISTRIBUTION OF THE RADIANT FLUX DENSITY AT THE FOCUS OF A CONVERGENCE BEAM
Handy Pinhole Camera (Latin Camera Obscura) to observe the transit of Venus, eclipses and other phenomena occurring on the Sun
 to observe the transit of Venus, eclipses and other phenomena occurring on the Sun") Lech Mankiewicz Centre for Theoretical Physics, Polish Academy of Sciences, Warsaw, Global Intelligent Robotic Telescopes Network GLORIA http://www.gloria-project.eu/ Paweł Rudawy Astronomical Institute,
Lech Mankiewicz Centre for Theoretical Physics, Polish Academy of Sciences, Warsaw, Global Intelligent Robotic Telescopes Network GLORIA http://www.gloria-project.eu/ Paweł Rudawy Astronomical Institute,
ATOMIC SPECTRA. Apparatus: Optical spectrometer, spectral tubes, power supply, incandescent lamp, bottles of dyed water, elevating jack or block.
 1 ATOMIC SPECTRA Objective: To measure the wavelengths of visible light emitted by atomic hydrogen and verify the measured wavelengths against those predicted by quantum theory. To identify an unknown
Near-field scanning optical microscopy (SNOM)
") Adviser: dr. Maja Remškar Institut Jožef Stefan January 2010 1 2 3 4 5 6 Fluorescence Raman and surface enhanced Raman 7 Conventional optical microscopy-limited resolution Two broad classes of techniques
Adviser: dr. Maja Remškar Institut Jožef Stefan January 2010 1 2 3 4 5 6 Fluorescence Raman and surface enhanced Raman 7 Conventional optical microscopy-limited resolution Two broad classes of techniques
Helium-Neon Laser. Figure 1: Diagram of optical and electrical components used in the HeNe laser experiment.
 Helium-Neon Laser Experiment objectives: assemble and align a 3-mW HeNe laser from readily available optical components, record photographically the transverse mode structure of the laser output beam,
It has long been a goal to achieve higher spatial resolution in optical imaging and
 Nano-optical Imaging using Scattering Scanning Near-field Optical Microscopy Fehmi Yasin, Advisor: Dr. Markus Raschke, Post-doc: Dr. Gregory Andreev, Graduate Student: Benjamin Pollard Department of Physics,
Holographically corrected microscope with a large working distance (as appears in Applied Optics, Vol. 37, No. 10, 1849-1853, 1 April 1998)
") Holographically corrected microscope with a large working distance (as appears in Applied Optics, Vol. 37, No. 10, 1849-1853, 1 April 1998) Geoff Andersen and R. J. Knize Laser and Optics Research Center
Holographically corrected microscope with a large working distance (as appears in Applied Optics, Vol. 37, No. 10, 1849-1853, 1 April 1998) Geoff Andersen and R. J. Knize Laser and Optics Research Center
Application Report: Running µshape TM on a VF-20 Interferometer
 : Running µshape TM on a VF-20 Interferometer General This report describes how a fiber interferometer from Arden Photonics Ltd was used together with the µshape TM Generic software package. The VF-20
Physics 111 Homework Solutions Week #9 - Tuesday
 Physics 111 Homework Solutions Week #9 - Tuesday Friday, February 25, 2011 Chapter 22 Questions - None Multiple-Choice 223 A 224 C 225 B 226 B 227 B 229 D Problems 227 In this double slit experiment we
ENGINEERING METROLOGY
 ENGINEERING METROLOGY ACADEMIC YEAR 92-93, SEMESTER ONE COORDINATE MEASURING MACHINES OPTICAL MEASUREMENT SYSTEMS; DEPARTMENT OF MECHANICAL ENGINEERING ISFAHAN UNIVERSITY OF TECHNOLOGY Coordinate Measuring
Diffraction of a Circular Aperture
 Diffraction of a Circular Aperture Diffraction can be understood by considering the wave nature of light. Huygen's principle, illustrated in the image below, states that each point on a propagating wavefront
Light Control and Efficacy using Light Guides and Diffusers
 Light Control and Efficacy using Light Guides and Diffusers LEDs 2012 Michael Georgalis, LC Marketing Manager, Fusion Optix October 11, 2012 Agenda Introduction What Is Light Control? Improves Application
5. Scanning Near-Field Optical Microscopy 5.1. Resolution of conventional optical microscopy
 5. Scanning Near-Field Optical Microscopy 5.1. Resolution of conventional optical microscopy Resolution of optical microscope is limited by diffraction. Light going through an aperture makes diffraction
Assessment Plan for Learning Outcomes for BA/BS in Physics
 Department of Physics and Astronomy Goals and Learning Outcomes 1. Students know basic physics principles [BS, BA, MS] 1.1 Students can demonstrate an understanding of Newton s laws 1.2 Students can demonstrate
Tuesday 20 May 2014 Morning
 Tuesday 20 May 2014 Morning AS GCE PHYSICS B (ADVANCING PHYSICS) G491/01 Physics in Action *1203458796* Candidates answer on the Question Paper. OCR supplied materials: Data, Formulae and Relationships
Thea Omni Light. Thea Spot Light. Light setup & Optimization
 Light setup In this tutorial we will learn how to setup lights inside Thea Studio and how to create mesh lights and optimize them for faster rendering with less noise. Let us have a look at the different
PHYSICAL QUANTITIES AND UNITS
 1 PHYSICAL QUANTITIES AND UNITS Introduction Physics is the study of matter, its motion and the interaction between matter. Physics involves analysis of physical quantities, the interaction between them
USING CDs AND DVDs AS DIFFRACTION GRATINGS
 USING CDs AND DVDs AS DIFFRACTION GRATINGS Rama Balachandran Riverwood High School Atlanta, GA Karen Porter-Davis Chamblee Charter High School Chamblee, GA Copyright Georgia Institute of Technology 2009
A whitepaper on: Invisible and Fluorescing Bar Code Printing and Reading
 A whitepaper on: Invisible and Fluorescing Bar Code Printing and Reading Important technical considerations that are the key to successful implementations Version 1.03 P a g e 2 OVERVIEW Background: Inks
Realization of a UV fisheye hyperspectral camera
 Realization of a UV fisheye hyperspectral camera Valentina Caricato, Andrea Egidi, Marco Pisani and Massimo Zucco, INRIM Outline Purpose of the instrument Required specs Hyperspectral technique Optical
Care and Use of the Compound Microscope
 Revised Fall 2011 Care and Use of the Compound Microscope Objectives After completing this lab students should be able to 1. properly clean and carry a compound and dissecting microscope. 2. focus a specimen
PHOTOELECTRIC EFFECT AND DUAL NATURE OF MATTER AND RADIATIONS
 PHOTOELECTRIC EFFECT AND DUAL NATURE OF MATTER AND RADIATIONS 1. Photons 2. Photoelectric Effect 3. Experimental Set-up to study Photoelectric Effect 4. Effect of Intensity, Frequency, Potential on P.E.
Spectroscopy. Biogeochemical Methods OCN 633. Rebecca Briggs
 Spectroscopy Biogeochemical Methods OCN 633 Rebecca Briggs Definitions of Spectrometry Defined by the method used to prepare the sample 1. Optical spectrometry Elements are converted to gaseous atoms or
The Phenomenon of Photoelectric Emission:
 The Photoelectric Effect. The Wave particle duality of light Light, like any other E.M.R (electromagnetic radiation) has got a dual nature. That is there are experiments that prove that it is made up of
- particle with kinetic energy E strikes a barrier with height U 0 > E and width L. - classically the particle cannot overcome the barrier
 Tunnel Effect: - particle with kinetic energy E strikes a barrier with height U 0 > E and width L - classically the particle cannot overcome the barrier - quantum mechanically the particle can penetrated
Advancements in High Frequency, High Resolution Acoustic Micro Imaging for Thin Silicon Applications
 Advancements in High Frequency, High Resolution Acoustic Micro Imaging for Thin Silicon Applications Janet E. Semmens Sonoscan, Inc. 2149 E. Pratt Boulevard Elk Grove Village, IL 60007 USA Phone: (847)
Efficiency, Dispersion and Straylight Performance Tests of Immersed Gratings for High Resolution Spectroscopy in the Near Infra-red
 Changing the economics of space Efficiency, Dispersion and Straylight Performance Tests of Immersed Gratings for High Resolution Spectroscopy in the Near Infra-red J. Fernandez-Saldivar 1, F. Culfaz 1,
Fraunhofer Diffraction
 Physics 334 Spring 1 Purpose Fraunhofer Diffraction The experiment will test the theory of Fraunhofer diffraction at a single slit by comparing a careful measurement of the angular dependence of intensity
Development of Optical Wave Microphone Measuring Sound Waves with No Diaphragm
 Progress In Electromagnetics Research Symposium Proceedings, Taipei, March 5 8, 3 359 Development of Optical Wave Microphone Measuring Sound Waves with No Diaphragm Yoshito Sonoda, Takashi Samatsu, and
E190Q Lecture 5 Autonomous Robot Navigation
 E190Q Lecture 5 Autonomous Robot Navigation Instructor: Chris Clark Semester: Spring 2014 1 Figures courtesy of Siegwart & Nourbakhsh Control Structures Planning Based Control Prior Knowledge Operator
UNIVERSITY OF SASKATCHEWAN Department of Physics and Engineering Physics
 UNIVERSITY OF SASKATCHEWAN Department of Physics and Engineering Physics Physics 111.6 MIDTERM TEST #4 March 15, 2007 Time: 90 minutes NAME: (Last) Please Print (Given) STUDENT NO.: LECTURE SECTION (please
Experiment #1, Analyze Data using Excel, Calculator and Graphs.
 Physics 182 - Fall 2014 - Experiment #1 1 Experiment #1, Analyze Data using Excel, Calculator and Graphs. 1 Purpose (5 Points, Including Title. Points apply to your lab report.) Before we start measuring
- thus, the total number of atoms per second that absorb a photon is
 Stimulated Emission of Radiation - stimulated emission is referring to the emission of radiation (a photon) from one quantum system at its transition frequency induced by the presence of other photons
Understanding astigmatism Spring 2003
 MAS450/854 Understanding astigmatism Spring 2003 March 9th 2003 Introduction Spherical lens with no astigmatism Crossed cylindrical lenses with astigmatism Horizontal focus Vertical focus Plane of sharpest
INTRODUCTION FIGURE 1 1. Cosmic Rays. Gamma Rays. X-Rays. Ultraviolet Violet Blue Green Yellow Orange Red Infrared. Ultraviolet.
 INTRODUCTION Fibre optics behave quite different to metal cables. The concept of information transmission is the same though. We need to take a "carrier" signal, identify a signal parameter we can modulate,
Measuring the Point Spread Function of a Fluorescence Microscope
 Frederick National Laboratory Measuring the Point Spread Function of a Fluorescence Microscope Stephen J Lockett, PhD Principal Scientist, Optical Microscopy and Analysis Laboratory Frederick National
Alignement of a ring cavity laser
 Alignement of a ring cavity laser 1 Introduction This manual describes a procedure to align the cavity of our Ti:Sapphire ring laser and its injection with an Argon-Ion pump laser beam. The setup is shown
Experiment #5: Qualitative Absorption Spectroscopy
 Experiment #5: Qualitative Absorption Spectroscopy One of the most important areas in the field of analytical chemistry is that of spectroscopy. In general terms, spectroscopy deals with the interactions
Optical Fibres. Introduction. Safety precautions. For your safety. For the safety of the apparatus
 Please do not remove this manual from from the lab. It is available at www.cm.ph.bham.ac.uk/y2lab Optics Introduction Optical fibres are widely used for transmitting data at high speeds. In this experiment,
Crystal Optics of Visible Light
 Crystal Optics of Visible Light This can be a very helpful aspect of minerals in understanding the petrographic history of a rock. The manner by which light is transferred through a mineral is a means
Physics 41, Winter 1998 Lab 1 - The Current Balance. Theory
 Physics 41, Winter 1998 Lab 1 - The Current Balance Theory Consider a point at a perpendicular distance d from a long straight wire carrying a current I as shown in figure 1. If the wire is very long compared
Optical Communications
 Optical Communications Telecommunication Engineering School of Engineering University of Rome La Sapienza Rome, Italy 2005-2006 Lecture #2, May 2 2006 The Optical Communication System BLOCK DIAGRAM OF
Physics 25 Exam 3 November 3, 2009
 1. A long, straight wire carries a current I. If the magnetic field at a distance d from the wire has magnitude B, what would be the the magnitude of the magnetic field at a distance d/3 from the wire,
1051-232 Imaging Systems Laboratory II. Laboratory 4: Basic Lens Design in OSLO April 2 & 4, 2002
 05-232 Imaging Systems Laboratory II Laboratory 4: Basic Lens Design in OSLO April 2 & 4, 2002 Abstract: For designing the optics of an imaging system, one of the main types of tools used today is optical
View of ΣIGMA TM (Ref. 1)
") Overview of the FESEM system 1. Electron optical column 2. Specimen chamber 3. EDS detector [Electron Dispersive Spectroscopy] 4. Monitors 5. BSD (Back scatter detector) 6. Personal Computer 7. ON/STANDBY/OFF
Overview of the FESEM system 1. Electron optical column 2. Specimen chamber 3. EDS detector [Electron Dispersive Spectroscopy] 4. Monitors 5. BSD (Back scatter detector) 6. Personal Computer 7. ON/STANDBY/OFF
The coherence length of black-body radiation
 Eur. J. Phys. 19 (1998) 245 249. Printed in the UK PII: S143-87(98)86653-1 The coherence length of black-body radiation Axel Donges Fachhochschule und Berufskollegs NTA Prof. Dr Grübler, Seidenstrasse
Raman spectroscopy Lecture
 Raman spectroscopy Lecture Licentiate course in measurement science and technology Spring 2008 10.04.2008 Antti Kivioja Contents - Introduction - What is Raman spectroscopy? - The theory of Raman spectroscopy
The Role of Electric Polarization in Nonlinear optics
 The Role of Electric Polarization in Nonlinear optics Sumith Doluweera Department of Physics University of Cincinnati Cincinnati, Ohio 45221 Abstract Nonlinear optics became a very active field of research
Information about the T9 beam line and experimental facilities
 Information about the T9 beam line and experimental facilities The incoming proton beam from the PS accelerator impinges on the North target and thus produces the particles for the T9 beam line. The collisions
Holes & Selective Laser Sintering
 SLS is one of the most accurate 3D printing processes. The process has a layer thickness of 0.1mm. This is the thickness with which a new layer is added to each part. In any direction therefore the maximum