The Hamilton County Drug Court: Outcome Evaluation Findings
|
|
|
- Ethelbert Underwood
- 10 years ago
- Views:
Transcription
1 The Hamilton County Drug Court: Outcome Evaluation Findings Final Report Submitted by: Shelley Johnson, M.S. Project Director and Edward J. Latessa, Ph.D. Principal Investigator University of Cincinnati Center for Criminal Justice Research July 2000 This research was made possible with a grant from the Supreme Court of Ohio. Views expressed are those of the authors and do not necessarily reflect the views of the Supreme Court.

2 Introduction Throughout the last few decades, courts that deal specifically with drug and alcohol offenders have emerged as an alternative to traditional courts. The drug court model is designed to address the needs of drug-involved offenders through frequent judicial monitoring and community-based treatment services. Within the last decade, the increase in the number of drug courts is staggering. As of 1998, there were a total of 275 drug court programs in operation, serving an estimated 90,000 offenders (Drug Court Activity, 1998). Moreover, the Drug Court Programs Office (1998) reported that another 155 were in the planning process. The U.S. Department of Justice has also placed a high priority on drug courts; since 1995, the Drug Courts Programs Office has provided $56 million in funding for development and research (Belenko, 1998). Given the degree of support for the drug court model as well as the fiscal commitment, it is likely that its implementation will continue to increase. In March of 1997, the Supreme Court of Ohio contracted the University of Cincinnati, Division of Criminal Justice, to develop an outcome evaluation model and data collection process that the Supreme Court of Ohio could use to determine the effectiveness of drug courts operating in Ohio. The long-term objective of the Supreme Court is to utilize the evaluation model and data collection process to engage in on-going evaluations of Ohio s drug court programs. The implications of the project are of national significance as few states have undertaken a statewide drug court outcome evaluation. 2
.")
3 Evaluating Drug Courts As with any program evaluation, assessing the operations and impacts of drug court programs is a complex process. Each drug court is planned to achieve specific outcomes for identified types of cases or offenders. While some program impacts are common to all courts (reduced criminality, reduced substance abuse, etc.), the characteristics of participants, treatment options, monitoring activities, and sanctions were expected to vary across sites. The development of the statewide evaluation system was designed to be sensitive to differences between the courts while also producing summary information about drug courts in general. A drug court program can be viewed as a process designed to produce specific impacts, much like a manufacturing operation. The program has inputs (offenders and offenses, staff, resources), throughput (procedures, treatments, sanctions) and outputs (changes in recidivism and substance abuse). The drug court evaluation required that we develop measures of each of these components. The impact or effect of drug court programming can be understood against a benchmark of what would be expected had there been no court program. Thus, the outcome evaluation required the ability to compare drug court product (recidivism rates, relapse, severity of addiction) with similar measures for cases that did not participate in the drug court program. Ideally, the evaluation would enable us to attribute any observed differences to the drug court. The effect of drug court programming on participants criminal behavior and substance use should be isolated. In order to isolate the differences a comparison group was developed for each court. The only difference between the drug court treatment group and the comparison group was participation in the drug court program. Uniform 3
, the characteristics of participants, treatment options, monitoring activities, and sanctions were expected to vary across sites.")
4 measures of intake, supervision, and termination were established for both the drug court cases and comparison cases. The Hamilton County Drug Court, located in Cincinnati Ohio, adheres to the typical drug court model by providing community-based treatment and judicial monitoring. During the initial outcome evaluation, conducted in 1997, it became clear that the current level of data collection and automation in each part of the system involved in treating the offender (i.e. pretrial, probation, court, and treatment provider) was poor. The lack of information from the treatment facility and probation hindered the initial outcome evaluation that relied on pretrial services and court dockets. It has been our experience that data collection by outside researchers that relies on an ex post facto review of case files and hand written notes limits the analysis. Often information useful to the analysis is not routinely and consistently recorded in these case files. Hence, it was decided that individuals working within the drug court would collect relevant data at intake, during the entire service-delivery process, and at termination. This report contains data from an outcome evaluation conducted on the Hamilton County Drug Court. The evaluation results consist of comparisons between those who participated in the drug court with those designated as comparison cases to determine whether participation is associated with differences in outcome. The first section provides an introduction, the research objectives, and overall methodology used for the study. The second section describes the offender profiles. The third section examines the treatment needs exhibited by the drug court participants as well as participation in the drug court sponsored treatment program. The fourth section contains a description of the behavior among drug court participants while in the program as measured by violations 4

5 and services received. The fifth section presents the recidivism results among both the study population as well as graduates of the program. Finally, the sixth section provides a summary and conclusions. Method Site Description The Hamilton County Drug Court began in March The target population includes those arrestees who are drug dependent or in danger or becoming drug dependent. To qualify for the drug court, the following criteria must be met: (1) the defendant must be charged with a fourth or fifth degree felony (2) there must be no history of violent behavior (3) the current and /or past criminal behavior is drug-driven (4) the Hamilton County Prosecutor must approve of all incarcerated offenders applications, (5) the defendant must have no active mental illness, and (6) the offender must demonstrate a sincere willingness to participate in a 15-month treatment process and have no acute health conditions. Design The design being utilized in this project is a quasi-experimental matched control group design. This study is designed to assess program outcomes among drug court participants as compared to a similar group of drug-addicted adults who did not participate in the drug court. The sample includes cases screened for the program during the time period of January 1, 1997 to October 31, To estimate the impact of the drug court on future criminal involvement, it was important to select a control group for comparison purposes. An experimental design including random assignment was not feasible; however, groups were matched with 5
 the defendant must be charged with a fourth or fifth degree felony (2) there must be no history of violent behavior (3) the")
6 regard to demographic characteristics. The data were obtained through pretrial data and court docket information. The experimental and comparison group cases were identified by examining various data sources that included: demographics, case history, assessment information, and the Judge s daily drug court docket containing disposition and outcome information. The criteria for inclusion in the sample were that each participant must have (1) a reported substance abuse problem, and (2) be eligible for the drug court program. The experimental group (n= 226) and the comparison group (n=230) are described below: Experimental Group Individuals who are eligible and willing to participate in court mandated drug treatment are transported to the ADAPT treatment facility for an assessment. This treatment program was established for all male and female drug court participants. Individuals must remain at the treatment facility until their court hearing at which time the treatment recommendation is submitted to the drug court Judge. The treatment program is community-based and includes three phases: inpatient, outpatient, and aftercare. Placement in each level of treatment is determined by level of substance addiction. The residential phase serves fifty-two males and sixteen females. Offenders sent to the residential phase were required to stay a minimum of two weeks up to a maximum of ninety days. The intensive outpatient phase lasts approximately four weeks and groups meet three hours a day four times a week. The continuing care or aftercare phase initially offers services twice a week for one hour but is eventually scaled down to one meeting every two weeks. Services offered during all three phases include: group and individual counseling, sobriety meetings, educational services, and family 6
 a reported substance abuse problem, and (2) be eligible for the drug court program.")
7 involvement. The total amount of time between commencing the residential phase to completion of aftercare spans an average of 15 months. The purpose of the treatment facility is to provide community-based substance abuse treatment coupled with close supervision and frequent urinalysis. Control Group The control group included in the present study consisted of men and women who were eligible for drug court, however did not receive drug court services. This group of clients did in fact have a drug abuse problem, however either refused drug treatment or were refused by the treatment facility. Data Sources The data were collected from a variety of sources. First, the database manager, at Pretrial Services in Hamilton County, compiled social demographic, current offense, disposition, and criminal history information. Second, the treatment needs and participation in treatment were collected at the ADAPT program both for women and men, primarily by staff from the University of Cincinnati. The staff at the probation department collected court-reported violations and fees, community services ordered, and the necessary recidivism data. And finally, the court collected the recidivism data on graduates. The recidivism data were collected during the early part of

8 Profile of Experimental and Comparison Groups In order to conclude that differences in outcome are not the direct result of individual differences within the two samples, social demographic data were collected. This section will profile the two groups based on basic demographic characteristics such as age, race, gender, marital status, education level, employment status, and criminal history. Knowing the population served by the drug court allows researchers to determine whether and how case outcome is influenced by any of these factors. The following question will be addressed: How do the drug court participants compare to the comparison group members with regard to demographics, current offense, disposition, and prior history factors? Social Demographic Information Table 1 compares the two groups with regard to race, gender, age, martial status, education level, and employment. The two groups are very similar with regard to all above mentioned characteristics. Specifically, the typical offender in both the treatment and control group is African-American, male, 32 years of age, not married, has a high school diploma or less, and is employed full time. Although random assignment to the treatment and control groups was not possible, these results allow us to be optimistic that members of the two groups do not differ significantly on factors known to be associated with relapse and criminality. Offense and Disposition Information As illustrated by Table 2, the two groups are also similar with regard to charge or offense information. Both groups were likely to be incarcerated at the time of their assessment. However, individuals were not likely to be under supervision at the time of 8

9 Table 1. Frequency and percentage distribution of participants intake information. Experimental Control N % N % Characteristic (N = 226) (N = 230) Race White Black Other Gender Male Female Age & above Average Age Marital Status Married Not Married Highest Grade Completed Less than High School Grad High School Graduate Post High School Employed Yes No Level of Employment Full Time Part Time

10 Table 2. Frequency and percentage distribution of participants offense information. Experimental Control N % N % Characteristic (N = 226) (N = 230) OFFENSE Incarcerated at assessment Yes On probation at arrest Yes Current Charge Drug Theft Multiple charges Yes Multiple counts Yes χ2 = 5.37 p. =.02 Number of cases against defendant One Two Three Four Five or more Mean

11 the arrest. In addition, the experimental group was more likely to be arrested on a drug related charge than the control group, however, these results should be viewed with caution due to missing data. Table 2 also shows that individuals in both groups are likely to be arrested on multiple charges. Figure 1 illustrates that a statistically significant difference exists between the two groups with regard to being charged with multiple counts at arrest. Although the majority of participants in both groups were not charged with multiple counts, drug court participants were more likely to be so charged than comparison group participants. And finally, the majority of offenders in both groups have only one case against them at the time arrest, however, the mean number or average is two. Sentencing information was collected via the drug court docket. Due to resource limitations in the court, comprehensive sentencing information was collected on all drug court participants but not on all comparison group cases. The information provided for the comparison group should be viewed as a trend of the sentencing practices. Table 3 illustrates that the majority of the offenders in both groups were sentenced to pay both court costs and fines. Furthermore, 61 percent of the drug court participants were required to pay fees during their participation. In contrast, only 1 percent was required to pay restitution. As indicated in Figure 2, a statistically significant difference exists with regard to whether the defendant was sentenced to probation. Specifically, 92 percent of the drug court participants were sentenced to probation in contrast to 74 percent of comparison cases. The majority of offenders in both groups had their license suspended as the result of their criminal activity. Moreover, 100 percent of the drug court participants were required to undergo drug testing. As a standard feature in this drug 11

12 Table 3. Frequency and percentage distribution of participants sentencing information. Experimental Control N % N % Characteristic (N = 226) (N = 230) Offender Sentenced to: Court Costs and Fines Fees Restitution Probation χ2 = p =.002 License Suspension Drug Testing Community Service Intensive Supervision Drug Treatment Did Offender Received Drug Assessment (for drug court) Yes Number of Case Hearings Attended prior to Disposition One Two Three Four Five Six or more Mean
 Yes 151 98.1 54 84.4 Number of Case Hearings Attended prior to Disposition One 49 30.1 36 37.")
13

14

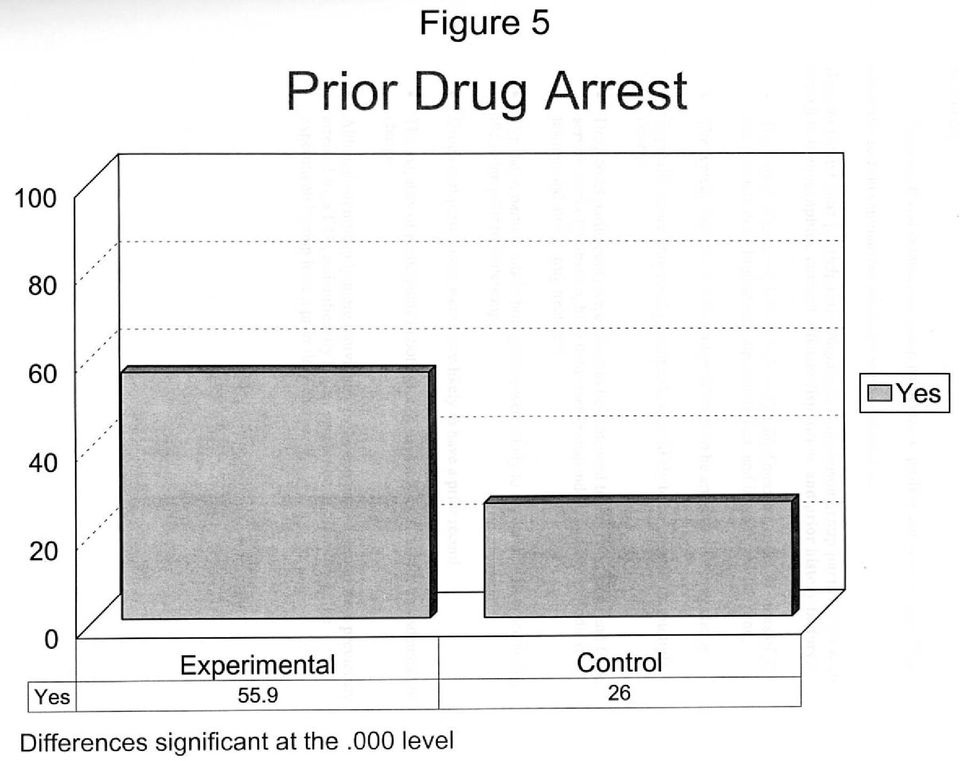
15 court model, participants are routinely drug tested throughout their participation. Few offenders in either group were sentenced to community service or ISP. Not surprisingly, 100 percent of the drug court participants were required to attend drug treatment. Since the development of a female facility in 1996, both men and women are served in the ADAPT program. Finally, on average individuals in both groups attended two case hearings prior to disposition. Prior Criminal History Typically, drug court participants have a prior arrest and incarceration record. Nationally, within the 361 existing courts, over 75 percent of the participants have been previously incarcerated (NADCP, 1998). Similarly, a statistically significant difference exists between the two groups with regard to prior record in Hamilton County. Figure 3 reveals that 89 percent of the experimental group has a prior record in comparison to 79 percent of comparison cases. Table 4 illustrates the type of prior charges for each group. For example, no one in the experimental group, and only 2 percent in the comparison group, have been arrested for a violent felony charge. Similarly, only 10 percent of the experimental group and 11 percent of the control group have a prior record involving a violent misdemeanor charge. However, 35 percent of the experimental group and 39 percent of the comparison group have been arrested for a prior felony charge. As expected the majority in both groups have had a prior misdemeanor arrest. Although significantly more individuals in the control group have been arrested previously for a DUI (see Figure 4), a significantly higher proportion of offenders in the experimental group have a previous arrest for a drug related charge (see Figure 5). 15

16 Table 4. Frequency and percentage distribution of participants criminal history information. Experimental Control N % N % Characteristic (N = 226) (N = 230) Criminal History Prior Record Yes No χ2 = 8.855; p=.003 Prior Violent Felony Arrest Yes No Mean Prior Violent Misd Arrest Yes No Mean Prior Felony Arrest Yes No Mean Prior Misdemeanor Arrest Yes No Mean Prior DUI Arrest Yes No Mean χ2 = 4.211; p =.040 Prior Arrest on a Drug Arrest Yes No Mean χ2 = 40.42; p =.000

17

18

19
20 Summary Drug court and comparison group participants profiles are very similar. The following section summarizes the above mentioned results. How do Drug Court participants compare to comparison group participants with regard to demographics, current offense, disposition, and prior history factors? The typical offender in both groups is African American, male, 32 years of age, not married, has a high school diploma or less, and is employed full time. The typical offender in both groups is likely to be arrested on a drug charge. Typically, more drug court participants were likely to be arrested on multiple counts. Drug court participants were likely to be sentenced to pay court costs and fines, serve a term of probation, have their license suspended, undergo periodic drug testing, and attend drug treatment. Typically, participants in both groups were likely to appear at least twice before the judge prior to sentencing. Drug court participants were more likely to have a prior record. The majority of participants in both groups have a prior arrest for a misdemeanor charge Although significantly more individuals in the comparison group were previously arrested for a DUI, a significantly higher proportion of offenders in the experimental group have a prior drug charge. 20

21 Treatment Considerations An effective outcome evaluation depends on whether the researcher knows what happened to the client while under drug court supervision. This may include documenting whether a participant moved to different phases based on progress and the outcome of treatment. This information is crucial in order to determine how well the program in operation matched the program that was planned. Throughput data allow us to document the drug court treatment and determine how differences in treatment are related to differences in case outcome. The purpose of this section is to address treatment considerations. Specifically, what treatment needs are presented among drug court participants? What are the treatment retention rates among participants as they proceed through the three phase system in the ADAPT program? Treatment Needs Logically, drug-abusing offenders most often exhibit a drug and alcohol problem, however, they also exhibit multiple needs in the areas of housing, mental and physical health, family circumstances, employment, and education. Each drug court participant was asked to provide information relevant to each of these areas and the counselor rated whether the problem was chronic, frequent, situational, or non-existent. Table 5 illustrates that 71 percent exhibited signs of chronic or frequent disruption in the area of alcohol abuse. Moreover, 98 percent exhibited signs of chronic or frequent disruption in the area of drug abuse. A smaller proportion, 56 percent, presents either chronic or frequent disruption in the area of employment. Although the majority of individuals in this sample reported being employed, the quality and consistently of employment may be better measured here. Similarly, 52 percent experience a level of disruption in the family. 21
22 Table 5. Frequency and percentage distribution of participants treatment activity. Experimental Characteristic N % Treatment Needs: Alcohol Abuse Chronic Frequent Disruption Situational/Minor None Drug Abuse Chronic Frequent Disruption Situational/Minor None Employment Chronic Frequent Disruption Situational/Minor None Family Chronic Frequent Disruption Situational/Minor None Education Chronic Frequent Disruption Situational/Minor None Housing Chronic Frequent Disruption Situational/Minor None Physical Health Chronic Frequent Disruption Situational/Minor None Mental Health Chronic Frequent Disruption Situational/Minor None
23 Table 5 illustrates that 33 percent are experiencing problems in the area of education and 30 percent in the area of housing. Finally, in the area of physical and mental health, 23 percent and 18 percent respectively exhibit chronic or a frequent disruption in this area. Figure 6 illustrates these results graphically in order of most to least serious problem or need area. Treatment Retention Rates 1 The retention rate among drug courts across the nation averages 70 percent for drug court participants (Drug Court Programs Office, 1999). The ADAPT treatment program was asked to collect data on the type, duration, and outcome of services experienced by drug court participants. The majority of offenders began treatment in the residential phase. For example, Table 6 reveals that 72 percent of the drug court participants began treatment in the long-term residential phase and 27 percent began treatment in the intensive outpatient phase. A full 75 percent of this group completed this phase of treatment. Reasons for not completing the phase can include: being referred to another level of care (e.g., move from outpatient to residential), non-compliance, absconsion, revocation, or other. As illustrated by table 6, 43 percent of those who did not complete the phase were referred to another level of care. We may speculate that a portion of the intensive outpatient group required more services than expected and were referred to attend residential. Finally, 23 percent did not complete the phase due to noncompliance and 27 percent had either absconded or were revoked from the program. Given the drug court treatment program is a three-phase treatment system, the placement and outcome of the second phase is also presented in table 6. The data 1 Missing data due to incomplete treatment records limited treatment phase status information on some cases. This data, although informative, should be viewed with this consideration. 23
24 Table 6. Frequency and percentage distribution of participants treatment activity. Experimental Characteristic N % Initial Treatment Setting: Long Term Residential Short Term Residential Intensive Outpatient Outpatient Aftercare Outcome of initial Treatment Placement Completed Phase Did not Complete Phase Reason for not Completing Phase Referred to another level of care Non-Compliance Absconded Revoked Other Second Treatment Setting: Long Term Residential Short Term Residential Intensive Outpatient Outpatient Aftercare Outcome of Second Treatment Placement Completed Phase Did not Complete Phase Reason for not Completing Phase Referred to another level of care Non-Compliance Absconded Revoked Other 0 0.0
25
26 indicate that 62 percent progressed to intensive outpatient care. Further, 27 percent progressed to aftercare as would be expected of those successfully completing the intensive outpatient phase. Table 6 illustrates that 84 percent of the group in the second phase completed the treatment. However, 16 percent did not successfully complete the treatment requirement. Among those who did not complete, 33 percent were referred to another level of care, 44 percent were deemed non-compliant, and 22 percent absconded from the program. Figure 7 reveals the completion rates for phase 1 and phase 2 of the treatment program. Finally, as illustrated in table 7, in the third phase of treatment, 11 percent were participating in the intensive outpatient program and 86 percent in aftercare. Of this group, only 23 percent completed the phase. Although this result may appear as if participants dropped out of the program, we see the majority of participants are still engaged in the drug court program. Ten individuals did not complete the treatment in this group and 38 percent were referred to another level of care. Another 38 percent were declared non-compliant, and 25 percent absconded from the program. Missing data precludes a definitive assessment of phase 3 results. In addition to participation in the treatment phases detailed above, drug court participants are also required to attend judicial status review or treatment hearings to review progress in treatment. The typical offender experienced three treatment hearings while in the program, however, 30 percent appeared more than five times. 26
27 Table 7. Frequency and percentage distribution of participants treatment activity. Experimental Characteristic N % Third Treatment Setting: Long Term Residential Short Term Residential Intensive Outpatient Outpatient Aftercare Outcome of Third Treatment Placement Completed Phase Did not Complete Phase Reason for not Completing Phase Referred to another level of care Non-Compliance Absconded Revoked Other Number of Status (treatment) Hearings Attended One Two Three Four Five or more Mean 3.75
28
29 Summary Progress and participation in treatment may impact the outcome of participant s criminal activity. This section summarizes the above mentioned results. What are the treatment needs presented among drug court participants? The majority of participants in the drug court program exhibited signs of chronic or frequent disruption in the areas of alcohol and drug abuse. Although a smaller percentage, participants also have employment, family, education, and housing needs. What are the treatment retention rates among participants as the proceed through the three phase system in the ADAPT program? The majority of drug court participants began treatment in the residential phase, and progressed to the outpatient phase. Hamilton County has a similar retention rate to the national average. Specifically, 75 percent of the participants completed the first phase and 84 percent completed the second phase. The typical offender experienced three treatment or status review hearings while in the program, however, 30 percent experienced more than five. 29
30 In-Program Behavior and Perceptions The purpose of this section is to address behavior while in the drug court program as well as participant satisfaction with the process. In-program behavior, as measured by technical violations and satisfaction, can have a significant impact on treatment retention and behavioral change. Data were only available on drug court participants. Questions addressed in this section will include: What are the court reported violation rates among drug court participants? Among those charged with a violation, what are the sanctions given for those violations? What services are drug court participants receiving while in the program? What is the level of satisfaction with the process among drug court participants? Court Reported Violations Figure 8 illustrates the type of court reported violations received by drug court participants. Specifically, according to records kept by probation, 56 percent had at least one positive urine while in the program and 17 percent absconded. In addition, 13 percent were rearrested for a new charge during participation in the drug court program. Moreover, 8 percent were non-compliant with treatment and charged with a technical violation as result. Surprisingly, only 2 percent were charged with a failure to appear in court. It is not uncommon for a degree of relapse to occur among drug court participants. In fact, research indicates that programs that recognize that drug abuse is a chronic and relapsing condition are more successful (Anglin and Hser; Prendergast, Anglin, and Wellisch, 1995). In addition to court reported violations, Table 8 also illustrates the sanctions received for the violations. In 18 percent of the cases a bench warrant was issued and in 41 percent of the cases jail time was used as a sanction. The court uses a 30
31 Table 8. Frequency and percentage distribution of participants supervision activity. Experimental Characteristic N % Court Reported Violations New Arrest Yes FTA in Court Yes Positive Urine Test Yes Absconded Yes Noncompliance with Treatment Yes Other Technical Violation Yes Sanction Received for Violations Bench Warrant Yes Jail Fines Yes Yes Time Out Yes Increased PO Contact/ISP Yes
32 Table 8, continued. Frequency and percentage distribution of participants supervision activity. Experimental Characteristic N % Sanctions, continued Increased Court Contacts Yes Increased Drug Testing Yes Change in Treatment Intensity Yes Other Yes 2 1.6
33
34 number of possible sanctions, however, time out was the only other sanction listed of any importance. Services Received The services received by the participants while in the drug court program were also collected. Figure 9 presents the type of services typically received by drug court participants ordered similarly to the presenting needs displayed in Figure 6. Specifically, table 9 indicates that 100 percent received drug treatment services. In addition, 82 percent received employment services, while 89 percent received some level of family services. Moreover, 73 percent received education services, 52 percent housing, 76 percent medical, and 15 percent medical. Given the findings illustrated in figure 6, it appears the majority are receiving the appropriate referrals. Participant Satisfaction Drug court clients were asked to complete a self-report survey of their level of satisfaction with the drug court process. Specifically, satisfaction with the judge, the probation staff, the treatment staff, and with the various components of the program. Only drug court clients who graduated from the program were asked to complete the 36- item survey. As illustrated by tables 10-14, the satisfaction among those reporting is very high with regard to all the above-mentioned components. Specifically, tables 10 and 11 indicate that that the participants felt the judge, probation, and treatment staff treated them with respect, was fair, concerned, helped them stay drug free, and did not expect too much. Figure 10 displays the results graphically to compare satisfaction with each component. Moreover, table 12 indicates that the majority of participants felt that it helped them to appear in court, to probation, and to treatment on a regular basis. This 34
35 Table 9. Frequency and percentage distribution of participants termination information. Experimental Characteristic N % In-Program Services Received Substance Abuse Treatment Employment Services Educational Services Housing Assistance Family Services Medical Services Mental Health Services
36 Table 10. Frequency and percentage distribution of participants satisfaction survey information. Experimental Characteristic N % SURVEY FOR DRUG COURT CLIENTS The Judge treated me with respect Strongly Agree Agree Disagree Strongly Disagree The Judge was fair Strongly Agree Agree Disagree Strongly Disagree The Judge was concerned about me Strongly Agree Agree Disagree Strongly Disagree Visits with the Judge helped me to stay drug free Strongly Agree Agree Disagree Strongly Disagree The Judge expected too much of me Strongly Agree Agree Disagree Strongly Disagree My probation officer treated me with respect Strongly Agree Agree Disagree Strongly Disagree My probation officer was fair Strongly Agree Agree Disagree Strongly Disagree 1 0.7
37 Table 11. Frequency and percentage distribution of participants satisfaction survey information. Experimental Characteristic N % My probation officer was concerned about me Strongly Agree Agree Disagree Strongly Disagree Visits with my probation officer helped me stay drug free Strongly Agree Agree Disagree Strongly Disagree My probation officer expected too much of me Strongly Agree Agree Disagree Strongly Disagree The treatment staff treated me with respect Strongly Agree Agree Disagree Strongly Disagree The treatment staff was fair Strongly Agree Agree Disagree Strongly Disagree The treatment staff was concerned about me Strongly Agree Agree Disagree Strongly Disagree Visits with the treatment staff helped me stay drug free Strongly Agree Agree Disagree Strongly Disagree 1 0.7
38 Table 12. Frequency and percentage distribution of participants satisfaction survey information. Experimental Characteristic N % The treatment staff expected too much of me Strongly Agree Agree Disagree Strongly Disagree It helped me to appear in court on a regular basis Strongly Agree Agree Disagree Strongly Disagree It helped me to report regularly to my probation officer Strongly Agree Agree Disagree Strongly Disagree It helped me attend treatment on a regular basis Strongly Agree Agree Disagree Strongly Disagree Drug Court was easier than jail or prison Strongly Agree Agree Disagree Strongly Disagree Drug Court was easier than regular probation Strongly Agree Agree Disagree Strongly Disagree I think my Drug Court participation will help me in the future Strongly Agree Agree Disagree Strongly Disagree 1 0.7
39
40
41 finding is especially relevant to drug courts considering the level of reporting requirements. Interestingly, the majority of drug court participants indicated they felt the drug court was easier than jail or prison (illustrated by figure11), however, as expected the only a slight majority felt the drug court was easier than regular probation (as illustrated by figure 12). Again, given the level of reporting is often more intensive than regular probation, it is understandable to find the drug court is perceived as a more difficult alternative. However, the majority still reported that they believe the drug court will help them in the future, that they are better off for participating and were personally helped through their participation. Finally, as illustrated by table 13 and 14, participants were asked to rate each service received as either excellent, good, or poor. Figure 13 graphically illustrates that the majority rated drug testing, AA/NA, outpatient, probation, and residential treatment as either good or excellent. Options such as intensive supervision, electronic monitoring, and community service are infrequently used by the court. 41
42 Table 13. Frequency and percentage distribution of participants satisfaction survey information. Experimental Characteristic N % In general, I am better off for participating in Drug Court As opposed to other court sanctions Strongly Agree Agree Disagree Strongly Disagree I was personally helped through participation in Drug Court Strongly Agree Agree Disagree Strongly Disagree Residential Treatment Poor Good Excellent Did not participate Outpatient Treatment Poor Good Excellent Did not participate Intensive Probation Supervision Poor Good Excellent Did not participate Regular Probation Supervision Poor Good Excellent Did not participate Electronic Monitoring Poor Good Excellent Did not participate
43 Table 14. Frequency and percentage distribution of participants satisfaction survey information. Experimental Characteristic N % Community Service Poor Good Excellent Did not participate Drug Testing Poor Good Excellent Did not participate AA/NA Poor Good Excellent Did not participate Previous Trouble with the Law Yes No Previous Substance Abuse Treatment Yes No
44
45
46
47 Summary What is the court reported violation rate among drug court participants? Specifically, 13 percent were arrested for a new charge, 56 percent tested positive at least once, 17 percent absconded, and 8 percent were non-compliant with treatment. Among those charged with a violation, what were the sanctions given for those violations? For those charged with a violation, 41 percent served time in jail, 18 percent received a time out, 9 percent were subject to increased supervision, and 8 percent experienced a change in treatment intensity. What services did drug court participants receive while in the program? All participants received drug treatment services while participating in the drug court The typical drug court client also received employment, educational, housing, family, and medical services. What is the level of satisfaction with the process among drug court participants? The typical drug court participant reported being satisfied with the drug court program including the judge, the treatment provider, and probation. 47
48 Subsequent Criminal Behavior The main purpose of an outcome evaluation is to determine the impact of the intervention, in this case the drug court, on behavior. The commonly used measure of behavior is recidivism. Hence, the purpose of this section is to address the recidivism rates between the two groups and identify factors associated with outcome. A number of research questions are examined. What are the rearrest rates among the experimental and comparison groups? What is the rate of time to elapse between initial arrest to rearrest among the two groups? What are the determinants or factors associated with recidivism? Rearrest Rates A statistically significant difference exists with regard to rearrest for a new offense. Figure 14 presents the data with regard to rearrest. The data indicate that offenders in the treatment group were less likely to be rearrested than those in the comparison group. Specifically, table 15 reveals that 29 percent of the experimental group was rearrested in comparison to 39 percent of the comparison group. Table 15 also indicates that both groups were likely to be arrested on a drug related offense. Specifically, of those arrested, 47 percent of the experimental group and 44 percent of the comparison group were arrested on a drug charge. In addition, 22 percent of the experimental group and 26 percent of the comparison group were arrested for a theft. Although not significant, a slightly higher number of the treatment participants were likely to be arrested for a felony charge and have their charge result in a conviction. 48
49 Table 15. Frequency and percentage distribution of participants rearrest information. Experimental Control Characteristic N % N % Rearrested for a New Offense Yes No χ2 = 4.560; p=.033 Rearrest Charge (of those rearrested) Drug Related Theft Violent Prostitution DUI Resisting Arrest Probation Violation Other Level of Initial Rearrest Felony Misdemeanor Convicted for Initial Rearrest Yes No
50
51 In contrast, table 16 reveals that significantly more individuals in the control groups were likely to be arrested multiple times during the follow-up period. Specifically, Figure 15 reveals that 30 percent of the experimental group was arrested multiple times during the follow up period in contrast to 47 percent of the comparison group. Finally, table 16 illustrates that comparison group participants, on average, were rearrested 1.87 times. Time to Arrest Evaluations that explore only the number of arrests of two or more groups may overlook important treatment effects. Specifically, participation in treatment may only delay onset of reoffending. To explore this possibility, we compare the rate at which drug court participants and the comparison group participants were rearrested. Table 16 indicates that both the groups are similar with regard to the average number of days to elapse between initial arrest and subsequent rearrest. Specifically, table 16 illustrates that the typical ADAPT participant was likely to remain arrest free for the first 205 days. In comparison, the typical comparison group participant was likely to remain arrest free for 218 days. It appears, then, that participation in the treatment program does not represent a period of delay. In fact, those participating in treatment are significantly less likely to be rearrested regardless of the follow-up period in comparison to the control group. Determinants of Rearrest This section is designed to isolate factors associated with recidivism. The analysis will allow the court to discern what type of clients benefit from services and for whom additional services are needed. Logistic regression was used to determine which factors were associated with recidivism. The characteristics included in the model (see 51
52 Table 16. Frequency and percentage distribution of participants rearrrest information. Experimental Control Characteristic N % N % Arrested Multiple Times Yes No χ2 = 4.644; p=.031 Number of Times Rearrested One Two Three Four Five or more Mean Avg. Time to Initial Rearrest (in days) Avg Follow-up Period
53
54 appendix) were group membership (i.e. experimental or control group), race, gender, marriage, education level, prior record, employment, age, and time at risk. Time at risk was included as a control for the different lengths of time clients were followed. Analysis of the model revealed that five variables predicted who is likely to be rearrested: group membership, race, prior record, age, and time at risk. Specifically, the data indicate that comparison group participants were more likely to be rearrested. The data also indicate that African Americans were more likely to be rearrested. In addition, it was found that individuals with a prior record are more likely to continue engaging in criminal behavior. The data also indicate that the younger the individual, the more likely he or she may be rearrested. Finally, the longer an individual remained at risk, that is the longer the time to elapse between initial contact with the court to the end of the follow-up period, the more likely a rearrest will occur. In order to examine the results in more detail, the five variables predictive of rearrest were translated into log-odds ratios to simple odds. Failure rates for each of the significant factors were estimated from the odds. Figures 16 and 17 present the estimated probabilities and delineate the percentage with which each factor has in predicting arrest. Those individuals who are a member of the control group, African-American, have a prior record, are between the ages of 18 22, and remain at risk longer have a 63% probability of being arrested for a new offense. 54
55
56
57 Summary The purpose of this section was to address the recidivism rates of the two groups and identify factors associated with recidivism. What are the rearrest rates among the experimental and comparison groups? With regards to rearrest, the experimental or ADAPT group was significantly less likely to be rearrested in comparison to the control group that did not receive treatment. Of those rearrested, the typical offender in both groups was charged with a drug related offense. Slightly more experimental participants were rearrested for a felony in comparison to control group participants Significantly more experimental group participants were convicted of the offense in comparison to control group cases. The comparison group participants were more likely to be rearrested multiple times. What is the length of time to elapse between initial arrest to rearrest between the two groups? The length of time to elapse was similar for both groups. Data indicate that treatment participation did not simply delay subsequent criminal behavior. What are the determinants or factors associated with recidivism? Five variables predicted rearrest: group membership, race, prior record, age, and time at risk. 57
58 Subsequent Criminal Behavior Among Graduates In addition to exploring the rearrest rates among the sample of participants discussed above, rearrest data were collected on graduates of the program. The arrest record checks were conducted in January The Hamilton County Drug Court began accepting participants in March of 1995, and the first graduation was held in July of The participants in this sample include individuals who graduated from the drug court program between the time period of July 1996 to November Although Hamilton County has held graduation since this date, the analysis is limited to the participants graduating in 1996 and 1997 to allow for a minimum 18-month follow-up period. The rearrest rates are calculated post-graduation and do not include arrests while in the program. Rearrest Rates The rearrest rates among graduates appear very promising. Figure 18 presents the overall rearrest rates among graduates. The results indicate that 31 percent of participants who graduated from the drug court in 1996 and 1997 were arrested for a new charge as of January Table 17 illustrates the rates by graduating class. It appears that 23 percent of the July 1996 graduates have been rearrested since graduation day. Furthermore, 35 percent of the October 1996 graduates, 63 percent of the March 1997 graduates, 29 percent of the June 1997 graduates, and 31 percent of the November 1997 graduates have been rearrested since graduation day. Overall, as Figure 19 illustrates, these results are very encouraging that the drug court may be having a long-term effect on participants. 58
59 Table 17. Rearrest Information by Graduating Class Graduation Date 6/01/96 10/01/96 3/01/97 6/01/97 11/01/97 N % N % N % N % N % Rearrested (n= 43) (n = 26) (n = 58) (n = 28) (n = 49) Rearrested Yes No Males Rearrested Yes No Females Rearrested Yes No Rearrest Charge Drug Drug Trafficking Theft/property Other Level of Charge Felony Misdemeanor Rearrested Multiple Times Yes No
60
61
62 Of those rearrested, Figure 20 indicates that the rates among men and women are very similar with the exception of the October graduating class. Specifically, table 17 illustrates that 44 percent of the females in this class were rearrested in comparison to 29 percent of the men. With regard to charge, the majority in all five graduating classes were likely to be rearrested for a drug charge, with the second most likely to charge being a theft. In addition, Table 17 illustrates that the majority in all five graduating classes were likely to be arrested for a felony charge. And finally, although some differences exist, the majority of participants in all classes were not arrested more than once during the follow-up period. Summary The purpose of this section was to address the recidivism rates among graduates of the drug court program. What are the rearrest rates among graduates? Overall, only 31 percent of the graduates have been rearrested during the 18- month follow-up period. The sample includes five graduating classes. The rearrest rates among the classes are as follows: first graduating class: 23 percent, the second class: 35 percent, the third class: 36 percent, the fourth class: 27 percent, and the fifth class: 31 percent. With regard to charge, the majority in all five classes were likely to be rearrested for a drug charge. Moreover, the overall majority were also likely to be rearrested for a felony charge. However, the majority were not likely to be arrested more than one time post-graduation. What are the rearrest rates among graduates by gender? The rearrest rates by gender are very similar with the exception of the second and third graduating class. 62
63
64 Conclusions The drug court model is based on the premise that a more flexible approach to treating drug addicted offenders, in combination with increased court involvement and oversight of offender s treatment progress, will result in less drug dependency and lower rates of recidivism. To assess these claims, we conducted an outcome evaluation of the Hamilton County Drug Court. Overall, this research provides supportive evidence that the drug court program was effective in reducing criminality. Specifically, the study examined outcome associated with two comparable drug addicted offender populations. The groups were comparable on many social demographic factors known to be associated with relapse and criminality. The results of the outcome study are positive as drug court participants had a lower proportion of arrests during the follow-up period than comparison group members. Moreover, drug court participants were less likely to be arrested multiple times. A separate analysis revealed that program graduates consistently exhibited low arrests rates (e.g., average 30 percent). Further, of those graduates who were arrested, the majority were not likely to be arrested multiple times during the 18-month follow-up period. The results support the effectiveness of the drug court model in reducing criminal recidivism through supervision and community based treatment. And finally, in addition to outcome, the drug court program appears to successfully retaining clients in treatment. Similar to the national average, the Hamilton County Drug Court is able to retain better than 75 percent of its participants in treatment. 64
65 Policy Implications Additional evaluations of drug courts are finally beginning to emerge in the literature base. Previous research, as well as the findings from this study, indicates that drug courts can be effective in reducing recidivism. Even in light of these positive findings, it is our position that the drug court model could further increase their success by considering the following recommendations. First, to increase the likelihood of effectively targeting resources to the appropriate population, a standardized risk and needs assessment should be included in the treatment or service delivery decision. Programs that target the criminogenic needs, or factors directly related to recidivism (e.g., attitudes, companions, personality, etc.), have been found to be successful in reducing recidivism rates (Andrews & Bonta, 1998). The assessment instrument should be used to identify the needs of the population and match appropriate treatment services to target those needs. Hamilton County has recently adopted the Level of Service Inventory- Revised, a standardized risk and needs instrument. Although the drug court Judge is made aware of the assessment scores, there is no evidence that the scores are being used in treatment planning. The drug-addicted offender often presents multiple needs or problem areas not addressed in 12 step or educational services. These needs must be identified, addressed, and reassessed at termination in order to deliver the most appropriate services to the participant. Previous research has found that drug courts can be successful in matching appropriate services to clients through the use of these measures (Granfield, Eby, Brewster, 1998). Finally, not only would classification be important to match appropriate services to the appropriate clients, but also to recognize and organize resources to address the needs of clients who are likely to fail. 65
66 Second, drug courts will have a better chance at success if they can facilitate participation in treatment programs that are appropriate. Reducing criminality and addictions begins with the recognition that drug addiction is a chronic relapsing condition that will not be effectively reduced by applying short term, education-based treatment services. The success of a treatment program rests with the selection of an empirically validated and theoretically driven treatment model (Prendergast, et al., 1995). Although drug abuse is considered the primary need of many drug court participants, the majority have multiple needs that may include, among other factors, attitudes supportive of criminal behavior, interpersonal relationships with criminal associates or a lack of educational and vocational skills. Treatment services must first take into consideration the offenders specific needs and then apply the most effective model to remedy the needs. Research is now indicating that the most effective programs aimed at changing offender behavior are those based on cognitive, social learning, multisystemic family, and radical behavioral (e.g. operant conditioning) strategies (see, e.g., Andrews, Zinger, Hoge, Bonta, Gendreau, Cullen 1990; Antonowicz & Ross 1994; Gendreau 1996; Gendreau & Andrews 1990; Henggeler & Borduin 1990; Izzo & Ross 1990; Lipsey 1992; Van Voorhis, Braswell, & Morrow 1997). These strategies attempt to change behavior by addressing thinking errors or values and attitudes supportive of crime, providing a means for the offender to observe and imitate prosocial behavior, including the family and community in the rehabilitation of the offender, and decreasing inappropriate behavior through reinforcement for appropriate behavior. The Hamilton County Drug Court could increase their effectiveness by including these treatment models into drug court programming. 66
67 Limitations Although this study was more comprehensive than the original outcome study conducted in 1997, a few limitations remain. First, random assignment procedures were not utilized. Although matching procedures were developed to increase the similarities between the treatment and comparison group, random assignment procedures would allow for a more definitive measure of their similarities. Second, supervision data were not made available for the comparison group members. We are unable to control for supervision or treatment the members may have received while under supervision of a traditional court or probation unit. Third, the level of data collection by treatment staff at ADAPT should increase. Our staff collected much of the treatment data and review of the case files limits the analysis. And finally, given the chronic and relapsing nature of drug abuse, a longer follow-up period would allow us to better discern the long-term effects of drug court participation. 67
Preliminary Evaluation of Ohio s Drug Court Efforts
 Preliminary Evaluation of Ohio s Drug Court Efforts Draft report September 2001 Final report issued November 2001 By: Edward J. Latessa, Ph.D. Principal Investigator Shelley Johnson Listwan, Ph.D. Project
Hamilton County Municipal and Common Pleas Court Guide
 Hamilton County Municipal and Common Pleas Court Guide Updated January 2012 PREVENTION ASSESSMENT TREATMENT REINTEGRATION MUNICIPAL & COMMON PLEAS COURT GUIDE Table of Contents Table of Contents... 2 Municipal
Hamilton County Municipal and Common Pleas Court Guide
 Hamilton County Municipal and Common Pleas Court Guide Updated July 2015 PREVENTION ASSESSMENT TREATMENT REINTEGRATION MUNICIPAL & COMMON PLEAS COURT GUIDE Table of Contents Table of Contents... 2 Municipal
The Substance Abuse Felony Punishment Program: Evaluation and Recommendations
 The Substance Abuse Felony Punishment Program: Evaluation and Recommendations Criminal Justice Policy Council Prepared for the 77 th Texas Legislature, 2001 Tony Fabelo, Ph.D. Executive Director The Substance
O H I O DRUG COURT EVALUATION
 O H I O DRUG COURT EVALUATION Bob Taft, Governor Maureen O Connor, Lt. Governor Domingo S. Herraiz, Director Ohio Office of Criminal Justice Services O H I O DRUG COURT EVALUATION Bob Taft, Governor Maureen
Reentry on Steroids! NADCP 2013
 Reentry on Steroids! NADCP 2013 Panel Introductions Judge Keith Starrett Moderator Judge Robert Francis Panelist Judge Stephen Manley Panelist Charles Robinson - Panelist Dallas SAFPF 4-C Reentry Court
Stopping the Revolving Door for Mentally Ill Offenders in the Criminal Justice System via Diversion and Re-entry Programs
 GEORGIA GEORGIA GEORGIA GEORGIA GEORGIA Department of Corrections ON THE MOVE Stopping the Revolving Door for Mentally Ill Offenders in the Criminal Justice System via Diversion and Re-entry Programs Academic
Pierce County. Drug Court. Established September 2004
 Pierce County Drug Court Established September 2004 Policies and Procedures Updated September 2013 TABLE OF CONTENTS I. Drug Court Team II. Mission Statement III. The Drug Court Model IV. Target Population
WHAT MAKES A PERSON ELIGIBLE FOR THE DRUG COURT PROGRAM? WHAT HAPPENS NOW THAT I HAVE BEEN ACCEPTED INTO DRUG COURT?
 WHAT MAKES A PERSON ELIGIBLE FOR THE DRUG COURT PROGRAM? A person who is interested in the Drug Court Program is looked at for both legal and social factors to determine if they may be admitted. These
Georgia Accountability Court Adult Felony Drug Court. Policy and Procedure Manual
 Georgia Accountability Court Adult Felony Drug Court Policy and Procedure Manual Contents Policy and Procedure Manual: Adult Felony Drug Court Overall purpose...3 Mission Statement...4 Adult Drug Court
The New York State Adult Drug Court Evaluation
 520 Eighth Avenue, 18 th Floor New York, New York 10018 212.397.3050 fax 212.397.0985 www.courtinnovation.org Executive Summary: The New York State Adult Drug Court Evaluation Policies, Participants and
This chapter shall be known and may be cited as the Alyce Griffin Clarke Drug Court Act.
 9-23-1. Short title This chapter shall be known and may be cited as the Alyce Griffin Clarke Drug Court Act. HISTORY: SOURCES: Laws, 2003, ch. 515, 1, eff from and after July 1, 2003. 9-23-3. Legislative
FAMILY DRUG COURT PROGRAM
 SUPREME COURT OF MISSISSIPPI Administrative Office of Courts FAMILY DRUG COURT PROGRAM REQUEST FOR PROPOSAL PURPOSE OF THE REQUEST FOR PROPOSAL Through the American Recovery and Reinvestment Act of 2009
The Drug Court program is for addicted offenders. The program treats a drug as a drug and an addict as an addict, regardless of the drug of choice.
 Drug Court Handbook Mission Statement Drug Courts in the 7th Judicial District will strive to reduce recidivism of alcohol & drug offenders in the criminal justice system and provide community protection
Participant Handbook. Williamson County. DWI/Drug Court Program
 Participant Handbook Williamson County DWI/Drug Court Program March, 2014 Introduction Welcome Welcome to the Williamson County DWI/Drug Court. This requirement of community supervision is designed to
DeKalb County Drug Court: C.L.E.A.N. Program (Choosing Life and Ending Abuse Now)
") DeKalb County Drug Court: C.L.E.A.N. Program (Choosing Life and Ending Abuse Now) MISSION STATEMENT The mission of the DeKalb County Drug Court:.C.L.E.A.N. Program (Choosing Life and Ending Abuse Now)
DeKalb County Drug Court: C.L.E.A.N. Program (Choosing Life and Ending Abuse Now) MISSION STATEMENT The mission of the DeKalb County Drug Court:.C.L.E.A.N. Program (Choosing Life and Ending Abuse Now)
Cowlitz County Drug Court Evaluation
 Cowlitz County Drug Court Evaluation Prepared by: Principal Investigator Mark Krause, Ph.D. Laurie Drapela, Ph.D. Consultants Research Assistants: Kate Wilson, Jillian Schrupp, Jen Haner Department of
The State of Drug Court Research: What Do We Know?
 The State of Drug Court Research: What Do We Know? Michael Rempel Center for Court Innovation E-mail: [email protected] Presentation at Drug Courts Reexamined (An Online Event), New York, NY,
RUTLAND COUNTY TREATMENT COURT
 Data Driven Decisions RUTLAND COUNTY TREATMENT COURT CONTROL GROUP EVALUATION FINAL REPORT Submitted to: Karen Gennette State Treatment Court Coordinator Vermont Court Administrator s Office Submitted
An Analysis of Idaho s Kootenai County DUI Court
 An Analysis of Idaho s Kootenai County DUI Court AN ALCOHOL TREATMENT PROGRAM FOR PERSONS ARRESTED FOR THEIR SECOND DUI OFFENSE OR BAC OF 0.20% OR HIGHER Prepared for National Highway Traffic Safety Administration
DRAFT Metropolitan Detention Center (MDC) DWI Addiction Treatment Programs (ATP) Outcome Study Final Report UPDATED
 DWI Addiction Treatment Programs (ATP) Outcome Study Final Report UPDATED") DRAFT Metropolitan Detention Center (MDC) DWI Addiction Treatment Programs (ATP) Outcome Study Final Report UPDATED Prepared for: The DWI Addiction Treatment Programs (ATP) Metropolitan Detention Center
DRAFT Metropolitan Detention Center (MDC) DWI Addiction Treatment Programs (ATP) Outcome Study Final Report UPDATED Prepared for: The DWI Addiction Treatment Programs (ATP) Metropolitan Detention Center
Appendix I. Thurston County Criminal Justice Treatment Account Plan
 Appendix I Thurston County Criminal Justice Treatment Account Plan 2014-2016 Thurston County Criminal Justice Treatment Account Plan 2014-2016 This plan has been prepared in response to Behavioral Health
Population, Alternatives to Incarceration and Budget Information
 Population, Alternatives to Incarceration and Budget Information 500 Employees 1,300 Offenders under supervision Lafayette Parish Correctional Center (LPCC), Transitional Housing Facility Community Corrections
Performance Measurement and Program Evaluation For Drug Courts. Fred L. Cheesman II, Ph.D. The National Center for State Courts
 Performance Measurement and Program Evaluation For Drug Courts Fred L. Cheesman II, Ph.D. The National Center for State Courts Module 1: Introduction Goal of this Presentation To enable participants to
TRAVIS COUNTY DWI COURT JUDGE ELISABETH EARLE, PRESIDING
 TRAVIS COUNTY DWI COURT JUDGE ELISABETH EARLE, PRESIDING DWI Cases Are A Significant Percentage Of New Cases Filed In Travis County: 23% of all new cases filed in FY 2009 are new DWI cases Total cases
Drug Court as Diversion for Youthful Offenders
 Drug Court as Diversion for Youthful Offenders Juvenile Drug Courts in Hawaii: A Policy Brief Introduction The problem of drug abuse among the general population in the United States began to escalate
Con-Quest Residential Substance Abuse Treatment Program Outcome Evaluation. February 2004
 Residential Substance Abuse Treatment Program Outcome Evaluation February 2004 Introduction The link between drugs and crime in the United States is widely accepted. Drug users frequently commit crime
AN ACT. The goals of the alcohol and drug treatment divisions created under this Chapter include the following:
 ENROLLED Regular Session, 1997 HOUSE BILL NO. 2412 BY REPRESENTATIVE JACK SMITH AN ACT To enact Chapter 33 of Title 13 of the Louisiana Revised Statutes of 1950, comprised of R.S. 13:5301 through 5304,
ATLANTIC JUDICIAL CIRCUIT DRUG COURT
 ATLANTIC JUDICIAL CIRCUIT DRUG COURT History The Atlantic Judicial Circuit began exploring the possibility of a Drug Court in 2008 under the leadership of Superior Court Judge D. Jay Stewart. A planning
SHORT TITLE: Criminal procedure; creating the Oklahoma Drug Court Act; codification; emergency.
 SHORT TITLE: Criminal procedure; creating the Oklahoma Drug Court Act; codification; emergency. STATE OF OKLAHOMA 2nd Session of the 45th Legislature (1996) SENATE BILL NO. 1153 By: Hobson AS INTRODUCED
[As Amended by Senate Committee of the Whole] SENATE BILL No. 351. By Joint Committee on Corrections and Juvenile Justice Oversight 1-11
![[As Amended by Senate Committee of the Whole] SENATE BILL No. 351. By Joint Committee on Corrections and Juvenile Justice Oversight 1-11](/thumbs/30/13939589.jpg "[As Amended by Senate Committee of the Whole] SENATE BILL No. 351. By Joint Committee on Corrections and Juvenile Justice Oversight 1-11") Session of 00 [As Amended by Senate Committee of the Whole] SENATE BILL No. By Joint Committee on Corrections and Juvenile Justice Oversight - 0 0 0 AN ACT concerning crimes, punishment and criminal procedure;
Session of 00 [As Amended by Senate Committee of the Whole] SENATE BILL No. By Joint Committee on Corrections and Juvenile Justice Oversight - 0 0 0 AN ACT concerning crimes, punishment and criminal procedure;
Department of Community and Human Services Mental Health, Chemical Abuse and Dependency Services Division
 Criminal Justice Initiative Community Center for Alternative Programs Intensive Outpatient Chemical Dependency Treatment Program Two Year Outcomes Subsequent to Program Changes Department of Community
Community Supervision Texas Association of Counties October 2015
 10/26/2015 Community Supervision Texas Association of Counties October 2015 Presented by District Judge Todd Blomerth, 421 st Judicial District Court of Caldwell County 1 10/26/2015 2 10/26/2015 Your Possible
North Dakota Attorney General 24/7 Sobriety Program
 Transdermal Alcohol Monitoring Case Studies North Dakota Attorney General 24/7 Sobriety Program Republished from Transdermal Alcohol Monitoring: Case Studies National Highway Traffic Safety Administration
Most states juvenile justice systems have
 BRIEF I Setting the Stage: Juvenile Justice History, Statistics, and Practices in the United States and North Carolina Ann Brewster Most states juvenile justice systems have two main goals: increased public
Criminal Justice 101. The Criminal Justice System in Colorado and the Impact on Individuals with Mental Illness. April 2009
 Criminal Justice 101 The Criminal Justice System in Colorado and the Impact on Individuals with Mental Illness April 2009 Acronyms DOC = Department of Corrections DYC = Division of Youth Corrections DCJ
CRIMINAL JUSTICE ADVISORY COUNCIL ALTERNATIVES TO INCARCERATION REPORT September 8, 2005
 CRIMINAL JUSTICE ADVISORY COUNCIL ALTERNATIVES TO INCARCERATION REPORT September 8, 2005 The Criminal Justice Advisory Council ( CJAC ) established a Subcommittee to address recommendations regarding alternatives
Federal Purpose Area 5 Drug Treatment Programs
 Federal Purpose Area 5 Drug Treatment Programs State Purpose Areas: 11F Mental Health Services 11F.01 Provide mental health services through various treatment modalities to a specified number of clients.
Over the last several years, the importance of the risk principle has been
 Understanding the Risk Principle: How and Why Correctional Interventions Can Harm Low-Risk Offenders Over the last several years, the importance of the risk principle has been well established in many
Residential Substance Abuse Treatment for State Prisoners
 MAY 03 U.S. Department of Justice Office of Justice Programs National Institute of Justice Research for Practice Residential Substance Abuse Treatment for State Prisoners WEB-ONLY DOCUMENT Breaking the
Section V Adult DUI/Drug Court Standards
 Section V Table of Contents 1. DUI/Drug courts integrate alcohol and other drug treatment services with justice system case processing....31 2. Using a non-adversarial approach, prosecution and defense
Petrus UW-L Journal of Undergraduate Research X (2007)
") Fighting the Addiction: The Effectiveness of the La Crosse County Drug Court Program Erin R. Petrus Faculty Sponsor: William G. Zollweg, Department of Sociology/Archeology ABSTRACT The purpose of the research
Fighting the Addiction: The Effectiveness of the La Crosse County Drug Court Program Erin R. Petrus Faculty Sponsor: William G. Zollweg, Department of Sociology/Archeology ABSTRACT The purpose of the research
SPECIAL OPTIONS SERVICES PROGRAM UNITED STATES PRETRIAL SERVICES AGENCY EASTERN DISTRICT OF NEW YORK
 SPECIAL OPTIONS SERVICES PROGRAM UNITED STATES PRETRIAL SERVICES AGENCY EASTERN DISTRICT OF NEW YORK February 4, 2013 1 I. Introduction The Special Options Services (SOS) Program was established in the
SENTENCING REFORM FOR NONVIOLENT OFFENSES: BENEFITS AND ESTIMATED SAVINGS FOR ILLINOIS
 SENTENCING REFORM FOR NONVIOLENT OFFENSES: BENEFITS AND ESTIMATED SAVINGS FOR ILLINOIS LISE MCKEAN, PH.D. SUSAN K. SHAPIRO CENTER FOR IMPACT RESEARCH OCTOBER 2004 ACKNOWLEDGEMENTS PROJECT FUNDER Chicago
Virginia Adult Drug Treatment Courts
 National Center for State Courts Project Co-Directors: Fred L. Cheesman, Ph.D. Principal Court Research Consultant & Tara L. Kunkel, MSW Principal Court Consultant Project Staff: Scott E. Graves, Ph.D.
17 th Judicial District Treatment Court. Participant Handbook
 17 th Judicial District Treatment Court Participant Handbook Name: Date Issued: Case Manager: Case Manager Phone: Probation Officer: Probation Officer Phone: Counselor Name: Counselor Phone: CHARACTER
A Preliminary Assessment of Risk and Recidivism of Illinois Prison Releasees
 A Preliminary Assessment of Risk and Recidivism of Illinois Prison Releasees David E. Olson & Gipsy Escobar Department of Criminal Justice Loyola University Chicago Presented at the Justice Research and
Manatee County Drug Court Overview. The Drug Court concept began in 1989 in Miami-Dade County in response to the crack
 Manatee County Drug Court Overview Prepared by: Manatee County Drug Court Alfred James, Manager January 2014 Drug Court History The Drug Court concept began in 1989 in Miami-Dade County in response to
Evidence Based Correctional Practices
 Evidence Based Correctional Practices What works in corrections is not a program or a single intervention but rather a body of knowledge that is accessible to criminal justice professionals. 1 The National
MEDINA COUNTY COMMON PLEAS COURT EARLY INTERVENTION PRE-TRIAL PROGRAM
 MEDINA COUNTY COMMON PLEAS COURT EARLY INTERVENTION PRE-TRIAL PROGRAM JUDGE CHRISTOPHER J. COLLIER Courtroom #1 Christine Demlow, Program Coordinator (330) 725-9131 Starting January 1, 2014, Judge Collier
2014 SYNC Review. Teton County Court Supervised Treatment Program, Jackson, WY
 2014 SYNC Review Teton County Court Supervised Treatment Program, Jackson, WY Program Director: Anne Comeaux, 8.5 years in position Founded: 2004 SYNC Evaluation Date: February 5, 2014 Total Participants
Fourth Judicial District of Minnesota Pretrial Evaluation: Scale Validation Study
 Fourth Judicial District of Minnesota Pretrial Evaluation: Scale Validation Study Fourth Judicial District Research Division Marcy R. Podkopacz, Ph.D., Research Director October, 2006 www.mncourts.gov/district/4
Mental Health Court 101
 Mental Health Court 101 2007 Georgia Drug & DUI Court Conference Peachtree City, GA Honorable Kathlene Gosselin, Hall County Superior Court & H.E.L.P. Program Team While the number of patients in psychiatric
ALTERNATIVES TO INCARCERATION IN A NUTSHELL
 ALTERNATIVES TO INCARCERATION IN A NUTSHELL An alternative to incarceration is any kind of punishment other than time in prison or jail that can be given to a person who commits a crime. Frequently, punishments
Community Supervision in Texas
 Brad Livingston, Executive Director Texas Department of Criminal Justice Carey Welebob, Director TDCJ - Community Justice Assistance Division (TDCJ-CJAD) Community Supervision in Texas Presentation to
Section I Adult Drug Court Standards
 Section I Table of Contents 1. Drug courts integrate alcohol and other drug treatment services with justice system case processing....3 2. Using a non-adversarial approach, prosecution and defense counsel
Denver Sobriety Court Program Memorandum of Agreement
 Fina~~26/ll Denver Sobriety Court Program Memorandum of Agreement Introduction The Denver Sobriety Court (Sobriety Court) was established in 2010 through efforts of the Crime Prevention and Control Commission
Mental Health & Addiction Forensics Treatment
 Mental Health & Addiction Forensics Treatment Sheriffs: Help needed to cope with September 15, 2014 mentally ill INDIANAPOLIS - A sheriff says county jails have become the "insane asylums" for Indiana
Community Based Corrections Substance Abuse Treatment For the Higher Risk Offender
 CHESTER J. CULVER, GOVERNOR PATTY JUDGE, LT. GOVERNOR DEPARTMENT OF CORRECTIONS JOHN R. BALDWIN, DIRECTOR Iowa Department of Corrections Performance Audit Report Community Based Corrections Substance Abuse
Risk/Needs Assessment 101: Science Reveals New Tools to Manage Offenders
 Issue Brief Project PUBLIC SAFETY NamePERFORMANCE PROJECT Risk/Needs Assessment 101: Science Reveals New Tools to Manage Offenders Every day, criminal justice officials make decisions that have enormous
GUIDE TO THE DUI INTEGRATED TREATMENT COURT FOR LAWYERS (DITC)
") 1 GUIDE TO THE DUI INTEGRATED TREATMENT COURT FOR LAWYERS (DITC) The DITC is a wonderful, voluntary program designed to assist multiple DUI/DWAI offenders to complete probation successfully in order to
1 GUIDE TO THE DUI INTEGRATED TREATMENT COURT FOR LAWYERS (DITC) The DITC is a wonderful, voluntary program designed to assist multiple DUI/DWAI offenders to complete probation successfully in order to
Adult Drug Court Participant Handbook
 THE CIRCUIT COURT FOR MONTGOMERY COUNTY, MARYLAND Adult Drug Court Participant Handbook MY DRUG COURT INFORMATION My Case Manager s Name is: My Case Manager s Phone Number is: My Case Manager s Email address
JUVENILE DRUG TREATMENT COURT STANDARDS
 JUVENILE DRUG TREATMENT COURT STANDARDS SUPREME COURT OF VIRGINIA Adopted December 15, 2005 (REVISED 10/07) PREFACE * As most juvenile justice practitioners know only too well, the populations and caseloads
Criminal Justice Professionals Attitudes Towards Offenders: Assessing the Link between Global Orientations and Specific Attributions
 Criminal Justice Professionals Attitudes Towards s: Assessing the Link between Global Orientations and Specific Attributions Prepared by: Dale Willits, M.A. Lisa Broidy, Ph.D. Christopher Lyons, Ph.D.
Minnesota County Attorneys Association Policy Positions on Drug Control and Enforcement
 T H E M I N N E S O T A C O U N T Y A T T O R N E Y S A S S O C I A T I O N Minnesota County Attorneys Association Policy Positions on Drug Control and Enforcement Adopted: September 17, 2004 Introduction
Frequently Asked Questions (FAQs) of Drug Abuse Treatment for Criminal Justice Populations
 of Drug Abuse Treatment for Criminal Justice Populations") Frequently Asked Questions (FAQs) of Drug Abuse Treatment for Criminal Justice Populations From The National Institute on Drug Abuse (NIDA) 2. Why should drug abuse treatment be provided to offenders?
Frequently Asked Questions (FAQs) of Drug Abuse Treatment for Criminal Justice Populations From The National Institute on Drug Abuse (NIDA) 2. Why should drug abuse treatment be provided to offenders?
PRETRIAL CRIMINAL JUSTICE RESEARCH
 NOVEMBER 2013 RESEARCH SUMMARY Pretrial criminal justice research commissioned by the Laura and John Arnold Foundation (LJAF) has thrown new light on how critical the earliest decisions made in the criminal
A Preliminary Analysis of the Orange County DUI Court
 A Preliminary Analysis of the Orange County DUI Court Carrie J. Petrucci, Ph.D. [email protected] Elizabeth Piper Deschenes, Ph.D. [email protected] October 21 st, 2005 1 Outline of Presentation Evidence
How To Change The Way A Prison System Works
 Moving the California Department of Corrections and Rehabilitation from an Offense- Based to Risk-Based System Susan Turner University of California, Irvine September 2010 Presentation Will Cover Size
MANDATORY SUPERVISION COURT: Blueprint for Success
 MANDATORY SUPERVISION COURT: Blueprint for Success The FIRST YEAR OF REALIGNMENT 1906 Local Prison Sentences: 93% Drug & Property Crimes MSOs treated as high risk probationers Inconsistent approach amongst
UAB Treatment Alternatives for Safer Communities Jefferson County Community Corrections Program FY2011
 UAB Treatment Alternatives for Safer Communities Jefferson County Community Corrections Program FY2011 Treatment Alternatives for Safer Communities (TASC) is the designated Community Corrections Program
Published annually by the California Department of Justice California Justice Information Services Division Bureau of Criminal Information and
 Published annually by the California Department of Justice California Justice Information Services Division Bureau of Criminal Information and Analysis Criminal Justice Statistics Center 2011 Juvenile
Drug courts integrate alcohol and other drug treatment services with justice system case processing. Specialty Courts 101
 Specialty Courts 101 Developed by: National Drug Court Institute (NDCI) Presented by: Carolyn Hardin, Senior Director NDCI, March1, 2011 The following presentation may not be copied in whole or in part
How To Participate In A Drug Court
 Program Handbook Cabell County Drug Court SCA Treatment Court Form 200 SR DCT Page 1 of 9 What is Drug Court? West Virginia s Cabell County Drug Court is a collaborative effort of legal, mental health,
Section IV Adult Mental Health Court Treatment Standards
 Section IV Adult Mental Health Court Treatment Standards Table of Contents 1. Screening...27 2. Assessment...27 3. Level of Treatment...27 4. Treatment/Case Management Planning...28 5. Mental Health Treatment
Metropolitan Detention Center (MDC) DWI Addiction Treatment Programs (ATP) Outcome Study for DWI Offenders
 DWI Addiction Treatment Programs (ATP) Outcome Study for DWI Offenders") Metropolitan Detention Center (MDC) DWI Addiction Treatment Programs (ATP) Outcome Study for DWI Offenders Prepared for: The DWI Addiction Treatment Programs (ATP) Metropolitan Detention Center Prepared
Metropolitan Detention Center (MDC) DWI Addiction Treatment Programs (ATP) Outcome Study for DWI Offenders Prepared for: The DWI Addiction Treatment Programs (ATP) Metropolitan Detention Center Prepared
Office of the Bexar County Criminal District Attorney
 M.I.L.E.S. (Meaningful Intervention Leading to Enduring Success) A Pre-Trial Diversion Program by the Bexar County Criminal District Attorney s Office Overview The Bexar County Criminal District Attorney
Iowa Department of Corrections. Report to the Board of Corrections
 THOMAS J. VILSACK, GOVERNOR SALLY J. PEDERSON, LT. GOVERNOR DEPARTMENT OF CORRECTIONS GARY D. MAYNARD, DIRECTOR Iowa Department of Corrections Report to the Board of Corrections Substance Abuse First in
CUMULATIVE SECOND YEAR COST-BENEFIT ANALYSIS OF PIMA COUNTY S DRUG TREATMENT ALTERNATIVE TO PRISON PROGRAM REPORT
 CUMULATIVE SECOND YEAR COST-BENEFIT ANALYSIS OF PIMA COUNTY S DRUG TREATMENT ALTERNATIVE TO PRISON PROGRAM REPORT Submitted to: Barbara LaWall Pima County Attorney and Melissa Rueschhoff, Esq. Program
PLATTSBURGH MENTAL HEALTH COURT
 PLATTSBURGH MENTAL HEALTH COURT PARTICIPANT CONTRACT I, have pled guilty to the crime of and will be sentenced to three years on Probation. [OR have admitted Violation of Probation OR have been charged
DRUG COURT DEFERRED JUDGMENT INFORMATION SHEET
 DRUG COURT DEFERRED JUDGMENT INFORMATION SHEET If you have been charged with a crime involving possession of a controlled substance and/or possession of drug paraphernalia, you may be eligible to participate
ONDCP. Drug Policy Information Clearinghouse FACT SHEET John P. Walters, Director www.whitehousedrugpolicy.gov 1-800-666-3332
 UNUM Executive Office of the President Office of National Drug Control Policy E PLURIBUS OFFICE OF NATIONAL POLICY D RUG CONTROL ONDCP March 2001 Drug Policy Information Clearinghouse FACT SHEET John P.
St. Croix County Drug Court Program. Participant Handbook
 St. Croix County Drug Court Program Participant Handbook Updated: May 2014 To The St. Croix County Drug Court Program. This Handbook is designed to answer your questions and provide overall information
Statistics on Women in the Justice System. January, 2014
 Statistics on Women in the Justice System January, 2014 All material is available though the web site of the Bureau of Justice Statistics (BJS): http://www.bjs.gov/ unless otherwise cited. Note that correctional
Statement of Policy - The Goals of Drug and Veteran Treatment Courts The Idaho Legislature established the following goals for problem solving courts:
 IDAHO ADULT VETERANS TREATMENT COURT STANDARDS & GUIDELINES FOR EFFECTIVENESS AND EVALUATION Idaho recognizes that veteran treatment courts promote public safety and reduce criminal activity associated
SENATE BILL No. 123 page 2
 SENATE BILL No. 123 AN ACT concerning crimes and punishment; relating to possession of drugs; mandatory treatment; amending K.S.A. 65-4160 and K.S.A. 2002 Supp. 21-4603d, 21-4705, 21-4714, 22-3716 and
Moving Towards a Federal Criminal Justice System By Timothy P. Cadigan and Bernadette Pelissier
 Moving Towards a Federal Criminal Justice System By Timothy P. Cadigan and Bernadette Pelissier The recent literature has been replete with discussions of the need to move the disparate agencies of the
LANCASTER COUNTY ADULT DRUG COURT
 LANCASTER COUNTY ADULT DRUG COURT Administered by the Lancaster County Department of Community Corrections Judicial Oversight by the Lancaster County District Court www.lancaster.ne.gov keyword: drug court
Orange County, Texas Adult Criminal Justice Data Sheet
 Orange County, Texas Adult Criminal Justice Data Sheet For more information, contact Dr. Ana Yáñez- Correa at [email protected], or (512) 587-7010. The Texas Criminal Justice Coalition seeks the implementation