THE EFFECTS OF STOCK LENDING ON SECURITY PRICES: AN EXPERIMENT
|
|
|
- Rachel Peters
- 10 years ago
- Views:
Transcription
1 THE EFFECTS OF STOCK LENDING ON SECURITY PRICES: AN EXPERIMENT Steve Kaplan Toby Moskowitz Berk Sensoy November, 2011

2 MOTIVATION: WHAT IS THE IMPACT OF SHORT SELLING ON SECURITY PRICES? Does shorting make prices more efficient by reducing overpricing? Miller (1977) predicts differences of opinion and short sales constraints can lead to overpricing. Diamond and Verrecchia (1987) argue traders will adjust to short sale constraints so that there is no overpricing. But skewness may be affected. Does shorting make prices less informative and destabilize markets? Moving prices further away from fundamentals [Lamont (2004)]? Help reduce excess volatility? [Hong and Stein (2003), Abreu and Brunnermeier (2001), Allen and Gale (1991)] 2
]?")
3 EFFECT OF SHORT SELLING CONSTRAINTS IS AN EMPIRICAL QUESTION Attempts to measure the empirical effects from both the demand and supply sides. Holding supply constraints fixed, can use variation in shorting demand to test for overpricing or excess volatility. Holding demand fixed, can use variation in shorting supply to measure degree to which constraints matter. Empirical efforts hampered by difficulty of identifying pure demand or supply variation. E.g., short interest, rebate rates, loan fees. Regulation shocks (2008 Emergency Order, SHO, shorting bans around the world). 3

4 HOW DOES SHORT SELLING WORK? (COHEN ET AL. (2004)) Investor who wants to short must find a lender. Sells shares short. Then: Short seller must deliver shares to buyer by day T+3. Short seller must maintain margin of >= 30% of short position. Proceeds of short sale deposited with lender. Lender requires 102% of value of shares as collateral. Fluctuates with value of shares. Lender invests collateral and earns interest. Interest is reinvestment rate. Lender also pays borrower a rebate rate which is <= reinvestment rate. Rebate rate can be negative. Lender s profit = Reinvestment rate - Rebate rate = Loan Spread / Fee. Stocks in highest demand (special) can have negative rebate rates. 4

5 Recall: Lender can recall the shares at any time. Borrower must return shares in 7 business days. 5

6 PREVIOUS EMPIRICAL WORK Shorting demand: Use direct measures of shorting costs (rebate rate or spread between the rebate and interest rates) [D Avolio (2002), Geczy, Musto, and Reed (2002), Ofek, Richardson, and Whitelaw (2004), and Jones and Lamont (2002)]. Short interest [Desai et al. (2002) for a summary]. Shorting supply: Ofek and Richardson (2003) consider lockup expirations. Chang, Cheng, and Yu (2007), Bris (2008), Diether, Lee, and Werner (2009), Beber and Pagano (2010) on regulation changes. Cohen, Diether, and Malloy (2008) look at both. Mixed results---hard to separate supply and demand. Also, hard to disentangle shorting market changes from changes in underlying security market. 6
, Bris (2008), Diether, Lee, and Werner (2009), Beber and Pagano (2010) on regulation changes. Cohen, Diether, and Malloy (2008) look at both.")
7 WHAT DO WE DO? Working with an anonymous money manager (greater than $15 B in assets) we randomly: Make available for lending 2/3 of Manager s stocks and withhold other 1/3 of Manager s stocks. Focus on high loan fee stocks (loan fee > 25bps per year, with mean > 4%). Provides exogenous shock to supply of lendable shares Exogenous decrease in shorting constraints. Supply shift not driven by changes in The Manager s marginal lending cost. Focus on stocks with high loan fees. Theory suggests this is where we are most likely to see pricing effects. [Duffie, 1996; Duffie, Garleanu, Pedersen 2002]. 7

8 KEY RESULTS Supply shocks sizeable. Lending fees reduced. Market loan quantities increased. No evidence of adverse effects on average on Returns. Volatility. Skewness. Bid-ask spreads. Inconsistent with overpricing and disagreement theories of shorting activity. In cross-section of returns: Weak evidence of lower returns to stocks with largest supply shocks and highest analyst disagreement. Not robust across two phases of the experiment. 8

9 EXPERIMENTAL DESIGN AND SAMPLE The Manager Invests in mid and small-cap equities, inside and outside U.S. Had not lent out stocks out of concern that doing so would: lower the stocks prices. increase their volatility. Motivation for experiment Consider fees / benefits from lending shares. vs. Adverse effects / costs. Measure magnitude of net benefit/cost. 9

10 EXPERIMENT PHASE 1 Shares available for lending on September 5, Selected sample based on stockholdings as of June 30, Manager owned 523 stocks worth in excess of $15 billion. Stocks divided into two groups: 1. Revenue stocks projected to have loan fee of at least 10 basis points (138 stocks). 2. Remaining group of 385 stocks we refer to as "non-revenue" stocks. Within each group, randomly selected to lend out 2/3 and withhold 1/3. One exception - lent three stocks in revenue stock group with the highest expected revenue to reduce opportunity cost. Results are the same if we exclude these three stocks. 10

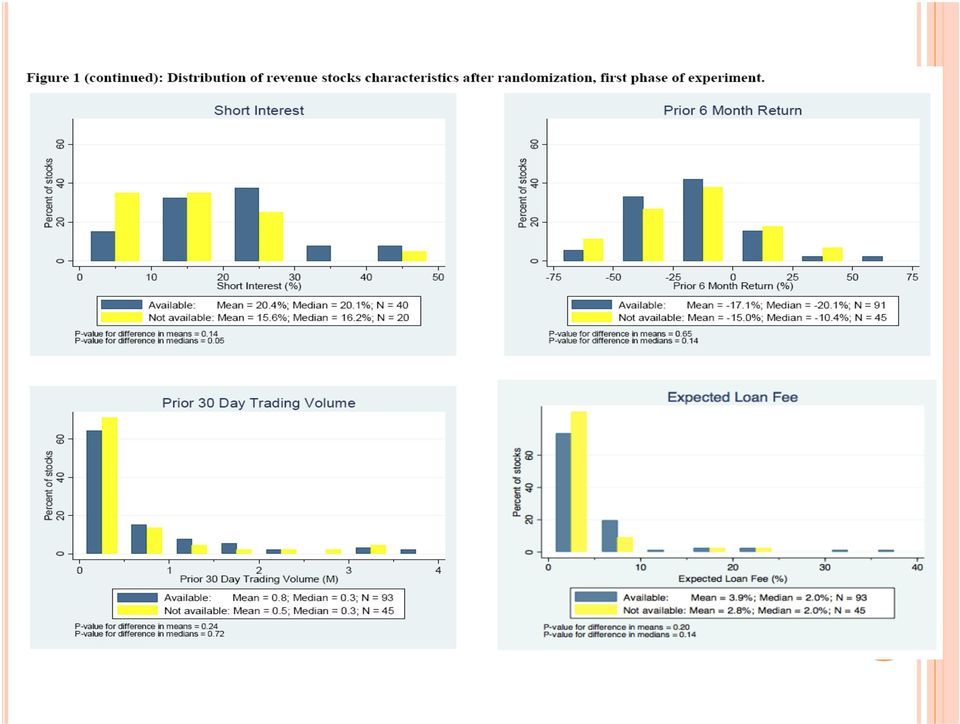
11 Figure A-1 - distribution of firm characteristics across the revenue stocks available to lend out and revenue stocks withheld No significant differences between available and withheld groups Figure A-2 (same for) non-revenue stocks No significant differences between available and withheld groups. These stocks were not intended to be lent, but comforting wrt experimental design. Randomization seems to work---observables no different across the treatment and control groups 11

12

13
14 ADDITIONAL RESTRICTIONS Shares traded on U.S. exchanges. Shares that were in high demand relative to supply. Revenue stocks with expected loan fees of at least 25 basis points. Cuts to 40 available and 20 withheld stocks. At the start of the lending program, 8 available stocks no longer eligible for lending because loan fees decreased to less than 25 bp. End up with 32 available and 20 withheld stocks. Loan size restricted to the lesser of: Three times the average daily trading volume (in past 30 days). 5% of outstanding shares of issuer. Concern: Loan size restrictions put a limit on increase in supply from experiment. Response: These stocks are those for which supply shocks should matter the most. Most variation in loan supply comes from ownership and NOT these restrictions. Cross-sectional results. 14

15 EXPERIMENT PHASE 2 We repeated the experiment from June 5 to September 30, Same restrictions applied (except required expected fee at least 25 basis points throughout). Randomization results in 22 available stocks and 10 withheld stocks. Manager then asked us to lend 1 of the withheld stocks. Changes to 23 available and 9 withheld stocks. Results are the same if we exclude the selected stock. At start of lending, 3 available stocks no longer eligible for lending because their loan fees had declined to less than 25 bp. End up with 19 available and 9 withheld stocks. On October 1, 2009, all shares were made available for lending with a limit of $500 million. Ends the experiement. 15

16 SAMPLE DESCRIPTION TABLE I Compare available stocks to withheld stocks on observable dimensions. No differences across a variety of characteristics. For first phase, only significant differences are higher mean (but not median) institutional ownership and marginally higher short interest. For second phase, only significant difference is higher expected loan fee for available stocks. Consistent with random variation. But, if anything, differences will likely bias towards finding an effect. 16

17 TABLE I: RANDOMIZATION 17

18 18

19 ARE THE SAMPLE STOCKS GOOD CANDIDATES FOR TESTING OVERVALUATION/DISAGREEMENT THEORIES Is high shorting demand relative to supply (evidenced by high loan fees) driven by hedging motives? Unlikely: Less than 5-10% of stocks involved in M&A. Less than a quarter had convertible bonds outstanding. Highly valued, high disagreement: M/B ratios above 80 th percentile. 41% of stocks have no analyst coverage. Among ones that do, forecast dispersion is above the 85 th percentile of all stocks with coverage. More on this in the cross-sectional tests. 19

20 THE LENDING EXPERIMENT AND SUMMARY STATISTICS First phase: Lending period began September 5, At peak, on September 17, over $700 million of securities lent out. September 18, 2008, Manager asked lending agent to call loans back. Last shares returned on October 3, We examine effects on stocks lent out vs. those withheld during: "lending period" (September 5 to 17). Max. 9 trading days. "recall period" (September 18 to October 3). Max. 12 trading days. Pre-period is August 1-Sept. 4, trading days. 20
. Max. 9 trading days.")
21 THE LENDING EXPERIMENT AND SUMMARY STATISTICS Second phase: Lending period began June 5, Up to $200 M lent out through August 7. After August 7, up to $350 M lent out (and limit not reached) through September 30. Withheld stocks were made available on Oct. 1. Lending period is June 5 Sept trading days. Pre-period is May 1 June 4, trading days. 21
22 TABLE II: SUMMARY STATISTICS 22
23 DOES EXPERIMENT PROVIDE A SIZEABLE SHOCK TO SUPPLY? Potential loan from experiment is: For first phase, mean of 2.3 times average daily volume, 3.7% of institutional ownership, 18.3% of short interest. For second phase, mean of 2.1 times average daily volume, 6.9% of institutional ownership, 36.8% of short interest. Increase in supply should have largest effect for stocks in our sample to the extent that high loan fees indicate that they are in high demand and illiquid [Kolasinki, Reed, and Ringgenberg (2010)]. 23
24 DOES EXPERIMENT PROVIDE A SIZEABLE SHOCK TO SUPPLY? What happens to loan fees and quantities? Supplemental data from Data Explorers on loan fees and quantities Available stocks hit by our supply shock. Withheld stocks not shocked. Loan fees If supply shock big enough, loan fees should for available stocks should decline significantly compared to withheld stocks. Size of decline indicates importance of supply change. Table III Measure loan fee changes for available vs. withheld stocks. Difference-in-differences approach comparing pre-lending fees and fees during the lending program. Use multiple measures of fees from multiple sources Data Explorers. Expected fees from lending agent. Actual fees received. Fees the Manager received are highly correlated with Data Explorers fees, but not perfectly so (0.69). Examine cross-section of size of loan. 24
25 TABLE III: DIFFERENCES-IN-DIFFERENCES FOR LOAN FEES 25
26 LOAN QUANTITIES TABLE IV 26
27 TABLE V: RETURN DIFFERENCES Portfolio approach to avoid cross-correlation problem Three sets of weighting schemes: Equal weight. Value weight. Weight by expected loan fee before the lending experiment. If loan supply has pricing effect (at amounts being lent), then expect decrease in returns of available relative to withheld stocks during lending period (when supply is increased) reversal or increase in returns during recall period (when increase in supply is taken away) 27
28 TABLE IV: RETURN DIFFERENCES Pre-period Lending period Recall period Available Withheld Difference Available Withheld Difference Available Withheld Difference Panel A: First Phase Equal-weight [0.47] [0.47] [0.26] [0.86] [1.05] [0.37] [1.50] [1.49] [0.50] (0.98) (0.24) (0.42) Value-weight [0.48] [0.40] [0.29] [0.86] [0.94] [0.47] [1.47] [1.46] [0.77] (0.67) (0.57) (0.38) Expected loan fee-weight *** [0.52] [0.60] [0.41] [0.84] [0.93] [0.28] [1.59] [1.58] [0.49] (0.44) (0.00) (0.56) Panel B: Second Phase Equal-weight [0.66] [0.53] [0.31] [0.23] [0.20] [0.13] (0.46) (0.35) Value-weight * [0.56] [0.51] [0.35] [0.20] [0.19] [0.13] (0.69) (0.09) Expected loan fee-weight * [1.02] [0.61] [0.75] [0.31] [0.21] [0.24] (0.09) (0.59) 28
29 POWER OF THE TESTS Each phase individually has only moderate statistical power. Since two phases are independent, joint power is much higher. Consider Miller s (1977) overvaluation hypothesis that returns during the lending period are negative (a onetailed test) equal-weighted results, the joint probability observe at least 47 basis points (p-value = 0.12) in first phase (trial) 13 basis points (p-value = 0.175) in second phase (trial) relative to the null that returns in each phase are less than or equal to zero = 2.1% Alternatively, can ask what level of returns can we reject at conventional levels of significance taking into account both phases? Rejection regions that combine both phases---table VI 29
30 Table V: Power of the Tests Rejection Cutoff Values for Return Differences (in %) Significance level Lending (lower bound) First phase Recall (upper bound) Second phase Lending (lower bound) Combined phases Lending (lower bound) Equal-weighted 10% % % Value-weighted 10% % % Expected loan fee-weighted 10% % %
31 EVENT STUDIES FOR RETURNS TABLE VII No adverse return effects over entire lending or recall periods. Perhaps effects show up at higher frequencies that are masked by overall period. Event studies also address concern that termination decision in the second phase is endogenous to results. But event studies at 1 day, 2 days, 3 days, 1 week, and for second phase 1 month, 2 months, and 3 months also reveal no adverse return effects. 31
32 TABLE VII 32
33 THE CROSS-SECTION OF RETURNS Previous results are for the average stock. May mask important cross-sectional information. Returns may be related to certain stock characteristics or magnitude of the supply shock. 33
34 TABLE VIII 34
35 TABLE VIII 35
36 CROSS-SECTIONAL RESULTS Results mildly suggestive of lower returns to available stocks with high loan supply or high analyst disagreement. Not robust across phases. Results for M/B opposite of overvaluation theories. Considerable potential for spurious inference if control group is ignored. 36
37 VOLATILITY, SKEWNESS, AND BID-ASK SPREADS Differences-in-differences between stocks made available vs. those withheld from pre-lending to lending period. lending period to recall period. Cross-sectional average of volatilities and skewness from daily returns over each period. Time-series average of daily bid-ask spreads of each stock (as % price) over the specified period. If short sale constraints are important for price discovery: Expect decrease in volatility, skewness, and bid-ask spread over the lending period. Expect reversal over the recall period. If short sales are destabilizing, expect the opposite pattern. 37
38 TABLE IX: CHANGES IN VOLATILITY, SKEWNESS, AND BID-ASK SPREAD Differences-in-Differences Between Available and Withheld Stocks from Pre-, Lending, and Recall Periods Volatility differences Skewness differences Bid-ask spread differences Lending - pre-period First phase Recall - lending Second phase First phase Second phase First phase Second phase Lending - Lending - Recall - Lending - Lending - Recall - Lending - pre-period pre-period lending pre-period pre-period lending pre-period Equal-weight ** (0.14) (0.59) (0.38) (0.80) (0.78) (0.43) (0.36) (0.04) (0.31) Value-weight ** (0.50) (0.79) (0.39) (0.86) (0.82) (0.28) (0.88) (0.03) (0.18) Expected loan fee-weight (0.94) (1.00) (0.49) (0.85) (0.29) (0.19) (0.63) (0.13) (0.30) 38
39 Increasing supply decreases volatility, but insignificant. No results on skewness. Some evidence that bid-ask spreads decline when lending supply is reduced. Also do the same cross-sectional analysis as for returns. Find no robust patterns. 39
40 ROBUSTNESS Other perturbations of the sample: Including all available and withheld stocks (40 vs. 20; 23 vs. 9). Removing the high loan fee stocks the Manager requested we lend (37 vs. 20; 22 vs. 9). Removing all stocks whose loan fees decline to < 25 bps before the lending program (32 vs. 17; 19 vs. 8). Removing the high loan fee stocks the Manager requested we lend and stocks whose loan fees decline to < 25 bps before the lending program (29 vs. 17; 18 vs. 8). Results unchanged, presented in Appendix. 40
41 IMPLICATIONS Theory: We find supply shocks impact loan fees, but not asset prices. No evidence for Miller (1977) theory. Why? Duffie, Garleanu, and Pedersen (2002) show direct link between fees and prices, though link is not one-to-one. Diamond and Verrechia (1987) show no price effect, but have no loan fees in their model. Perhaps loan fees are not market clearing (agents ration shares, bundle them with other services). Or, market for stock borrowing segmented from underlying market. Hedgers may exhibit price pressure in loan market but are too small to affect underlying share prices. Future work to consider wedge between lending and underlying markets. 41
42 IMPLICATIONS Fund manager behavior: Motivation for the experiment from the Manager s point of view. Our results suggest managers (at the margin) can earn revenue from lending shares without adversely affecting share prices. Our Manager came to this conclusion, lifting restrictions on Oct. 1. How much revenue from lending? Manager earned about 10 bp annualized from lending in first phase, about 2 bp in second phase. Does not include withheld stocks. Millions of $, and large compared to the administrative costs of setting up a lending program. Difficult to generalize and can t say much about equilibrium effects. All else must be equal. 42
43 IMPLICATIONS Policy: Results consistent with the view that policies designed to restrict or alter lending supply of shares will not be effective or useful. Consistent with other studies on the supply side. [Cohen, Diether, and Malloy (2007), Diether, Lee, and Werner (2009)]. Caution: Hard to assess general equilibrium effects. Policy debates could be better informed by experiments, where one channel can be isolated holding everything else fixed. 43
44 CONCLUSION Experiment producing exogenous and sizeable supply shocks to lendable shares. We find no adverse affects on underlying stock prices, despite moving loan fees. Cross-sectional analysis yields similar findings. No evidence of supply effects for level of supply changes we generate. Implications for theory, manager behavior and policy Strong conclusions for money manager behavior at the margin. Harder to draw conclusions for general equilibrium. May inform policy debates. More experimentation worthwhile and useful. 44
Shorting Demand and the Recession of Stocks
 Supply and Demand Shifts in the Shorting Market Lauren Cohen, Karl B. Diether, Christopher J. Malloy March 23, 2005 Abstract Using proprietary data on stock loan fees and stock loan quantities from a large
The Market for Borrowing Corporate Bonds*
 The Market for Borrowing Corporate Bonds* Paul Asquith a M.I.T. Sloan School of Management and NBER [email protected] Andrea S. Au State Street Corporation [email protected] Thomas Covert Harvard University
Short Selling, Timing, and Profitability
 Short Selling, Timing, and Profitability Karl B. Diether Abstract I test whether short-sellers are profitable using proprietary short-selling contract data from 1999 to 2005. I find that short-sellers
Short Selling Bans around the World: Evidence from the 2007-09 Crisis
 Short Selling Bans around the World: Evidence from the 2007-09 Crisis Alessandro Beber Cass Business School and CEPR Marco Pagano University of Naples Federico II, CSEF, EIEF and CEPR February, 2011 Motivation
When pessimism doesn't pay off: Determinants and implications of stock recalls in the short selling market
 When pessimism doesn't pay off: Determinants and implications of stock recalls in the short selling market Oleg Chuprinin Thomas Ruf 1 UNSW UNSW Abstract Using a comprehensive dataset on securities lending,
Does Option Trading Affect the Return Predictability of Short Selling Activity?
 Does Option Trading Affect the Return Predictability of Short Selling Activity? Kalok Chan* Department of Finance Hong Kong University of Science & Technology Clear Water Bay, Hong Kong E-mail: [email protected]
Short Sell Restriction, Liquidity and Price Discovery: Evidence from Hong Kong Stock Market
 Short Sell Restriction, Liquidity and Price Discovery: Evidence from Hong Kong Stock Market Min Bai School of Economics and Finance (Albany), Massey University Auckland, New Zealand [email protected]
René Garcia Professor of finance
 Liquidity Risk: What is it? How to Measure it? René Garcia Professor of finance EDHEC Business School, CIRANO Cirano, Montreal, January 7, 2009 The financial and economic environment We are living through
Regulating Short-Sales*
 Regulating Short-Sales* by Ronel Elul S hort-selling, the practice of selling a security the seller does not own, is done in an attempt to profit from an expected decline in the price of the security.
TMX TRADING SIMULATOR QUICK GUIDE. Reshaping Canada s Equities Trading Landscape
 TMX TRADING SIMULATOR QUICK GUIDE Reshaping Canada s Equities Trading Landscape OCTOBER 2014 Markets Hours All market data in the simulator is delayed by 15 minutes (except in special situations as the
Margin-Trading and Short-Selling with Asymmetric Information
 Margin-Trading and Short-Selling with Asymmetric Information Yonglei Wang * November 2014 Abstract By studying China s margin-trading and short-selling program, this paper provides evidence that allowing
SHORT ARBITRAGE, RETURN ASYMMETRY AND THE ACCRUAL ANOMALY. David Hirshleifer* Siew Hong Teoh* Jeff Jiewei Yu** October 2010
 SHORT ARBITRAGE, RETURN ASYMMETRY AND THE ACCRUAL ANOMALY David Hirshleifer* Siew Hong Teoh* Jeff Jiewei Yu** *Merage School of Business, University of California, Irvine **Cox School of Business, Southern
Short sellers and corporate disclosures
 Short sellers and corporate disclosures Xia Chen Singapore Management University Qiang Cheng Singapore Management University Ting Luo Tsinghua University Heng Yue Peking University May 2014 Abstract We
FIN 432 Investment Analysis and Management Review Notes for Midterm Exam
 FIN 432 Investment Analysis and Management Review Notes for Midterm Exam Chapter 1 1. Investment vs. investments 2. Real assets vs. financial assets 3. Investment process Investment policy, asset allocation,
Internet Appendix to. Why does the Option to Stock Volume Ratio Predict Stock Returns? Li Ge, Tse-Chun Lin, and Neil D. Pearson.
 Internet Appendix to Why does the Option to Stock Volume Ratio Predict Stock Returns? Li Ge, Tse-Chun Lin, and Neil D. Pearson August 9, 2015 This Internet Appendix provides additional empirical results
How Securities Are Traded
 How Securities Are Traded What is this project about? You will learn how securities are traded on exchanges, particularly how to conduct margin trades, short sales, and submit limit orders. What case do
EC372 Bond and Derivatives Markets Topic #5: Options Markets I: fundamentals
 EC372 Bond and Derivatives Markets Topic #5: Options Markets I: fundamentals R. E. Bailey Department of Economics University of Essex Outline Contents 1 Call options and put options 1 2 Payoffs on options
QUANTITATIVE RESEARCH MARCH 2012
 QUANTITATIVE RESEARCH MARCH 2012 Authors Vivian Ning, CFA 312-233-7148 [email protected] Li Ma 312-233-7124 [email protected] Kirk Wang 312-233-7149 [email protected] Temi Oyeniyi, CFA 312-233-7151
Purpose of Selling Stocks Short JANUARY 2007 NUMBER 5
 An Overview of Short Stock Selling An effective short stock selling strategy provides an important hedge to a long portfolio and allows hedge fund managers to reduce sector and portfolio beta. Short selling
MULTIPLE CHOICE. Choose the one alternative that best completes the statement or answers the question.
 ECON 4110: Sample Exam Name MULTIPLE CHOICE. Choose the one alternative that best completes the statement or answers the question. 1) Economists define risk as A) the difference between the return on common
A Study of the Relation Between Market Index, Index Futures and Index ETFs: A Case Study of India ABSTRACT
 Rev. Integr. Bus. Econ. Res. Vol 2(1) 223 A Study of the Relation Between Market Index, Index Futures and Index ETFs: A Case Study of India S. Kevin Director, TKM Institute of Management, Kollam, India
THE STOCK MARKET GAME GLOSSARY
 THE STOCK MARKET GAME GLOSSARY Accounting: A method of recording a company s financial activity and arranging the information in reports that make the information understandable. Accounts payable: The
The relationship between short interest and stock returns in the Canadian market
 Journal of Banking & Finance 29 (2005) 1729 1749 www.elsevier.com/locate/jbf The relationship between short interest and stock returns in the Canadian market Lucy F. Ackert a,b, *, George Athanassakos
Analysis of Factors Influencing the ETFs Short Sale Level in the US Market
 Analysis of Factors Influencing the ETFs Short Sale Level in the US Market Dagmar Linnertová Masaryk University Faculty of Economics and Administration, Department of Finance Lipova 41a Brno, 602 00 Czech
RISK DISCLOSURE STATEMENT FOR SECURITY FUTURES CONTRACTS
 RISK DISCLOSURE STATEMENT FOR SECURITY FUTURES CONTRACTS This disclosure statement discusses the characteristics and risks of standardized security futures contracts traded on regulated U.S. exchanges.
Measuring performance Update to Insurance Key Performance Indicators
 Measuring performance Update to Insurance Key Performance Indicators John Hele Member of Executive Board and CFO of ING Group Madrid 19 September 2008 www.ing.com Agenda Performance Indicators: Background
WORKING PAPER THE OPTIONS MARKET MAKER EXCEPTION TO SEC REGULATION SHO. By Thomas Stratmann and John W. Welborn. No.
 No. 12-23 August 2012 WORKING PAPER THE OPTIONS MARKET MAKER EXCEPTION TO SEC REGULATION SHO By Thomas Stratmann and John W. Welborn The opinions expressed in this Working Paper are the author s and do
Futures Price d,f $ 0.65 = (1.05) (1.04)
 (1.04)") 24 e. Currency Futures In a currency futures contract, you enter into a contract to buy a foreign currency at a price fixed today. To see how spot and futures currency prices are related, note that holding
24 e. Currency Futures In a currency futures contract, you enter into a contract to buy a foreign currency at a price fixed today. To see how spot and futures currency prices are related, note that holding
The market for borrowing stock $
 Journal of Financial Economics 66 (2002) 271 306 The market for borrowing stock $ Gene D Avolio n Graduate School of Business Administration, Harvard University, Morgan 480, Soldiers Field Boston, MA 02163,
Understanding Fixed Income
 Understanding Fixed Income 2014 AMP Capital Investors Limited ABN 59 001 777 591 AFSL 232497 Understanding Fixed Income About fixed income at AMP Capital Our global presence helps us deliver outstanding
The Impact of Short-Selling Constraints on Financial Market Stability
 The Impact of Short-Selling Constraints on Financial Market Stability Mikhail Anufriev Jan Tuinstra 5th International Conference on Computing in Economics and Finance University of Technology, Sydney 6
Heterogeneous Beliefs and The Option-implied Volatility Smile
 Heterogeneous Beliefs and The Option-implied Volatility Smile Geoffrey C. Friesen University of Nebraska-Lincoln [email protected] (402) 472-2334 Yi Zhang* Prairie View A&M University [email protected]
Financial Time Series Analysis (FTSA) Lecture 1: Introduction
 Lecture 1: Introduction") Financial Time Series Analysis (FTSA) Lecture 1: Introduction Brief History of Time Series Analysis Statistical analysis of time series data (Yule, 1927) v/s forecasting (even longer). Forecasting is often
Financial Time Series Analysis (FTSA) Lecture 1: Introduction Brief History of Time Series Analysis Statistical analysis of time series data (Yule, 1927) v/s forecasting (even longer). Forecasting is often
Financial Markets And Financial Instruments - Part I
 Financial Markets And Financial Instruments - Part I Financial Assets Real assets are things such as land, buildings, machinery, and knowledge that are used to produce goods and services. Financial assets
Black Scholes Merton Approach To Modelling Financial Derivatives Prices Tomas Sinkariovas 0802869. Words: 3441
 Black Scholes Merton Approach To Modelling Financial Derivatives Prices Tomas Sinkariovas 0802869 Words: 3441 1 1. Introduction In this paper I present Black, Scholes (1973) and Merton (1973) (BSM) general
PRINCIPAL GLOBAL INVESTORS FUNDS. Supplement dated 31 July 2013. for the Long/Short Global Opportunities Equity Fund
 PRINCIPAL GLOBAL INVESTORS FUNDS Supplement dated 31 July 2013 for the Long/Short Global Opportunities Equity Fund This Supplement contains specific information in relation to the Long/Short Global Opportunities
SHORT SELLING, DEATH SPIRAL CONVERTIBLES, AND THE PROFITABILITY OF STOCK MANIPULATION. John D. Finnerty. Professor of Finance, Fordham University
 SHORT SELLNG, DEATH SPRAL CONVERTBLES, AND THE PROFTABLTY OF STOCK ANPULATON John D. Finnerty Professor of Finance, Fordham University arch 005 John D. Finnerty Fordham University Graduate School of Business
Technical analysis is one of the most popular methods
 Comparing Profitability of Day Trading Using ORB Strategies on Index Futures Markets in Taiwan, Hong-Kong, and USA Yi-Cheng Tsai, Mu-En Wu, Chin-Laung Lei, Chung-Shu Wu, and Jan-Ming Ho Abstract In literature,
Research Paper No. 44: How short-selling activity affects liquidity of the Hong Kong stock market. 17 April 2009
 Research Paper No. 44: How short-selling activity affects liquidity of the Hong Kong stock market 17 April 2009 Executive Summary 1. In October 2008, the SFC issued a research paper entitled Short Selling
Pricing and Strategy for Muni BMA Swaps
 J.P. Morgan Management Municipal Strategy Note BMA Basis Swaps: Can be used to trade the relative value of Libor against short maturity tax exempt bonds. Imply future tax rates and can be used to take
How To Invest In Stocks And Bonds
 Review for Exam 1 Instructions: Please read carefully The exam will have 21 multiple choice questions and 5 work problems. Questions in the multiple choice section will be either concept or calculation
Short Selling, Margin-Trading and Price Efficiency
 Title Short-selling, margin-trading and price efficiency: evidence from the Chinese market Author(s) Chang, EC; Luo, Y; Ren, J Citation The 2013 China International Conference in Finance, Shanghai, China,
Eurodollar Futures, and Forwards
 5 Eurodollar Futures, and Forwards In this chapter we will learn about Eurodollar Deposits Eurodollar Futures Contracts, Hedging strategies using ED Futures, Forward Rate Agreements, Pricing FRAs. Hedging
SHORT INTRODUCTION OF SHORT SELLING
 Financial Assets and Investing SHORT INTRODUCTION OF SHORT SELLING Dagmar Linnertová Faculty of Economics and Administration, Masaryk University, Lipová 41a, 602 00 Brno, e-mail: [email protected]
Determination of Forward and Futures Prices
 Determination of Forward and Futures Prices Options, Futures, and Other Derivatives, 8th Edition, Copyright John C. Hull 2012 Short selling A popular trading (arbitrage) strategy is the shortselling or
Risk Control and Equity Upside: The Merits of Convertible Bonds for an Insurance Portfolio
 Risk Control and Equity Upside: The Merits of Convertible Bonds for an Insurance Portfolio In a survey of insurance company Chief Investment Officers conducted by Eager, Davis & Holmes 1 in May 2009, 43%
Mortgage Loan Conduit & Securitization Two Harbors Investment Corp. November 4, 2015
 Two Harbors Investment Corp. November 4, 2015 Two Harbors Investment Corp. is proud to present a webinar titled: Mortgage Loan Conduit and Securitization. Periodic webinars from Two Harbors will provide
Paper F9. Financial Management. Fundamentals Pilot Paper Skills module. The Association of Chartered Certified Accountants
 Fundamentals Pilot Paper Skills module Financial Management Time allowed Reading and planning: Writing: 15 minutes 3 hours ALL FOUR questions are compulsory and MUST be attempted. Do NOT open this paper
Extending Factor Models of Equity Risk to Credit Risk and Default Correlation. Dan dibartolomeo Northfield Information Services September 2010
 Extending Factor Models of Equity Risk to Credit Risk and Default Correlation Dan dibartolomeo Northfield Information Services September 2010 Goals for this Presentation Illustrate how equity factor risk
General Risk Disclosure
 General Risk Disclosure Colmex Pro Ltd (hereinafter called the Company ) is an Investment Firm regulated by the Cyprus Securities and Exchange Commission (license number 123/10). This notice is provided
Balanced fund: A mutual fund with a mix of stocks and bonds. It offers safety of principal, regular income and modest growth.
 Wealth for Life Glossary Aggressive growth fund: A mutual fund that aims for the highest capital gains. They often invest in smaller emerging companies that offer maximum growth potential. Adjustable Rate
Aggregate Risk and the Choice Between Cash and Lines of Credit
 Aggregate Risk and the Choice Between Cash and Lines of Credit Viral Acharya NYU Stern School of Business, CEPR, NBER Heitor Almeida University of Illinois at Urbana Champaign, NBER Murillo Campello Cornell
Discussion of Momentum and Autocorrelation in Stock Returns
 Discussion of Momentum and Autocorrelation in Stock Returns Joseph Chen University of Southern California Harrison Hong Stanford University Jegadeesh and Titman (1993) document individual stock momentum:
Option Pricing Beyond Black-Scholes Dan O Rourke
 Option Pricing Beyond Black-Scholes Dan O Rourke January 2005 1 Black-Scholes Formula (Historical Context) Produced a usable model where all inputs were easily observed Coincided with the introduction
2 11,455. Century Small Cap Select Instl SMALL-CAP as of 09/30/2015. Investment Objective. Fund Overview. Performance Overview
 SMALL-CAP as of 09/30/2015 Investment Objective Century Small Cap Select Fund (CSCS) seeks long-term capital growth. Performance Overview Cumulative % Annualized % Quarter Year Since to Date to Date 1
CHAPTER 22: FUTURES MARKETS
 CHAPTER 22: FUTURES MARKETS PROBLEM SETS 1. There is little hedging or speculative demand for cement futures, since cement prices are fairly stable and predictable. The trading activity necessary to support
Answers to Concepts in Review
 Answers to Concepts in Review 1. (a) In the money market, short-term securities such as CDs, T-bills, and banker s acceptances are traded. Long-term securities such as stocks and bonds are traded in the
SLM CORPORATION SUPPLEMENTAL FINANCIAL INFORMATION FIRST QUARTER 2006 (Dollars in millions, except per share amounts, unless otherwise stated)
") SLM CORPORATION SUPPLEMENTAL FINANCIAL INFORMATION FIRST QUARTER 2006 (Dollars in millions, except per share amounts, unless otherwise stated) The following supplemental information should be read in connection
SLM CORPORATION SUPPLEMENTAL FINANCIAL INFORMATION FIRST QUARTER 2006 (Dollars in millions, except per share amounts, unless otherwise stated) The following supplemental information should be read in connection
Informational content of short selling disclosure: a tale of two reports
 Informational content of short selling disclosure: a tale of two reports Binh Do Monash University and Philip Gray** Monash University This draft: December 2011 Abstract: Prompted by the Global Financial
Asian Economic and Financial Review THE CAPITAL INVESTMENT INCREASES AND STOCK RETURNS
 Asian Economic and Financial Review journal homepage: http://www.aessweb.com/journals/5002 THE CAPITAL INVESTMENT INCREASES AND STOCK RETURNS Jung Fang Liu 1 --- Nicholas Rueilin Lee 2 * --- Yih-Bey Lin
Higher Education Loan Authority of the State of Missouri. Student Loan Asset-Backed Notes, Series 2012-1
 Higher Education Loan Authority of the State of Missouri Student Loan AssetBacked Notes, Series 20121 Fluctuations were noted in the Student Loan AssetBacked Notes, Series 20121 (20121 Bond) parity rates