Sample Slide Deck for IDRC Readout
|
|
|
- Dortha Williams
- 10 years ago
- Views:
Transcription
1 Sample Slide Deck for IDRC Readout Report ID:


2 Our Experts SC Photo Bruce Belfiore Senior Research Executive & Chief Executive Officer BenchmarkPortal SC Name Here Certified Auditor Senior Consultant BenchmarkPortal 2

3 Founder DR. JON ANTON Former Adjunct Professor Purdue University Center for Customer-Driven Quality 3

4 Our Database Collecting Contact Center data since 1995 Largest Call Center Performance database in the world Thousands of members in our community Forty-Eight Industry Sectors Awarded US Patent # BenchmarkPortal maintains the call center database, which is a warehouse of call center best practice statistics on thousands of call centers in 48 industry segments. This performance data is kept current and accurate, and is used by call center professionals worldwide to establish goals for best practice call center performance. 4

5 5

6 Quality Index = Effectiveness The SOURCE for Contact Centers Performance Matrix Where do you think you are today? HIGH LOW HIGH Cost Index = Efficiency LOW 6

7 Performance Matrix The real challenge is balancing caller satisfaction AND cost Intervention Needed 7

8 High Quality The SOURCE for Contact Centers Performance Matrix The real challenge is balancing caller satisfaction AND cost People Processes Technology working well Low Cost 8

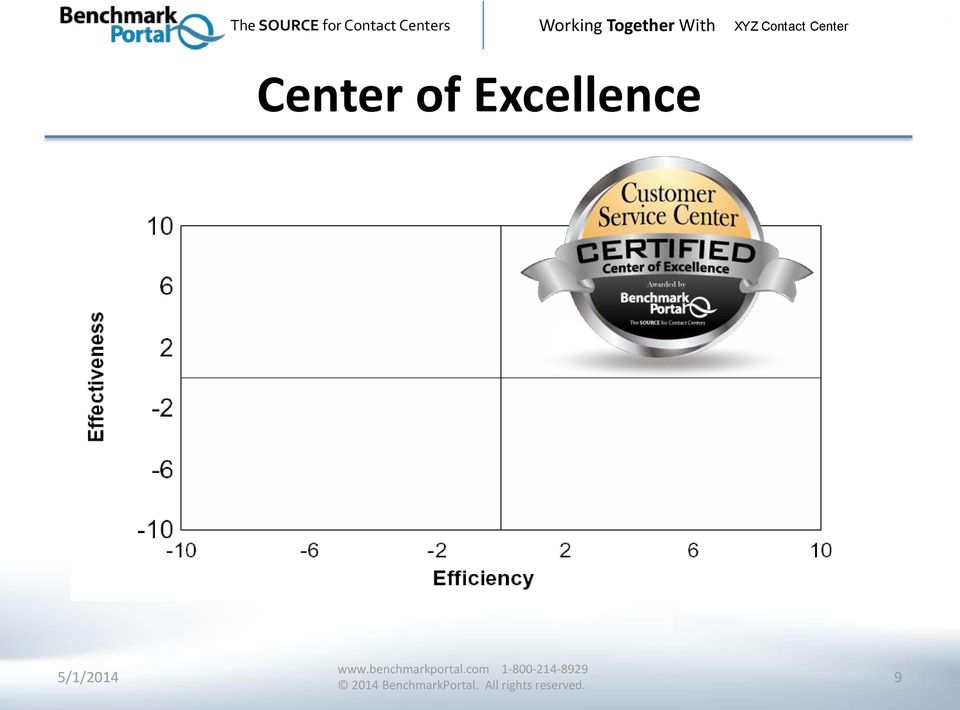
9 Center of Excellence 9
10 In-Depth RealityCheck Benchmark Report Principal Investigator Bruce Belfiore Senior Research Executive John Chatterley David Raia Jeff Grossman Director, Research & Analysis Senior Research Analysis Director of IT CONFIDENTIAL INFORMATION 10

11 Name: Tony Tiger City: Anywhere Company: State: California Country: U.S.A. Phone: XXXX Industry Sector: Sample Industry Sector Copyright 2014, BenchmarkPortal,, 126 E. Constance Avenue Santa Barbara, CA All Rights Reserved. Unless permission is granted, this material may not be copied, reproduced or coded for reproduction by any electrical, mechanical or chemical process or combination thereof, now known or later developed. For any questions or comments, please contact 11

12 Effectiveness Index (Quality) Voice Channel - Performance Working Together Matrix With The challenge of every contact center manager is to balance the quality and quantity of inbound calls handled. The patented BenchmarkPortal processes include the Performance Matrix. The Performance Matrix combines quantity KPIs on the x-axis, i.e., metrics like calls/agent/hour, average talk time, agent utilization and the like (see Section III) with quality KPIs on the y-axis, i.e., metrics like average speed of answer, time on hold and the like (see Section IV) Efficiency Index (Quantity/Cost) * Star position is based upon the accuracy of data you provided. Missing metrics will decrease the accuracy of your star position. 12
 * Star position is based upon the accuracy of data you provided. Missing metrics will decrease the accuracy of your star position. 12")
13 Goal Our Goal today is to discover how you can improve! INCREASE Effectiveness BRAND Your Center MAXIMIZE Efficiency SAVE Time & Money 13


14 Annual Budget Estimate Yearly Budget 38 2,858,906 FTE Estimated budget includes all salary, benefits, support staff to the center, technology, phones, desktop apps, training, external resources, facilities, and other costs to run a center like yours. 14

15 Call Center Classification Metrics Metric Your Value Industry Average Inbound Calls Offered 283, ,715 Annual Inbound Call Volume Handled by Agents 275, ,463 Annual Inbound Call Volume Handled by the IVR 0 77,250 Percent Business to Business 0.00% 14.20% Percent Consumer to Business % 85.80% Organized Labor (Union) -Yes N/A 0.00% Organized Labor (Union) -No Y % Full-Time Agents Part-Time Agents 0 10 Metric Your Value Industry Average Respond to Inbound Calls 63.00% 78.55% Initiate Outbound Calls 1.00% 1.35% Respond to % 8.93% Respond to On-line Web-chats 14.00% 9.46% Other 4.00% 1.71% To compare a call center s performance to its peers in the same industry, it is useful to have basic statistical information regarding volumes and agent numbers and costs. This slide exhibits these classification metrics. 15

16 Effectiveness Quality Metrics These make up the Y axis. 16

17 Effectiveness Key Performance Indicators The table below contains six KPIs indicative of the call center s effectiveness (quality). Statistics shown include your value, the industry average as provided by our database and the positive or negative gap for each KPI. Metric Your Value Industry Average Gap Top Box Customer Satisfaction in Percent 81.30% 74.66% 6.64% Bottom Box Customer Satisfaction in Percent 5.00% 3.45% -1.55% Top Box Agent Satisfaction in Percent 38.90% 43.73% -4.83% Bottom Box Agent Satisfaction in Percent 0.00% 1.88% 1.88% Inbound Calls Closed on First Call in Percent 82.30% 85.33% -3.03% Inbound Calls Average Speed of Answer in Seconds Inbound Calls Transferred in Percent 0.62% 4.70% 4.08% Average Hold Time Inbound Calls in Seconds Average Time in Queue Inbound Calls in Seconds Average Inbound Calls Abandoned in Percent 2.79% 3.03% 0.24% 17

18 Revenue at Risk What could a 1% gap in caller satisfaction cost you in terms of revenue? call volume 283,677 1% Savings 2,837 estimated* value of call $120 Total Savings $340,412 *Note: This example is taken from a cross-industries sampling. Your actual call value must be calculated and used for your individual center. 18

19 Possible Root Causes Call routing and service level issues First Call Resolution Agent training Knowledge management / CRM SME availability No immediate caller feedback to the agent Ineffective or insufficient agent coaching 19

20 Effectiveness Key Performance Indicators The table below contains six KPIs indicative of the call center s effectiveness (quality). Statistics shown include your value, the industry average as provided by our database and the positive or negative gap for each KPI. Metric Your Value Industry Average Gap Top Box Customer Satisfaction in Percent 81.30% 74.66% 6.64% Bottom Box Customer Satisfaction in Percent 5.00% 3.45% -1.55% Top Box Agent Satisfaction in Percent 38.90% 43.73% -4.83% Bottom Box Agent Satisfaction in Percent 0.00% 1.88% 1.88% Inbound Calls Closed on First Call in Percent 82.30% 85.33% -3.03% Inbound Calls Average Speed of Answer in Seconds Inbound Calls Transferred in Percent 0.62% 4.70% 4.08% Average Hold Time Inbound Calls in Seconds Average Time in Queue Inbound Calls in Seconds Average Inbound Calls Abandoned in Percent 2.79% 3.03% 0.24% 20

21 Cost of Gap Estimate What is the cost of a gap in Agent Satisfaction? -4.83% 1. Lower agent satisfaction can result in higher turnover 2. Agent satisfaction has high correlation with caller satisfaction *Can be quantified with Custom Analysis 21
22 Possible Root Causes Poor agent selection process Deficiencies in training and/or nesting Frustration with lack of Empowerment or tools Pressure resulting from under-staffing Poor relationships with supervisors Punitive call quality monitoring/coaching Perceived inadequate compensation Lack of incentives & appreciation strategies Lack of a clear career track Poor communications & organization 22
23 Effectiveness Key Performance Indicators The table below contains six KPIs indicative of the call center s effectiveness (quality). Statistics shown include your value, the industry average as provided by our database and the positive or negative gap for each KPI. Metric Your Value Industry Average Gap Top Box Customer Satisfaction in Percent 81.30% 74.66% 6.64% Bottom Box Customer Satisfaction in Percent 5.00% 3.45% -1.55% Top Box Agent Satisfaction in Percent 38.90% 43.73% -4.83% Bottom Box Agent Satisfaction in Percent 0.00% 1.88% 1.88% Inbound Calls Closed on First Call in Percent 82.30% 85.33% -3.03% Inbound Calls Average Speed of Answer in Seconds Inbound Calls Transferred in Percent 0.62% 4.70% 4.08% Average Hold Time Inbound Calls in Seconds Average Time in Queue Inbound Calls in Seconds Average Inbound Calls Abandoned in Percent 2.79% 3.03% 0.24% 23
24 Cost of Gap Estimate What is the cost of a gap in Calls Closed on First Call? -3.03% Additional calls are transferred in your center annually. Assuming this doubles the length of the call, the estimated* gap cost is approximately -$52,890 *Gap X Annual Agent Handled Call Volume X Estimated Cost Per Call 24
25 Possible Root Causes Inadequate training of front-line Agents Lack of or inadequate skills-based routing Lack of available SMEs Inadequate FAQ self-service in IVR Dead air time (queue, hold) causing abandons Inadequate knowledge management systems Poor communication of updates from other departments (marketing initiatives, new products, upgrades, etc.) Poor leveraging of social media information 25
26 Effectiveness Key Performance Indicators The table below contains six KPIs indicative of the call center s effectiveness (quality). Statistics shown include your value, the industry average as provided by our database and the positive or negative gap for each KPI. Metric Your Value Industry Average Gap Top Box Customer Satisfaction in Percent 81.30% 74.66% 6.64% Bottom Box Customer Satisfaction in Percent 5.00% 3.45% -1.55% Top Box Agent Satisfaction in Percent 38.90% 43.73% -4.83% Bottom Box Agent Satisfaction in Percent 0.00% 1.88% 1.88% Inbound Calls Closed on First Call in Percent 82.30% 85.33% -3.03% Inbound Calls Average Speed of Answer in Seconds Inbound Calls Transferred in Percent 0.62% 4.70% 4.08% Average Hold Time Inbound Calls in Seconds Average Time in Queue Inbound Calls in Seconds Average Inbound Calls Abandoned in Percent 2.79% 3.03% 0.24% 26
27 Revenue at Risk What is the cost of a gap in Average Speed of Answer? 7.81 Cost may be expressed in terms of: customer loyalty future sales caller satisfaction metrics Average Speed of Answer directly relates to Abandon Rates 27
28 Possible Root Causes Sub-optimal WFM technology: either forecasting, schedules and staffing Poor adherence to schedules Break management Restricted access to FAQ information (SME or Knowledge Management tools) Absence of timely monitoring & coaching Desktop application issues: too many/too slow/ navigation problems 28
29 Effectiveness Key Performance Indicators The table below contains six KPIs indicative of the call center s effectiveness (quality). Statistics shown include your value, the industry average as provided by our database and the positive or negative gap for each KPI. Metric Your Value Industry Average Gap Top Box Customer Satisfaction in Percent 81.30% 74.66% 6.64% Bottom Box Customer Satisfaction in Percent 5.00% 3.45% -1.55% Top Box Agent Satisfaction in Percent 38.90% 43.73% -4.83% Bottom Box Agent Satisfaction in Percent 0.00% 1.88% 1.88% Inbound Calls Closed on First Call in Percent 82.30% 85.33% -3.03% Inbound Calls Average Speed of Answer in Seconds Inbound Calls Transferred in Percent 0.62% 4.70% 4.08% Average Hold Time Inbound Calls in Seconds Average Time in Queue Inbound Calls in Seconds Average Inbound Calls Abandoned in Percent 2.79% 3.03% 0.24% 29
30 Cost of Gap Estimate What is the cost of a Gap in Transfers? 4.08% Additional calls are transferred in your center annually. Assuming this doubles the length of the call, the estimated* gap cost is approximately $0 *Gap X Annual Agent Handled Call Volume X Estimated Cost Per Call 30
31 Possible Root Causes Improper routing and/or distribution of calls (technology, processes) Incomplete agent product knowledge Inadequate access to SMEs for assistance Inadequate knowledge management/ CRM systems Lack of visibility to other department s systems Failure to integrate frequently escalated questions into tier one training updates. 31
32 Effectiveness Key Performance Indicators The table below contains six KPIs indicative of the call center s effectiveness (quality). Statistics shown include your value, the industry average as provided by our database and the positive or negative gap for each KPI. Metric Your Value Industry Average Gap Top Box Customer Satisfaction in Percent 81.30% 74.66% 6.64% Bottom Box Customer Satisfaction in Percent 5.00% 3.45% -1.55% Top Box Agent Satisfaction in Percent 38.90% 43.73% -4.83% Bottom Box Agent Satisfaction in Percent 0.00% 1.88% 1.88% Inbound Calls Closed on First Call in Percent 82.30% 85.33% -3.03% Inbound Calls Average Speed of Answer in Seconds Inbound Calls Transferred in Percent 0.62% 4.70% 4.08% Average Hold Time Inbound Calls in Seconds Average Time in Queue Inbound Calls in Seconds Average Inbound Calls Abandoned in Percent 2.79% 3.03% 0.24% 32
33 Revenue at Risk What is the annual cost of a gap in Hold Time? Additional Costs* may be incurred: Wasted agent time Customer satisfaction metrics Customer loyalty and future sales -$##,#### Must be calibrated by: Percentage of calls put on Hold Impact on First Call Resolution Rate *Can be quantified with Custom Analysis 33
34 Possible Root Causes Sub-optimal routing or distribution of calls Incomplete or ineffective product knowledge Access to SMEs for assistance Improper use of Hold vs. ACWT Ineffective call recording/monitoring/coaching Desktop navigation issues in Search mode May relate to First Call Resolution metrics 34
35 Effectiveness Key Performance Indicators The table below contains six KPIs indicative of the call center s effectiveness (quality). Statistics shown include your value, the industry average as provided by our database and the positive or negative gap for each KPI. Metric Your Value Industry Average Gap Top Box Customer Satisfaction in Percent 81.30% 74.66% 6.64% Bottom Box Customer Satisfaction in Percent 5.00% 3.45% -1.55% Top Box Agent Satisfaction in Percent 38.90% 43.73% -4.83% Bottom Box Agent Satisfaction in Percent 0.00% 1.88% 1.88% Inbound Calls Closed on First Call in Percent 82.30% 85.33% -3.03% Inbound Calls Average Speed of Answer in Seconds Inbound Calls Transferred in Percent 0.62% 4.70% 4.08% Average Hold Time Inbound Calls in Seconds Average Time in Queue Inbound Calls in Seconds Average Inbound Calls Abandoned in Percent 2.79% 3.03% 0.24% 35

36 Revenue at Risk What is the annual cost of a gap in Time in Queue? Additional Costs* may be incurred: Wasted agent time Customer satisfaction metrics Customer loyalty and future sales Must be calibrated by: Percentage of calls put on Hold Impact on First Call Resolution Rate *Can be quantified with Custom Analysis 36
37 Possible Root Causes Missing or Inadequate skills-based routing Sub-optimal workforce management Poor adherence to schedule Poor access to SMEs for assistance Lack of monitoring & coaching on call closure Desktop CRM issues: to few / many, slow navigation Insufficient staffing 37
38 Effectiveness Key Performance Indicators The table below contains six KPIs indicative of the call center s effectiveness (quality). Statistics shown include your value, the industry average as provided by our database and the positive or negative gap for each KPI. Metric Your Value Industry Average Gap Top Box Customer Satisfaction in Percent 81.30% 74.66% 6.64% Bottom Box Customer Satisfaction in Percent 5.00% 3.45% -1.55% Top Box Agent Satisfaction in Percent 38.90% 43.73% -4.83% Bottom Box Agent Satisfaction in Percent 0.00% 1.88% 1.88% Inbound Calls Closed on First Call in Percent 82.30% 85.33% -3.03% Inbound Calls Average Speed of Answer in Seconds Inbound Calls Transferred in Percent 0.62% 4.70% 4.08% Average Hold Time Inbound Calls in Seconds Average Time in Queue Inbound Calls in Seconds Average Inbound Calls Abandoned in Percent 2.79% 3.03% 0.24% 38
39 Revenue at Risk What is the cost of a gap in Calls Abandoned? 0.24% Does your business have Customer Retention issues? How many of your Abandoned calls don t call back? Did you know you can you estimate* your average revenue or profit per lost customer? *Can be quantified with Custom Analysis 39
40 Long answer times due to: Possible Root Causes Improper forecasting/scheduling Poor adherence to schedule Poorly managed breaks Lack of call-back option where needed Ineffective Wait time messaging Poorly constructed IVR Confusing/incomplete menu Uninteresting/annoying messages/music Poor audio quality 40
41 Efficiency Cost Metrics These make up the X axis. 41
42 Efficiency Key Performance Indicators The table below contains six KPIs indicative of the call center s efficiency (quality). Statistics shown include your value, the industry average as provided by our database and the positive or negative gap for each KPI. Metric Your Value Industry Average Gap Inbound Calls per Agent per Hour Cost per Inbound Call in Dollars $6.34 $5.26 -$1.08 Average Inbound Call Talk Time in Minutes Average Inbound After Call Work in Minutes Agent Utilization in Percent 74.25% 73.39% 0.86% Agent Occupancy in Percent 93.33% 80.72% 12.61% Adherence to Schedule in Percent 96.00% 93.72% 2.29% Average Agent Attendance in Percent 97.00% 96.26% 0.74% Inbound Call Auxiliary Time in Percent 22.51% 17.02% -5.49% Agents/Supervisor Ratio Turnover of Full-time Agents in Percent 11.00% 26.05% 15.05% 42
43 Cost of Gap Estimate What is the cost of a gap in Calls per Agent per Hour? 0.82 Estimated* for your size Center: $0 *Gap X FTE X burdened Agent cost per call 43
44 Possible Root Causes Inaccurate forecasting Sub-optimal workforce scheduling Adherence to schedule management Performance Management Monitoring and Coaching Agent Training: Training on call closure Screen navigation Efficient ACWT 44
45 Efficiency Key Performance Indicators The table below contains six KPIs indicative of the call center s efficiency (quality). Statistics shown include your value, the industry average as provided by our database and the positive or negative gap for each KPI. Metric Your Value Industry Average Gap Inbound Calls per Agent per Hour Cost per Inbound Call in Dollars $6.34 $5.26 -$1.08 Average Inbound Call Talk Time in Minutes Average Inbound After Call Work in Minutes Agent Utilization in Percent 74.25% 73.39% 0.86% Agent Occupancy in Percent 93.33% 80.72% 12.61% Adherence to Schedule in Percent 96.00% 93.72% 2.29% Average Agent Attendance in Percent 97.00% 96.26% 0.74% Inbound Call Auxiliary Time in Percent 22.51% 17.02% -5.49% Agents/Supervisor Ratio Turnover of Full-time Agents in Percent 11.00% 26.05% 15.05% 45
46 Cost of Gap Estimate What is the cost of a gap in Cost per Call in Dollars? -$1.08 Estimated* for your size Center: -$298,394 *Gap per call X Agent Handled Calls X burdened Agent cost per call 46

47 Possible Root Causes Poorly implemented or missing self-service option in IVR Lengthy ATT HOLD & ACWT Lack of, or poorly implemented, desktop CRM tools Inadequate product-knowledge training for front-line agents Training on call-management Inadequate access to SMEs High number of transferred/redirected calls High overheads, technology costs, etc. 47
48 Efficiency Key Performance Indicators The table below contains six KPIs indicative of the call center s efficiency (quality). Statistics shown include your value, the industry average as provided by our database and the positive or negative gap for each KPI. Metric Your Value Industry Average Gap Inbound Calls per Agent per Hour Cost per Inbound Call in Dollars $6.34 $5.26 -$1.08 Average Inbound Call Talk Time in Minutes Average Inbound After Call Work in Minutes Agent Utilization in Percent 74.25% 73.39% 0.86% Agent Occupancy in Percent 93.33% 80.72% 12.61% Adherence to Schedule in Percent 96.00% 93.72% 2.29% Average Agent Attendance in Percent 97.00% 96.26% 0.74% Inbound Call Auxiliary Time in Percent 22.51% 17.02% -5.49% Agents/Supervisor Ratio Turnover of Full-time Agents in Percent 11.00% 26.05% 15.05% 48
49 Cost of Gap Estimate What is the cost of a gap in Average Talk Time? Estimated* for your size Center: -$449,414 *Gap X Total Agent handled calls X burdened Agent Cost per Minute 49
50 Possible Root Causes Lack of training in call control Inefficient Agent Desktop, CRM or multiple/slow apps Limited access to on-line knowledge tools Need for CTI and screen pops Inadequate call recording and quality monitoring Limited access to SMEs Inadequate incentives for efficiency 50
51 Efficiency Key Performance Indicators The table below contains six KPIs indicative of the call center s efficiency (quality). Statistics shown include your value, the industry average as provided by our database and the positive or negative gap for each KPI. Metric Your Value Industry Average Gap Inbound Calls per Agent per Hour Cost per Inbound Call in Dollars $6.34 $5.26 -$1.08 Average Inbound Call Talk Time in Minutes Average Inbound After Call Work in Minutes Agent Utilization in Percent 74.25% 73.39% 0.86% Agent Occupancy in Percent 93.33% 80.72% 12.61% Adherence to Schedule in Percent 96.00% 93.72% 2.29% Average Agent Attendance in Percent 97.00% 96.26% 0.74% Inbound Call Auxiliary Time in Percent 22.51% 17.02% -5.49% Agents/Supervisor Ratio Turnover of Full-time Agents in Percent 11.00% 26.05% 15.05% 51
52 Cost of Gap Estimate What is the cost of a gap in After Call Work Time? 0.73 Estimated* for your size Center: $0 *Gap X Agent handled calls X burdened Agent Cost per Minute. 52
53 Possible Root Causes Agent desktop design / slow systems or network / difficult navigation Inability to input information during call Talk and Type Improper use / abuse of ACWT by agents Excessive documentation requirements Lack of effective call monitoring and coaching Training on data capture during the call 53
54 Efficiency Key Performance Indicators The table below contains six KPIs indicative of the call center s efficiency (quality). Statistics shown include your value, the industry average as provided by our database and the positive or negative gap for each KPI. Metric Your Value Industry Average Gap Inbound Calls per Agent per Hour Cost per Inbound Call in Dollars $6.34 $5.26 -$1.08 Average Inbound Call Talk Time in Minutes Average Inbound After Call Work in Minutes Agent Utilization in Percent 74.25% 73.39% 0.86% Agent Occupancy in Percent 93.33% 80.72% 12.61% Adherence to Schedule in Percent 96.00% 93.72% 2.29% Average Agent Attendance in Percent 97.00% 96.26% 0.74% Inbound Call Auxiliary Time in Percent 22.51% 17.02% -5.49% Agents/Supervisor Ratio Turnover of Full-time Agents in Percent 11.00% 26.05% 15.05% 54
55 Cost of Gap Estimate What is the cost of a gap in Agent Utilization? 0.86% Estimated* for your size Center: $0 * Must be calculated on an individual center basis 55
56 Possible Root Causes Lack of focus on Productivity metrics Missing / inadequate WFM system Mismatch of forecasted call volume to agent scheduling resulting in overstaffing Mismanagement of Auxiliary Time (AUX) Poorly scheduled agent breaks/lunches Inconsistent consequence management 56
57 Efficiency Key Performance Indicators The table below contains six KPIs indicative of the call center s efficiency (quality). Statistics shown include your value, the industry average as provided by our database and the positive or negative gap for each KPI. Metric Your Value Industry Average Gap Inbound Calls per Agent per Hour Cost per Inbound Call in Dollars $6.34 $5.26 -$1.08 Average Inbound Call Talk Time in Minutes Average Inbound After Call Work in Minutes Agent Utilization in Percent 74.25% 73.39% 0.86% Agent Occupancy in Percent 93.33% 80.72% 12.61% Adherence to Schedule in Percent 96.00% 93.72% 2.29% Average Agent Attendance in Percent 97.00% 96.26% 0.74% Inbound Call Auxiliary Time in Percent 22.51% 17.02% -5.49% Agents/Supervisor Ratio Turnover of Full-time Agents in Percent 11.00% 26.05% 15.05% 57
58 Cost of Gap Estimate What is the cost of gap in Occupancy? 12.61% Estimated* for your size Center: $0 *Industry average Gap between actual agent logged-in hours divided by scheduled available hours X your burdened cost per Agent hour 58
59 Possible Root Causes Inadequate workforce management processes and/or systems Lack of focus on adherence to schedule Mismanagement of Auxiliary Time (AUX) Limited floor management by supervisors Lack of incentives/recognition for high performance (schedule adherence) 59
60 Efficiency Key Performance Indicators The table below contains six KPIs indicative of the call center s efficiency (quality). Statistics shown include your value, the industry average as provided by our database and the positive or negative gap for each KPI. Metric Your Value Industry Average Gap Inbound Calls per Agent per Hour Cost per Inbound Call in Dollars $6.34 $5.26 -$1.08 Average Inbound Call Talk Time in Minutes Average Inbound After Call Work in Minutes Agent Utilization in Percent 74.25% 73.39% 0.86% Agent Occupancy in Percent 93.33% 80.72% 12.61% Adherence to Schedule in Percent 96.00% 93.72% 2.29% Average Agent Attendance in Percent 97.00% 96.26% 0.74% Inbound Call Auxiliary Time in Percent 22.51% 17.02% -5.49% Agents/Supervisor Ratio Turnover of Full-time Agents in Percent 11.00% 26.05% 15.05% 60
61 Cost of Gap Estimate 2.29% What is the cost of a gap in Adherence to Schedule? Estimated* for your size Center: -$##,#### * Must be calculated on an individual center basis 61
62 Possible Root Causes Inadequate or missing WFM tool Lack of management s focus on the importance of adherence to schedule Inconsistent expectation/consequence management Lack of agent incentives/recognition to comply to scheduled call handling time Poorly scheduled breaks/lunches Low agent motivation & satisfaction 62
63 Efficiency Key Performance Indicators The table below contains six KPIs indicative of the call center s efficiency (quality). Statistics shown include your value, the industry average as provided by our database and the positive or negative gap for each KPI. Metric Your Value Industry Average Gap Inbound Calls per Agent per Hour Cost per Inbound Call in Dollars $6.34 $5.26 -$1.08 Average Inbound Call Talk Time in Minutes Average Inbound After Call Work in Minutes Agent Utilization in Percent 74.25% 73.39% 0.86% Agent Occupancy in Percent 93.33% 80.72% 12.61% Adherence to Schedule in Percent 96.00% 93.72% 2.29% Average Agent Attendance in Percent 97.00% 96.26% 0.74% Inbound Call Auxiliary Time in Percent 22.51% 17.02% -5.49% Agents/Supervisor Ratio Turnover of Full-time Agents in Percent 11.00% 26.05% 15.05% 63
64 Cost of Gap Estimate What is the cost of a gap in Average Agent Attendance? 0.74% Estimated* for your size Center: -$##,#### * Must be calculated on an individual center basis 64
65 Possible Root Causes Low agent morale Lack of incentives / recognition / rewards for good attendance Inconsistent expectation / consequence management Lack of scheduling to fit agent needs Possible conflicts with other members of team or with management 65
66 Efficiency Key Performance Indicators The table below contains six KPIs indicative of the call center s efficiency (quality). Statistics shown include your value, the industry average as provided by our database and the positive or negative gap for each KPI. Metric Your Value Industry Average Gap Inbound Calls per Agent per Hour Cost per Inbound Call in Dollars $6.34 $5.26 -$1.08 Average Inbound Call Talk Time in Minutes Average Inbound After Call Work in Minutes Agent Utilization in Percent 74.25% 73.39% 0.86% Agent Occupancy in Percent 93.33% 80.72% 12.61% Adherence to Schedule in Percent 96.00% 93.72% 2.29% Average Agent Attendance in Percent 97.00% 96.26% 0.74% Inbound Call Auxiliary Time in Percent 22.51% 17.02% -5.49% Agents/Supervisor Ratio Turnover of Full-time Agents in Percent 11.00% 26.05% 15.05% 66
67 Cost of Gap Estimate -5.49% What is the cost of a gap in Auxiliary Time in Percent? Estimated* for your size Center: -$53,966 *GAP X Occupancy X Available Hours X Burdened Agent cost per hour 67

68 Possible Root Causes Improper use of Aux time (breaks, lunches, unauthorized breaks) Possible practice of Aux-Shuffle by agents to move them to the end of the nextavailable agent queue in the ACD. Need for extra Aux-time training and team communication compared with the norm (new centers, centers with high turnover, etc.) 68
69 Efficiency Key Performance Indicators The table below contains six KPIs indicative of the call center s efficiency (quality). Statistics shown include your value, the industry average as provided by our database and the positive or negative gap for each KPI. Metric Your Value Industry Average Gap Inbound Calls per Agent per Hour Cost per Inbound Call in Dollars $6.34 $5.26 -$1.08 Average Inbound Call Talk Time in Minutes Average Inbound After Call Work in Minutes Agent Utilization in Percent 74.25% 73.39% 0.86% Agent Occupancy in Percent 93.33% 80.72% 12.61% Adherence to Schedule in Percent 96.00% 93.72% 2.29% Average Agent Attendance in Percent 97.00% 96.26% 0.74% Inbound Call Auxiliary Time in Percent 22.51% 17.02% -5.49% Agents/Supervisor Ratio Turnover of Full-time Agents in Percent 11.00% 26.05% 15.05% 69
70 Cost of Gap Estimate What is the cost of a gap in Agent Supervisor Ratio? Estimated* for your size Center: -$##,#### *Variables must be addressed and calculated on an individual center basis 70
71 Possible Root Causes Lack of Leads to support and assist agents in team Small call center (not necessarily a problem) New center or center with high turnover Too many supervisor duties, requiring smaller teams per supervisor Requires a Reality check in smaller centers 71
72 Efficiency Key Performance Indicators The table below contains six KPIs indicative of the call center s efficiency (quality). Statistics shown include your value, the industry average as provided by our database and the positive or negative gap for each KPI. Metric Your Value Industry Average Gap Inbound Calls per Agent per Hour Cost per Inbound Call in Dollars $6.34 $5.26 -$1.08 Average Inbound Call Talk Time in Minutes Average Inbound After Call Work in Minutes Agent Utilization in Percent 74.25% 73.39% 0.86% Agent Occupancy in Percent 93.33% 80.72% 12.61% Adherence to Schedule in Percent 96.00% 93.72% 2.29% Average Agent Attendance in Percent 97.00% 96.26% 0.74% Inbound Call Auxiliary Time in Percent 22.51% 17.02% -5.49% Agents/Supervisor Ratio Turnover of Full-time Agents in Percent 11.00% 26.05% 15.05% 72
73 Cost of Gap Estimate What is the cost of a gap in Turnover? 15.05% Estimated* for your size Center: $0 *Gap X Total FTE X Cost to bring a new agent on board 73
74 Possible Root Causes Ineffective applicant screening Ineffective agent training Lack agent Recognition/incentives Frustration with lack of Empowerment or tools Poor relationship with supervisor Untrained/unskilled supervisors Punitive call quality monitoring Inadequate compensation Absence of a clear career track 74
75 Multi Channel Metrics
76 Multi Channel Metrics Multichannel KPI comparisons depicted in this section aggregate multichannel data for All Industries in our growing database until such time as sufficient data has been gathered and validated to allow Industry-specific comparisons. All Industry comparisons with your Industry are useful for directional insights into performance improvement but are not to be considered definitive for a specific Industry. Annual Volume Your Value All Industry Average Outbound Calls Annual Volume 7, ,612 Annual Total Volume 78,448 64,329 Social Media Annual Volume 300 3,468 Web Chat Annual Volume 61,853 25,174 Postal Mail Annual Volume 3,408 69,716 Fax Annual Volume N/A 10,349 Other Annual Volume 15, ,
77 Multi Channel Metrics Outbound Calls Your Value All Industry Average Gap Outbound Calls Average Talk Time in MINUTES Outbound Calls After Call Work Time in MINUTES Outbound Calls Average Cost Per $3.72 $4.92 $ Your Value All Industry Average Gap Response Time in HOURS Average Handle Time in MINUTES First Contact Resolution Rate Percent 99.00% 80.60% $0.18 Contact Upsell Rate N/A 7.61% N/A Average Cost Per $6.55 $8.04 $1.49 Social Media Social Media Your Value All Industry Average Gap Social Media Response Time in HOURS Social Media Average Handle Time in MINUTES Social Media Cost Per N/A $3.00 N/A
78 Multi Channel Metrics Web Chat Your Value All Industry Average Gap Web Chat Response Time in SECONDS Web Chat Average Handle Time in MINUTES Web Chat First Contact Resolution Rate Percent 98.00% 70.60% 27.40% Web Contact Upsell Rate N/A 5.57% N/A Web Chat Cost Per $6.47 $8.71 -$2.24 Postal Mail Postal Mail Your Value All Industry Average Gap Postal Mail Handle Time in MINUTES Postal Mail Cost Per $3.72 $10.45 $6.73 Fax Fax Your Value All Industry Average Gap Fax Average Handle Time in MINUTES N/A 1, N/A Fax Mail Cost Per N/A $7.60 N/A Other Other Your Value All Industry Average Gap Other Average Handle Time in MINUTES Other Cost Per $5.67 $14.36 $
79 Summary of Findings 79
80 Cost of Performance Gaps Important notes: These are estimates based on results from the Reality Check Calculator. Amounts may overlap (double-count) benefits and therefore be overstated. Caller Satisfaction may be tied to top line revenues or to profits. Effectiveness Metrics Cost Efficiency Metrics Cost Caller Satisfaction Inbound Calls per Agent / Hour $0 Agent Satisfaction $0 Cost Per Call -$298,394 Calls Closed on First Call -$52,890 After Call Work Time $0 Calls Transferred $0 Turnover of Full - Time - Agents $0 Average Speed of Answer $0 Average Talk Time -$449,414 Average Hold Time Agent Utilization $0 80% Calls Handled Agent Occupancy $0 Average Time in Queue Aux Time -$53,966 Average Calls Abandoned Average Agent Attendance Adherence to Schedule Agent / Supervisor Ratio 80
81 24 Processes That Impact Your Center Hiring New Agents Training Agents Agent Development Real-Time Expert Hub for Agents Agent Compensation Service Improvement Initiatives Information Access Agent Satisfaction Measurement Call Quality Monitoring Agent Coaching Call Routing Call Center Communications Analytics and Reporting Call Center Performance Evaluation Caller Satisfaction Measurement Caller Service Recovery Agent Workforce Optimization Caller Self Service Performance Benchmarking Caller Relationship Management Teleservices Outsourcing Facilities Management Information Technology Telecommunications 81
82 Follow up Ideas On-Site Call Center Assessments Standard Assessment includes In-depth Benchmark, Caller Survey, Agent Survey 2-day visit provides detailed findings, conclusions and recommendations Engagements are led by certified auditor and include ongoing follow-up Specialty Assessments available focusing on IVR Optimization, Quality, Technology, Agent Morale, Social Media, etc. Call Center Certification Conducted annually, based on performance Offered on a 1-year to 4-year plan College of Call Center Excellence 3 Day Best Practices Workshop for Managers Other certificated courses: WFM, QA, SM, etc. ibenchmark This automated benchmarking product puts technology and advanced processes to work for people who manage contact centers without the hassle of finding and inputting the metrics manually. 82
83 An Onsite Assessment Plan 1. Define and validate the 22 key metrics to be benchmarked specific to your industry and operations 2. Increase the effectiveness and efficiency of the call center to achieve best in class performance 3. Assist client to determine the best report analytics that should be used to drive management goals 4. Strengthen the 24 internal processes and create a Road Map of actionable recommendations for change 5. Ultimately to attain status of Certified Center of Excellence 83
84 Thank You For Your Participation! Welcome to our community of best practices professionals! 84
RIGHTNOW MULTI-CHANNEL CONTACT CENTER BENCHMARK REPORT
 RIGHTNOW MULTI-CHANNEL CONTACT CENTER BENCHMARK REPORT Improving the Customer Experience While Reducing Operating Costs 1 2009 RightNow Technologies. All rights reserved. RightNow and RightNow logo are
Also used as a reference and resource for ROI Analyses and Onsite Assessments of performance, including process findings and recommendations.
 GLOSSARY OF TERMS FOR CONTACT CENTERS To be used in conjunction with Single Channel or Multi-Channel 18-KPI Contact Center RealityCheck surveys and/or 41- KPI In-Depth RealityCheck TM surveys. Also used
World Wide Industry Report (Sample) Industry
 Industry") World Wide Industry Report (Sample) Industry February 2015 World Wide Industry Benchmark Report for Contact Centers in the (Sample) Industry Bruce Belfiore Senior Research Executive John Chatterley Senior
World Wide Industry Report (Sample) Industry February 2015 World Wide Industry Benchmark Report for Contact Centers in the (Sample) Industry Bruce Belfiore Senior Research Executive John Chatterley Senior
How-to Guide: Top Ways to Improve Contact Center Performance
 Top Ways to Improve Contact Center Performance HOW ADVANCED TECHNOLOGY IS HELPING CONTACT CENTERS ACHIEVE KEY PERFORMANCE INDICATORS Executive Summary Recent studies have demonstrated a positive relationship
Small Businesses Need Contact Centers to Deliver Great Service
 Small Businesses Need Contact Centers to Deliver Great Service March 2014 Sponsored by: - 1 - DMG Consulting LLC Table of Contents Cloud-Based Contact Center Solutions are Ideal for Small Businesses...
Performance Matrix Exhibit 1
 Background A White Paper Optimizing your Call Center through Simulation By Bill Hall, Call Center Services and Dr. Jon Anton, Purdue University The challenge for today's call centers is providing value-added
A New Look at the Call Center Top Twenty
 A New Look at the Call Center Top Twenty The evolution of a simple call center into a multi-channel contact center doesn t just happen overnight. You many need to add or upgrade technologies, and certainly
Contact Center Solutions
 OVERVIEW MITEL Contact Center Solutions Strengthen Customer Relationships While Protecting the Bottom Line Your contact center is the primary interface to your organization, for your most valuable asset
CONTACT CENTER SOLUTIONS
 BROCHURE CONTACT CENTER SOLUTIONS STRENGTHEN CUSTOMER RELATIONSHIPS WHILE PROTECTING THE BOTTOM LINE. Your contact center is the primary interface to your organization, for your most valuable asset your
Solution Ought to be Delivering
 October 2008 Six Essential Capabilities your Workforce Management Solution Ought to be Delivering Optimize Contact Center Performance Table of contents Executive Summary...3 Workforce Management Today...4
Contact Center Solutions
 OVERVIEW MITEL Contact Center Solutions Strengthen Customer Relationships While Protecting the Bottom Line Your contact center is the primary interface to your organization for your most valuable asset
Schedule Adherence: WHITE PAPER. 7 Not- So- Best Practices and How to Make Them Better. Authored by: Rebecca Wise Girson Wise Workforce Strategies
 WHITE PAPER Schedule Adherence: 7 Not- So- Best Practices and How to Make Them Better Authored by: Rebecca Wise Girson Wise Workforce Strategies Sponsored by: NICE Systems Executive Summary Many of today
Contact Center Performance Management Software
 Markets, W. Close Research Note 7 March 2003 Contact Center Performance Software Enterprises face critical challenges in contact center management. Capitalizing on people, performance and analytics will
Improving Inside Sales Production with Automation
 Improving Inside Sales Production with Automation Improving Inside Sales Production with Automation A recent Noble Systems survey of Inside Sales Teams revealed that while one-half of the organizations
About Talkdesk. 10 KPIs That Affect Customer Satisfaction With Call Center Service 2
 10 KPIs That Affect Customer Satisfaction With Call Center Service 2 About Talkdesk Talkdesk is easy-to-use, cloud-based call center software that helps growing businesses provide excellent customer service
customer interaction solutions Contact Centres that Enhance Customer Engagement
 customer interaction solutions Contact Centres that Enhance Customer Engagement The opportunities for companies to gather and process information can influence reputation and brand, as well as drive sales.
Contact Center Solutions
 1098_5394-Contact_Centre_Solutions_newlook:Layout 1 1/11/10 10:53 AM Page 1 OVERVIEW MITEL Contact Center Solutions Strengthen Customer Relationships While Protecting the Bottom Line Your contact center
Mitel MiContact Center Enterprise & Business
 Mitel MiContact Center Enterprise & Business For The MiVoice Business Platform Strengthen customer relationships while protecting the bottom line Your contact center is the primary interface to your organization,
Upstream Works Overview
 Upstream Works Software June 2009 Introduction Upstream Works solutions connect customer experience to every aspect of your contact center performance. We provide a complete suite of agent and management
Creating Real Value for Your Customers and Your Organization in the Call Center
 2011 The Business Value in Balancing Call Center Efficiency with Customer Satisfaction Creating Real Value for Your Customers and Your Organization in the Call Center Sponsored by 1 Striking the Balance
Call Center Glossary. Call Center Resources
 Call Center Resources Call Center Glossary after-call work (ACW) The work that an agent completes after a call ends. It can include entering activity codes, completing forms or sending an outbound communication.
Making WFM Work: Best Practices and ROI Model
 The Power of Real-Time Delivery: Using Agent Idle Time to Improve Service Making WFM Work: Best Practices and ROI Model Sponsored By: 2011 DMG Consulting LLC - 1 - April 2011 Executive Summary The contact
Call Center Metrics: Glossary of Terms
 Call Center Metrics: Glossary of Terms A. abandoned call. A call or other type of contact that has been offered into a communications network or telephone system but is terminated by the person originating
The Evolving Role of Process Automation and the Customer Service Experience
 The Evolving Role of Process Automation and the Customer Service Experience Kyle Lyons Managing Director Ponvia Technology Gina Clarkin Product Manager Interactive Intelligence Table of Contents Executive
Welcome! Thank you for your interest in the 2010 ICMI Global Call Center of the Year Award, and best of luck!
 Welcome! Welcome! This is the application for the 2010 ICMI Global Call Center of the Year Award. This coveted award will be presented to the one large call center AND the one small-medium call center
The Right Way to Do Contact Center Reporting
 The Right Way to Do Contact Center Reporting 2012 Sponsored By: - i - DMG Consulting LLC Table of Contents Introduction... 1 Contact Center Reporting Requirements... 2 Top Contact Center Key Performance
Executive Insight: Multi-Sourcing. By Rudy Vidal, incontact and Matt McConnell, Knowlagent
 Executive Insight: Multi-Sourcing By Rudy Vidal, incontact and Matt McConnell, Knowlagent Although call center environments vary, most executives share two common goals for improving the frontline: to
OPEN STANDARDS BENCHMARKING MEASURE LIST
 ABOUT APQC's The APQC Open Standards Benchmarking measure list concisely lists all of the measures currently available through APQC's benchmarking portal for its members. These measures are organized by
Everything you need to know about call center service level. talkdesk www.talkdesk.com // 2
 // 2 // table of contents // INTRODUCTION // 04 01 // Selecting a Service Level Objective // 08 02 // Calculating Service Level // 17 03 // Causes of Low Service Level // 26 04 // How to Enhance Service
Volume Challenges? Technology Can Help A look at the many ways in which technology is a resource for managing peaks and unpredictable volume.
 tech line / may 2013 Volume Challenges? Technology Can Help A look at the many ways in which technology is a resource for managing peaks and unpredictable volume. By Brian Hinton, Strategic Contact Pipeline
E Source Multichannel Metrics Survey 2012
 E Source Multichannel s Survey 2012 Instructions Fill in only the fields highlighted in blue; the yellow fields will automatically populate with the calculated s. In the "Number" column please use numerals;
Business Process Services. White Paper. Managing Customer Experience: Strategies for Success
 Business Process Services White Paper Managing Customer Experience: Strategies for Success About the Author Ashwin Fernandes, Assistant Manager, TCS Ashwin is a practice consultant in the Innovation and
Contents. Specialty Answering Service. All rights reserved.
 [Type text] Contents 1 Introduction... 3 2 Service Metrics... 5 2.1 Accessibility Metrics... 5 2.1.1 Blockage... 5 2.1.2 Hours of Operation... 5 2.1.3 Abandoned Calls... 5 2.2 Speed of Service... 6 2.2.1
2006 Speech Analytics Market Report
 Real-Time Coaching Builds World- Class Contact Centers 2006 Speech Analytics Market Report Contact Center Manager s KPI Survival Contact Guide Center Manager s KPI Survival Guide Donna Fluss, Principal
Value of Interactive Intelligence. Proposal for Company XYZ. Tool and Model independently developed by: Version: Model v2.24, Report v2.
 Value of Interactive Intelligence Proposal for Company XYZ Tool and Model independently developed by: Version: Model v2.24, Report v2.3 Disclaimer: NOTICE - THIS INFORMATION IS PROVIDED TO YOU AS A TOOL
deeper Transformation in the contact center environment
 IBM Business Consulting Services Transformation in the contact center environment Balancing cost, the customer experience and revenue enhancement to truly differentiate the contact center. deeper Executive
Enabling Chat -- Key Success Factors in Chat Implementation
 Enabling Chat -- Key Success Factors in Chat Implementation 0 WHY SWITCH TO CHAT SUPPORT? Benefits of Chat Support Additional method of support for customers Concurrent sessions improve productivity Reduced
IT Service Desk Unit Opportunities for Improving Service and Cost-Effectiveness
 AUDITOR GENERAL S REPORT ACTION REQUIRED IT Service Desk Unit Opportunities for Improving Service and Cost-Effectiveness Date: September 18, 2013 To: From: Wards: Audit Committee Auditor General All Reference
QPC MIG benefits and applications - multi-tenanted data, better reporting and added value services for hosted telecoms providers
 QPC MIG benefits and applications - multi-tenanted data, better reporting and added value services for hosted telecoms providers To benefit from economies of scale hosted providers want to partition contact
Contact Center Discovery Exercise
 Contact Center Discovery Exercise Introduction The County is currently planning to implement a new telephone system, based on Voice over IP (VoIP), including a new Contact Center solution. VoIP is a proven
Oracle Business Intelligence Applications Overview. An Oracle White Paper March 2007
 Oracle Business Intelligence Applications Overview An Oracle White Paper March 2007 Note: The following is intended to outline our general product direction. It is intended for information purposes only,
Customer Contact Center Benchmarking Results Executive Summary
 Customer Contact Center Benchmarking Results Executive Summary XYC Company SAP Value Engineering Agenda. Executive Summary. Company Baseline, Metrics and Performance Drivers. Best Practices 4. Participant
GUIDE TO PURCHASING A PHONE SYSTEM FOR YOUR CALL CENTER
 GUIDE TO PURCHASING A PHONE SYSTEM FOR YOUR CALL CENTER A STEP-BY-STEP PRIMER TO HELP YOU SELECT THE RIGHT SOLUTION FOR YOUR SMALL TO MIDSIZE BUSINESS GUIDE TO PURCHASING THE RIGHT PHONE SYSTEM FOR YOUR
Central Florida Expressway Authority
 Central Florida Expressway Authority Back Office Customer Call Center Review May 2015 risks and controls in ways that this report did not and cannot anticipate. Table of Contents Section Page(s) Executive
Improving Customer Contact Quality
 Improving Customer Contact Quality An Extract from Call Quality Practices 2009 Call quality monitoring is one of the most effective methods for improving the level of service you provide to your customers.
How Innovation Can Change the Contact Center Business. Thais Marca Managing Director, South America Convergys
 How Innovation Can Change the Contact Center Business Thais Marca Managing Director, South America Convergys Convergys Corporation A Global Leader in Relationship Management Worldwide Capabilities 75,000
Workforce Management Software Delivers Rapid ROI for Outbound, Inbound and Blended Centers
 Workforce Management Software Delivers Rapid ROI for Outbound, Inbound and Blended Centers What Can Workforce Management Do for Your Contact Center? Streamline Tasks & Boost Performance Increase Service
The US Contact Center Decision-Makers Guide 2014
 The US Contact Center Decision-Makers Guide 2014 EXECUTIVE SUMMARY produced for the membership of ABOUT THE REPORT The "US Contact Center Decision-Makers' Guide (2014-7 th edition)" is the major annual
State Network Consumer Assistance Small Group Consultation Call Center
 State Network Consumer Assistance Small Group Consultation Call Center Support for this presentation was provided through a grant from the Robert Wood Johnson Foundation s State Health Reform Assistance
empowering hr and engaging employees with affordable, easy-to-use self-service technologies
 Making the Case for an Automated HR Help Desk ENGINEERED FOR PRECISION empowering hr and engaging employees with affordable, easy-to-use self-service technologies LBiSoftware.com Overview Can an automated
TOP 10. Strategies for Modernizing Workforce Optimization. ebook
 TOP 10 Strategies for Modernizing Workforce Optimization ebook CONTACT CENTER OPERATIONAL CHALLENGES All over the world, contact center managers and operations teams face a number of challenges that can
CONTACT CENTER SCHEDULE ADHERENCE
 CONTACT CENTER SCHEDULE ADHERENCE SEVEN NOT-SO-BEST PRACTICES AND HOW TO MAKE THEM BETTER CONTENTS Introduction...3 The Real Purpose of Schedule Adeherence...3 Making Adherence Look Good...3 7 Not-So-Best
IP CONTACT CENTERS: INTRO TO IPCC TECHNOLOGIES, CONCEPTS, AND TERMINOLOGY
 IP CONTACT CENTERS: INTRO TO IPCC TECHNOLOGIES, CONCEPTS, AND TERMINOLOGY SESSION 1 Agenda What Is a Contact Center? Contact Center Concepts and Terminology Call Handling Strategy The Future of Contact
Improve customer experience with your call center
 Improve customer experience with your call center 1 Table of Contents Welcome to the Age of the Unloyal Customer Superior Service Is More Difficult Than It Looks Segmented customer touchpoints Who is responsible
Intelligent Contact Management with. Flexible cloud services from VoltDelta. Contact centre Self service Customer insight
 R Intelligent Contact Management with Flexible cloud services from VoltDelta >> >> >> Contact centre Self service Customer insight Contact centre out of the cloud Intelligently manage every contact channel
MiContact Center Outbound
 MiContact Center Outbound Increase revenues and control operating costs with outbound dialing, campaigning and scripting Does your business need to streamline your outbound contact center operations and
Improve Contact Center Performance with Real-Time Metrics
 Improve Contact Center Performance with Real-Time Metrics May 10, 2013 Sponsored by: - 1 - DMG Consulting LLC Table of Contents Introduction... 1 Lack of Real-Time Data and Guidance Impedes Contact Center
Maintaining a Competitive Edge with Interaction Analysis
 Explore Maintaining a Competitive Edge with Interaction Analysis Winner of the Frost & Sullivan 2007 Product Innovation Award Autonomy etalk White Paper Maintaining a Competitive Edge with Interaction
How To Measure Call Centre Customer Satisfaction
 Building Client Satisfaction Through Your What is our about? It s about comparing service quality performance from the voice of the client/employee point of view and key operational measures Clients must
Unified Customer Experience Management
 Unified Customer Experience Management Unified Customer Experience Analytics Operational Excellence Customer Satisfaction & Loyalty Competitive Advantage Today s Customer Touchpoints Self-service (IVR
CRM in the Contact Center and the Emergence of the Unified Agent Desktop
 CRM in the Contact Center and the Emergence of the Unified Agent Desktop An excerpt from Datamonitor s recent report, DMTC2207 SUMMARY Publication Date: September 2008 Contact centers face ever-increasing
How to make effective Outbound Contact Center. Taweewut Waicharoen April 9,09
 How to make effective Outbound Contact Center Taweewut Waicharoen April 9,09 Agenda Overview of Outbound Contact Center Telemarketing and Collection business practices Virtual Agents KPI in Contact Center
The Virtual Contact Center
 The Virtual Contact Center Your Essential Guide to Selecting, Designing and Implementing a Virtual Contact Center to Transform Your Customer Experience 1 INTRODUCTION 2 VIRTUAL CONTACT CENTER NEEDS ASSESSMENT
Transform your Contact Center into a Relationship Platform with PositiveEdge Solutions
 Transform your Contact Center into a Relationship Platform with PositiveEdge Solutions NEXT GENERATION MULTI CHANNEL CONTACT CENTER PLATFORM Being a vital link to the customers they serve, Contact Centers
INCREASE REVENUES AND CONTROL OPERATING COSTS WITH OUTBOUND DIALING, CAMPAIGNING, AND SCRIPTING
 brochure MITEL MiCONTACT CENTER OUTBOUND INCREASE REVENUES AND CONTROL OPERATING COSTS WITH OUTBOUND DIALING, CAMPAIGNING, AND SCRIPTING Does your business need to streamline your outbound contact center
The Patient Contact Center: Finding My Way!
 The Patient Contact Center: Finding My Way! Presented by James Hawkins SVP, Patient Contact Center Convergent 1 For Today s Discussion Market Conditions ANI Survey Results Patient Contact Center Overview
Supporting HR Transformation with PeopleSoft HelpDesk for Human Resources
 Supporting HR Transformation with PeopleSoft HelpDesk for Human Resources Jay Zuckert Principal Product Manager The following is intended to outline our general product direction.
KnoahSoft Harmony TM Suite. Because Not All Agents are Created Equal
 KnoahSoft Harmony TM Suite Because Not All Agents are Created Equal Performance management is not just software; it is a mindset that permeates the entire solution. When performance management tools are
Contact Center Trends and Future
 Contact Center Trends and Future The Dynamic Contact Center Keith Pearce & Tamal Islam Consistent experience Internet integration Limit hold times Customer Experience New channels web, chat, SMS Differentiated
Using a Multichannel Strategy to Deliver an Exceptional Customer Experience
 Using a Multichannel Strategy to Deliver an Exceptional Customer Experience 10 things to consider when building a multichannel strategy to improve the customer experience Jesús Hoyos CRM industry analyst,
IBM ECM Employee Lifecycle Management August 2008. HR best practices: Managing employee information from hire to retire
 August 2008 HR best practices: Managing employee information from hire to retire Page 2 Contents 2 Executive summary 3 The evolution of employee lifecycle management 4 Stage 1: Eliminate paper 6 Stage
www.pwc.com Next presentation starting soon Next Gen Customer Experience Enabled by PwC & Oracle s Cloud CRM & CX Applications
 www.pwc.com Next presentation starting soon Next Gen Customer Experience Enabled by & Oracle s Cloud CRM & CX Applications Agenda Introductions & Customer Experience / CX Defined Why CX is Critical Today?
How Omnichannel is Delivering on the Promise of Multichannel
 How Omnichannel is Delivering on the Promise of Multichannel Sheila McGee-Smith Principal Analyst McGee-Smith Analytics Karina Howell Solutions Marketing Manager Interactive Intelligence, Inc. Contents
How To Understand The Value Of A Contact Center
 Solutions for higher performance! Contact Center Turnaround Time and Quality Contents EXECUTIVE OVERVIEW...01 INTRODUCTION: NEED FOR CONTACT CENTERS...02 CHALLENGES FOR CONTACT CENTERS...04 QUALITY THAT
Call Center At-Home Agent Best Practices
 Essential tools for managing employee performance, service quality and the customer experience Sponsored by Table of Contents Executive Summary...1 Value Proposition...1 Out of Site, Not Out of Mind...2
Call Center Workforce Management Competency Definition Outlines
 Call Center Workforce Management Competency Definition Outlines Workforce Management The purpose of this document is to provide definition around the Call Center Management Competencies for the Workforce
Call Center Workforce Management Competency Definitions
 Call Center Workforce Management s Contact center management professionals pursuing certification will demonstrate an understanding of the principles that form the foundation of these competencies and
A Strategic Approach to Customer Engagement Optimization. A Verint Systems White Paper
 A Strategic Approach to Customer Engagement Optimization A Verint Systems White Paper Table of Contents Introduction... 1 What is customer engagement?... 2 Why is customer engagement critical for business
OpenScape Contact Center Agile & Enterprise
 OpenScape Contact Center Agile & Enterprise Customer Service Made Simple Siemens Enterprise Communications www.siemens-enterprise.com OpenScape Contact Center Agile & Enterprise Designed to improve first
Evaluation Guide. Call Center Operations and SLA Monitoring Performance Blueprint
 Evaluation Guide Call Center Operations and SLA Monitoring Performance Blueprint Achieving real-time efficiencies and enhanced customer satisfaction in call center operations Corporate frontlines are experiencing
[ know me ] A Strategic Approach to Customer Engagement Optimization
![[ know me ] A Strategic Approach to Customer Engagement Optimization](/thumbs/23/1993994.jpg "[ know me ] A Strategic Approach to Customer Engagement Optimization") [ know me ] A Strategic Approach to Customer Engagement Optimization A Verint and KANA White Paper Table of contents Introduction... 1 What is customer engagement?... 2 Why is customer engagement critical
[ know me ] A Strategic Approach to Customer Engagement Optimization A Verint and KANA White Paper Table of contents Introduction... 1 What is customer engagement?... 2 Why is customer engagement critical
Workforce Optimization, Workflow Automation & Workforce Management
 Highly Affordable and Unified Solutions in Workforce Optimization, Workflow Automation & Workforce Management for both Front Office Call Centers & Back Office Functions Delivered as On-Premise Software,
The Evolution of Quality Monitoring. How Technology Can Enhance the Effectiveness of Quality Monitoring Programs
 The Evolution of Quality Monitoring How Technology Can Enhance the Effectiveness of Quality Monitoring Programs Table of Contents Introduction... 1 The Quality Monitoring Process... 2 Process Overview...