Trade Credit in the UK Economy ( ): An Exploratory Analysis of Company Accounts
|
|
|
- Marianna Rich
- 8 years ago
- Views:
Transcription
1 Trade Credit in the UK Economy ( ): An Exploratory Analysis of Company Accounts Report Prepared By Nick Wilson Credit management Research Centre Leeds University Business School May 2014 This report is circulated for comment and discussion. It should not be cited or quoted without permission of the author CMRC

2 Summary of Finding Trade credit is pervasive in the UK economy and for all businesses it represents both an important element in gaining and managing customers and of financing the purchase of supplies. This is the first exploratory study to provide a comprehensive analysis of trade credit activity in the UK corporate sector by analyzing the financial statements of all limited companies in the period The analysis of trade debtors and trade creditors figures gauge trade credit activity as reported on company balance sheets. Around 80% of limited companies extend trade credit to customers and this has increased 5% in the post recession period. Up to 90% of companies receive credit from suppliers and this has increased 8% in the post recession period. For many small companies trade credit is the only source of external finance Aggregate values of trade debtors on company balance sheets was 327bn in 2012 and on average this represents around 58 days of credit. In the post recession period the total value of trade creditors exceeds that of trade debtors (Chart 5). Trade credit exhibits some cyclical behavior in relation to the business cycle and in relation to the supply of bank finance. Firms use more trade credit when bank finance in scarce and larger firms, with more access to finance, are net providers of trade credit. The supply of bank finance (net lending) has continued to fall in the post recession period. Estimates suggest that the total amount of borrowings outstanding from private companies to financial institutions is around 277 billion. Trade credit outstanding is more than 1.2 times the total amount of lending from the financial sector. Trade credit has become a more important source of finance for small firms in the recovery period. Small firms, in order to compete in markets, extend around 80bn of trade credit to their customers. However smaller firms with lower capitalization and limited access to institutional finance have to manage these uncertain cash flows effectively. Trade debt is a risky asset due to the uncertainties regarding the customer s willingness and ability to pay invoices within the agreed credit period (or 30 days). In practice the average collection period on a 30-day invoice is around days, the difference being the overdue period. Typically smaller firms collect their trade debts within 58 days. Using the data generated from accounts we examine a scenario in which all small firms are paid within 30 days. The improvement in cash flow for the small firm sector is estimated to be around 35bn per annum (Scenario 1). A number of financial ratios are analysed for all companies and disaggregated by size of company and industrial sector. The share of trade debtors in total assets ranges from around 20% up to 40%. The ratios are relatively stable over time for each of the sectors reported but vary considerable between sectors and in relation to the size of a company. For smaller companies trade debts represent over 33% of total assets. (Chart 6) We examine the liabilities side of the balance sheet and look at trade creditors (credit taken from suppliers) in relation to other credit. Again there is a consistent pattern across industries but the gap between industry sectors is smaller in that the range varies between 45% up to 75%. As a proportion of total borrowing on the liabilities side of the balance sheet trade credit accounts for over 50% for the vast majority of firms and for small firms is often the only source of external finance (0ver 90%). This is in stark contrast to larger companies (around 20%). (Chart 10) The use of trade credit as a proportion of other liabilities appears to have increased in relative importance across all sectors. Construction and manufacturing sectors extended payment periods during the recession and post recession period. Net periods (extended-received) fall as firms finance growing demand using credit from suppliers. (Chart 20) The companies declared insolvent have an average total of 6.3bn of trade creditors on their balance sheets in the last accounts filed before the insolvency notice. On average firms in financial distress reduce the credit periods offered to customers and extend payment periods to suppliers. Hence the net period (DSO- DPO) reduces. It is likely that trade creditors have more difficulties in recovering outstanding payments than other creditors during the insolvency process. Smaller companies reliant solely on trade credit to fund activities are at risk of overtrading as the economy recovers in the absence of complementary sources of working capital finance. 1. Understanding the Environment: Trade Credit in the Economy

3 The granting of credit by non-financial firms to their customers (trade credit) is a widespread practice in the UK and all other economies and has existed as long as business-to-business trade. The vast bulk of inter-firm sales are made on credit terms in the UK and export markets. Trade credit is a particularly important source of funding for all companies; the stocks and flows of trade credit are typically twice the size of those for bank credit and trade credit flows often exceed the primary money supply. In the UK corporate sector it is estimated that more than 80% of daily business-to-business transactions are on credit terms. This form of financing, trade credit, is thus the most important and largest form of short-term financing for the corporate sector. The flows of credit between firms of varying sizes and perceived credit worthiness; in relation to the supply of institutional and nonbank finance, macro-economic and monetary conditions has been the subject of much research and policy interest. Successive governments and lobbyists have identified potential market failures, e.g. transitory or permanent credit rationing, in the supply of finance to Small and Medium sized firms (SME) despite a perception that a vibrant SME sector is a vital ingredient of a successful, innovative and growing economy. The poor availability and poor quality of credit information on smaller companies has hindered the flow of institutional credit and equity to this opaque sector. Consequently SME are often heavily reliant on short-term finance (overdraft and short-term bank loans) and where possible turn to suppliers as their main source of short term finance (trade credit). This is particularly the case when other sources of finance are scarce. Recent figures published by the British bankers Association showed that the provision of bank finance (outstanding lending to private companies) has continued to fall in the post crisis period. The data for March 2104 showed a net fall of 21 Billion. Estimates suggest that the total amount of borrowings outstanding from private companies is around 277 billion. Chart 1 provides the picture of bank lending to private companies by tracking the 3-month growth rate in net lending to private non-financial companies. The data shows no sign of increase in bank lending in the recovery period Jan Aug Mar Oct May Dec-00 3 Month growth in net lending 01-Jul Feb Sep Apr Nov Jun Jan-05 Chart 1 Growth in Net Lending to private Companies 01-Aug-05 Trade credit is a pervasive feature of the economy but for smaller firms that often both extend and receive trade credit the challenge of managing uncertain cash flows from B2B trade and absorbing the costs of potential delayed payments is acute. The taking of extended trade credit from suppliers (late payment) is a pervasive and perennial problem that often has a disproportionate impact on smaller firms. Of course delays in the payment of an invoice (perceived as late payment by the supplier) may be justified by the buyer through disputes over quality, service, administration etc. Indeed payment delays have a complex array of causes but smaller firms have to accede to the bargaining power of large buyers. Whatever the situation, payment periods on the supply of trade credit can be uncertain and trade debt, that should convert seamlessly to cash is, in practice, a risky asset. From the buyers perspective the nature of trade credit is such that it can often facilitate extended short-term credit, with or without the agreement of the supplier, when working capital or other shortterm finance is tight, if the buyer has transitory cash-flow problems or is in financial distress (insolvency). Having the appropriate tools to manage and speed up cash flow from trade debts, when required, is particularly important from smaller firms that have transitory cash flow 01-Mar Oct May Dec Jul Feb Sep Apr Nov Jun Jan Aug Mar Oct-13

4 problems or simply need cash to respond to market opportunities. The late payment of commercial debt and its subsequent effects on cash flow are problematic for all businesses but can be acute for smaller businesses. For small businesses there are two separate but related issues. Small businesses when trading with large buyers may be required to extend long credit periods to the buyer and finance the trade credit. If payment is certain (payment risk is low) then the business can manage cash flow and finances to accommodate the credit period. However, when payments are overdue and the payment date becomes uncertain then the financing costs, and management time involved in chasing payments and financing the delay can seriously erode the profitability of the sale and put pressure of the businesses own relationships with its bankers and suppliers. Late payment can be regarded as a contributory factor to small business financial distress and failure and one that has hampered growth and innovation in the sector. Entering export markets, smaller firms often face longer payment delays and the associated financing costs. However it is likely that the uncertainty surrounding payments (over-dues) rather the length of the payment period (credit period) is what causes the most problems. Moreover smaller firms are likely to be more sensitive to late payments than larger business since larger businesses have the financial resource to absorb late payments. Smaller firms are likely to have a lower tolerance threshold and categorise payments as late earlier than a larger counterpart. 2. Business-to-Business Trade and Trade Credit: Basics Trade credit definition Trade credit involves supplying goods and services to business customers on a deferred payment basis that is, giving the customer time to pay. Therefore in addition to regular sources of finance such as bank overdraft, loan, leasing, bonds, venture capital and so on, firms can get short-term finance from their suppliers of goods or services. This amount of deferred payment is known as trade credit. The majority of businesses engaged in business to businesses trade are both recipients of trade credit from suppliers and providers of trade credit to customers. The motives an individual business has for using trade credit (demand-side) and supplying trade credit (supply-side) can be quite complex. Formally trade credit involves a firm s ability to obtain merchandise, inventory, and services in exchange for its promise of future payment. It is one of the most important types of short-term credit used and accepted by businesses, by virtue of the number of transactions, the policies associated with accepting it, and the accounting procedures necessary to manage it accurately. Thus, trade credit has interesting characteristics: it represents a substantial component of both corporate liabilities and assets of the balance sheet (figure 1.1). For the buyers balance sheet, it is a source of financing through accounts payable, while for the sellers, trade credit is an investment in accounts receivable. Trade credit is recorded as trade debtors (asset), which is the amount of credit that the firm provides its customers, and trade creditors (liability), which is the amount that the firm has to pay its suppliers. Figure 1 Trade Credit on the Balance Sheet Trade credit terms Trade credit is often given under two main types of credit terms. Net terms involve the setting of a period after which payment should be made in full (e.g. 30 days after receipt of goods and invoice net 30, or 60 days net 60 etc.), while twopart term involve a discount paid for early payment (2% discount if paid in full within 10
 then the business can manage cash flow and finances to accommodate the credit period.")
5 days, no discount if the 30 days period is taken e.g. 2/10 net 30). Thus credit terms refer to the written or stated policies given to a customer with regard to: the timing of payments; discounts for early settlements; the methods of payment; ownership of goods prior to payment (e.g. retention of title to the goods or other types of security); and (if applicable) interest or penalties for late payment. The terms of payment on business-to-business sales can take many forms and a wide variety of possible payment terms can be offered. Cash on or before delivery (COD, CBD) obviously does not involve trade credit. Progress or 'stage payment' terms usually involve an up-front deposit or down payment with the outstanding invoice value being spread in payments over a set period or at specific points in the fulfilment of a supply contract. This type of payment is usually required for the delivery of complex services such as construction projects or bespoke software installation etc. The majority of trade credit sales however, are offered on a net period or a net period with cash discount for early settlement. Net terms involve the setting of a period after which payment should be made in full. This is usually defined either as a number of days after the invoice date or a number of days after the end of the month in which the invoice is issued (e.g. 30 days EOM, meaning thirty days from the next month end). The use of EOM terms obviously has a substantial impact on the actual credit period; if sales are evenly spread through the month 30 days EOM will lead to an average credit period of approximately 45 days. With two-part terms the supplier specifies a net period, as with net terms, but also specifies a shorter period (the discount period) during which payment will attract a discount. Terms of 2/10 Net 30, for example, mean a buyer can obtain a 2% discount by paying in 10 days or less, otherwise payment of the undiscounted price is required in 30 days. Although the percentage discount offered might often seem small, it is equivalent to a high annual rate of interest being charged for the additional extension of credit to net terms. Variations on this concept also exist, for example, the payment of a rebate to customers who pay in full by the discount date. This latter variation protects the seller from the buyer taking unearned discounts opportunistically. Interestingly buyers with some market power over suppliers might take a deduction from the invoice value without the agreement of the supplier. Predominantly, the payment period specified, in the UK, is 30 days (net 30 or 30 EOM) but can vary from less than 7 days (near cash) to over 120 days depending on the nature of the trading relationship and/or the type of product/service being provided. Typically, credit periods offered on export contracts are slightly longer than those for domestic sales, but, again, this varies according to the destination country, the industry sector, characteristics of the buyer and the nature of the product/service involved. A typical two-part term often involves three components: a discount on the price for the buyer if the buyer pays early (discount rate); the number of days that qualify for early payment (discount period); and the maximum number of days for payment (net credit period). The discount rate for early payment implies an implicit interest rate that the buyer pays for the use of credit and is also referred as the price of trade credit. In the above example, the buyer will pay 2% for the use of trade credit in 20 days. This is equivalent to an annual interest rate of 43.9%. Credit terms vary across industries and countries, but tend to stay stable within industries and over time. Moreover in some sectors firms are net providers of credit and other are net users of credit. For instance retailers sell for cash payments but buy in supplies on credit terms. We provide some evidence of this later.

6 Cash on or before delivery Order 0 days Delivery Credit Terms and Periods: Schema Early Payment Discount D % End of Discount Period D days Figure 2 Trade Credit Terms The schema above (Figure 2) shows the range of possible credit terms and periods that can be offered in a trade credit relationship between two businesses. If the supplier utilises discount periods and late payment penalties there is much scope for varying the terms and periods across the customer-base. Moreover the supplier may periodically opt to allow late payments from some customers without penalty or grant discounts outside of the discount period for favoured customers. There is much scope for flexibility and for treating customers differently depending on their importance, short-term financial circumstances, the opportunity for developing repeat businesses or, of course, the relative bargaining position. Chart 2 provides a snap shot of credit terms offered by UK firms Payment terms agreed by companies with their customers (adjusted for variable terms) 7 days from invoice 13.1% 15 days from invoice 1.2% 30 days from invoice 20.7% 60 days from invoice 15.8% 90 days from invoice 8.3% 120 days from invoice 3.1% End of month of invoice 15.3% (max. 30 days) End of month following invoice 5.8% (possible 60 days) End of second month following invoice 2.0% (possible 90 days) 15 th day of next month 2.4% (possible 45 days) 30 th day of next month 1.8% (possible 60 days) Cash with invoice 3.3% Cash with order 1.5% Cash on delivery 5.7% Chart 2 Observed Credit Terms Credit Period for Full Payment Source: Experian, November Trade Debt and Cash-flow End of Credit Period N days Late Payment Penalty P % Late Payment N +X days As discussed earlier late payment and the subsequent effects on cash flow is problematic for small businesses that have limited financial resource. The impact of delayed payment could be devastating for some businesses. The financing costs and management time involved in slow or uncertain payment erodes the profitability of a sale and, when profit margins are tight, can eliminate it altogether. The financing costs of 1000 of trade debtors (receivables) at a number of interest rates are charted below as an illustration. Chart 3 Financing Costs of Receivables Uncertainties regarding the timing of trade payments make cash-flow management and banking relationships even more difficult. Chasing payment puts a strain on the ownermanager, whose attention and time is diverted away from business strategy, as well as on the customer and supplier relations. Where slow payment progresses to protracted default and bad debt the whole viability and survival of the business can be at risk. Indeed surveys by insolvency practitioners indicate that problems with cash flow or working capital management and bad debts are the primary reasons that small businesses fail. Late payments have a knock on effect through the small business sector and late payments between small businesses are common. Thus trade debt is a risky asset due to the often uncertainties regarding the customers willingness and ability to pay invoices within the agreed credit period (or 30 days). In practice the average collection period on a 30-day invoice is

7 around days, the difference being the overdue period. Whatever the cause of the over due period the reality is a serious impact on the suppliers cash flow, along with all the other costs mention. The scenario below illustrates the cash flow impact. Consider a case where a company is trading on 30-day credit term but collecting on average after 73 days (DSO= (trade debt/sales) x 365). Trade Debtors DSO DSO Ideal Trade Debtors Cashflow Year Observed Ideal Estimate Improvement bn Days Days bn bn Annual Sales DSO Outstanding debtors Cash Flow Improvement 2,000, ,000 2,000, ,562 16,438 2,000, ,164 27,397 2,000, ,767 27,397 2,000, ,370 27,397 2,000, ,973 27,397 2,000, ,575 27,397 2,000, ,178 27,397 2,000, ,781 27,397 2,000, ,384 27,397 Total Improvement 235,616 Chart 4 Cash-flow improvements from reducing DSO Steps taken to reduce the average collection period have a significant impact on the suppliers cash flow and working capital. In the (unlikely) case where collection periods reduce to 30 days the total cash flow improvement is substantial. Using data provided later in the report we can do some simple scenarios to estimate the impact of prompt payment on the flow of cash to the small firm sector. In scenario 1 we sum the total trade debts outstanding figures for small and micro firms over the period in column 1. The observed average collection period for the same firm years is provided in column 2. In the unlikely scenario that all small firms were paid within 30 days then we can recalculate the implication for the outstanding trade debtors figure (column 4). The difference between column1 and 4 is the potential cash flow improvement for the smaller firms sector. The figure is between 24bn to 39bn over the sample period. 4. Economic Significance and Importance of Trade Credit Flows This section provides estimates of the importance and significance of trade credit in the UK corporate sector. The analysis is based on financial statements filed by UK private and public companies within the period The analysis is comprehensive since it is based on the whole population of limited companies that actively file annual returns and accounts. The database has been compiled to track company exits (via dissolution and insolvency) during the time period and matches measures of size, industrial sector, location, age and other characteristics to individual firms. The full data-base consists of over 24 million company-year observations (Table 1) but this is reduced when low asset and inactive companies are removed from the data base. Further consolidated accounts and removed from the analysis to avoid double counting and companies deemed to be operating in the financial sector (SIC 2003, 65,66,67) or unknown sectors are not included. Nonetheless the analysis sample has over 15 million company year observations (tables 3 and 4). Insolvent companies are included in the analysis up to the last filed accounts before the insolvency notice (Table 2). Scenario Data Base and Analysis Samples

8 Table 1 Filed Accounts and Annual Returns Table 4 Analysis Sample Insolvencies Table 2 Insolvencies The data used in the analysis of company financial statements is drawn from the filed accounts and insolvent companies listed in Tables 3 and An Analysis of Company Accounts: Trade Credit Activity The balance sheets were analysed for companies that submitted accounts with a year end in each of the calendar years , 2013 is excluded from the analysis since many companies have yet to file. The trade debtors figures (current assets) and trade creditors figures (current liabilities) were searched for positive values and firms with positive values were identified as credit active companies. Table 5 summarises the findings and confirms that around 80% of companies either extend or receive trade credit and usually are providers and recipients. Table 3 Analysis Sample Table 5 Trade Credit Active Companies

9 4.3 Trade Credit on the Balance Sheet: Snapshot Aggregations An analysis of UK company accounts gives an indication of the importance of trade credit on both the asset and liabilities side of the balance sheet. Table 6 provides information on the number of financial statements analysed for each year and provides an aggregation of the total value of trade debtors and trade creditors on all reported balance sheets. The reported values are deflated by the GDP implicit price deflator where 2010=100. Around a million sets of accounts were therefore analysed in order to quantify the significance of trade credit for the population of limited companies. The estimates are reported in table 6 and the aggregates are plotted over the time period in Chart 2. companies in 2012 was in excess of 327 billion. The total value of trade creditors on the liabilities side was over 402 billion. This represents a picture of the stocks of trade credit and debtors when we take into account the frequency of trade the flows of trade credit in the economy take on enormous proportions. There is evidence that the supply and demand of trade credit vary over the business cycle. Notice that trade creditors exceed trade debtors in the periods of recovery and there was a build up of trade debt and trade credit in the immediate pre crisis period. It appears that UK companies are reliant on trade credit to fund growth in the post recession period. Our data appear to confirm the scale of trade credit stock and flows in relation to bank credit. Given the average collection periods (DSO) the amounts outstanding on the balance sheets represent around 55 days of credit outstanding 1.2 times the total amount of credit from financial institutions. Table 6 Trade debtors and trade creditors on balance sheets Trade debtors Trade Creditors Chart 5 Aggregate Values of Trade debtors and Creditors on Balance Sheets bn) constant 2010 prices The total value of trade debtors on the asset side of the balance sheets of some 1.09 million The data on trade credit aggregates is calculated in relation to the size of companies which are classified as micro (total assets values up to 350,000); small (asset values >.35m and < 3.26m); medium (asset values > 32.6m and < 12.9m) and Large (asset values > 12.9m). The data show that smaller firms supply more than 80bn in trade credit and receive more than 130bn) and are thus net recipients of trade credit in This net position is particularly pronounced in the post recession period and confirms that small firms substitute trade credit when bank credit is in short supply and that

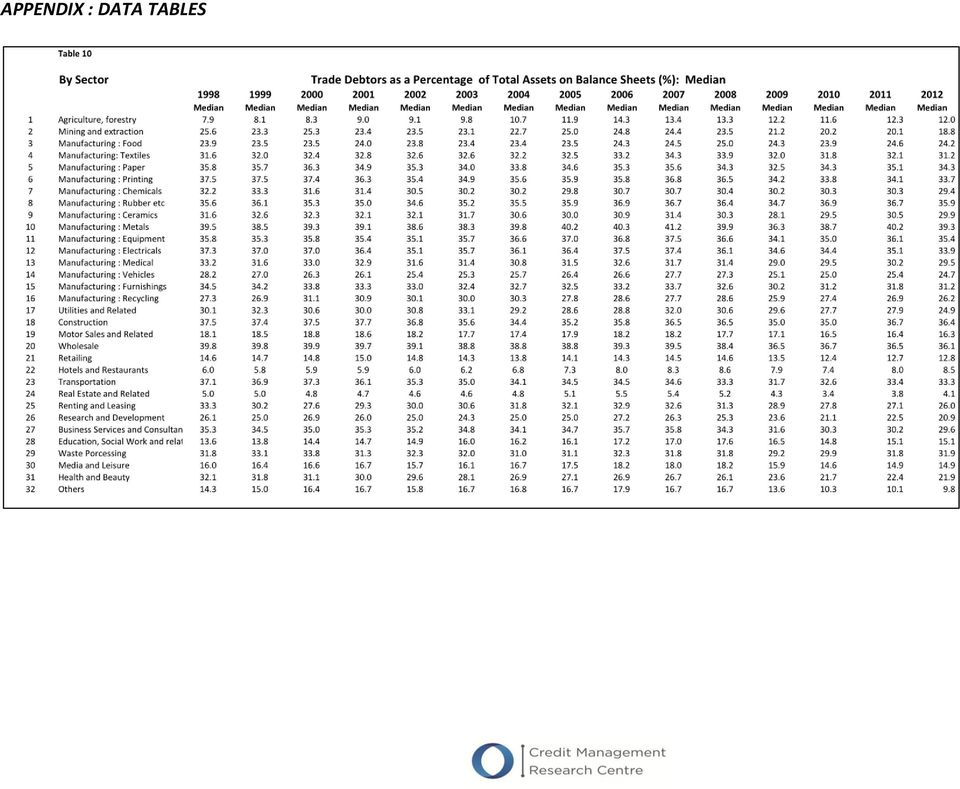
10 larger firms (which access to institutional finance) are net providers of credit to the smaller firms sector. Table 7 Trade Credit on the Balance Sheet: by Size Further dis-aggregations are provided by industry sector. The sample is split into 32 industrial sectors based on 2 digit SIC codes. The results are presented in tables 8 and 9. main source of cash coming into the business and is therefore an important asset on the balance sheet. In this section we gauge how important an asset by looking at trade debt in relation to total assets. Again we are able to disaggregate by size and sector. The first chart plots the ratio of trade debtors (credit to customers) on the balance sheet to total assets (expressed as a percentage). Chart 7 plots the ratio by company size and over time. For smaller companies the ratio is around 30-35% and for the larger around 15%. Table 8 Trade Debtors on the Balance Sheet: by Sector Table 9 Trade Creditors on the Balance Sheet: by Sector Chart 6 Trade debtors to total assets (%) by size The following charts plot the ratio over time and by industrial sector. The share of trade debtors in total assets ranges from around 20% up to 40%. The averages are calculated as both means and medians. The ratios are relatively stable over time for each of the sectors reported but vary considerable between sectors and in relation to the size of a company. The full tables 9 and 10 are reported in the appendix. 4.4 Trade Debtors as a Percentage of Total Assets We present a number of calculated ratios for the sample related to trade credit. Trade debt on the balance sheet (funds owed by customers) is the Chart 7 Trade Debt as % Total Assets (manufacturing)

11 Chart 8 Trade Debt as % Total Assets (other sectors) a very significant form of finance in relation to other forms of finance available. Of course we observe a similar but consistently higher pattern for the ratio of trade creditors to current liabilities. The chart 10 plots trade creditors as reported on the balance sheet as a percentage of total liabilities by size. For smaller companies trade creditors has become an increasingly important source of short-term finance. For many small companies suppliers (trade creditors) are the only source of finance. The chart shows that on average trade creditors account for over 80% of all creditors in contrast to larger firms that have access to a wider range of financing options. Smaller companies need complementary sources of finance to support working capital requirements in growth periods otherwise they can get into the overtrading trap, run out of cash and risk insolvency and sales expand. Chart 9 Trade Debt as % Total Assets (other sectors) Of course for smaller companies the proportion of trade debt as an asset is higher than that for larger firms. On average trade debt makes up around 33% of total assets in small firm balance sheets and around 15-20% for medium to large firms. All sectors show a build up of trade debt prior to the financial crisis and recession and a decline as the economy moves into recession 4.5 Trade Creditors as a Percentage of Total Liabilities We examine the liabilities side of the balance sheet and look at trade creditors (credit taken from suppliers) in relation to other credit. Again there is a consistent pattern across industries but the gap between industry sectors is smaller in that the range varies between 45% up to 75%. As a proportion of total borrowing on the liabilities side of the balance sheet trade credit accounts for over 50% for the vast majority of firms and for small firms is often the only source of external finance (0ver 90%). This is in stark contrast to larger companies (around 20%). Thus on the liabilities side of the balance sheet trade credit is Chart 10 Trade creditors as % total liabilities by size Charts provide the ration by industry sector. Chart 11 Trade Creditors as % Total Liabilities (manufacturing)
 are the only source of finance.")
12 Chart 12 Trade Creditors as % Total Liabilities (other sectors) Chart 14 Days Sales Outstanding (DSO) by sector (manufacturing) Chart 13 Trade Creditors as % Total Liabilities (other sectors) 4.6 Average Collection Periods: Days Sales Outstanding (DSO) Debtor days (DSO) express trade debtors in relation to sales and indicate the average length of credit period and payment period extended to customers. In the generated statistics this figure is calculated as ((trade debts/sales)*360). The figures gives a picture as to how long cash is tied up in trade debt. Larger values could occur because some industries have longer credit periods specified in their credit terms (e.g. 60 rather than 30 days) but the DSO figure will also rise if the businesses is experiencing payment delays from customers. Of course it is difficult to separate out the credit period from the overdue period. However credit terms tend to be common to particular sectors. Chart 15 Days Sales Outstanding (DSO) by sector (other sectors) Chart 16 Days Sales Outstanding (DSO) by sector (other sectors) The differences in average collection periods between size bands are not so pronounced (53 for small firms and 50 for larger firms). This suggests that in order to compete in an industry a small firm has to extend competitive credit terms to its customers and thus pressurizing cash flow
 but the DSO figure will also rise if the businesses is experiencing payment delays from customers.")
13 4.7 Average Payment Periods: Days Payables Outstanding (DPO) Creditor days (DPO) measures the credit taken from suppliers in relation to the cost of supplies and the same logic applies. The DPO ((trade creditors/sales 1 )*360). figure is higher if the company can negotiate long credit periods from suppliers, requests extended periods and/or delays payment to suppliers. If DSO is higher than DPO then the sector is extending more credit than it is taking and vice versa for DPO. Again we observe industry variations in payment times and some cyclical behaviour in relation to the recessionary period. Smaller firms generally take longer periods from suppliers (up to around 10 days) that do larger companies again confirming the reliance on trade credit as a flexible form of finance by this sector. We note that average payment periods increased by around 5 days in the recessionary period and by almost 20 days in the construction sector. Chart 17 Days Payables Outstanding (DPO) by sector (manufacturing) Chart 19 Days payables Outstanding (DPO) by sector (other sectors)) 4.8 Net Credit Periods: (DSO-DPO) The construction of a variable capturing net trade credit, the difference between credit extended to customers (DSO) and that taken from suppliers (DPO) demonstrates further variation between industry sectors and company size in the use and supply of credit. Chart 18 plots net positions by size and demonstrates that smaller firms are net users of trade credit in downturns and as the economy recovers. Medium and large firms are net providers of trade credit and increasingly so as the economy moves out of recession and bank finance for the supply chain is scarce. Some sectors are net providers of credit (DSO greater than DPO) and some are net takers of credit (DPO greater than DSO) but this is more variable within and between sectors and in relation to economic conditions. It is likely therefore that payment behaviour is quite variable across sectors and the cycle. Chart 18 Days Payables Outstanding (DPO) by sector (other sectors) Chart 20 Net Trade Credit Positions (DSO-DPO) by size 1 Ideally we would use cost of purchases or cost of sales on the denominator but because of data availability we use sales

14 preceding the insolvency event in order to examine the total value of trade debts (trade creditors) of all insolvent companies that are on the balance sheets. Chart 21 shows the trend in insolvencies in the recession period and indicates a second upturn in Insolvencies Chart 21 Net Trade Credit Positions (DSO-DPO) by sector (manufacturing) Chart 24 Insolvencies in each year Chart 22 Net Trade Credit Positions (DSO-DPO) by sector (other sectors) Chart 23 Net Trade Credit Positions (DSO-DPO) by sector (other sectors) 5. Analysis of Insolvent Companies The accounts of companies that become insolvent during the sample period are analysed. The definition of insolvency includes liquidations, receiverships, administrations and creditors voluntary arrangements and the data cover England, Wales, Scotland and Northern Ireland. Company accounts are tracked in the years Scenario 2 presents some aggregate data on the trade credit outstanding (payables) and the collection, payment periods and the net period of insolvent firms prior to insolvency. The data covers the recession period Generally trade creditors on the balance sheet increase in the immediate years preceding insolvency. Clearly companies that face the legal insolvency process have delayed payments to creditors, both trade and other. The majority of these companies enter voluntary arrangements or administration so it is likely that creditors recover some funds or indeed the company may recover. The companies declared insolvent have an average total of 6.3bn of trade creditors on their balance sheets in the last accounts filed before the insolvency notice. On average firms in financial distress reduce the credit periods offered to customers and extend payment periods to suppliers. Hence the net period (DSO- DPO) reduces. It is likely that trade creditors have more difficulties in recovering outstanding payments than other creditors during the insolvency process.
 by sector (other sectors) Chart 23 Net Trade Credit Positions (DSO-DPO) by sector (other sectors) 5.")
15 Scenario 2 Years preceding Insolvency Insolvency Accounts Filed Year Prior to Insolvency DSO DPO Net Period Trade Creditors bn

16 APPENDIX : DATA TABLES
17

18

19

20

21
22
23
24
25
26
27
28
29
The Business Credit Index
 The Business Credit Index April 8 Published by the Credit Management Research Centre, Leeds University Business School April 8 1 April 8 THE BUSINESS CREDIT INDEX During the last ten years the Credit Management
Incisive Business Guide to Factoring
 Incisive Guide to Factoring Factoring Guide Summary This guide from Incisive outlines the features and benefits for your business from using factoring and invoice discounting services. Factoring is commonly
Small Business Lending *
 Reserve Small Business Bank of Lending Australia Bulletin Small Business Lending * These notes were prepared in response to a request from the House of Representatives Standing Committee on Financial Institutions
tutor2u Cash Management How and Why Businesses Need to Manage their Cash AS & A2 Business Studies PowerPoint Presentations 2005
 Cash Management How and Why Businesses Need to Manage their Cash AS & A2 Business Studies PowerPoint Presentations 2005 Importance of Cash (1) A business can exist for a while without making profits but
The Nature, Elements and Importance of Working Capital
 C. WORKING CAPITAL MANAGEMENT 1. The nature, elements and importance of working capital 2. Management of inventories, accounts receivable, accounts payable and cash 3. Determining working capital needs
Simple Interest. and Simple Discount
 CHAPTER 1 Simple Interest and Simple Discount Learning Objectives Money is invested or borrowed in thousands of transactions every day. When an investment is cashed in or when borrowed money is repaid,
THE WORKING CAPITAL CYCLE IN INTERNATIONAL TRADE
 THE WORKING CAPITAL CYCLE IN INTERNATIONAL TRADE Introduction The working capital cycle is the period of time which elapses between the points at which cash is used in the supply/production process, to
CPD Spotlight Quiz September 2012. Working Capital
 CPD Spotlight Quiz September 2012 Working Capital 1 What is working capital? This is a topic that has been the subject of debate for many years and will, no doubt, continue to be so. One response to the
MANAGING YOUR BUSINESS S CASH FLOW. Managing Your Business s Cash Flow. David Oetken, MBA CPM
 MANAGING YOUR BUSINESS S CASH FLOW Managing Your Business s Cash Flow David Oetken, MBA CPM 1 2 Being a successful entrepreneur takes a unique mix of skills and practices. You need to generate exciting
Taking stock of China s external debt: low indebtedness, but rapid growth is a concern
 1991 1993 1995 1997 1999 21 23 25 27 29 211 213 1991 1992 1993 1994 1995 1996 1997 1998 1999 2 21 22 23 24 25 26 27 28 29 21 211 212 213 ECONOMIC ANALYSIS Taking stock of China s external debt: low indebtedness,
How to Assess Your Financial Planning and Loan Proposals By BizMove Management Training Institute
 How to Assess Your Financial Planning and Loan Proposals By BizMove Management Training Institute Other free books by BizMove that may interest you: Free starting a business books Free management skills
Understanding Invoice Finance
 Understanding Invoice Finance Agenda Introduction ABFA Jargon Busting What is Invoice Finance Factoring Invoice Discounting Invoice Finance Products Who uses Invoice Finance? Main terms Advantages & Disadvantages
Cashflow Management. What is cashflow
 Cashflow Management This Fact File Information Sheet looks at the key elements of cashflow, and how effective cashflow management will help protect the financial security of a business. It outlines the
CIMA F3 Course Notes. Chapter 3. Short term finance
 CIMA F3 Course Notes c Chapter 3 Short term finance Personal use only - not licensed for use on courses 31 1. Conservative, Aggressive and Matching strategies There are three over-riding approaches to
Helping businesses source finance
 SUPPORTING BUSINESS - SOURCING FINANCE Helping businesses source finance Helping businesses source finance These are challenging times for every business. The economic environment has changed and many
How To Understand Factoring
 LESSON 13: FACTORING THEORETICAL FRAMEWORK Lesson Objectives To understand the Concept of Factoring. Methodology of Factoring and Forfeiting. Types of factoring. Introduction Receivables constitute a significant
Trading during difficult times for SMEs. November, 2009
 November, 2009 Introduction In an effort to support small and medium sized enterprises (SMEs), which constitute the main fabric of the upstream oil and gas supply chain, the Supply Chain Forum of Oil
Investment insight. Fixed income the what, when, where, why and how TABLE 1: DIFFERENT TYPES OF FIXED INCOME SECURITIES. What is fixed income?
 Fixed income investments make up a large proportion of the investment universe and can form a significant part of a diversified portfolio but investors are often much less familiar with how fixed income
Short-term investments (also known as marketable securities) are easily convertible to cash that a company plans to hold for a year or less.
 are easily convertible to cash that a company plans to hold for a year or less.") Accounting Fundamentals Lesson 5 5.0 Receivables & Investments Short-term investments (also known as marketable securities) are easily convertible to cash that a company plans to hold for a year or less.
Accounting Fundamentals Lesson 5 5.0 Receivables & Investments Short-term investments (also known as marketable securities) are easily convertible to cash that a company plans to hold for a year or less.
Lending to small business
 Lending to small business Supplementary submission to the Senate Economics Committee Inquiry into Access of Small Business to Finance David Richardson Senior Research Fellow The Australia Institute david@tai.org.au
A guide to business cash flow management
 A guide to business cash flow management Contents 01. Cash flow management 01 02. Practical steps to managing cash flow 04 03. Improving everyday cash flow 06 04. How to manage cash flow surpluses and
The Financial Position of Australian Unlisted Businesses
 The Financial Position of Australian Unlisted Businesses Tom Bilston and Melissa Watson* Using a variety of information sources, the financial position of unlisted firms in recent years is examined and
9. Short-Term Liquidity Analysis. Operating Cash Conversion Cycle
 9. Short-Term Liquidity Analysis. Operating Cash Conversion Cycle 9.1 Current Assets and 9.1.1 Cash A firm should maintain as little cash as possible, because cash is a nonproductive asset. It earns no
Invoice Factoring, Debtors Discounting and Trade Finance are bridging facilities using your debtors, stock or movable assets to raise cash.
 Dear Sir / Madam, Re Bridging Facilities Invoice Factoring, Debtors Discounting and Trade Finance are bridging facilities using your debtors, stock or movable assets to raise cash. A key element is that
Fundamentals Level Skills Module, Paper F9
 Answers Fundamentals Level Skills Module, Paper F9 Financial Management June 2008 Answers 1 (a) Calculation of weighted average cost of capital (WACC) Cost of equity Cost of equity using capital asset
Working Capital Management
 Working Capital Management Gitman and Hennessey, Chapter 14 Spring 2004 14.1 Net Working Capital Fundamentals In 2002, current assets accounted for 31.7% of non-financial Canadian corporations total assets.
Working Capital Management
 Working Capital Management Gitman and Hennessey, Chapter 14 Spring 2004 14.1 Net Working Capital Fundamentals In 2002, current assets accounted for 31.7% of non-financial Canadian corporations total assets.
Cost of Credit. How much is customer credit REALLY costing your business? Tips & advice for effective credit management
 Cost of Credit How much is customer credit REALLY costing your business? Tips & advice for effective credit management Group UK The best advice any business can follow to ensure they do not experience
Planning your cash flow
 5 Planning your cash flow PROFITS ARE NOT CASH 80 OPERATING CYCLE 81 CASH FLOW BUDGETING 82 TRADE DEBTORS 87 TRADING STOCK 89 OVERCOMING CASH FLOW PROBLEMS 91 MINIMUM CASH RESERVE 92 If the cash flowing
late payment The Late Payment of Commercial Debts (Interest) Act 1998: A User s Guide
 Act 1998: A User s Guide") late payment The Late Payment of Commercial Debts (Interest) Act 1998: A User s Guide Index Introduction The importance of prompt payment Legal Warning Section 1: Understanding the legislation What is
late payment The Late Payment of Commercial Debts (Interest) Act 1998: A User s Guide Index Introduction The importance of prompt payment Legal Warning Section 1: Understanding the legislation What is
Financial Management
 Different forms business organization Financial Management Sole proprietorship Partnership Cooperative society Company Private limited Vs Public limited company Private co min- two and max fifty, Pub Ltd
HOW TO IMPROVE THE WORKING CAPITAL OF A COMPANY
 Volume 3, Issue 5 (May, 2014) Online ISSN-2277-1166 Published by: Abhinav Publication Abhinav National Monthly Refereed Journal of Research in HOW TO IMPROVE THE WORKING CAPITAL OF A COMPANY Hemanshu Kapadia
INVOICE FINANCE. Cash flow solutions that support business growth
 INVOICE FINANCE Cash flow solutions that support business growth 1 Contents Invoice Finance 3 Invoice Discounting 5 Factoring 6 How Factoring works 7 Payroll Finance 8 How Payroll Finance works 9 Additional
Access to Finance Guide: 1. Bank Finance Options
 Access to Finance Guide: 1. Bank Finance Options Overdrafts An overdraft is a flexible way for you to manage short-term borrowing requirements. Business overdrafts are traditionally easy to arrange and
Trends in Lending. January 2010
 Trends in Lending January 1 BANK OF ENGLAND Trends in Lending January 1 This publication presents the Bank of England s assessment of the latest trends in lending to the UK economy. It draws mainly on
Finance and Economics Discussion Series Divisions of Research & Statistics and Monetary Affairs Federal Reserve Board, Washington, D.C.
 Finance and Economics Discussion Series Divisions of Research & Statistics and Monetary Affairs Federal Reserve Board, Washington, D.C. Business to Business Credit to Small Firms Traci Mach 2014-55 NOTE:
WORKING CAPITAL MANAGEMENT
 CHAPTER 9 WORKING CAPITAL MANAGEMENT Working capital is the long term fund required to run the day to day operations of the business. The company starts with cash. It buys raw materials, employs staff
The Equity Gap and Knowledge-based Firms: Executive Summary
 The Equity Gap and Knowledge-based Firms: Executive Summary Nick Wilson Credit Management Research Centre Leeds University Business School Tel: +44 (0) 113 343 4472 Email: nw@lubs.leeds.ac.uk Mike Wright
Small Businesses: Access to Finance. Report. Year to March 2013
 Small Businesses: Access to Finance Report Year to March 2013 Australian Bankers Association Inc. ARBN 117 262 978 (Incorporated in New South Wales). Liability of members is limited.. 2 Contents Executive
½ a mark for rounding up (6 marks) (b) There are a number of costs to the business associated with holding inventory:
 (b) There are a number of costs to the business associated with holding inventory:") EDI LCCI IQ ON DEMAND AWARD IN BUSINESS FINANCE AND BANKING OPERATIONS SAMPLE LEVEL 4 MARKING SCHEME DISTINCTION MARK 75% CREDIT MARK 60% PASS MARK 50% TOTAL 100 MARKS QUESTION 1 (a) Inventory days Receivable
EDI LCCI IQ ON DEMAND AWARD IN BUSINESS FINANCE AND BANKING OPERATIONS SAMPLE LEVEL 4 MARKING SCHEME DISTINCTION MARK 75% CREDIT MARK 60% PASS MARK 50% TOTAL 100 MARKS QUESTION 1 (a) Inventory days Receivable
List of figures Notes on contributors Foreword Introduction PART I: THE CREDIT MANAGEMENT FUNCTION 1
 Contents List of figures Notes on contributors Foreword Introduction xi xiii xv xvii PART I: THE CREDIT MANAGEMENT FUNCTION 1 1 Credit past and future 3 Origins; The role of credit and its importance in
WORKING CAPITAL MANAGEMENT
 WORKING CAPITAL MANAGEMENT What is Working Capital Working capital management is the set of activities that are required to run day to day operations of the business to ensure that cash is adequate to
Chapter. Working capital
 Chapter 10 Working capital 1 10.1 Working capital Working capital is the capital available for conducting the day-to-day operations of the business and consists of current assets and current liabilities.
NAVIGATOR A business overview and financial guide for stakeholders in the SME market
 NAVIGATOR A business overview and financial guide for stakeholders in the SME market XYZ Limited ( the Company ) Report for ABC Bank plc ( the Bank ) XX July 2012 ABC Limited ( the Company ) Report for
18 ECB STYLISED FACTS OF MONEY AND CREDIT OVER THE BUSINESS CYCLE
 Box 1 STYLISED FACTS OF MONEY AND CREDIT OVER THE BUSINESS CYCLE Over the past three decades, the growth rates of MFI loans to the private sector and the narrow monetary aggregate M1 have displayed relatively
3. Classification of Financial Instruments
 3. Classification of Financial Instruments C lassification of financial instruments and identification of their nature is one of the most important phases for compilation and presentation of monetary statistics.
Construction Economics & Finance. Module 6. Lecture-1
 Construction Economics & Finance Module 6 Lecture-1 Financial management: Financial management involves planning, allocation and control of financial resources of a company. Financial management is essential
First column=preferred terms. Bold and italics signifies other defined terms. Bold signifies alternate terms used.
 First column=preferred terms. Bold and italics signifies other defined terms. Bold signifies alternate terms used. 1= Governance; 2=Facilities and Products; 3 Charges; 4 Legal terms and security arrangements;
Bank of Ghana Monetary Policy Report. Financial Stability Report
 BANK OF GHANA E S T. 1 9 5 7 Bank of Ghana Monetary Policy Report Financial Stability Report Volume 5: No.1/2013 February 2013 5.0 Introduction Conditions in global financial markets have improved significantly
Accounting and Reporting Policy FRS 102. Staff Education Note 16 Financing transactions
 Accounting and Reporting Policy FRS 102 Staff Education Note 16 Financing transactions Disclaimer This Education Note has been prepared by FRC staff for the convenience of users of FRS 102 The Financial
1 (a) Net present value of investment in new machinery Year 1 2 3 4 5 $000 $000 $000 $000 $000 Sales income 6,084 6,327 6,580 6,844
 Net present value of investment in new machinery Year 1 2 3 4 5 $000 $000 $000 $000 $000 Sales income 6,084 6,327 6,580 6,844") Answers Fundamentals Level Skills Module, Paper F9 Financial Management June 2013 Answers 1 (a) Net present value of investment in new machinery Year 1 2 3 4 5 $000 $000 $000 $000 $000 Sales income 6,084
Answers Fundamentals Level Skills Module, Paper F9 Financial Management June 2013 Answers 1 (a) Net present value of investment in new machinery Year 1 2 3 4 5 $000 $000 $000 $000 $000 Sales income 6,084
Contribution 787 1,368 1,813 983. Taxable cash flow 682 1,253 1,688 858 Tax liabilities (205) (376) (506) (257)
 (376) (506) (257)") Answers Fundamentals Level Skills Module, Paper F9 Financial Management June 2012 Answers 1 (a) Calculation of net present value (NPV) As nominal after-tax cash flows are to be discounted, the nominal
Answers Fundamentals Level Skills Module, Paper F9 Financial Management June 2012 Answers 1 (a) Calculation of net present value (NPV) As nominal after-tax cash flows are to be discounted, the nominal
ICAP GROUP S.A. FINANCIAL RATIOS EXPLANATION
 ICAP GROUP S.A. FINANCIAL RATIOS EXPLANATION OCTOBER 2006 Table of Contents 1. INTRODUCTION... 3 2. FINANCIAL RATIOS FOR COMPANIES (INDUSTRY - COMMERCE - SERVICES) 4 2.1 Profitability Ratios...4 2.2 Viability
Notes. CIMA Paper P1. Performance Operations
 Chapter 5 extract from our ExPress notes for use with the current video. A full set of P1 ExPress notes can be downloaded free of charge at www.. CIMA Paper P1 Performance Operations For exams in 2011
Corporate Credit Analysis. Arnold Ziegel Mountain Mentors Associates
 Corporate Credit Analysis Arnold Ziegel Mountain Mentors Associates I. Introduction The Goals and Nature of Credit Analysis II. Capital Structure and the Suppliers of Capital January, 2008 2008 Arnold
CHAPTER 8. Accounting for Receivables 5, 6, 7, 8, 9, 10, 11, 12, 13 5, 6, 7, 8, 9 14, 15, 16, 17 18, 19, 20, 21, 22 10, 11, 12, 13 13, 14, 15
 CHAPTER 8 Accounting for Receivables ASSIGNMENT CLASSIFICATION TABLE Study Objectives Questions Brief Exercises Exercises Problems Set A Problems Set B 1. Record accounts receivable transactions. 1, 2,
SME Banking Behavioural Undertakings
 SME Banking Behavioural Undertakings 1 Title of report: The supply of banking services by clearing banks to small and medium-sized enterprises (MMC Cmnd 5319) 2 Published: 14 March 2002 3 Orders: N/A 4
Ratios and interpretation
 Unit Ratios and interpretation As we learnt in our earlier studies, accounting information is used to answer two key questions about a business: Is it making a profit? Are its assets sufficient to meet
Chapter 17. Preview. Introduction. Fixed Exchange Rates and Foreign Exchange Intervention
 Chapter 17 Fixed Exchange Rates and Foreign Exchange Intervention Slides prepared by Thomas Bishop Copyright 2009 Pearson Addison-Wesley. All rights reserved. Preview Balance sheets of central banks Intervention
UK Property Transaction Statistics
 Coverage: United Kingdom Released: 21 October 2015 Next release: 24 November 2015 UK Property Transaction Statistics Frequency of release: Monthly Media contact: HMRC Press Office 03000 585 024 Statistical
The table below shows Capita Asset Services forecast of the expected movement in medium term interest rates:
 Annex A Forecast of interest rates as at September 2015 The table below shows Capita Asset Services forecast of the expected movement in medium term interest rates: NOW Sep-15 Dec-15 Mar-16 Jun-16 Sep-16
performance of a company?
 How to deal with questions on assessing the performance of a company? (Relevant to ATE Paper 7 Advanced Accounting) Dr. M H Ho This article provides guidance for candidates in dealing with examination
Xynergy Commercial Capital LLC
 Xynergy Commercial Capital LLC How Can Work For You The Problem Short of cash and must pay suppliers, lease, bills and salaries? No need for stress, get your payments in advance for your invoices and pay
RELEVANT TO ACCA QUALIFICATION PAPER F9. Studying Paper F9? Performance objectives 15 and 16 are relevant to this exam
 RELEVANT TO ACCA QUALIFICATION PAPER F9 Studying Paper F9? Performance objectives 15 and 16 are relevant to this exam Business finance Section E of the Paper F9, Financial Management syllabus deals with
Make Your Working Capital Work
 Make Your Working Capital Work Unlocking the value through improving processes Working capital is the amount of daily operating liquidity available with a firm i.e. for day to day operations of the firm.
Managing Cash Flow. A guide to help you broaden your understanding of how to manage cash flow in a small business
 Managing Cash Flow A guide to help you broaden your understanding of how to manage cash flow in a small business This guide looks at the key elements of cash flow and working capital and how its management
Lecture 18 SOURCES OF FINANCE AND GOVERNMENT POLICIES
 Lecture 18 SOURCES OF FINANCE AND GOVERNMENT POLICIES Learning Objectives Sources of finance for small and medium-sized businesses. Types of financial assistance Finance is needed throughout a company
INSOLVENCY IN THE UK CONSTRUCTION SECTOR
 INSOLVENCY IN THE UK CONSTRUCTION SECTOR John G Lowe 1 and Elias Moroke Department of Construction Management and Economics, Glasgow Caledonian University, Cowcaddens Road, Glasgow, G3 6BU, UK. The construction
Association of Accounting Technicians response to Small Business Commissioner role
 Association of Accounting Technicians response to Small Business Commissioner role 1 Association of Accounting Technicians response to Small Business Commissioner role 1. Introduction 1.1. The Association
Fundamentals Level Skills Module, Paper F9
 Answers Fundamentals Level Skills Module, Paper F9 Financial Management December 2008 Answers 1 (a) Rights issue price = 2 5 x 0 8 = $2 00 per share Theoretical ex rights price = ((2 50 x 4) + (1 x 2 00)/5=$2
Citigroup Global Transaction Services
 Citigroup Global Transaction Services Cash Management Trade Services and Finance Securities and Fund Services Uncovering the Hidden Value in Accounts Receivables Olivia Xu Director, NA Trade Sales Kate
Financial ratio analysis
 Financial ratio analysis A reading prepared by Pamela Peterson Drake O U T L I N E 1. Introduction 2. Liquidity ratios 3. Profitability ratios and activity ratios 4. Financial leverage ratios 5. Shareholder
Alternative Finance for SMEs and Mid-Market Companies Brussels Presentation
 Alternative Finance for SMEs and Mid-Market Companies Brussels Presentation 27th November, 2013 Agenda Introduction Backdrop: bank lending to companies in Germany, France, UK, Italy and Spain Policymakers
THE EURO AREA BANK LENDING SURVEY 3RD QUARTER OF 2014
 THE EURO AREA BANK LENDING SURVEY 3RD QUARTER OF 214 OCTOBER 214 European Central Bank, 214 Address Kaiserstrasse 29, 6311 Frankfurt am Main, Germany Postal address Postfach 16 3 19, 666 Frankfurt am Main,
Calculating financial position and cash flow indicators
 Calculating financial position and cash flow indicators Introduction When a business is deciding whether to grant credit to a potential customer, or whether to continue to grant credit terms to an existing
tutor2u Working Capital Introduction to the Management of Working Capital AS & A2 Business Studies PowerPoint Presentations 2005
 Working Capital Introduction to the Management of Working Capital AS & A2 Business Studies PowerPoint Presentations 2005 Introduction All businesses need cash to survive Cash is needed to: Invest in fixed
Public Sector Debt - Instructions
 Public Sector Debt - Instructions Under the auspices of the Task Force on Finance Statistics 1 the World Bank has developed a new database to disseminate quarterly data on government, and more broadly,
REAL ESTATE INSTITUTE OF AUSTRALIA SMALL BUSINESS CREDIT RESOLUTION SERVICE DISCUSSION PAPER
 Real Estate Institute of Australia 16 Thesiger Court I PO Box 234, Deakin ACT 2600 Phone (02) 6282 4277 I Fax (02) 6285 2444 REAL ESTATE INSTITUTE OF AUSTRALIA SMALL BUSINESS CREDIT RESOLUTION SERVICE
Cash Flow Statements
 Compiled Accounting Standard AASB 107 Cash Flow Statements This compiled Standard applies to annual reporting periods beginning on or after 1 July 2007. Early application is permitted. It incorporates
Many members will be in some way involved with the control of Working Capital and its influence upon business success.
 Working Capital Control, Philip E Dunn Many members will be in some way involved with the control of Working Capital and its influence upon business success. Working capital is a key element in business
CFS. Syllabus. Certified Finance Specialist. International benchmark in Finance profession
 CFS Certified Finance Specialist Syllabus International benchmark in Finance profession Certified Finance Specialist Summary: This award will provide candidates the opportunity to gain advanced level knowledge
BEGINNERS GUIDE TO YOUR GUIDE TO CREDIT INSURANCE
 BEGINNERS GUIDE TO YOUR GUIDE TO CREDIT INSURANCE CONTENTS Chapter 1 The Basics 2 What is Credit Insurance? Why is Credit Insurance so Important? Who is Credit Insurance Suitable For? Chapter 2 Benefits
Financial Advice Guide for your Business
 Financial Advice Guide for your Business Contents Section 1: Section 2: Section 3: Section 4: Section 5: Section 6: Talk to your bank Reviewing your business for the future Managing your business today
The big picture on cash flow
 The big picture on cash flow What you need to know and where to find it 2 The big picture and what it means for your business 3 Keeping cash flowing 4 Case study when cash flow turns to a trickle 6 Speeding
(a) Accounts Receivable... 23,000 Sales Revenue... 23,000. (b) Sales Returns and Allowances... 2,400 Accounts Receivable... 2,400
 Accounts Receivable... 23,000 Sales Revenue... 23,000. (b) Sales Returns and Allowances... 2,400 Accounts Receivable... 2,400") BRIEF EXERCISE 8-1 (a) Other receivables. (b) Notes receivable. (c) Accounts receivable. BRIEF EXERCISE 8-2 (a) Accounts Receivable... 23,000 Sales Revenue... 23,000 (b) Sales Returns and Allowances...
BRIEF EXERCISE 8-1 (a) Other receivables. (b) Notes receivable. (c) Accounts receivable. BRIEF EXERCISE 8-2 (a) Accounts Receivable... 23,000 Sales Revenue... 23,000 (b) Sales Returns and Allowances...
Working capital: Keep the ball rolling
 Working capital: Keep the ball rolling Author : Michael Byrne Date : March 9, 2011 Working capital is considered the life line of any company, allowing the company to grow, expand operations, and weather
5. Principles of Compilation of Monetary Statistics for Armenia
 5. Principles of Compilation of Monetary Statistics for Armenia T he framework for the monetary statistics involves analytical presentation of balance sheets of financial sector s depository and nondepository
United Kingdom. From: OECD Banking Statistics: Methodological Country Notes 2010
 From: OECD Banking Statistics: Methodological Country Notes 2010 Access the complete publication at: http://dx.doi.org/10.1787/9789264089907-en United Kingdom Please cite this chapter as: OECD (2011),
Sri Lanka Accounting Standard-LKAS 7. Statement of Cash Flows
 Sri Lanka Accounting Standard-LKAS 7 Statement of Cash Flows CONTENTS SRI LANKA ACCOUNTING STANDARD-LKAS 7 STATEMENT OF CASH FLOWS paragraphs OBJECTIVE SCOPE 1 3 BENEFITS OF CASH FLOW INFORMATION 4 5 DEFINITIONS
THE EURO AREA BANK LENDING SURVEY 1ST QUARTER OF 2014
 THE EURO AREA BANK LENDING SURVEY 1ST QUARTER OF 214 APRIL 214 European Central Bank, 214 Address Kaiserstrasse 29, 6311 Frankfurt am Main, Germany Postal address Postfach 16 3 19, 666 Frankfurt am Main,
Assessing cashflow. Overheads (creditors) Sale of fixed assets. Cost of goods sold Investment income
 Sale of fixed assets. Cost of goods sold Investment income") Managing cash flow Simply put, cash flow is the money coming into, and going out of, your business. You need to take into account not just the amounts of money coming in and going out, but when movements
Managing cash flow Simply put, cash flow is the money coming into, and going out of, your business. You need to take into account not just the amounts of money coming in and going out, but when movements
SOLUTIONS TO END-OF-CHAPTER PROBLEMS. Chapter 17
 SOLUTIONS TO END-OF-CHAPTER PROBLEMS Chapter 17 3 360 17-1 Nominal cost of trade credit 97 30-15 0.0309 24 0.7423 74.23%. Effective cost of trade credit (1.0309) 24-1.0 1.0772 107.72%. 17-2 Effective cost
The Effects of Changes in Foreign Exchange Rates
 Compiled AASB Standard AASB 121 The Effects of Changes in Foreign Exchange Rates This compiled Standard applies to annual reporting periods beginning on or after 1 July 2010 but before 1 January 2013.
CHAPTER 27. Short-Term Financial Planning. Chapter Synopsis
 CHAPTER 27 Short-Term Financial Planning Chapter Synopsis 27.1 Forecasting Short-Term Financing Needs The first step in short-term financial planning is to forecast the company s future cash flows. This
THE CONCEPTUAL FRAMEWORK OF FACTORING ON SMALL AND MEDIUM ENTERPRISES
 THE CONCEPTUAL FRAMEWORK OF FACTORING ON SMALL AND MEDIUM ENTERPRISES Minaxi Rani Assistant Professor (Extn.), Department of Commerce, Govt. College for women P.G. College, Hisar, Haryana, (India) ABSTRACT
ASSET BASED LENDERS STAYING AHEAD IN AN EVER-CHANGING MARKET FEATURING THE NEW BDO ABL MONITORING DASHBOARD
 i ASSET BASED LENDERS STAYING AHEAD IN AN EVER-CHANGING MARKET FEATURING THE NEW BDO ABL MONITORING DASHBOARD ii CONTENT MEETING THE CHALLENGE 1 THE BDO ABL MONITORING DASHBOARD 2 THE BALANCE SHEET MARKET
CFCM CENTRE FOR FINANCE AND CREDIT MARKETS
 CFCM CENTRE FOR FINANCE AND CREDIT MARKETS Current Issues Briefing Why Firms Will Feel The Effects Of The Credit Crunch Prof. Paul Mizen Director, CFCM. Produced By: Centre for Finance and Credit Markets
INVESTING IN NZ BONDS
 INVESTING IN NZ BONDS August 2008 Summary Historically active NZ bond managers have achieved returns about 0.6% p.a., before tax and fees, above that of the NZ government stock index. While on the surface
Toll Free: 1.888.XPORTSK (9767875) (in North America) Email: inquire@sasktrade.sk.ca www.sasktrade.sk.ca
 (in North America) Email: inquire@sasktrade.sk.ca www.sasktrade.sk.ca") These manuals are created as resource guides for members of Saskatchewan Trade and Export Partnership (STEP). For more information on these manuals please contact Saskatchewan Trade and Export Partnership
These manuals are created as resource guides for members of Saskatchewan Trade and Export Partnership (STEP). For more information on these manuals please contact Saskatchewan Trade and Export Partnership