First, we ll look at some basics all too often the things you cannot change easily!
|
|
|
- Kelly Wiggins
- 8 years ago
- Views:
Transcription
1 Basic Performance Tips Purpose This document is inted to be a living document, updated often, with thoughts, tips and tricks related to getting maximum performance when using Tableau Desktop. The reader should, also, refer to the Performance chapter in the Tableau Desktop Manual. In this document, performance will be defined as getting the fastest time to completion for a given task. Environmental First, we ll look at some basics all too often the things you cannot change easily! The client machine 64 bit OS is faster than a 32 bit OS. More memory is better. Faster disk, backplane, memory etc. is better. Network bandwidth When large results sets are being returned to a client, from a server, more bandwidth is better. The Tableau Server More memory is, usually, better. Faster disks are, usually, better. More/faster CPUs can be better. The browser A recent test, two side by side machines running the same pull from the Tableau server. IE7 returned results in 11 seconds Firefox returned results in 3 seconds None of the above are easily changed within an organization. And, in reality, none of these are, typically, the place where you will get the biggest performance boosts.

2 Database In the real world, you will, typically, get what you pay for. More expensive databases are, more often than not, faster than the cheaper ones. The key is to get the optimal balance between cost and performance. Within your database, there are a few things to verify are properly tuned. Part of the ad hoc nature of Tableau is to allow any dimension, optimized or not, to be used within a visualization or report. It is especially important to look at tuning your database after you have published content to Tableau Server as the views are essentially fixed to which dimensions the database will be grouping the data. Application tuning If running a relational database, a finely tuned database instance and application will yield better performance results. INDEXES Make certain you have indexes on all columns that are part of table JOINs. Make certain you have indexes on any column used, within Tableau, in a FILTER. EXPLICITLY define PRIMARY KEYs, on all tables, if possible. EXPLICITLY define all FOREIGN KEY relationships. This enables Tableau to bypass many of its integrity checks, since it knows the database is doing that verification. Many DMBS environments have management tools that will look at a query, and, recomm indexes that would help. For Large Data consider table partitioning. In most situations, no query result is meaningful unless constrained by time. Consider partitioning at the date/time level if this is your situation. NULLS Programmers and Tableau Desktop do not like NULL data. Define each column in your tables with an explicit NOT NULL., if possible. Calculations If complex calculations are needed, in Tableau, consider creating a DBMS VIEW that does the calculation the database server is usually more powerful than the desktop! Summary Tables Consider the use of pre computer aggregate (summary) tables when large dataset are, typically, summarized when used. Note you can use Tableau Desktop to automatically create summarized tables. See Extracts.

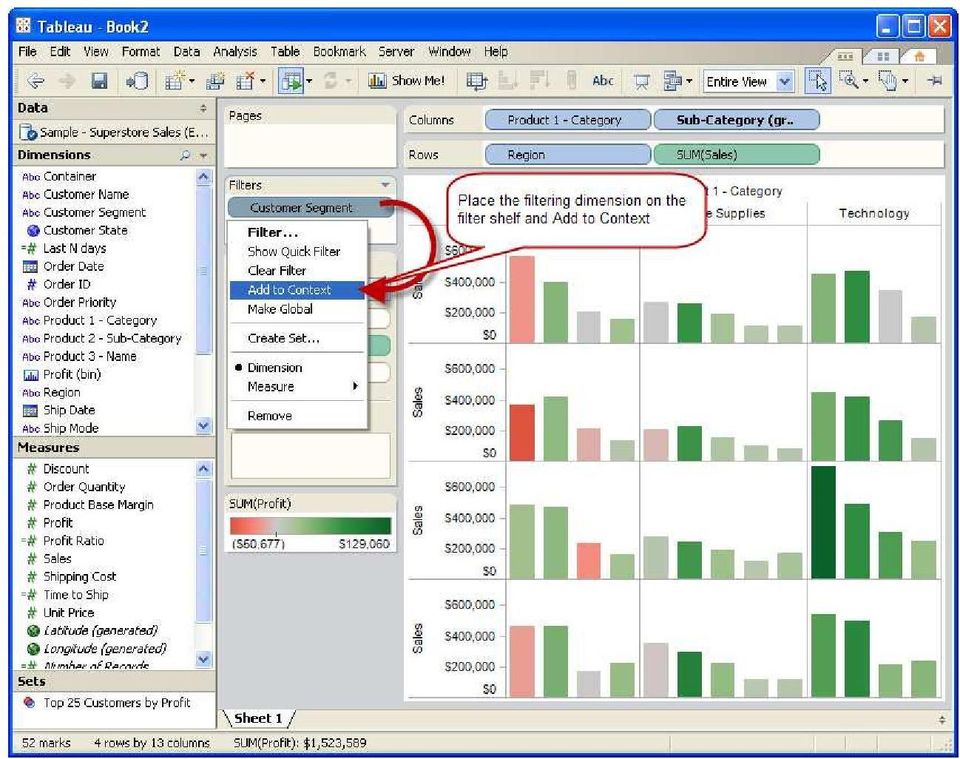
3 Technique Turn off automatic updates On the tool bar you will see a button with a Green Arrow on it. When you hover over it, the tool tip will say Pause Automatic Queries. With very large databases, I recomm clicking it until you ve added a few measures and dimensions to your analysis. Then, click on it again and it will Resume Automatic Queries but now the selection will be more specific. If automatic updates are on, feel free to select the skip button to progress the dialog. Data Sources When creating data sources, use the Multiple Tables options whenever possible and avoid using Custom SQL. Tableau will be able to optimize its queries when using Multiple Tables. A Custom SQL data source works fantastic when needed, but will use sub queries as follows: Select sum([sales]), customer from <insert custom sql here> Group by customer Order by sum[(sales)] desc Where [Region] = West Use as few data sources as needed to achieve your analysis. Remove any unused data sources. When adding a table to a data source with joins, select the tables option from the data. Tableau will skip several validation steps in this case. Add a context filter for relevant data This can be faster than an extract. This is because we still leverage the speed, power and optimization of the database instead of relying on the client machine. Plus, there is no need to re-extract to get current data. The context filter handles that automatically when the workbook is opened. Context filters will work best for you if you are filtering more than 90% of your data as a rule of thumb. Also, Context Filters work best on dimensions that either slowing change or do not change at all. If you know that you are going to be filtering on a select subset of your data, say a specific time period, state or customer, place that dimension on your filters shelf. Then, click on it again within the filters shelf and select Add to Context. All further results then will be pre-filtered and proportionately faster. Please review the Knowledgebase article for more information.

4

5 Add a context filter to materialize joins Materializing means that we calculate all the joins ahead of time so that they don't need to be re-calculated on every query. This one is a bit tricky. Basically we set a context filter that includes all the data. I do this by setting the filter to exclude none of the member of a dimension. Tableau is smart enough to recognize this and do the right thing. Amazingly, this can give huge performance increases when the data is joined. For example, our Sample - Coffee Chain data source contains two joins. When we apply this blank context filter, Tableau creates a temp table in the database that is denormalized. This means that all the data now sits in a single table instead of in 3 tables. This alone yields up to 10x performance improvement for subsequent queries. I've typically seen 2-5x improvements for production databases. Note: These types of Context filters are particularly useful when using a 'Custom SQL' connection. Extracts Tableau can create extremely fast extracts using its architecture aware extract engine. When creating extracts there are a few techniques that can you can employ to make the most out of them. Make sure that you hide any unnecessary fields from your data window. Tableau will only extract the fields that are unhidden. By hiding these fields, you will reduce the size of your extract from a columnar perspective.


6 If your data is at a smaller grain than needed for your analysis or content requires, Tableau can create an extract that is aggregated to the level of detail that is needed. This can be done with a few clicks by going to the Data>Extract data menu item then selecting the Aggregate data for visible dimensions and pressing the Hide All Unused fields button. Now your data will be as small as it can possibly be while keeping the necessary level of detail. You can also extract a subset of data either a filtered subset (say one month of data) or a random sample of data. This will give you the opportunity to create your analytical content and when you are ready to bring the power of Tableau to bear on the complete data set, deselect the Use Extract menu item. When using Filters When filtering, try to avoid the Exclude option. When the Exclude option is used Tableau must scan all the selected data there is no opportunity for Tableau to use any INDEX! When filtering time dimensions, avoid using the Individual dates and times filter type. This filter type will explicitly query for each date and time available. If needed, use cascading quick filters for Years, Months and Days to show only the data that you are looking for. Also, the relative date filter is an easy way to show the current week or month of data without having to edit your workbook or republish to Tableau Server. Relevant value quick filters can create expensive queries, only use when needed.
 or a random sample of data.")
7 Content When authoring content in Tableau Desktop, there are many different ways to achieve the same analysis. Some of the ways perform better than other methods. This section will explore some of the choices that can be made when creating calculations will a focus on the better performing options. Use Boolean calculations whenever possible A standard IF THEN statement that returns only two values would look like this: IF [Date]= TODAY() then Today ELSE Not Today END A faster performing calculation would be: [Date]=Today() Then use Aliases to rename the TRUE and FALSE results to Today and Not Today. Alternatives to Grouping Instead of ad hoc grouping, you can use calculated fields to explicitly group members in a dimension. Case left([product 3 - Name], 5) When "Xerox" then "Xerox" When "Avery" then "Avery" When "Canon" then "Canon" When "Eldon" then "Eldon" else [Product 3 - Name] A case statement like the one above will run faster than creating a group that would achieve the same grouping. Also, if a new product that matches the above criteria, it will automatically group it. Use ELSEIF rather than ELSE IF in your logical statements. The nested IF computes a second IF statement, rather than being computed as part of the first one. So this ugly beast: Would run much faster as: IF [Region] = "East" and [Customer Segment] = "consumer" then "East-Consumer" Else IF [Region] = "East" and Customer Segment] <>"consumer" then "East-All Others" IF [Region] = "East" and [Customer Segment] = "consumer" then "East-Consumer" Elseif [Region] = "East" and [Customer Segment] <>"consumer" then "East-All Others"
![Use Boolean calculations whenever possible A standard IF THEN statement that returns only two values would look like this: IF [Date]= TODAY() then Today ELSE Not Today END A faster performing](/docs-images/54/9563339/images/page_7.jpg "calculation would be: [Date]=Today() Then use Aliases to rename the TRUE and FALSE results to Today and Not Today.")
8 Using Date Functions Use NOW() only if you need the time stamp level of detail. Use Today() for date level calculations. Tableau only queries a row of data once in a calculation Calculations such as the one below seem complete, but contain redundant calculations: IF [Sales] < 10 Then "Bad" Elseif [Sales]>= 10 and [Sales] < 30 Then "OK" Elseif [Sales] >= 30 then "Great" Instead take advantage of the logic that has already been performed: IF [Sales] < 10 Then "Bad" Elseif [Sales] >= 30 then "Great" else "OK" When using extracts and custom aggregations, divide the calculation into multiple parts. Place the row level calculations on one Calculated field, and the aggregated calculation in a second calculated field. Then extracts can optimize (pre compute) the row level calculations. Dashboard recommations Use Filtering actions instead of Quick Filters. A Quick Filter needs a query in order to populate the list for the filter. Since an action leverages the view itself as the filtering agent, it will save a query from being issued. When using a filtering action, select the Clearing the selection will: Exclude all values. This checkbox avoids the potentially expensive query of asking for all of the data that the dashboard is able to rer. When publishing dashboards and other content to Tableau Server, avoid creating large quick filters with many members on it in a multiple value list use a compact list instead. Also avoid creating large cross-tabs of data. This can easily be avoided by using Tableau s actions to dynamically filter the data for you. Miscellaneous recommations If you are using a dimension that has a Geographical Role like, consider setting the Geographical Role to None if you are NOT going to rer your data in a map. This will save some time looking up the Tableau generated Latitudes and Longitudes. Remove any unneeded dimensions or measures from your palette. Typically there may be extra items on the Level of Detail shelf.
![[Sales] < 30 Then "OK" Elseif [Sales] >= 30 then "Great" Instead take advantage of the logic that has already been performed: IF [Sales] < 10 Then "Bad" Elseif [Sales] >= 30 then "Great" else "OK"](/docs-images/54/9563339/images/page_8.jpg "When using extracts and custom aggregations, divide the calculation into multiple parts.")
RIFIS Ad Hoc Reports
 RIFIS Ad Hoc Reports To retrieve the entire list of all Ad Hoc Reports, including the Base reports and any additional reports published to your Role, select Ad Hoc for the Type under Filter Report By and
Tuning Tableau and Your Database for Great Performance PRESENT ED BY
 Tuning Tableau and Your Database for Great Performance PRESENT ED BY Matt Higgins, Tableau Software Robert Morton, Tableau Software Tuning Tableau and Your Database for Great Performance Understand Tableau
I. Create the base view with the data you want to measure
 Developing Key Performance Indicators (KPIs) in Tableau The following tutorial will show you how to create KPIs in Tableau 9. To get started, you will need the following: Tableau version 9 Data: Sample
Converting Dimensions to Measures & Changing Data Types
 1 Converting Dimensions to Measures & Changing Data Types When connecting to a data source, Tableau takes a best guess at the type of data contained in each column of your database. Tableau will assign
DATA VISUALIZATION WITH TABLEAU PUBLIC. (Data for this tutorial at www.peteraldhous.com/data)
") DATA VISUALIZATION WITH TABLEAU PUBLIC (Data for this tutorial at www.peteraldhous.com/data) Tableau Public allows you to create a wide variety of interactive graphs, maps and tables and organize them
DATA VISUALIZATION WITH TABLEAU PUBLIC (Data for this tutorial at www.peteraldhous.com/data) Tableau Public allows you to create a wide variety of interactive graphs, maps and tables and organize them
New Orleans 2007 Workshop Tips For Using Microsoft Excel to Analyze EMSC Data and Generate Reports Pivot Tables and Other Goodies
 1 of 17 New Orleans 2007 Workshop Tips For Using Microsoft Excel to Analyze EMSC Data and Generate Reports Pivot Tables and Other Goodies Introduction In this document, we will describe several more advanced
Microsoft Access Basics
 Microsoft Access Basics 2006 ipic Development Group, LLC Authored by James D Ballotti Microsoft, Access, Excel, Word, and Office are registered trademarks of the Microsoft Corporation Version 1 - Revision
How To Create A Powerpoint Intelligence Report In A Pivot Table In A Powerpoints.Com
 Sage 500 ERP Intelligence Reporting Getting Started Guide 27.11.2012 Table of Contents 1.0 Getting started 3 2.0 Managing your reports 10 3.0 Defining report properties 18 4.0 Creating a simple PivotTable
Chapter 4 Displaying and Describing Categorical Data
 Chapter 4 Displaying and Describing Categorical Data Chapter Goals Learning Objectives This chapter presents three basic techniques for summarizing categorical data. After completing this chapter you should
DbSchema Tutorial with Introduction in SQL Databases
 DbSchema Tutorial with Introduction in SQL Databases Contents Connect to the Database and Create First Tables... 2 Create Foreign Keys... 7 Create Indexes... 9 Generate Random Data... 11 Relational Data
Tips and Tricks SAGE ACCPAC INTELLIGENCE
 Tips and Tricks SAGE ACCPAC INTELLIGENCE 1 Table of Contents Auto e-mailing reports... 4 Automatically Running Macros... 7 Creating new Macros from Excel... 8 Compact Metadata Functionality... 9 Copying,
MicroStrategy Desktop
 MicroStrategy Desktop Quick Start Guide MicroStrategy Desktop is designed to enable business professionals like you to explore data, simply and without needing direct support from IT. 1 Import data from
TABLEAU COURSE CONTENT. Presented By 3S Business Corporation Inc www.3sbc.com Call us at : 281-823-9222 Mail us at : info@3sbc.com
 TABLEAU COURSE CONTENT Presented By 3S Business Corporation Inc www.3sbc.com Call us at : 281-823-9222 Mail us at : info@3sbc.com Introduction and Overview Why Tableau? Why Visualization? Level Setting
Census Data with Tableau Public
 Census Data with Tableau Public Before you begin, download the template at http://public.tableausoftware.com/views/census-template/dashboard?:embed=yes&:toolbar=yes&:tabs=no Get your data together 1. Gather
Knowledgebase Article
 Company web site: Support email: Support telephone: +44 20 3287-7651 +1 646 233-1163 2 EMCO Network Inventory 5 provides a built in SQL Query builder that allows you to build more comprehensive
CalPlanning. Smart View Essbase Ad Hoc Analysis
 1 CalPlanning CalPlanning Smart View Essbase Ad Hoc Analysis Agenda Overview Introduction to Smart View & Essbase 4 Step Smart View Essbase Ad Hoc Analysis Approach 1. Plot Dimensions 2. Drill into Data
Getting Started Guide
 Getting Started Guide Introduction... 3 What is Pastel Partner (BIC)?... 3 System Requirements... 4 Getting Started Guide... 6 Standard Reports Available... 6 Accessing the Pastel Partner (BIC) Reports...
User Guide. Analytics Desktop Document Number: 09619414
 User Guide Analytics Desktop Document Number: 09619414 CONTENTS Guide Overview Description of this guide... ix What s new in this guide...x 1. Getting Started with Analytics Desktop Introduction... 1
Pastel Evolution BIC. Getting Started Guide
 Pastel Evolution BIC Getting Started Guide Table of Contents System Requirements... 4 How it Works... 5 Getting Started Guide... 6 Standard Reports Available... 6 Accessing the Pastel Evolution (BIC) Reports...
ABSTRACT INTRODUCTION CLINICAL PROJECT TRACKER OF SAS TASKS. Paper PH-02-2015
 Paper PH-02-2015 Project Management of SAS Tasks - Excel Dashboard without Using Any Program Kalaivani Raghunathan, Quartesian Clinical Research Pvt. Ltd, Bangalore, India ABSTRACT Have you ever imagined
Data Mining, Predictive Analytics with Microsoft Analysis Services and Excel PowerPivot
 www.etidaho.com (208) 327-0768 Data Mining, Predictive Analytics with Microsoft Analysis Services and Excel PowerPivot 3 Days About this Course This course is designed for the end users and analysts that
MICROSOFT ACCESS 2003 TUTORIAL
 MICROSOFT ACCESS 2003 TUTORIAL M I C R O S O F T A C C E S S 2 0 0 3 Microsoft Access is powerful software designed for PC. It allows you to create and manage databases. A database is an organized body
Create an Excel BI report and share on SharePoint 2013
 2013 Create an Excel BI report and share on SharePoint 2013 Hands-On Lab Lab Manual This document is provided as-is. Information and views expressed in this document, including URL and other Internet Web
Best Practices for Hadoop Data Analysis with Tableau
 Best Practices for Hadoop Data Analysis with Tableau September 2013 2013 Hortonworks Inc. http:// Tableau 6.1.4 introduced the ability to visualize large, complex data stored in Apache Hadoop with Hortonworks
Tableau Your Data! Wiley. with Tableau Software. the InterWorks Bl Team. Fast and Easy Visual Analysis. Daniel G. Murray and
 Tableau Your Data! Fast and Easy Visual Analysis with Tableau Software Daniel G. Murray and the InterWorks Bl Team Wiley Contents Foreword xix Introduction xxi Part I Desktop 1 1 Creating Visual Analytics
BID2WIN Workshop. Advanced Report Writing
 BID2WIN Workshop Advanced Report Writing Please Note: Please feel free to take this workbook home with you! Electronic copies of all lab documentation are available for download at http://www.bid2win.com/userconf/2011/labs/
ORACLE BUSINESS INTELLIGENCE WORKSHOP
 ORACLE BUSINESS INTELLIGENCE WORKSHOP Creating Interactive Dashboards and Using Oracle Business Intelligence Answers Purpose This tutorial shows you how to build, format, and customize Oracle Business
Team Foundation Server 2013 Installation Guide
 Team Foundation Server 2013 Installation Guide Page 1 of 164 Team Foundation Server 2013 Installation Guide Benjamin Day benday@benday.com v1.1.0 May 28, 2014 Team Foundation Server 2013 Installation Guide
Microsoft Office Access 2007 which I refer to as Access throughout this book
 Chapter 1 Getting Started with Access In This Chapter What is a database? Opening Access Checking out the Access interface Exploring Office Online Finding help on Access topics Microsoft Office Access
EzyScript User Manual
 Version 1.4 Z Option 417 Oakbend Suite 200 Lewisville, Texas 75067 www.zoption.com (877) 653-7215 (972) 315-8800 fax: (972) 315-8804 EzyScript User Manual SAP Transaction Scripting & Table Querying Tool
Google Docs: Share and collaborate
 Google Docs: Share and collaborate Once you've created your document, share it with others! Collaborators can then edit the same document at the same time -- you'll always have the most up-to-date version
Microsoft Excel 2010 Pivot Tables
 Microsoft Excel 2010 Pivot Tables Email: training@health.ufl.edu Web Page: http://training.health.ufl.edu Microsoft Excel 2010: Pivot Tables 1.5 hours Topics include data groupings, pivot tables, pivot
Lost in Space? Methodology for a Guided Drill-Through Analysis Out of the Wormhole
 Paper BB-01 Lost in Space? Methodology for a Guided Drill-Through Analysis Out of the Wormhole ABSTRACT Stephen Overton, Overton Technologies, LLC, Raleigh, NC Business information can be consumed many
Create a New Database in Access 2010
 Create a New Database in Access 2010 Table of Contents OVERVIEW... 1 CREATING A DATABASE... 1 ADDING TO A DATABASE... 2 CREATE A DATABASE BY USING A TEMPLATE... 2 CREATE A DATABASE WITHOUT USING A TEMPLATE...
Tableau Quick Tips Guide November 2015
 Tableau Quick Tips Guide November 2015 Fannie Mae Connect uses Tableau software to enable data display and analysis. This document provides guidance on how to get the most out of Tableau reports. The reference
NICAR Hands-On: Census Data with Tableau Public
 NICAR Hands-On: Census Data with Tableau Public Get your data together 1. Gather your data. You ll need: a. 2010 and 2000 census data for place (with population > 2000) b. Annexation data by place, from
MAS 500 Intelligence Tips and Tricks Booklet Vol. 1
 MAS 500 Intelligence Tips and Tricks Booklet Vol. 1 1 Contents Accessing the Sage MAS Intelligence Reports... 3 Copying, Pasting and Renaming Reports... 4 To create a new report from an existing report...
SQL Server An Overview
 SQL Server An Overview SQL Server Microsoft SQL Server is designed to work effectively in a number of environments: As a two-tier or multi-tier client/server database system As a desktop database system
Search help. More on Office.com: images templates
 Page 1 of 14 Access 2010 Home > Access 2010 Help and How-to > Getting started Search help More on Office.com: images templates Access 2010: database tasks Here are some basic database tasks that you can
MS Access. Microsoft Access is a relational database management system for windows. Using this package, following tasks can be performed.
 MS Access Microsoft Access is a relational database management system for windows. Using this package, following tasks can be performed. Organize data into manageable related units Enter, modify and locate
Logi Ad Hoc Reporting Report Design Guide
 Logi Ad Hoc Reporting Report Design Guide Version 10.2 Last Updated: May 2012 Page 2 Table of Contents INTRODUCTION... 4 What is Logi Ad Hoc Reporting?... 5 CHAPTER 1 Getting Started... 6 Learning the
COGNOS Query Studio Ad Hoc Reporting
 COGNOS Query Studio Ad Hoc Reporting Copyright 2008, the California Institute of Technology. All rights reserved. This documentation contains proprietary information of the California Institute of Technology
Logi Ad Hoc Reporting Report Design Guide
 Logi Ad Hoc Reporting Report Design Guide Version 11.2 Last Updated: March, 2014 Page 2 Table of Contents INTRODUCTION... 4 What is Logi Ad Hoc Reporting?... 5 CHAPTER 1 Getting Started... 6 Learning the
Overview. Table of Contents. isupport Incident Management
 Overview The isupport software is a powerful and flexible help desk/desktop support solution used by San José State to manage information technology tickets, or incidents. While isupport has many tools
Creating a Tableau Data Visualization on Cincinnati Crime By Jeffrey A. Shaffer
 Creating a Tableau Data Visualization on Cincinnati Crime By Jeffrey A. Shaffer Step 1 Gather and Compile the Data: This data was compiled using weekly files provided by the Cincinnati Police. Each file
How To Create A Report In Excel
 Table of Contents Overview... 1 Smartlists with Export Solutions... 2 Smartlist Builder/Excel Reporter... 3 Analysis Cubes... 4 MS Query... 7 SQL Reporting Services... 10 MS Dynamics GP Report Templates...
Sales Performance Management Using Salesforce.com and Tableau 8 Desktop Professional & Server
 Sales Performance Management Using Salesforce.com and Tableau 8 Desktop Professional & Server Author: Phil Gilles Sales Operations Analyst, Tableau Software March 2013 p2 Executive Summary Managing sales
Tableau and the Enterprise Data Warehouse: The Visual Approach to Business Intelligence
 Tableau and the Enterprise Data Warehouse: The Visual Approach to Business Intelligence AUTHOR Dan Jewett Tableau Software DATE 08/01/2009 Organizations focus on acquiring customers, increasing revenues
EXCEL 2007. Using Excel for Data Query & Management. Information Technology. MS Office Excel 2007 Users Guide. IT Training & Development
 Information Technology MS Office Excel 2007 Users Guide EXCEL 2007 Using Excel for Data Query & Management IT Training & Development (818) 677-1700 Training@csun.edu http://www.csun.edu/training TABLE
ACCESS 2007. Importing and Exporting Data Files. Information Technology. MS Access 2007 Users Guide. IT Training & Development (818) 677-1700
 677-1700") Information Technology MS Access 2007 Users Guide ACCESS 2007 Importing and Exporting Data Files IT Training & Development (818) 677-1700 training@csun.edu TABLE OF CONTENTS Introduction... 1 Import Excel
Information Technology MS Access 2007 Users Guide ACCESS 2007 Importing and Exporting Data Files IT Training & Development (818) 677-1700 training@csun.edu TABLE OF CONTENTS Introduction... 1 Import Excel
BRIO QUERY FUNCTIONALITY IN COMPARISION TO CRYSTAL REPORTS
 BRIO QUERY FUNCTIONALITY IN COMPARISION TO CRYSTAL REPORTS Category Downstream Analysis Nested Queries Brio Functionality Ability to create data sets Ability to create tables and upload tables Available
ID-Spec Large boosts your performance in electrical distribution design :
 Large V2.0 Software for Electrical Distribution Installation Design in Industrial and Tertiary Buildings Part of of Schneider Electric software series for Designers ID-Spec Large boosts your performance
Tommy B. Harrington 104 Azalea Drive Greenville, NC 27858 Email: tommy@tommyharrington.com
 M o s t U s e f u l E x c e l C o m m a n d s Tommy B. Harrington 104 Azalea Drive Greenville, NC 27858 Email: tommy@tommyharrington.com Computer Training YOU Can Understand! Most Useful Excel Commands
Business Insight Report Authoring Getting Started Guide
 Business Insight Report Authoring Getting Started Guide Version: 6.6 Written by: Product Documentation, R&D Date: February 2011 ImageNow and CaptureNow are registered trademarks of Perceptive Software,
In This Issue: Excel Sorting with Text and Numbers
 In This Issue: Sorting with Text and Numbers Microsoft allows you to manipulate the data you have in your spreadsheet by using the sort and filter feature. Sorting is performed on a list that contains
Optimizing the Performance of the Oracle BI Applications using Oracle Datawarehousing Features and Oracle DAC 10.1.3.4.1
 Optimizing the Performance of the Oracle BI Applications using Oracle Datawarehousing Features and Oracle DAC 10.1.3.4.1 Mark Rittman, Director, Rittman Mead Consulting for Collaborate 09, Florida, USA,
not at all a manual simply a quick how-to-do guide
 not at all a manual simply a quick how-to-do guide As a general rule, the GUI implemented by spatialite-gis is closely related to the one implemented by the companion app spatialite-gui So, if you are
Getting Started Guide SAGE ACCPAC INTELLIGENCE
 Getting Started Guide SAGE ACCPAC INTELLIGENCE Table of Contents Introduction... 1 What is Sage Accpac Intelligence?... 1 What are the benefits of using Sage Accpac Intelligence?... 1 System Requirements...
Gravity Forms: Creating a Form
 Gravity Forms: Creating a Form 1. To create a Gravity Form, you must be logged in as an Administrator. This is accomplished by going to http://your_url/wp- login.php. 2. On the login screen, enter your
User Guide to the Content Analysis Tool
 User Guide to the Content Analysis Tool User Guide To The Content Analysis Tool 1 Contents Introduction... 3 Setting Up a New Job... 3 The Dashboard... 7 Job Queue... 8 Completed Jobs List... 8 Job Details
Microsoft SQL Server Guide. Best Practices and Backup Procedures
 Microsoft SQL Server Guide Best Practices and Backup Procedures Constellation HomeBuilder Systems Inc. This document is copyrighted and all rights are reserved. This document may not, in whole or in part,
Google Drive: Access and organize your files
 Google Drive: Access and organize your files Use Google Drive to store and access your files, folders, and Google Docs, Sheets, and Slides anywhere. Change a file on the web, your computer, tablet, or
Monthly Payroll to Finance Reconciliation Report: Access and Instructions
 Monthly Payroll to Finance Reconciliation Report: Access and Instructions VCU Reporting Center... 2 Log in... 2 Open Folder... 3 Other Useful Information: Copying Sheets... 5 Creating Subtotals... 5 Outlining
Release 2.1 of SAS Add-In for Microsoft Office Bringing Microsoft PowerPoint into the Mix ABSTRACT INTRODUCTION Data Access
 Release 2.1 of SAS Add-In for Microsoft Office Bringing Microsoft PowerPoint into the Mix Jennifer Clegg, SAS Institute Inc., Cary, NC Eric Hill, SAS Institute Inc., Cary, NC ABSTRACT Release 2.1 of SAS
Creating a Database in Access
 Creating a Database in Access Microsoft Access is a database application. A database is collection of records and files organized for a particular purpose. For example, you could use a database to store
Creating Database Tables in Microsoft SQL Server
 Creating Database Tables in Microsoft SQL Server Microsoft SQL Server is a relational database server that stores and retrieves data for multi-user network-based applications. SQL Server databases are
ECDL. European Computer Driving Licence. Database Software BCS ITQ Level 1. Syllabus Version 1.0
 ECDL European Computer Driving Licence Database Software BCS ITQ Level 1 Using Microsoft Access 2013 Syllabus Version 1.0 This training, which has been approved by BCS, includes exercise items intended
EXPORTING THE SCHOOL ROSTER INTO AN EXCEL SPREADSHEET
 EXPORTING THE SCHOOL ROSTER INTO AN EXCEL SPREADSHEET QUICK GUIDE Since Columbus City Schools were closed eight days during the 2013-2014 school year due to weather, three of those days will be made up
Creating and Using Databases with Microsoft Access
 CHAPTER A Creating and Using Databases with Microsoft Access In this chapter, you will Use Access to explore a simple database Design and create a new database Create and use forms Create and use queries
Retrieving Data from OLAP Servers
 CHAPTER Retrieving Data from OLAP Servers In this chapter What Is OLAP? 790 by Timothy Dyck and John Shumate timothy_dyck@dyck.org, jcshumate@starpower.net Server Versus Client OLAP 791 Creating an OLAP
Web Intelligence User Guide
 Web Intelligence User Guide Office of Financial Management - Enterprise Reporting Services 4/11/2011 Table of Contents Chapter 1 - Overview... 1 Purpose... 1 Chapter 2 Logon Procedure... 3 Web Intelligence
HRS 750: UDW+ Ad Hoc Reports Training 2015 Version 1.1
 HRS 750: UDW+ Ad Hoc Reports Training 2015 Version 1.1 Program Services Office & Decision Support Group Table of Contents Create New Analysis... 4 Criteria Tab... 5 Key Fact (Measurement) and Dimension
Intellect Platform - Tables and Templates Basic Document Management System - A101
 Intellect Platform - Tables and Templates Basic Document Management System - A101 Interneer, Inc. 4/12/2010 Created by Erika Keresztyen 2 Tables and Templates - A101 - Basic Document Management System
Visual Studio.NET Database Projects
 Visual Studio.NET Database Projects CHAPTER 8 IN THIS CHAPTER Creating a Database Project 294 Database References 296 Scripts 297 Queries 312 293 294 Visual Studio.NET Database Projects The database project
XpoLog Center Suite Log Management & Analysis platform
 XpoLog Center Suite Log Management & Analysis platform Summary: 1. End to End data management collects and indexes data in any format from any machine / device in the environment. 2. Logs Monitoring -
Using Microsoft Access Front End to NIMSP MySQL Database
 Technical Report Using Microsoft Access Front End to NIMSP MySQL Database by Earl F Glynn 10 Oct. 2013 Contents Purpose... 3 Introduction... 3 National Institute on Money in State Politics... 3 How to
Welcome to Tableau Server
 Welcome to Tableau Server As a companion to Tableau Desktop Professional Edition, Tableau Server allows you and others to share discoveries through an interactive and collaborative web experience. People
How to build Dashboard - Step by Step tutorial/recipe
 How to build Dashboard - Step by Step tutorial/recipe Contents How to build Dashboard - Step by Step tutorial/recipe...1 How to create Excel Dashboard [ as direct connection ]...2 Purpose of this Dashboard
COGNOS KARATE BELT SESSION III CREATING SLOTS
 COGNOS KARATE BELT SESSION III CREATING SLOTS DIY SLOTS Purpose: This document explains the process for creating indicators as a way to slot information into one row from data that would normally be in
Microsoft Access 3: Understanding and Creating Queries
 Microsoft Access 3: Understanding and Creating Queries In Access Level 2, we learned how to perform basic data retrievals by using Search & Replace functions and Sort & Filter functions. For more complex
Creating a Patch Management Dashboard with IT Analytics Hands-On Lab
 Creating a Patch Management Dashboard with IT Analytics Hands-On Lab Description This lab provides a hands-on overview of the IT Analytics Solution. Students will learn how to browse cubes and configure
Tableau's data visualization software is provided through the Tableau for Teaching program.
 A BEGINNER S GUIDE TO VISUALIZATION Featuring REU Site Collaborative Data Visualization Applications June 10, 2014 Vetria L. Byrd, PhD Advanced Visualization, Director REU Coordinator Visualization Scientist
Finance Reporting. Millennium FAST. User Guide Version 4.0. Memorial University of Newfoundland. September 2013
 Millennium FAST Finance Reporting Memorial University of Newfoundland September 2013 User Guide Version 4.0 FAST Finance User Guide Page i Contents Introducing FAST Finance Reporting 4.0... 2 What is FAST
2Creating Reports: Basic Techniques. Chapter
 2Chapter 2Creating Reports: Chapter Basic Techniques Just as you must first determine the appropriate connection type before accessing your data, you will also want to determine the report type best suited
Step One. Step Two. Step Three USING EXPORTED DATA IN MICROSOFT ACCESS (LAST REVISED: 12/10/2013)
") USING EXPORTED DATA IN MICROSOFT ACCESS (LAST REVISED: 12/10/2013) This guide was created to allow agencies to set up the e-data Tech Support project s Microsoft Access template. The steps below have been
USING EXPORTED DATA IN MICROSOFT ACCESS (LAST REVISED: 12/10/2013) This guide was created to allow agencies to set up the e-data Tech Support project s Microsoft Access template. The steps below have been
Chapter 24: Creating Reports and Extracting Data
 Chapter 24: Creating Reports and Extracting Data SEER*DMS includes an integrated reporting and extract module to create pre-defined system reports and extracts. Ad hoc listings and extracts can be generated
Using SQL Server Management Studio
 Using SQL Server Management Studio Microsoft SQL Server Management Studio 2005 is a graphical tool for database designer or programmer. With SQL Server Management Studio 2005 you can: Create databases
Team Foundation Server 2010, Visual Studio Ultimate 2010, Team Build 2010, & Lab Management Beta 2 Installation Guide
 Page 1 of 243 Team Foundation Server 2010, Visual Studio Ultimate 2010, Team Build 2010, & Lab Management Beta 2 Installation Guide (This is an alpha version of Benjamin Day Consulting, Inc. s installation
BusinessObjects Enterprise InfoView User's Guide
 BusinessObjects Enterprise InfoView User's Guide BusinessObjects Enterprise XI 3.1 Copyright 2009 SAP BusinessObjects. All rights reserved. SAP BusinessObjects and its logos, BusinessObjects, Crystal Reports,
Power BI Performance. Tips and Techniques WWW.PRAGMATICWORKS.COM
 Power BI Performance Tips and Techniques Rachael Martino Principal Consultant rmartino@pragmaticworks.com @RMartinoBoston About Me SQL Server and Oracle developer and IT Manager since SQL Server 2000 Focused
MS Excel Template Building and Mapping for Neat 5
 MS Excel Template Building and Mapping for Neat 5 Neat 5 provides the opportunity to export data directly from the Neat 5 program to an Excel template, entering in column information using receipts saved
Innovative technology for big data analytics
 Technical white paper Innovative technology for big data analytics The HP Vertica Analytics Platform database provides price/performance, scalability, availability, and ease of administration Table of
Microsoft Access 2010 Part 1: Introduction to Access
 CALIFORNIA STATE UNIVERSITY, LOS ANGELES INFORMATION TECHNOLOGY SERVICES Microsoft Access 2010 Part 1: Introduction to Access Fall 2014, Version 1.2 Table of Contents Introduction...3 Starting Access...3
Bullet Proof: A Guide to Tableau Server Security
 Bullet Proof: A Guide to Tableau Server Security PDF Guide Tableau Conference 2014 Bryan Naden & Ray Randall Tableau Server Security Hands On To begin the exercise we are going to start off fresh by restoring
Building Better Dashboards PART 1: BASIC DASHBOARDS
 Building Better Dashboards PART 1: BASIC DASHBOARDS For Questions or Feedback Alexandria Skrivanich or Michael Carpenter askrivanich@tableausoftware.com mcarpenter@tableausoftware.com 1 CREATING & LABELING
Creating Reports with Smart View s Ad Hoc Analysis
 with Smart View s Ad Hoc Analysis Dartmouth College February 10, 2009 Table of Contents Overview... 3 Connecting to the Reporting Cube... 3 Setting Ad Hoc Options... 3 The Ad Hoc Grid... 4 Selecting Members
SENDING E-MAILS WITH MAIL MERGE
 SENDING E-MAILS WITH MAIL MERGE You can use Mail Merge for Word and Outlook to create a brochure or newsletter and send it by e- mail to your Outlook contact list or to another address list, created in
UDW+ Quick Start Guide to Functionality 2013 Version 1.1
 to Functionality 2013 Version 1.1 Program Services Office & Decision Support Group Table of Contents Accessing UDW+... 2 System Requirements... 2 How to Login to UDW+... 2 Navigating within UDW+... 2 Home
Sterling Business Intelligence
 Sterling Business Intelligence Release Note Release 9.0 March 2010 Copyright 2010 Sterling Commerce, Inc. All rights reserved. Additional copyright information is located on the documentation library:
Access Queries (Office 2003)
") Access Queries (Office 2003) Technical Support Services Office of Information Technology, West Virginia University OIT Help Desk 293-4444 x 1 oit.wvu.edu/support/training/classmat/db/ Instructor: Kathy
Access Queries (Office 2003) Technical Support Services Office of Information Technology, West Virginia University OIT Help Desk 293-4444 x 1 oit.wvu.edu/support/training/classmat/db/ Instructor: Kathy