Residential Energy Consumption: Longer Term Response to Climate Change
|
|
|
- Clifton Floyd
- 8 years ago
- Views:
Transcription
1 24 th USAEE/IAEE North American Conference July 8-10, 2004, Washington, DC Residential Energy Consumption: Longer Term Response to Climate Change Christian Crowley and Frederick L. Joutz GWU Department of Economics and Research Program on Forecasting The authors wish to acknowledge John Cymbalsky (EIA) and Frank Morra (BoozAllenHamilton) for their invaluable assistance running the NEMS simulations. All errors and omissions rest with the authors.
 and Frank Morra (BoozAllenHamilton) for their invaluable assistance running the NEMS simulations.")
2 Context This study is part of a larger joint effort supported by an EPA STAR grant. Implications of Climate Change for Regional Air Pollution and Health Effects and Energy Consumption Behavior. Our co-researchers in the project are from the Johns Hopkins University, Department of Geography and Environmental Engineering and the School of Public Health.

3 Context (cont.) The four modeling efforts of the project are 1. Electricity load modeling and forecasting a. Hourly b. Long term 2. Electricity generation and dispatch modeling 3. Regional air pollution modeling 4. Health effects characterization

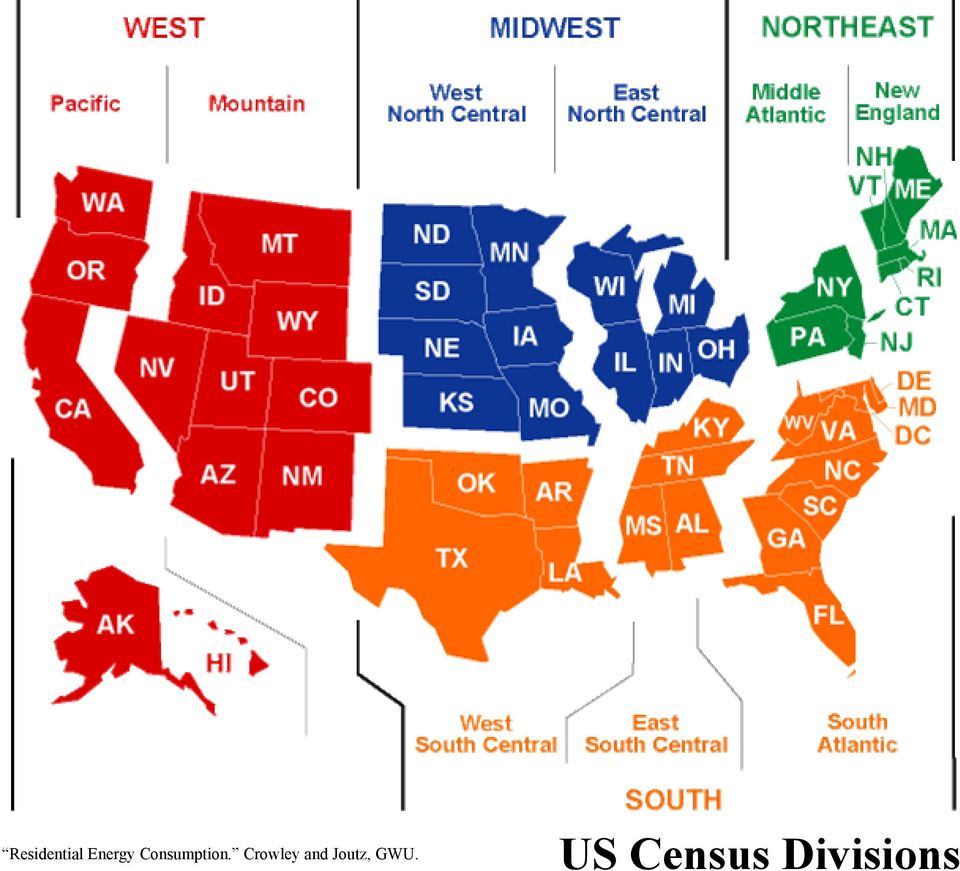
4 Aim of the Research Our goal is to consider first order effects of hotter Summers on residential and commercial energy demand. We developed Summer warming scenarios incorporating a range of Cooling Degree Day (CDD) increases. The Scenarios are by the 9 Census regions.
 increases.")
5 Aim of the Research The EIA s National Energy Modeling System (NEMS) was used to predict the effects of these scenarios on 1. Energy consumption 2. Energy efficiency 3. Energy expenditure 4. Regional energy expenditure

6 Warming Scenarios I. Gradual Warming of 2 F over II. Gradual Warming up to Maximum Historical level of CDDs ( ) III. Gradual Warming of 6 F over
 III.")
7 US Census Divisions
8 NEMS Base Case Residential Electricity - Price and Consumption Quadrillion BTU $ per Million BTU Consumption Price

9 NEMS Base Case Residential Electricity - Price and Consumption The Reference Case suggests that: Consumption rises by 1.5 Quadrillion BTU Prices are expected to decline by 5% by 2010 then rise slightly, but on net decline. Budget Share of residential electricity declines from 2.2% to 1.5%

10 Residential Electricity Expenditures (2002 dollars) Region 2001 New England Middle Atlantic South Atlantic East North Central East South Central 1,136.2 West North Central 1,042.1 West South Central 1,244.9 Mountain Pacific , , , Annual % Change 0.35% 0.19% 0.61% 0.65% 0.68% 0.60% 0.62% 0.44% -0.38%

11 Residential Electricity Expenditures (2002 dollars) Most expensive region is WNC $1,250/year Cheapest region South Atlantic $770/year Expected to increase by about 20% over the next 20 years. (0.6% annualized) Less than Real Disposable Income growth

12 Base Case Descriptive Facts Annual % Change Real Disposable Income (billion 2000 dollars) 6, , % Population (millions) % Households (millions) % US Total Central Air Units (million units) % SEER n.a.
 48.8 77.2 1.")
13 Base Case Total Residential Energy Consumption Million BTU per Household Housing sizes: 2002 sq ft = sq ft = Thousand BTU per Square Foot per Household per Square Foot

14 Total Electricity Consumption and Space Cooling NEMS Reference Case 30-year Temperature Average Households rise by 30 million Decline from 2.6 to 2.5 persons/household Housing Size by square foot increase by 6% MBTU/HH decline by 0.25% TBTU/FT 2 decline by 0.25% as well

15 Total Residential Electricity Consumption and Space Cooling TWh = 1,000,000,000 kwh TeraWatt hours TeraWatt hours Total Electricity Cooling Demand

16 Total Residential Electricity Consumption and Space Cooling Total residential consumption increases from 1320 Terawatts to 1405 Terawatts, 5% Total space cooling consumption increase from 195 Terawatts to 202 Terawatts. Cooling s share of total consumption declines slightly to almost 14%.

17 Residential Electricity Prices (2002 cents per kwh) US New England Middle Atlantic South Atlantic East North Central East South Central West North Central West South Central Mountain Pacific

18 Residential Electricity Prices (2002 cents per kwh) New England and Middle Atlantic (NY,NJ) is most expensive 11 cents / kwh East South Central cheapest 6.5 cents / kwh. In real terms price per kwh declines by 0.3 cents.

19 Warming Scenarios I. Gradual Warming of 2 F over II. Gradual Warming up to Maximum Historical level of CDDs ( ) III. Gradual Warming of 6 F over
 III.")
20 Residential Energy Consumption 6.5 Quadrillion BTU per year Scenario 3 Scenario 2 Scenario 1 Base Case

21 Residential Energy Consumption under the 3 Scenarios Consumption increases from 4.5 over 6.2 Quadrillion BTUs next 20 years in Reference Case Case 1-2 leads to additional 0.1 Quadrillion BTUs or nearly 2%. Worst Case Scenario increase of 0.3 Quadrillion BTUs or about 5%.
22 Space Cooling for Residential Energy Consumption Quadrillion BTU per year Scenario 3 Scenario 2 Scenario 1 Base Case
23 Space Cooling for Residential Energy Consumption, NEMS projection is to increase from Terawatts Terawatts Share of Total Scenario 1 Scenario 2 Scenario % 46% 54%
24 Non-marketed Renewables - Geothermal 12 Trillion BTU per year Scenario 3 Scenario 2 Scenario 1 Base Case
25 Conclusion Preliminary research into the impact of higher summer temperatures on residential electricity demands. EIA s NEMS model was used for making projections from Three Scenarios using increases of 2F, XF, and 6F over the time period. Space Cooling Demand increases by 40% in worst case and 10% in 2F case over the NEMS reference case.
26 Conclusion Assumptions reduce household discount rate from 30% to 10%. Fall in discount rate had little effect on Technology adoption. We do observe greater use of non-renewables: passive solar and geothermal heat pumps. More work to be done. Understanding the technology choices and diffusion.
27 NEMS Residential Model Inputs Housing Stock Component Housing starts Existing housing stock for 1997 Housing stock attrition rates Housing floor area trends (new and existing) Technology Choice Component Equipment capital cost Equipment energy efficiency Market share of new appliances Efficiency of retiring equipment Appliance penetration factors Appliance Stock Component Expected equipment minimum and maximum lifetimes Base year appliance market shares Equipment saturation level
28 NEMS Residential Model Inputs Building Shell Component Maximum level of shell integrity Price elasticity of shell integrity Rate of improvement in existing housing shell integrity Cost and efficiency of various building shell measures Distributed Generation Component Equipment Cost Equipment Efficiency Solar Insolation Values System Penetration Parameters Energy Consumption Component Unit energy consumption (UEC) Heating and cooling degree days Expected fuel savings based upon the 1992 Energy Policy Act (EPACT) Population Personal disposable income
29 NEMS Residential Outputs Forecasted residential sector energy consumption by fuel type, service, and Census Division is the primary module output. The module also forecasts housing stock, and energy consumption per household. In addition, the module can produce a disaggregated forecast of appliance stock and efficiency. The types of appliances included in this forecast are: Heat pumps (electric air-source, natural gas, and groundsource) Furnaces (electric, natural gas, LPG, and distillate) Hydronic heating systems (natural gas, distillate, and kerosene) Wood stoves Air conditioners (central and room)
30 NEMS Residential Outputs Dishwashers Water heaters (electric, natural gas, distillate, LPG, and solar) Ranges/Ovens (electric, natural gas, and LPG) Clothes dryers (electric and natural gas) Refrigerators Freezers Clothes Washers Fuel Cells Solar Photovoltaic Systems
31 Technology Choice The efficiency choices made for residential equipment are based on a log-linear function. The functional form is flexible, to allow the user to specify parameters as either life-cycle costs, or as weighted of bias, capital and discounted operating costs. Currently, the module calculates choices based on the latter approach. A time dependant function calculates the installed capital cost of equipment in new construction based on logistic shape parameters. If fuel prices increase markedly and remain high over a multi-year period, efficient appliances will be available earlier in the forecast period than would have otherwise.
32 Technology Switching Space heaters, heat pump air conditioners, water heaters, stoves, and clothes dryers may be replaced with competing technologies in singlefamily homes. The amount of equipment which may switch is based on a model input. The technology choice is based on a log-linear function. The functional form is flexible to allow the user to specify parameters, such as weighted bias, retail equipment cost, and technology switching cost. Replacements are with the same technology in multifamily and mobile homes. A time dependant function calculates the retail cost of replacement equipment based on logistic shape parameters.
33 Space Cooling: Room and Central Air Conditioning Units Room and central air conditioning units are disaggregated based on existing housing data. The market penetration of room and central air systems by Census Division and housing type, along with new housing construction data, are used to determine the number of new units of each type. The penetration rate for central air-conditioning is estimated by means of time series analysis of RECS survey data. Water Heating: Solar Water Heaters Market shares for solar water heaters are tabulated from the 1997 RECS data base. The module currently assumes that solar energy provides 55% of the energy needed to satisfy hot water demand, and the remaining 45% is satisfied by an electric back-up unit.
34 Residential Energy's Share of Real Disposable Income Share of Income Scenario 3 Scenario 2 Scenario 1 Base Case
35 Residential Energy's Share of GDP Billion 1996/2002 Dollars Scenario 3 Scenario 2 Scenario 1 Base Case
36 Non-Renewable Energy Expenditures (Residential) Billion 2002 Dollars Scenario 3 Scenario 2 Scenario 1 Base Case
37 Non-Renewable Energy Expenditures (Residential) The Climate scenarios suggest an increase in
38 Caveats Temperature warming due to climate change could be expected to reduce HDDs during Winter months. Without reliable scenarios for Winter warming, EIA assumptions for HDDs were not changed in our scenarios. Additional uncertainty may arise from increased variability in temperature associated with climate change.
39 Scenario I For each Census Region: 1. Start with 30-year average annual CDDs (EIA reference case) 2. Determine days in cooling season 3. Calculate yearly CDD increment 4. Generate CDD series
40 Scenario I Step 1 1. Start with 30-year average annual CDDs Data is drawn from EIA s calculations of average annual CDDs between 1968 and 1997.
41 Scenario I Step 2 2. Determine days in cooling season Average temperatures over the past decade indicate the length of the cooling season.
42 Monthly Temp ( F) E_N_CENTRAL by Season Cooling Season ~ 90 days 20 Jan Feb Mar Apr May Jun Jul Aug Sep Oct Nov Dec E_N_CENTRAL Means by Season
43 Scenario I Step 3 3. Calculate yearly CDD increment 2 CDDs for each day in the cooling season, phased in gradually over
44 Example CDD Increment East North Central region has 90 days in their cooling season: 2 CDD warming 90 days = 180 CDDs added to the cooling season. Over this is an increment of 8.6 CDDs per year.
45 Scenario I Step 4 4. Generate CDD series for Starting with the 30-year average CDDs, increase each year s CDDs by the increment.
46 Scenarios III III. Gradual warming of 6 F over Scenarios III is similar to I, but with a warming of 6 F rather than 2 F.
47 Scenarios III and IV III. IV. Gradual warming to historical maximum One-time increase to historical maximum Scenarios III and IV are also similar to I and II, but use the historical max CDDs as the target level for 2025.
48 NEMS Results Running the NEMS Residential, Commercial and Industrial modules with the standard assumptions results in an increase in cooling demand. Other variables remain largely unchanged. Recall that these are first order effects of Summer warming only.
49 NEMS Results Cooling Demand Electricity Response to Gradual 2 F Increase Scenario I % Increase over Baseline 60% 50% 40% 30% 20% 10% 0% Space Cooling Residential Commercial Electricity Response to One-time 2 F Increase Scenario II % Increase over Baseline 60% 50% 40% 30% 20% 10% 0% Space Cooling Residential Commercial
50 NEMS Results Cooling Demand Electricity Response: Increase to Max Historical Level Scenario III % Increase over Baseline 60% 50% 40% 30% 20% 10% 0% Space Cooling Residential Commercial Electricity Response: One-time Increase to Historical Max Scenario IV % Increase over Baseline 60% 50% 40% 30% 20% 10% 0% Space Cooling Residential Commercial
51 NEMS Results Cooling Demand Electricity Response to Gradual 6 F Increase Scenario V % Increase over Baseline 60% 50% 40% 30% 20% 10% 0% Space Cooling Residential Commercial Electricity Response to One-time 6 F Increase Scenario VI % Increase over Baseline 60% 50% 40% 30% 20% 10% 0% Space Cooling Residential Commercial
52 Warming Scenarios I. Gradual Warming of 2 F over II. One-time Increase of 2 F in 2005 III. Gradual Warming to Historical Maximum IV. One-time Increase to Historical Maximum V. Gradual Warming of 6 F over VI. One-time Increase of 6 F in 2005
Residential Demand Module
 Residential Demand Module The NEMS Residential Demand Module projects future residential sector energy requirements based on projections of the number of households and the stock, efficiency, and intensity
COMPARISON OF FIXED & VARIABLE RATES (25 YEARS) CHARTERED BANK ADMINISTERED INTEREST RATES - PRIME BUSINESS*
 CHARTERED BANK ADMINISTERED INTEREST RATES - PRIME BUSINESS*") COMPARISON OF FIXED & VARIABLE RATES (25 YEARS) 2 Fixed Rates Variable Rates FIXED RATES OF THE PAST 25 YEARS AVERAGE RESIDENTIAL MORTGAGE LENDING RATE - 5 YEAR* (Per cent) Year Jan Feb Mar Apr May Jun
COMPARISON OF FIXED & VARIABLE RATES (25 YEARS) 2 Fixed Rates Variable Rates FIXED RATES OF THE PAST 25 YEARS AVERAGE RESIDENTIAL MORTGAGE LENDING RATE - 5 YEAR* (Per cent) Year Jan Feb Mar Apr May Jun
The Central Role of Energy Efficiency in the Energy Outlook and EIA s Energy Data Program
 The Central Role of Energy Efficiency in the Energy Outlook and EIA s Energy Data Program For MIT Energy Initiative Symposium May 12, 2014 Cambridge, MA By Howard Gruenspecht, Deputy Administrator U.S.
Short-Term Energy Outlook Supplement: Summer 2013 Outlook for Residential Electric Bills
 Short-Term Energy Outlook Supplement: Summer 2013 Outlook for Residential Electric Bills June 2013 Independent Statistics & Analysis www.eia.gov U.S. Department of Energy Washington, DC 20585 This report
AT&T Global Network Client for Windows Product Support Matrix January 29, 2015
 AT&T Global Network Client for Windows Product Support Matrix January 29, 2015 Product Support Matrix Following is the Product Support Matrix for the AT&T Global Network Client. See the AT&T Global Network
APPENDIX 2. Summary Report: Heating and Cooling Energy Adjustment for HUD-52667 Spreadsheet Model
 APPENDIX 2 Summary Report: Heating and Cooling Energy Adjustment for HUD-52667 Spreadsheet Model Jason Glazer GARD Analytics, Inc. Prepared for the U.S. Department of Housing & Urban Development, Office
Fact Sheet. Better Buildings Initiative. Commercial Building Tax Credit March 4, 2011
 Better Buildings Initiative Commercial Building Tax Credit March 4, 2011 Current Situation Between now and 2014, $1.4 trillion in commercial real estate (CRE) loans are becoming due; half of these loans
Natural Gas: Winter 2012-13 Abundance! and Some Confusion
 Natural Gas: Winter 2012-13 Abundance! and Some Confusion NASEO Winter Fuels Outlook Washington, D.C. October 10, 2012 Bruce B. Henning Vice President, Energy Regulatory and Market Analysis BHenning@icfi.com
Realized and Prospective Impacts of U.S. Energy Efficiency Standards for Residential Appliances: 2004 Update
 LBNL-56417 Realized and Prospective Impacts of U.S. Energy Efficiency Standards for Residential Appliances: 2004 Update Stephen Meyers, James McMahon, Michael McNeil Environmental Energy Technologies Division
FINAL REPORT LIFE-CYCLE COST STUDY OF A GEOTHERMAL HEAT PUMP SYSTEM BIA OFFICE BLDG., WINNEBAGO, NE
 FINAL REPORT LIFE-CYCLE COST STUDY OF A GEOTHERMAL HEAT PUMP SYSTEM BIA OFFICE BLDG., WINNEBAGO, NE February 2006 FINAL REPORT LIFE-CYCLE COST STUDY OF A GEOTHERMAL HEAT PUMP SYSTEM BIA OFFICE BLDG., WINNEBAGO,
Economic Evaluation of Residential Air Conditioner Designs for Hot and Dry Climates
 Economic Evaluation of Residential Air Conditioner Designs for Hot and Dry Climates Arthur Rosenfeld, California Energy Commission Gregory Rosenquist, Lawrence Berkeley National Laboratory C. Keith Rice,
Natural Gas / Electricity and the Industrial Sector. The Dismantling of US Manufacturing
 Natural Gas / Electricity and the Industrial Sector The Dismantling of US Manufacturing Paul Cicio President Industrial Energy Consumers of America August, 2007 Who Are Energy Price Sensitive Industries?
2015 RACE TO ZERO STUDENT DESIGN COMPETITION
 2015 RACE TO ZERO STUDENT DESIGN COMPETITION Team Members / Industrial Partners A. TEAM and INDUSTRY PARTNERSHIPS B C D E F G H I A. TEAM B C D E F G H I J A C D E F G H I J B. DESIGN GOALS Project Site
Alternatives for the Residential Energy Consumption Baseline
 Alternatives for the Residential Energy Consumption Baseline Executive Summary. Should the baseline for energy consumption in the Northeast Neighborhoods development area be changed from the current citywide
Presentation to the Staff Subcommittee on Gas 2010 NARUC Winter Committee Meetings Washington, D.C. February 14, 2010
 Presentation to the Staff Subcommittee on Gas 2010 NARUC Winter Committee Meetings Washington, D.C. February 14, 2010 CenterPoint Energy, Inc. promotes the direct use of natural gas through energy efficiency
DISCUSSION PAPER. Policies to Encourage Home Energy Efficiency Improvements. Comparing Loans, Subsidies, and Standards. M a r g a r e t W a l l s
 DISCUSSION PAPER December 2012 RFF DP 12-47 Policies to Encourage Home Energy Efficiency Improvements Comparing Loans, Subsidies, and Standards M a r g a r e t W a l l s 1616 P St. NW Washington, DC 20036
The Unconventional Energy Revolution: Estimated Energy Savings for Public School Districts and State and Local Governments
 The Unconventional Energy Revolution: Estimated Energy Savings for Public School Districts and State and Local Governments Prepared for: American Petroleum Institute Prepared by: IHS Global Inc. 1150 Connecticut
Integrating Energy Efficiency into Utility Load Forecasts. Introduction: A LEED Gold Building s Effect on Utility Load
 Integrating Energy Efficiency into Utility Load Forecasts Shawn Enterline, Vermont Energy Investment Corporation Eric Fox, Itron Inc. ABSTRACT Efficiency Vermont s efficiency programs are being integrated
Electric Power Monthly with Data for October 2015
 Electric Power Monthly with Data for October 2015 December 2015 This report was prepared by the U.S. Energy Information Administration (EIA), the statistical and analytical agency within the U.S. Department
Connecticut Energy Efficiency Fund Home Performance Program Application (Tier II)
") 9111 05-10 Connecticut Energy Efficiency Fund Home Performance Program Application (Tier II) This application is for energy efficiency retrofit proposals for existing residential unit(s). The application
9111 05-10 Connecticut Energy Efficiency Fund Home Performance Program Application (Tier II) This application is for energy efficiency retrofit proposals for existing residential unit(s). The application
Methodology For Illinois Electric Customers and Sales Forecasts: 2016-2025
 Methodology For Illinois Electric Customers and Sales Forecasts: 2016-2025 In December 2014, an electric rate case was finalized in MEC s Illinois service territory. As a result of the implementation of
VELCO LONG-TERM ENERGY AND DEMAND FORECAST FORECAST DRIVERS AND ASSUMPTIONS. May 22, 2014 Eric Fox and Oleg Moskatov
 VELCO LONG-TERM ENERGY AND DEMAND FORECAST FORECAST DRIVERS AND ASSUMPTIONS May 22, 2014 Eric Fox and Oleg Moskatov AGENDA» Review customer and system usage trends in Vermont» Review and discuss the forecast
The Effect of Natural Gas Supply on Retail Electricity Prices
 Date Issue Brief # I S S U E B R I E F The Effect of Natural Gas Supply on Retail Electricity Prices Karen Palmer, Dallas Burtraw, Matt Woerman, and Blair Beasley August 2012 Issue Brief 12-05 Resources
Comparing Fuel Costs of Heating and Cooling Systems
 Comparing Fuel Costs of Heating and Cooling Systems June 2003 Introduction One of the most common questions posed to energy specialists at Engineering Extension asks for a comparison between costs to operate
AOBA Utility Committee
 AOBA Utility Committee Energy Markets in Tailspin Major Economic Recession Continues to Pull Energy Prices Downward Where Will It End? Presented By Bruce R. Oliver President, Revilo Hill Associates, Inc.
The Economic Impacts of Reducing. Natural Gas and Electricity Use in Ontario
 The Economic Impacts of Reducing Natural Gas and Electricity Use in Ontario Prepared for Blue Green Canada July 2013 Table of Contents Executive Summary... i Key Findings... i Introduction...1 Secondary
NATURAL GAS IN COMMERCIAL BUILDINGS
 OCTOBER 2012 TECHNOLOGY NATURAL GAS IN COMMERCIAL BUILDINGS Discussion Questions: 1. If natural gas promises lower operating costs, lower emissions, and greater efficiency over utility grid delivered electricity,
NORTH CAROLINA INCENTIVES
 NORTH CAROLINA INCENTIVES Name: Asheville - Building Permit Fee Waiver Type: Green Building Incentive, Builder Technologies eligible: Energy Star Rating, Healthy Built Home Certification, LEED Certification,
Enhanced Vessel Traffic Management System Booking Slots Available and Vessels Booked per Day From 12-JAN-2016 To 30-JUN-2017
 From -JAN- To -JUN- -JAN- VIRP Page Period Period Period -JAN- 8 -JAN- 8 9 -JAN- 8 8 -JAN- -JAN- -JAN- 8-JAN- 9-JAN- -JAN- -JAN- -JAN- -JAN- -JAN- -JAN- -JAN- -JAN- 8-JAN- 9-JAN- -JAN- -JAN- -FEB- : days
3. Factors Affecting Energy Intensity
 13 3. Factors Affecting Energy Intensity A large body of literature addresses the measurement of energy efficiency and energy intensity. 1 In this chapter, we discuss various factors related to measuring
Electric Power Monthly with Data for May 2015
 Electric Power Monthly with Data for May 2015 July 2015 Independent Statistics & Analysis www.eia.gov U.S. Department of Energy Washington, DC 20585 This report was prepared by the U.S. Energy Information
Heating & Cooling Efficiency
 Heating & Cooling Efficiency Advantages of Geothermal HVAC Efficiency Keith Swilley Gulf Power Company Why Gulf Power Promotes Energy Efficiency? Customer Satisfaction Education Help Customers Make Smart
IEA-IEF-OPEC Outlook Comparison
 IEA-IEF-OPEC Outlook Comparison Richard Newell, Director, Duke University Energy Initiative Gendell Professor of Energy and Environmental Economics, Nicholas School of the Environment Sixth IEA-IEF-OPEC
St. Louis Residential Energy Efficiency Loan Program Market Assessment
 St. Louis Residential Energy Efficiency Loan Program Market Assessment MAY 2011 Prepared by the Environmental Finance Center for Abundant Power and St. Louis County AUTHOR: CHRISTINE E. BOYLE ABOUT THE
Driving Action through. Title Style. Moderated by: Sarah Zaleski U.S. DOE
 Driving Action through Click Energy To Data Edit Visualization Master Title Style Moderated by: Sarah Zaleski U.S. DOE Driving Action through Energy Data Visualization Dan Walworth HEI Hotels HEI Hotels
Improving comfort and energy efficiency in a nursery school design process S. Ferrari, G. Masera, D. Dell Oro
 Improving comfort and energy efficiency in a nursery school design process S. Ferrari, G. Masera, D. Dell Oro Dept. Building Environment Science &Technologies Politecnico di Milano Italy Research funded
For. The Conservation Bureau Ontario Power Authority
 Assessment of Proposed Changes to the Ontario Building Code to Increase the Energy Efficiency of New Low & High Rise Buildings: Cost/Benefit to Meet and Exceed OBC in the Affordable Housing Sector For
Codes and High Performance Hot Water Systems. Gary Klein Affiliated International Management, LLC 916 549 7080 gary@aim4sustainability.
 Codes and High Performance Hot Water Systems Gary Klein Affiliated International Management, LLC 916 549 7080 gary@aim4sustainability.com Annual Energy Use for Heating Water Natural Gas Gallons Per Day
Benchmarking Residential Energy Use
 Benchmarking Residential Energy Use Michael MacDonald, Oak Ridge National Laboratory Sherry Livengood, Oak Ridge National Laboratory ABSTRACT Interest in rating the real-life energy performance of buildings
Fuel and Energy Conversion and Equivalence Chart
 Fuel and Energy Conversion and Equivalence Chart Please note, the fuel economy estimates within this document are examples only. Maine Public Service does not consult with customers regarding fuel source
Technical Note. Consumer Confidence Survey Technical Note February 2011. Introduction and Background
 Technical Note Introduction and Background Consumer Confidence Index (CCI) is a barometer of the health of the U.S. economy from the perspective of the consumer. The index is based on consumers perceptions
Analysis One Code Desc. Transaction Amount. Fiscal Period
 Analysis One Code Desc Transaction Amount Fiscal Period 57.63 Oct-12 12.13 Oct-12-38.90 Oct-12-773.00 Oct-12-800.00 Oct-12-187.00 Oct-12-82.00 Oct-12-82.00 Oct-12-110.00 Oct-12-1115.25 Oct-12-71.00 Oct-12-41.00
Mississippi. Energy and Cost Savings. for New Single and Multifamily Homes: 2009 and 2012 IECC as Compared to the 2006 IECC
 BUILDING TECHNOLOGIES PROGRAM Mississippi Energy and Cost Savings for New Single and Multifamily Homes: 2009 and 2012 IECC as Compared to the 2006 IECC 1 2009 AND 2012 IECC AS COMPARED TO THE 2006 IECC
Case 2:08-cv-02463-ABC-E Document 1-4 Filed 04/15/2008 Page 1 of 138. Exhibit 8
 Case 2:08-cv-02463-ABC-E Document 1-4 Filed 04/15/2008 Page 1 of 138 Exhibit 8 Case 2:08-cv-02463-ABC-E Document 1-4 Filed 04/15/2008 Page 2 of 138 Domain Name: CELLULARVERISON.COM Updated Date: 12-dec-2007
Energy Efficiency for the Homeowner
 Efficiency for the Homeowner How to Reduce Your Home s Bills October 2009 National Mall Washington, DC A Quick Test Using Efficient Products and Practices Can: A. Make your home more affordable B. Make
Heat Pumps: An Untapped Resource For Energy Savings Programs. Regional and State-Level Economic Analysis of Heating Applications
 Heat Pumps: An Untapped Resource For Energy Savings Programs Regional and State-Level Economic Analysis of Heating Applications INTRODUCTION Consumers and policymakers alike are concerned about the rising
Energy Trends Report
 Energy Trends Report July 27 State Utility Forecasting Group Energy Center at Discovery Park Purdue University Introduction This report illustrates a number of trends occurring in the energy industries,
New Technologies New Savings. Water Heater Market Profile 2009. U.S. Department of Energy
 New Technologies New Savings Water Heater Market Profile 2009 U.S. Department of Energy Table of Contents Executive Summary 1 Installed Base 2 Water Heater Market 4 Annual Shipments 4 Manufacture and Distribution
Energy Analysis for Internal and External Window Film Applications for Existing Homes in Florida
 Energy & Environmental Solutions Energy Analysis for Internal and External Window Film Applications for Existing Homes in Florida PREPARED FOR: INTERNATIONAL WINDOW FILM ASSOCIATION P.O. BOX 3871 MARTINSVILLE,
RBSA/Seattle Multi-family Characterization
 RBSA/Seattle Multi-family Characterization Data not Dogma David Baylon, Ecotope Inc. 1 NORTHWEST ENERGY EFFICIENCY ALLIANCE RBSA Goal Provide regional organizations and utilities with baseline information
GUIDE TO NET ENERGY METERING. www.heco.com
 GUIDE TO NET ENERGY METERING www.heco.com Welcome to Net Energy Metering As a Net Energy Metering (NEM) customer, you are helping Hawaii reach its clean energy goals. Your photovoltaic (PV) system should
THE ROOFPOINT ENERGY AND CARBON CALCULATOR A NEW MODELING TOOL FOR ROOFING PROFESSIONALS
 THE ROOFPOINT ENERGY AND CARBON CALCULATOR A NEW MODELING TOOL FOR ROOFING PROFESSIONALS James L. Hoff, VP of Research Center for Environmental Innovation in Roofing Tools and Models Tools require models
Colorado Energy and Cost Savings
 BUILDING TECHNOLOGIES PROGRAM Colorado Energy and Cost Savings for New Single and Multifamily Homes: 2009 and 2012 IECC as Compared to the 2006 IECC 1 2009 AND 2012 IECC AS COMPARED TO THE 2006 IECC Colorado
AN OVERVIEW OF KENTUCKY S ENERGY CONSUMPTION AND ENERGY EFFICIENCY POTENTIAL
 AN OVERVIEW OF KENTUCKY S ENERGY CONSUMPTION AND ENERGY EFFICIENCY POTENTIAL KENTUCKY POLLUTION PREVENTION CENTER UNIVERSITY OF LOUISVILLE AMERICAN COUNCIL FOR AN ENERGY-EFFICIENT ECONOMY Prepared for:
Smart Ideas(R) Energy Efficiency Program for ComEd Customers
 Energy Efficiency Program for ComEd Customers") October 2015 CUBFacts Smart Ideas(R) Energy Efficiency Program for ComEd Customers **New Appliance and Smart Thermostat Rebates Available!** Discounts on Energy Efficient Lighting You can receive instant
October 2015 CUBFacts Smart Ideas(R) Energy Efficiency Program for ComEd Customers **New Appliance and Smart Thermostat Rebates Available!** Discounts on Energy Efficient Lighting You can receive instant
Idaho Energy and Cost Savings
 BUILDING TECHNOLOGIES PROGRAM Idaho Energy and Cost Savings for New Single and Multifamily Homes: 2012 IECC as Compared to the 2009 IECC 1 2012 IECC AS COMPARED TO THE 2009 IECC Idaho Energy and Cost Savings
Solar Decathlon Load Profiling. Project Report
 Solar Decathlon Load Profiling Project Report Prepared by Alexander Kon Alexander Hobby Janice Pang Mahan Soltanzadeh Prepared for TTP 289: A Path to Zero Net Energy 6/10/14 Executive Summary The U.S.
Regional heat pump energy loads. Ian Page Manager Economics. Lisa French Building Energy Scientist
 E528 Regional heat pump energy loads Author: Ian Page Manager Economics Reviewer: Lisa French Building Energy Scientist Contact: BRANZ Limited Moonshine Road Judgeford Private Bag 598 Porirua City New
Hybrid (Dual Fuel) - Gas Heat and Air Source Heat Pump
 - Gas Heat and Air Source Heat Pump") s.doty 10-2014 White Paper #30 Hybrid (Dual Fuel) - Gas Heat and Air Source Heat Pump System Switches Fuels Automatically for Economy. What is an Air-Source Heat Pump? A heat pump is a modified air conditioning
s.doty 10-2014 White Paper #30 Hybrid (Dual Fuel) - Gas Heat and Air Source Heat Pump System Switches Fuels Automatically for Economy. What is an Air-Source Heat Pump? A heat pump is a modified air conditioning
The Potential for Energy Retrofits within the City of Sacramento s Rental Housing Inspection Program
 PNNL-20343 Prepared for the U.S. Department of Energy under Contract DE-AC05-76RL01830 The Potential for Energy Retrofits within the City of Sacramento s Rental Housing Inspection Program MM Iverson S
Tennessee. Energy and Cost Savings. for New Single and Multifamily Homes: 2009 and 2012 IECC as Compared to the 2006 IECC
 BUILDING TECHNOLOGIES PROGRAM Tennessee Energy and Cost Savings for New Single and Multifamily Homes: 2009 and 2012 IECC as Compared to the 2006 IECC 1 2009 AND 2012 IECC AS COMPARED TO THE 2006 IECC Tennessee
ENERGY AUDITS (OR SURVEYS) & ENERGY MANAGEMENT PROGRAMS SECTION B
 & ENERGY MANAGEMENT PROGRAMS SECTION B") ENERGY AUDITS (OR SURVEYS) & ENERGY MANAGEMENT PROGRAMS SECTION B GOALS OF THE ENERGY AUDIT Clearly identify types and costs of energy use Understand how energy is being used--and possibly wasted Identify
ENERGY AUDITS (OR SURVEYS) & ENERGY MANAGEMENT PROGRAMS SECTION B GOALS OF THE ENERGY AUDIT Clearly identify types and costs of energy use Understand how energy is being used--and possibly wasted Identify
Market Potential Study for Water Heater Demand Management
 Market Potential Study for Water Heater Demand Management Rebecca Farrell Troutfetter, Frontier Associates LLC, Austin, TX INTRODUCTION Water heating represents between 13 and 17 percent of residential
Department of Water and Power City of Los Angeles PROPOSED RATE RESTRUCTURING
 Department of Water and Power City of Los Angeles PROPOSED RATE RESTRUCTURING 1 RATE RESTRUCTURING OBJECTIVES Provide accurate price signals that give customers an incentive to use electricity in an efficient
Energy and Cost Savings
 BUILDING TECHNOLOGIES PROGRAM Rhode Island Energy and Cost Savings for New Single- and Multifamily Homes: 2012 IECC as Compared to the 2009 IECC 1 2012 IECC AS COMPARED TO THE 2009 IECC Rhode Island Energy
Indiana Energy and Cost Savings
 BUILDING TECHNOLOGIES PROGRAM Indiana Energy and Cost Savings for New Single and Multifamily Homes: 2012 IECC as Compared to the 2009 IECC 1 2012 IECC AS COMPARED TO THE 2009 IECC Indiana Energy and Cost
GEOTHERMAL HEAT PUMP SYSTEMS ARE RED HOT BUT ARE THEY REALLY GREEN?
 GEOTHERMAL HEAT PUMP SYSTEMS ARE RED HOT BUT ARE THEY REALLY GREEN? Richard C. Niess 1 Gilbert & Associates / Apogee Interactive, Inc., Gloucester Point, Virginia 23062 Phone & Fax (804) 642 0400 ABSTRACT
Energy Efficiency: Integrated Design and HVAC Systems HEALTHCARE - TOP 5 GREEN BUILDING STRATEGIES
 EPA Publication 909-F-07-001 What? Energy use in healthcare facilities is higher than nearly all other building types. With rising energy costs and climate change concerns energy efficiency is financially
INNOVATION. PERFORMANCE. SAVINGS. ENERGY STAR Makes It Simple. ROOM AIR CONDITIONERS 2007 PARTNER RESOURCE GUIDE
 INNOVATION. PERFORMANCE. SAVINGS. ENERGY STAR Makes It Simple. ROOM AIR CONDITIONERS 2007 PARTNER RESOURCE GUIDE SECTION I : CONSUMER INFORMATION ENERGY STAR is a government-backed program that helps consumers
Sonoma County Economic Development Board BUSINESS BAROMETER
 BUSINESS BAROMETER September 2006 In This Month s Report: Newly revised employment data shows that Sonoma County added 3,000 jobs in the 12-month period ending July 2006. The seasonally adjusted unemployment
2013 Energy Savings Results for the Commercial Real Estate Cohorts
 April 28, 2014 REPORT #E14-281 2013 Energy Results for the Commercial Real Estate Cohorts Prepared by: Cadmus 720 SW Washington St. Portland, OR 97205 Northwest Energy Efficiency Alliance PHONE 503-688-5400
The main steam enters the building in the basement mechanical room; this is where the condensate line also leaves the building.
 MSV: Square Footage: 24,844 No. of Floors: 1 Year Built: 1963 Type of Use: Lounge and dining area open all night for snacks Steam Water-cooled condenser, 50-Ton York unit with a 6 cylinder-reciprocating
Comparing Electricity Generation Technologies
 Comparing Electricity Generation Technologies Stan Rosinski Program Manager, Renewable Generation 2011 SRP Sustainable Portfolio Review March 3, 2011 Comparing Electricity Generation Technologies Key Takeaways
Electric Power Annual 2013
 Electric Power Annual 2013 March 2015 Independent Statistics & Analysis www.eia.gov U.S. Department of Energy Washington, DC 20585 This report was prepared by the U.S. Energy Information Administration
Weather Effects on Electricity Loads: Modeling and Forecasting 12 December 2005
 Weather Effects on Electricity Loads: Modeling and Forecasting 12 December 2005 Christian Crowley and Frederick L. Joutz Research Program on Forecasting Department of Economics The George Washington University
Electric Power Annual 2014
 Electric Power Annual 2014 February 2016 Independent Statistics & Analysis www.eia.gov U.S. Department of Energy Washington, DC 20585 This report was prepared by the U.S. Energy Information Administration
Home Energy Evaluation Report
 Home Energy Evaluation Report Nate Begeman, 1550 Saint Francis Dr San Jose, CA 95125 Air Infiltration Current Air Leakage 2,852 Current Air Changes Per Hour 0.91 Recommended Air Changes Per Hour 0.35 Percent
Solar Energy Feasibility Study
 Remote Power Inc. 981 Gold Mine Trail Fairbanks, AK 99712 Solar Energy Feasibility Study For a Typical On-Grid Residence in Fairbanks, AK Bruno Grunau, P.E. Greg Egan 05 November 2008 1 Abstract: Solar
Electric Market National Overview
 Electric Market Overview Electric Market National Overview 1122 Electric Market Overview: Generation Output and Temperatures Page 2 of 8 Weekly U.S. Electric Generation Output and Temperatures Electric
RESEARCH HIGHLIGHT. The Impact of Heat Pump Water Heaters on Whole-House Energy Consumption
 RESEARCH HIGHLIGHT December 2014 Technical Series 14-104 The Impact of Heat Pump Water Heaters on Whole-House Energy Consumption INTRODUCTION Heat pump water heaters are one of the most energyefficient
Yield Reduction due to Shading:
 1x4 1x16 10 x CBC Energy A/S x Danfoss Solar Inverters CBC-40W Poly 40 W TLX 1,5k 5 ; 1x11 3x4 0 1,5kW 1536 x CBC Energy A/S 1 x Power-One CBC-40W Poly 40 W TRIO-7,6-TL-OUTD 30 ; 4x14 0 7,6kW Location:
HIGH LEVEL BUSINESS CASE FOR AN EEMS SYSTEM
 HIGH LEVEL BUSINESS CASE FOR AN EEMS SYSTEM Christine Dennehy, Project Manager Todd Isherwood, Energy Manager Joseph LaRusso, Finance Manager City of Boston Bill Kosik Munther Salim Hewlett-Packard August
CONNECTICUT ENERGY PRICE REPORT
 CONNECTICUT ENERGY PRICE REPORT 1/15/2015 DENOTES FALLING PRICES COMPARED TO YEAR EARLIER DENOTES FLAT PRICES COMPARED TO YEAR EARLIER DENOTES RISING PRICES COMPARED TO YEAR EARLIER CONNECTICUT RETAIL
Energy Efficiency. Energy Efficient Water Heating: Purchasing a new electric water heater. Hot water use has a significant impact on your bill.
 Energy Efficiency Energy Efficient Water Heating: Purchasing a new electric water heater. Water heating accounts for about 18 percent of your home energy bill. Only space heating and cooling account for
ENERGY STAR for Data Centers
 ENERGY STAR for Data Centers Alexandra Sullivan US EPA, ENERGY STAR February 4, 2010 Agenda ENERGY STAR Buildings Overview Energy Performance Ratings Portfolio Manager Data Center Initiative Objective
Understanding what is happening to electricity demand
 Understanding what is happening to electricity demand Hugh Saddler Centre for Climate Economics and Policy Seminar Crawford School, ANU 26 August 2015 TWh TWh Changes in sent out electricity since 2006
BEFORE THE FLORIDA PUBLIC SERVICE COMMISSION DIRECT TESTIMONY OF CAROLYN BERMUDEZ ON BEHALF OF FLORIDA CITY GAS DOCKET NO. 110004-GU MAY 3,201 1
 BEFORE THE FLORIDA PUBLIC SERVICE COMMISSION DIRECT TESTIMONY OF CAROLYN BERMUDEZ ON BEHALF OF A 5 6 FLORIDA CITY GAS MAY 3,201 1 7 8 9 Q. Please state your name, business address, by whom you are employed,
Transforming America s Energy Future. Kentucky. Energy Statistics. Developed by
 Transforming America s Energy Future Kentucky Energy Statistics Developed by 2 2 Summary The first edition of Kentucky Energy Statistics is offered by the National Association for State Energy Officials
Daikin Altherma Hybrid Heat Pump
 your comfort. our world. Daikin Altherma Hybrid Heat Pump The natural combination Heating Integrated Solutions Ventilation Air Conditioning Refrigeration About Daikin Forward thinking... Daikin has a worldwide
Geothermal Energy. How it Works
 Geothermal Energy The Ocean Pines Association Board of Directors asked the OPA Environment and Natural Assets Advisory Committee (ENAAC) to provide information about how geothermal energy could be useful
Economic and Rate Impact Analysis of Clean Energy Development in North Carolina 2015 Update
 February 2015 Economic and Rate Impact Analysis of Clean Energy Development in North Carolina 2015 Update Prepared for North Carolina Sustainable Energy Association 4800 Six Forks Rd Suite 300 Raleigh,
This version is dated: March 2011
 This version is dated: March 2011 DISCLAIMER This document was designed for the internal use of the United States Department of Energy. This document will be occasionally updated and, therefore, this copy
PETROLEUM WATCH September 16, 2011 Fossil Fuels Office Fuels and Transportation Division California Energy Commission
 PETROLEUM WATCH September 16, 2011 Fossil Fuels Office Fuels and Transportation Division California Energy Commission Summary As of September 14, retail regular-grade gasoline prices in California increased
ENERGY STAR Central Air Conditioners & Air-Source Heat Pumps
 ENERGY STAR Central Air Conditioners & Air-Source Heat Pumps Draft 1 Version 5.0 Stakeholder Meeting May 05, 2014 Abigail Daken, U.S. EPA Agenda Welcome and Introductions ENERGY STAR Program Overview Overview
Georgia Energy and Cost Savings
 BUILDING TECHNOLOGIES PROGRAM Georgia Energy and Cost Savings for New Single and Multifamily Homes: 2012 IECC as Compared to the 2009 Georgia Energy Code 1 2012 IECC AS COMPARED TO THE 2009 GEORGIA ENERGY
CHAPTER 10: APPLIANCES AND LIGHTING
 Chapter 10: Appliances and Lighting 151 CHAPTER 10: APPLIANCES AND LIGHTING According to the U.S. Environmental Protection Agency, appliances and home electronics account for 20% of energy bills in the
Energy Forecasting Methods
 Energy Forecasting Methods Presented by: Douglas J. Gotham State Utility Forecasting Group Energy Center Purdue University Presented to: Indiana Utility Regulatory Commission Indiana Office of the Utility
Ground Source Heat Pumps The Fundamentals. Southington, Connecticut 860 628 4622 John F. Sima III P.E.
 Ground Source Heat Pumps The Fundamentals Southington, Connecticut 860 628 4622 John F. Sima III P.E. Winter/Spring 2010 Ground Source Heat Pumps The Fundamentals TOPICS: Heat Pump Terminology Basic Physics
Energy Vision. Volume 2, Technical Document. Load Forecast
 Energy Vision 2020 5 Volume 2, Technical Document Load Forecast Volume 2, Technical Document 5 Load Forecast Contents This technical document has two major sections that were originally separate information