DIRECCION NACIONAL DEL ANTARTICO FIRST CLOUD-FREE LANDSAT TM IMAGE MOSAIC OF HIELO PATAGONICO SUR, SOUTHWESTERN PATAGONIA, SOUTH AMERICA
|
|
|
- Linette Barker
- 8 years ago
- Views:
Transcription
1 DIRECCION NACIONAL DEL ANTARTICO FIRST CLOUD-FREE LANDSAT TM IMAGE MOSAIC OF HIELO PATAGONICO SUR, SOUTHWESTERN PATAGONIA, SOUTH AMERICA Pedro Skvarca Hernán De Angelis CONTRIBUCION N 535 INSTITUTO ANTARTICO ARGENTINO Cerrito 1248 BUENOS AIRES 2003

2 First cloud-free Landsat TM image mosaic of Hielo Patagónico Sur, southwestern Patagonia, South America Pedro Skvarca and Hernán De Angelis ABSTRACT: A new mosaic of Hielo Patagónico Sur, an icefield of 13,000 km 2 in area located in the southwestern Patagonia, South America, is presented. The mosaic has been assembled with three scenes acquired by Landsat 5 satellite on 12 March An outstanding characteristic of this new mosaic is that shows for the first time since the initiation of Landsat missions almost 30 years ago the entire icefield of 372 km in length totally free of clouds. The TM image mosaic in Universal Transverse Mercator projection has been georeferenced to notable features in the field, mapped with differential GPS and tied to the argentine geodetic network. The mosaic was used to delineate the drainage area of the icefield contributing water to Río Santa Cruz basin. It was also used to monitor the variations of major outlet glaciers which calve into the fiords of Pacific and into freshwater Patagonian lakes. Finally, the comparison with Landsat TM mosaic of early 1986 allowed to quantify the retreat of glaciers with termini on land, directly related to climatic change. RESUMEN: Se presenta un nuevo mosaico del Hielo Patagónico Sur, el campo de hielo de km 2 de superficie ubicado en la Patagonia suroccidental, América del Sur. El mosaico ha sido confeccionado a partir de tres escenas tomadas por el satélite Landsat 5 el 12 de Marzo del La característica excepcional de este nuevo mosaico es mostrar por primera vez desde el inicio de las misiones Landsat hace casi 30 años todo el campo de hielo de 372 km de longitud totalmente libre de nubes. El mosaico de imágenes TM en proyección Universal Transversa Mercator ha sido georeferenciado a rasgos notorios de terreno mapeados con GPS diferencial, y vinculados a la red geodésica argentina. El mosaico fue usado para delinear el área de drenaje del campo de hielo que contribuye agua a la cuenca del Río Santa Cruz. También fue utilizado para monitorear las variaciones de los principales glaciares de descarga, que desprenden en los fiordos del Pacífico y en los lagos de agua dulce de la Patagonia. Finalmente, la comparación con el mosaico Landsat TM de inicios de 1986 permitió cuantificar el retroceso de los glaciares con término en tierra, vinculados directamente al cambio climático.... Contribución Científica del Instituto Antártico Argentino N 535

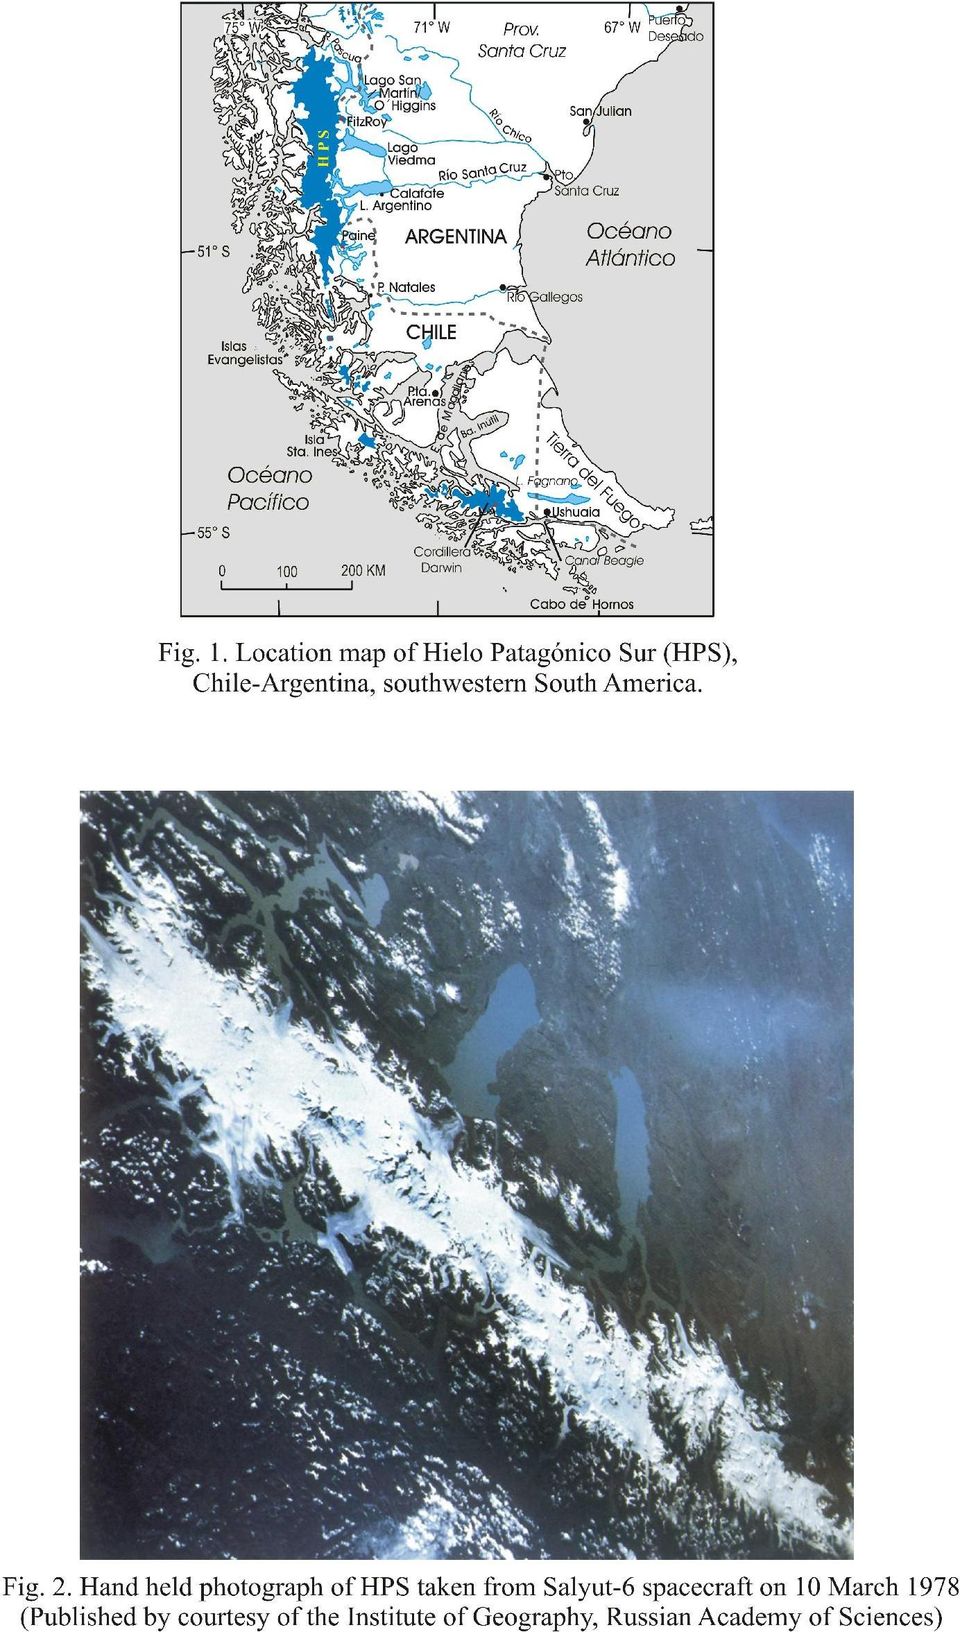
3 INTRODUCTION Campo de Hielo Patagónico Sur, usually called Hielo Patagónico Sur (HPS) is a classic icefield on our planet (Williams, 1986), located in southwestern Patagonia, South America (Fig. 1). With km 2 in area the HPS is by far the largest ice body within the Southern Hemisphere, excluding Antarctica. The icefield extends between Chile and Argentina for 372 km along the meridian west, from to south. Due to the very low precipitation rates in Patagonia, which range around 200 mm a -1, the HPS has an outstanding importance for the semiarid Patagonian regions as the major freshwater resource. The acquisition from space of optical images over HPS has been very much limited due to unusually frequent cloud cover over the icefield region which is affected by strong westerly winds. The first almost complete coverage of HPS without clouds was taken from Salyut-6 spacecraft on 10 March 1978 (Williams, 1987). Unfortunately this superb hand held photograph (Fig. 2) taken with Hasselblat camera by Soviet cosmonauts G.M. Grechko and Y.V. Romanenko was of limited use for glaciological purposes due to its obliqueness. Few early Landsat Multispectral Scanner (MSS) and Return Beam Vidicon (RBV) images of HPS of glaciological interest are listed in the chapter Glaciers of South America-Glaciers of Chile and Argentina (Lliboutry, 1998) of the Satellite Image Atlas of Glaciers of the World. Since the inception of Landsat satellite series to the present only two image mosaics covering the entire icefield could be assembled. The first one, hereafter called Landsat Thematic Mapper (TM) 1986 mosaic, was produced with images of 14 January 1986 (Naruse and Aniya, 1992). However, this mosaic presents some clouds over the central part of the icefield, in the region of Cordón Mariano Moreno and Glaciar Viedma. Since the launch of Earth Resource Technology Satellite (ERTS 1) or Landsat 1 in July 1972, for the first time the full extent of HPS without clouds could be covered by optical images on 12 March Almost 30 years have elapsed since the initiation of earth monitoring from space until a series of optical images could be acquired, showing the full extent of HPS including its outlet glaciers and contiguous glacier areas, free of clouds. This clearly demonstrates the difficulties in remote sensing of ice-covered regions with optical sensors. It is interesting to note that these unique cloud-free TM scenes were acquired only few months before the Landsat 5 was discontinued. Although the remote sensing with Synthetic Aperture Radars (SAR) on board of European Research Satellites (ERS) initiated in early 1990 s provided high resolution multitemporal images of HPS, the radar images are of limited use for

4 glaciological research due to the terrain distortion, because no digital elevation model (DEM) is available for the entire icefield. In this paper we present the first completely cloudless mosaic of Hielo Patagónico Sur assembled with Landsat TM optical images acquired on 12 March The three scenes used for the mosaic assembly are: Path 231/Row 94, Path 231/Row 95 and Path 231/Row 96. They were processed by the ground receiving station Estación Terrena Córdoba located in Córdoba, Argentina, of Comisión Nacional de Actividades Espaciales (CONAE). GEOREFERENCE AND MOSAICKING The Landsat TM 1986 mosaic has been assembled with two and a quarter scenes acquired on 14 January 1986 (Naruse and Aniya, 1992). The geometric correction of this mosaic was performed with an aid of Carta Preliminar de Chile at 1:250,000 scale published by Instituto Geográfico Militar of Chile, and is described in Aniya et al. (1996). The most recent mosaic, hereafter referred to as Landsat 2001 mosaic, was assembled with three images acquired on 12 March The false color composite of the 2001 mosaic results from combination of bands 3 ( µm), 2 ( µm) and 1 ( µm) (RGB). These band combination provides more realistic colors of snow-ice cover, rock outcrops, water and vegetation. All processes involved in production of Landsat 2001 mosaic were performed with GEOMATICA software on PC platform. To produce the mosaic it was necessary to create an empty image database. Its geometry and coordinates are in Universal Transverse Mercator (UTM) projection, zone 18 F, referred to WGS-84 ellipsoid. The UTM is an excellent projection for regions extending predominantly north-south (Snyder, 1987), therefore ideal for the north-south elongated HPS. The original georeference information contained in the header files of all three images, which could have made mosaicking a simple and straightforward process, could not be used because of severe coordinate blunders. Furthermore, the original raw images were projected on World Reference System 1980 (WRS-80) ellipsoid. For consistency reasons we have decided to resample all images on WGS-84 ellipsoid. This resampling does not introduce any geometric deformation because the WGS-84 ellipsoid is by definition of the same size as WRS-80 (Snyder, 1987). The TM images were georeferenced to characteristic and conspicuous features such as lake coastlines, islands and rivers, mapped in the field with kinematic differential Global
.")
5 Positioning System (GPS). As most GPS data were differentially processed a sub-meter accuracy was achieved. The GPS lines used for georeference of the mosaic are distributed unevenly at the central-eastern and northeastern parts of the icefield, i.e. in the vicinity of Upsala and Moreno glaciers and along the eastern shore of Lago San Martin/O Higgins. They are a result of field measurements carried out after the mid 1990 s in support of different projects. All GPS field surveys were tied to La Gerónima geodetic point, located nearby the southern arm of Lago Argentino (see Fig. 3). This point is part of the Argentine geodetic network known as Posiciones Geodésicas Argentinas 1994 (POSGAR 94, 1997), officially adopted by Instituto Geográfico Militar (IGM) of Argentina in Using these GPS data as ground control source the seven TM bands of each image were coregistered by applying a first order polynomial model and nearest-neighboring resampling method. This method was selected because introduces smaller distortions to information contained in pixel values. Due to the lack of GPS ground control lines the southernmost image (Path/Row 231/096) was tied to the mosaic by using more than 25 tie-points located on the overlap stripe. After completing the georeference and mosaicking an accuracy check was made by comparison to 1:100,000 quadrangle map series given in Transverse Mercator (Gauss Krüger) projection published by IGM of Argentina. A total of 15 points were selected on different topographic maps and their coordinates transformed to UTM projection, compared to those derived from Landsat 2001 mosaic. It was found after analysis that coordinates of features measured in the field with differential GPS differ on average about 150 m from those obtained from maps. As the coordinates measured in the field with differential GPS are very accurate it is assumed that the above discrepancy might be attributed to probable errors of topographic maps. In areas where GPS lines are not available the comparisons yield differences of up to 300 m. However, on average the errors are estimated in the order of 150 m, i.e. equivalent to about five pixels on TM image. Figure 3 shows the Landsat 2001 mosaic with superimposed drainage areas of 48 major HPS glaciers as determined from Landsat 1986 mosaic by Aniya et al. (1996). Only the names of the largest glaciers are written on the mosaic. The red line indicates the drainage area of HPS which contributes to the Río Santa Cruz basin. The section indicated with red dashed line corresponds to the ice divide in the flat region of the central high part of the icefield plateau named Meseta de los cuatro glaciares, as inferred by Skvarca et al. (1995).
.")
6
7 Figure 3. Landsat TM mosaic of Hielo Patagónico Sur assembled with images acquired 12 March 2001.

8 DISCUSSION AND RESULTS HPS and contiguous glacier drainage areas To calculate the icefield drainage area which contributes water through melting and calving to the Río Santa Cruz basin we have utilized basically the areas given in the HPS glacier inventory of Aniya et al. (1996). Only 9 of the 48 inventoried glaciers flow towards the east into Lago Viedma and Lago Argentino, which discharge through Río La Leona and Río Santa Cruz, respectively, into the Atlantic Ocean. According to Aniya et al. (1996), the drainage areas of these nine individual glaciers, excluding the exposed rock are: Glaciar Upsala (902 km 2 ), Glaciar Agassiz (50 km 2 ), Glaciar Onelli (84 km 2 ), Glaciar Spegazzini (137 km 2 ), Glaciar Mayo (45 km 2 ), Glaciar Ameghino (76 km 2 ), Glaciar Moreno (258 km 2 ) and Glaciar Frías (48 km 2 ). The nine glaciers yield a total area of 1600 km 2. For Glaciar Viedma, the second largest glacier of HPS we have adopted the area of 978 km 2, given in Skvarca et al. (1995). The criteria Aniya et al. (1996) used in their inventory was based on contiguity of glaciers to the icefield and the size of drainage basin. In their inventory were excluded small cirque, slope and valley glaciers which are disconnected to the icefield. However, these areas measured from the Landsat 2001 TM mosaic add another 599 km 2 of ice to the Santa Cruz river drainage basin. In conclusion, about 3177 km 2 of HPS and contiguous glaciers contribute to water discharge of Río Santa Cruz, as a result of melting and calving (Skvarca, 2002). The red line marked on Landsat 2001 mosaic, which extends from Lago del Desierto in the north to Glaciar Frías in the south, indicates the ice divide and watershed of Río Santa Cruz upper basin (Fig. 3). In the flat central region located in the northern part of HPS called Meseta de los cuatro glaciares the ice divide is only inferred and therefore indicated with dashed line, as defined by Skvarca et al. (1995). The definite ice divide between Viedma, Chico and O Higgins glaciers should be possible to determine with interferometry, coherence provided. In addition, the Landsat 2001 mosaic was used to monitor changes occurred in fifteen years of the major HPS outlet glaciers Pío XI, O Higgins, Viedma, Upsala and Moreno, in comparison to Landsat 1986 mosaic (Skvarca and De Angelis, 2002). Both Landsat TM image mosaics were also used to quantify the variations of 34 glaciers with termini on land distributed around the icefield, which respond directly to climate. A consistent and substantial decrease of 19.2 km 2 has been detected from 1986 to Of the thirty four monitored glaciers, thirty three have receded during the last 15 years (Skvarca and De Angelis, 2002).

9 CONCLUSIONS A mosaic, composed with three Landsat TM images acquired on 12 March 2001, has been assembled and georeferenced to selected features mapped in the field with GPS. The outstanding characteristic of this mosaic is that it shows for the first time, since the inception of Landsat missions in 1972, the full extent of Hielo Patagónico Sur without clouds. The Landsat 2001 mosaic provides and important information for glaciological studies of HPS related to detection of glacier variations and ice field extent by comparison to early Landsat images and Landsat 1986 mosaic. This mosaic was also used to define the drainage area of the icefield which contributes to Río Santa Cruz basin and to quantify for the first time variations of those HPS glaciers with termini on land. A consistent glacier retreat was detected between 1986 and 2001: of the thirty four land termini glaciers monitored around Hielo Patagónico Sur all but one have receded during the recent 15 year time interval. ACKNOWLEDGMENTS The authors would like to express their thanks to Comisión Nacional de Actividades Espaciales (CONAE), Argentina, for providing the Landsat TM scenes used to compile the mosaic. Thanks are also due to Sub-Prefectura Lago Argentino, Prefectura Naval Argentina, for their efficient logistic support. This work is a contribution to the Glaciological Research Project in Patagonia of Instituto Antártico Argentino-Dirección Nacional del Antártico. REFERENCES ANIYA, M., H. SATO, R. NARUSE, P. SKVARCA and G. CASASSA The use of satellite and airborne imagery to inventory outlet glaciers of the Southern Patagonia Icefield, South America. Photogrammetric Engineering & Remote Sensing. Vol. 62, Nº 12, NARUSE, R. and M. ANIYA Outline of Glacier Research Project in Patagonia, Bulletin of Glacier Research, 10,

10 LLIBOUTRY, L Glaciers of South America-Glaciers of Chile and Argentina. Satellite Image Atlas of Glaciers of the World. R. S. Williams, Jr. and J.G. Ferrigno, Eds. U.S. Geol. Survey Profess. Paper 1386-I, POSGAR SKVARCA, P., H. ROTT and M. STUEFER Synergy of ERS-1 SAR, X- SAR, Landsat TM imagery and aerial photography for glaciological studies of Viedma Glacier, Southern Patagonia. VII Simposio Latinoamericano de Percepción Remota, Puerto Vallarta, México, Nov. 5-10, Memorias SELPER, SKVARCA, P. and H. DE ANGELIS year changes of southern Patagonia icefield glacier, Argentina-Chile, detected from Landsat TM mosaics. Proceedings, 29th International Symposium on Remote Sensing of Environment (ISRSE-29), April 8-12, 2002, Buenos Aires, Argentina (on CD-ROM). SKVARCA P Importancia de los glaciares del Hielo Patagónico Sur para el desarrollo regional. In: M.J. Haller, Ed. Geología y Recursos Naturales de Santa Cruz. Relatorio del XV Congreso Geológico Argentino. El Calafate, V-1: Buenos Aires. SNYDER, J.P Map Projections-A Working Manual. U.S. Geological Survey Professional Paper 1395, pp WILLIAMS, R.S. Jr Glaciers and Glacial Landforms. In Short, N.M. and R.W. Blair, Jr. Eds, Geomorphology from space, A global overview of regional landforms. NASA SP-486, WILLIAMS, R.S. Jr Background to the Soviet glaciological studies from the Salyut-6 orbital station. Polar Geography and Geology, Vol. 11, No. 1, DIRECCION NACIONAL DEL ANTARTICO INSTITUTO ANTARTICO ARGENTINO Cerrito 1248, C1010AAZ Buenos Aires

National Glacier Strategy. Gonzalo BARCAZA DIRECCIÓN GENERAL DE AGUAS
 National Glacier Strategy Gonzalo BARCAZA DIRECCIÓN GENERAL DE AGUAS Overview Introduction National Glacier Strategy Observation Levels Glaciological Zones Progress Current studies In 2008, Ministry of
TerraColor White Paper
 TerraColor White Paper TerraColor is a simulated true color digital earth imagery product developed by Earthstar Geographics LLC. This product was built from imagery captured by the US Landsat 7 (ETM+)
5. GIS, Cartography and Visualization of Glacier Terrain
 5. GIS, Cartography and Visualization of Glacier Terrain 5.1. Garhwal Himalayan Glaciers 5.1.1. Introduction GIS is the computer system for capturing, storing, analyzing and visualization of spatial and
The Use of Satellite and Airborne Imagery to Inventory Outlet Glaciers of the Southern Patagonia Icefield, South America
 The Use of Satellite and Airborne Imagery to Inventory Outlet Glaciers of the Southern Patagonia Icefield, South America M. Aniya, H. Sato, R. Naruse, P. Skvarca, and G. Casassa Abstract A Landsat TM mosaic
Imagery. 1:50,000 Basemap Generation From Satellite. 1 Introduction. 2 Input Data
 1:50,000 Basemap Generation From Satellite Imagery Lisbeth Heuse, Product Engineer, Image Applications Dave Hawkins, Product Manager, Image Applications MacDonald Dettwiler, 3751 Shell Road, Richmond B.C.
The USGS Landsat Big Data Challenge
 The USGS Landsat Big Data Challenge Brian Sauer Engineering and Development USGS EROS bsauer@usgs.gov U.S. Department of the Interior U.S. Geological Survey USGS EROS and Landsat 2 Data Utility and Exploitation
Andrea Bondì, Irene D Urso, Matteo Ombrelli e Paolo Telaroli (Thetis S.p.A.) Luisa Sterponi e Cesar Urrutia (Spacedat S.r.l.) Water Calesso (Marco
 Luisa Sterponi e Cesar Urrutia (Spacedat S.r.l.) Water Calesso (Marco") Generation of a digital elevation model of the Wadi Lebda basin, Leptis Magna - Lybia Andrea Bondì, Irene D Urso, Matteo Ombrelli e Paolo Telaroli (Thetis S.p.A.) Luisa Sterponi e Cesar Urrutia (Spacedat
Generation of a digital elevation model of the Wadi Lebda basin, Leptis Magna - Lybia Andrea Bondì, Irene D Urso, Matteo Ombrelli e Paolo Telaroli (Thetis S.p.A.) Luisa Sterponi e Cesar Urrutia (Spacedat
Selecting the appropriate band combination for an RGB image using Landsat imagery
 Selecting the appropriate band combination for an RGB image using Landsat imagery Ned Horning Version: 1.0 Creation Date: 2004-01-01 Revision Date: 2004-01-01 License: This document is licensed under a
Information Contents of High Resolution Satellite Images
 Information Contents of High Resolution Satellite Images H. Topan, G. Büyüksalih Zonguldak Karelmas University K. Jacobsen University of Hannover, Germany Keywords: satellite images, mapping, resolution,
SAC-D/Aquarius. Progress in DCS. An Observatory for Ocean, Climate and Environment. SAC-D DCS IE Gustavo Mercado
 An Observatory for Ocean, Climate and Environment SAC-D/Aquarius Progress in DCS SAC-D DCS IE Gustavo Mercado 1 8th Aquarius SAC-D Science Meeting Buenos Aires November 12-14, 2013 401.55 Mhz Antenna DCP
CECS Glacier Research
 CECS Glacier Research Andrés Rivera and the CECs team Laboratorio de Glaciología y Cambio Climático Centro de Estudios Científicos (CECS), Valdivia Who we are? SENIOR RESEARCHERS Gino Casassa Andrés Rivera
APPLICATION OF GOOGLE EARTH FOR THE DEVELOPMENT OF BASE MAP IN THE CASE OF GISH ABBAY SEKELA, AMHARA STATE, ETHIOPIA
 APPLICATION OF GOOGLE EARTH FOR THE DEVELOPMENT OF BASE MAP IN THE CASE OF GISH ABBAY SEKELA, AMHARA STATE, ETHIOPIA Abineh Tilahun Department of Geography and environmental studies, Adigrat University,
A KNOWLEDGE-BASED APPROACH FOR REDUCING CLOUD AND SHADOW ABSTRACT
 A KNOWLEDGE-BASED APPROACH FOR REDUCING CLOUD AND SHADOW Mingjun Song, Graduate Research Assistant Daniel L. Civco, Director Laboratory for Earth Resources Information Systems Department of Natural Resources
Land Use/Land Cover Map of the Central Facility of ARM in the Southern Great Plains Site Using DOE s Multi-Spectral Thermal Imager Satellite Images
 Land Use/Land Cover Map of the Central Facility of ARM in the Southern Great Plains Site Using DOE s Multi-Spectral Thermal Imager Satellite Images S. E. Báez Cazull Pre-Service Teacher Program University
Earth Coordinates & Grid Coordinate Systems
 Earth Coordinates & Grid Coordinate Systems How do we model the earth? Datums Datums mathematically describe the surface of the Earth. Accounts for mean sea level, topography, and gravity models. Projections
Forest Service Southern Region Jess Clark & Kevin Megown USFS Remote Sensing Applications Center (RSAC)
") Hurricane Katrina Damage Assessment on Lands Managed by the Desoto National Forest using Multi-Temporal Landsat TM Imagery and High Resolution Aerial Photography Renee Jacokes-Mancini Forest Service Southern
Hurricane Katrina Damage Assessment on Lands Managed by the Desoto National Forest using Multi-Temporal Landsat TM Imagery and High Resolution Aerial Photography Renee Jacokes-Mancini Forest Service Southern
Introduction to GIS (Basics, Data, Analysis) & Case Studies. 13 th May 2004. Content. What is GIS?
 & Case Studies. 13 th May 2004. Content. What is GIS?") Introduction to GIS (Basics, Data, Analysis) & Case Studies 13 th May 2004 Content Introduction to GIS Data concepts Data input Analysis Applications selected examples What is GIS? Geographic Information
Introduction to GIS (Basics, Data, Analysis) & Case Studies 13 th May 2004 Content Introduction to GIS Data concepts Data input Analysis Applications selected examples What is GIS? Geographic Information
Determining the Antarctic Ice Sheet Grounding Line with Photoclinometry using LANDSAT Imagery and ICESat Laser Altimetry
 Determining the Antarctic Ice Sheet Grounding Line with Photoclinometry using LANDSAT Imagery and ICESat Laser Altimetry Jamika Baltrop, MyAsia Reid Mentor: Dr. Malcolm LeCompte 1704 Weeksville Road, Box
Landsat Monitoring our Earth s Condition for over 40 years
 Landsat Monitoring our Earth s Condition for over 40 years Thomas Cecere Land Remote Sensing Program USGS ISPRS:Earth Observing Data and Tools for Health Studies Arlington, VA August 28, 2013 U.S. Department
Digital Remote Sensing Data Processing Digital Remote Sensing Data Processing and Analysis: An Introduction and Analysis: An Introduction
 Digital Remote Sensing Data Processing Digital Remote Sensing Data Processing and Analysis: An Introduction and Analysis: An Introduction Content Remote sensing data Spatial, spectral, radiometric and
SMEX04 Land Use Classification Data
 Notice to Data Users: The documentation for this data set was provided solely by the Principal Investigator(s) and was not further developed, thoroughly reviewed, or edited by NSIDC. Thus, support for
COMPARISON OF TM-DERIVED GLACIER AREAS WITH HIGHER RESOLUTION DATA SETS
 COMPARISON OF TM-DERIVED GLACIER AREAS WITH HIGHER RESOLUTION DATA SETS F. Paul, C. Huggel, A. Kääb, T. Kellenberger, M.Maisch Department of Geography, University of Zurich, Winterthurerstr. 190, 8057
RESOLUTION MERGE OF 1:35.000 SCALE AERIAL PHOTOGRAPHS WITH LANDSAT 7 ETM IMAGERY
 RESOLUTION MERGE OF 1:35.000 SCALE AERIAL PHOTOGRAPHS WITH LANDSAT 7 ETM IMAGERY M. Erdogan, H.H. Maras, A. Yilmaz, Ö.T. Özerbil General Command of Mapping 06100 Dikimevi, Ankara, TURKEY - (mustafa.erdogan;
Review for Introduction to Remote Sensing: Science Concepts and Technology
 Review for Introduction to Remote Sensing: Science Concepts and Technology Ann Johnson Associate Director ann@baremt.com Funded by National Science Foundation Advanced Technological Education program [DUE
Focus Earth The Velingara Circular Structure A meteorite impact crater?
 Focus Earth The Velingara Circular Structure A meteorite impact crater? S. Wade Institut des Sciences de la Terre, Faculté des Sciences et Techniques, Université Cheikh Anta Diop, Dakar-Fann, Sénégal M.
Remote sensing is the collection of data without directly measuring the object it relies on the
 Chapter 8 Remote Sensing Chapter Overview Remote sensing is the collection of data without directly measuring the object it relies on the reflectance of natural or emitted electromagnetic radiation (EMR).
SAMPLE MIDTERM QUESTIONS
 Geography 309 Sample MidTerm Questions Page 1 SAMPLE MIDTERM QUESTIONS Textbook Questions Chapter 1 Questions 4, 5, 6, Chapter 2 Questions 4, 7, 10 Chapter 4 Questions 8, 9 Chapter 10 Questions 1, 4, 7
Resolutions of Remote Sensing
 Resolutions of Remote Sensing 1. Spatial (what area and how detailed) 2. Spectral (what colors bands) 3. Temporal (time of day/season/year) 4. Radiometric (color depth) Spatial Resolution describes how
Operational snow mapping by satellites
 Hydrological Aspects of Alpine and High Mountain Areas (Proceedings of the Exeter Symposium, Juiy 1982). IAHS Publ. no. 138. Operational snow mapping by satellites INTRODUCTION TOM ANDERSEN Norwegian Water
Remote Sensing Method in Implementing REDD+
 Remote Sensing Method in Implementing REDD+ FRIM-FFPRI Research on Development of Carbon Monitoring Methodology for REDD+ in Malaysia Remote Sensing Component Mohd Azahari Faidi, Hamdan Omar, Khali Aziz
MULTIPURPOSE USE OF ORTHOPHOTO MAPS FORMING BASIS TO DIGITAL CADASTRE DATA AND THE VISION OF THE GENERAL DIRECTORATE OF LAND REGISTRY AND CADASTRE
 MULTIPURPOSE USE OF ORTHOPHOTO MAPS FORMING BASIS TO DIGITAL CADASTRE DATA AND THE VISION OF THE GENERAL DIRECTORATE OF LAND REGISTRY AND CADASTRE E.ÖZER, H.TUNA, F.Ç.ACAR, B.ERKEK, S.BAKICI General Directorate
Monitoring and Evaluating Land Cover Change in The Duhok City, Kurdistan Region-Iraq, by Using Remote Sensing and GIS
 International Journal of Engineering Inventions ISSN: 2278-7461, ISBN: 2319-6491 Volume 1, Issue 11 (December2012) PP: 28-33 Monitoring and Evaluating Land Cover Change in The Duhok City, Kurdistan Region-Iraq,
Córdoba Ground Station CONAE - Argentina
 Córdoba Ground Station CONAE - Argentina Marcelo Colazo Estación Terrena Córdoba CONAE mcolazo@conae.gov.ar +54 3547 431018 http://www.conae.gov.ar CONAE Ground Station Overview of facilities and operations
Mapping of the Typhoon Haiyan Affected Areas in the Philippines Using Geospatial Data and Very High Resolution Satellite Images *
 UNITED NATIONS E/CONF.104/IP.15 ECONOMIC AND SOCIAL COUNCIL Twentieth United Nations Regional Cartographic Conference for Asia and the Pacific Jeju, 6-9 October 2015 Item 7(b) of the provisional agenda
Appendix B. Introduction to Landslide Evaluation Tools Mapping, Remote Sensing, and Monitoring of Landslides
 Appendix B. Introduction to Landslide Evaluation Tools Mapping, Remote Sensing, and Monitoring of Landslides 66 The Landslide Handbook A Guide to Understanding Landslides Part 1. Mapping Maps are a useful
An approach on the climate effects due to biomass burning aerosols
 ÓPTICA PURA Y APLICADA Vol. 37, núm. 3-2004 An approach on the climate effects due to biomass burning aerosols Un método sobre los efectos climáticos de los aerosoles por quema de biomasa Martín José Montero-Martínez
THE UPWARD SHIFT OF THE DRY SNOW LINE ON THE NORTHERN ANTARCTIC PENINSULA
 THE UPWARD SHIFT OF THE DRY SNOW LINE ON THE NORTHERN ANTARCTIC PENINSULA Frank Rau Department of Physical Geography, University of Freiburg, Werderring 4, D-79085 Freiburg, Germany Phone: +49-(0)761-2033550
Application of Remotely Sensed Data and Technology to Monitor Land Change in Massachusetts
 Application of Remotely Sensed Data and Technology to Monitor Land Change in Massachusetts Sam Blanchard, Nick Bumbarger, Joe Fortier, and Alina Taus Advisor: John Rogan Geography Department, Clark University
The New ImageDB Server Direct Access to Selected ERS SAR Data Products
 the new imagedb server The New ImageDB Server Direct Access to Selected ERS SAR Data Products S. D Elia Earth Remote Sensing Exploitation Division, ESA Directorate of Application Programmes, ESRIN, Frascati,
The Role of SPOT Satellite Images in Mapping Air Pollution Caused by Cement Factories
 The Role of SPOT Satellite Images in Mapping Air Pollution Caused by Cement Factories Dr. Farrag Ali FARRAG Assistant Prof. at Civil Engineering Dept. Faculty of Engineering Assiut University Assiut, Egypt.
LOCAL CORS Network Scene
 SIRGAS Operations and the Regional LOCAL CORS Network Scene Claudio Brunini President Laura Sánchez Vice President Sonia Maria Alves Costa SIRGAS-WGI: Reference System Tomas Marino Herrera SIRGAS-WGII:
Stage 4. Geography. Blackline Masters. By Karen Devine
 1 Devine Educational Consultancy Services Stage 4 Geography Blackline Masters By Karen Devine Updated January 2010 2 This book is intended for the exclusive use in NSW Secondary Schools. It is meant to
EO Information Services in support of West Africa Coastal vulnerability - Service Utility Review -
 EO Information Services in support of West Africa Coastal vulnerability - Service Utility Review - Christian Hoffmann, GeoVille World Bank HQ, Washington DC Date : 24 February 2012 Content - Project background
EcoInformatics International Inc.
 1 von 10 03.08.2010 14:25 EcoInformatics International Inc. Home Services - solutions Projects Concepts Tools Links Contact EXPLORING BEAVER HABITAT AND DISTRIBUTION WITH GOOGLE EARTH: THE LONGEST BEAVER
REMOTE SENSING AND ENVIRONMENTAL MONITORING. P. M. Mather School of Geography, The University of Nottingham, U.K.
 REMOTE SENSING AND ENVIRONMENTAL MONITORING P. M. Mather School of Geography, The University of Nottingham, U.K. Keywords: Earth observation, image processing, lidar, pattern recognition, radar Contents
TerraSAR X and TanDEM X satellite missions update & other activities Dana Floricioiu German Aerospace Center (DLR), Remote Sensing Technology
, Remote Sensing Technology") TerraSAR X and TanDEM X satellite missions update & other activities Dana Floricioiu German Aerospace Center (DLR), Remote Sensing Technology Institute, Oberpfaffenhofen, Germany PSTG 2 12 14 June 2012
TerraSAR X and TanDEM X satellite missions update & other activities Dana Floricioiu German Aerospace Center (DLR), Remote Sensing Technology Institute, Oberpfaffenhofen, Germany PSTG 2 12 14 June 2012
Remote Sensing and Land Use Classification: Supervised vs. Unsupervised Classification Glen Busch
 Remote Sensing and Land Use Classification: Supervised vs. Unsupervised Classification Glen Busch Introduction In this time of large-scale planning and land management on public lands, managers are increasingly
EO based glacier monitoring
 EO based glacier monitoring THEMES 1. WGMS & GLIMS within GTN G: strategic set up 2. GlobGlacier & Glaciers_cci: EO based products 3. LDCM & Sentinel 2: future monitoring perspectives Frank Paul* Department
The Map Grid of Australia 1994 A Simplified Computational Manual
 The Map Grid of Australia 1994 A Simplified Computational Manual The Map Grid of Australia 1994 A Simplified Computational Manual 'What's the good of Mercator's North Poles and Equators, Tropics, Zones
EMPLOYMENT OF GEOGRAPHIC INFORMATION SYSTEMS (GIS) IN ENVIRONMENTAL CRIMES
 IN ENVIRONMENTAL CRIMES") Bolivarian Republic of Venezuela Attorney General s Office Directorate General for the Assistance of the Criminal Investigation EMPLOYMENT OF GEOGRAPHIC INFORMATION SYSTEMS (GIS) IN ENVIRONMENTAL CRIMES
Bolivarian Republic of Venezuela Attorney General s Office Directorate General for the Assistance of the Criminal Investigation EMPLOYMENT OF GEOGRAPHIC INFORMATION SYSTEMS (GIS) IN ENVIRONMENTAL CRIMES
Monitoring a Changing Environment with Synthetic Aperture Radar. Alaska Satellite Facility National Park Service Don Atwood
 Monitoring a Changing Environment with Synthetic Aperture Radar Don Atwood Alaska Satellite Facility 1 Entering the SAR Age 2 SAR Satellites RADARSAT-1 Launched 1995 by CSA 5.6 cm (C-Band) HH Polarization
INTA AIRBORNE REMOTE SENSING FACILITY from the Hasselblad s cameras to the SensyTech-AHS sensor
 INTA AIRBORNE REMOTE SENSING FACILITY from the Hasselblad s cameras to the SensyTech-AHS sensor José-Antonio Gómez-Sánchez gomezsj@inta.es Remote Sensing Laboratory INSTITUTO NACIONAL DE TÉCNICA AEROESPACIAL
Introduction to Imagery and Raster Data in ArcGIS
 Esri International User Conference San Diego, California Technical Workshops July 25, 2012 Introduction to Imagery and Raster Data in ArcGIS Simon Woo slides Cody Benkelman - demos Overview of Presentation
Determination of Flood Extent Using Remote Sensing
 Determination of Flood Extent Using Remote Sensing A Term Paper Submitted to Dr. Benoit Rivard Professor Department of Earth and Atmospheric Science University of Alberta Source: Dartmouth Flood observatory
Description of field acquisition of LIDAR point clouds and photos. CyberMapping Lab UT-Dallas
 Description of field acquisition of LIDAR point clouds and photos CyberMapping Lab UT-Dallas Description of field acquisition of LIDAR point clouds and photos Objective: Introduce the basic steps that
China Earth Observation
 China High-resolution Earth Observation China Earth Observation System (CHEOS) and its Lastest Development The Earth Observation System and Data Center, CNSA 2014-2 Outlines 1 Introduction 2 The composition
Assessment Tasks Pass theory exams at > 70%. Meet, or exceed, outcome criteria for projects and assignments.
 CENTRAL OREGON COMMUNITY COLLEGE: GEOGRAPHIC INFORMATION SYSTEM PROGRAM 1 CENTRAL OREGON COMMUNITY COLLEGE Associate Degree Geographic Information Systems Program Outcome Guide (POG) Program Outcome Guide
Remote Sensing Satellite Information Sheets Geophysical Institute University of Alaska Fairbanks
 Remote Sensing Satellite Information Sheets Geophysical Institute University of Alaska Fairbanks ASTER Advanced Spaceborne Thermal Emission and Reflection Radiometer AVHRR Advanced Very High Resolution
Strategy for the wise use of peatlands of Tierra del Fuego, Argentina. Daniel E. Blanco, Wetlands International Argentina
 Strategy for the wise use of peatlands of Tierra del Fuego, Argentina Daniel E. Blanco, Wetlands International Argentina Peatlands distribution Peatlands: 270,000 ha Island area: 12.5% Eastern sector:
National Snow and Ice Data Center
 National Snow and Ice Data Center This data set (NSIDC-0484), part of the NASA Making Earth System Data Records for Use in Research Environments (MEaSUREs) Program, provides the first comprehensive, high-resolution,
High Resolution Information from Seven Years of ASTER Data
 High Resolution Information from Seven Years of ASTER Data Anna Colvin Michigan Technological University Department of Geological and Mining Engineering and Sciences Outline Part I ASTER mission Terra
Utah State General Records Retention Schedule SCHEDULE 1 GEOSPATIAL DATA SETS
 Utah State General Records Retention Schedule SCHEDULE 1 BIOTA RECORDS (Item 1-26) These are geospatial records that depict wildlife use areas in the state of Utah as determined by wildlife biologists
NASA Earth System Science: Structure and data centers
 SUPPLEMENT MATERIALS NASA Earth System Science: Structure and data centers NASA http://nasa.gov/ NASA Mission Directorates Aeronautics Research Exploration Systems Science http://nasascience.nasa.gov/
Flood Zone Investigation by using Satellite and Aerial Imagery
 Flood Zone Investigation by using Satellite and Aerial Imagery Younes Daneshbod Islamic Azad University-Arsanjan branch Daneshgah Boulevard, Islamid Azad University, Arsnjan, Iran Email: daneshbod@gmail.com
Opportunities for the generation of high resolution digital elevation models based on small format aerial photography
 Opportunities for the generation of high resolution digital elevation models based on small format aerial photography Boudewijn van Leeuwen 1, József Szatmári 1, Zalán Tobak 1, Csaba Németh 1, Gábor Hauberger
Rigorous Geodetic Point Positioning in Mexico
 Antonio HERNANDÉS-NAVARRO (Mexico) and Tomás SOLER (USA) Key words: GPS derived Datum; Mexico; OPUS; National Spatial Reference System. SUMMARY Thanks to the scientific cooperation between the General
Geospatial Information for disaster risk reduction and natural resources management. Rolando Ocampo Alcántar
 Geospatial Information for disaster risk reduction and natural resources management Rolando Ocampo Alcántar Content Background Geospatial Information for Disaster Management Risk Atlas Information Exchange
UTM: Universal Transverse Mercator Coordinate System
 Practical Cartographer s Reference #01 UTM: Universal Transverse Mercator Coordinate System 180 174w 168w 162w 156w 150w 144w 138w 132w 126w 120w 114w 108w 102w 96w 90w 84w 78w 72w 66w 60w 54w 48w 42w
SESSION 8: GEOGRAPHIC INFORMATION SYSTEMS AND MAP PROJECTIONS
 SESSION 8: GEOGRAPHIC INFORMATION SYSTEMS AND MAP PROJECTIONS KEY CONCEPTS: In this session we will look at: Geographic information systems and Map projections. Content that needs to be covered for examination
Advanced Image Management using the Mosaic Dataset
 Esri International User Conference San Diego, California Technical Workshops July 25, 2012 Advanced Image Management using the Mosaic Dataset Vinay Viswambharan, Mike Muller Agenda ArcGIS Image Management
Orbital-Scale Climate Change
 Orbital-Scale Climate Change Climate Needed for Ice Age Warm winter and non-frozen oceans so lots of evaporation and snowfall Cool summer so that ice does not melt Ice Age Model When ice growing ocean
Mapping Earth from Space Remote sensing and satellite images. Remote sensing developments from war
 Mapping Earth from Space Remote sensing and satellite images Geomatics includes all the following spatial technologies: a. Cartography "The art, science and technology of making maps" b. Geographic Information
DETECTING LANDUSE/LANDCOVER CHANGES ALONG THE RING ROAD IN PESHAWAR CITY USING SATELLITE REMOTE SENSING AND GIS TECHNIQUES
 ------------------------------------------------------------------------------------------------------------------------------- Full length Research Paper -------------------------------------------------------------------------------------------------------------------------------
GIS Data assessment for Region II of Chile Implications for international Water Resource Databases
 GIS Data assessment for Region II of Chile Implications for international Water Resource Databases GIS in Water Resources (CE 394K) Term Paper Benjamin Bass December 2 nd, 2011 Wikimedia Commons SITHA
3D Visualization of Seismic Activity Associated with the Nazca and South American Plate Subduction Zone (Along Southwestern Chile) Using RockWorks
 Using RockWorks") 3D Visualization of Seismic Activity Associated with the Nazca and South American Plate Subduction Zone (Along Southwestern Chile) Using RockWorks Table of Contents Figure 1: Top of Nazca plate relative
3D Visualization of Seismic Activity Associated with the Nazca and South American Plate Subduction Zone (Along Southwestern Chile) Using RockWorks Table of Contents Figure 1: Top of Nazca plate relative
Using Remote Sensing Imagery to Evaluate Post-Wildfire Damage in Southern California
 Graham Emde GEOG 3230 Advanced Remote Sensing February 22, 2013 Lab #1 Using Remote Sensing Imagery to Evaluate Post-Wildfire Damage in Southern California Introduction Wildfires are a common disturbance
Field Techniques Manual: GIS, GPS and Remote Sensing
 Field Techniques Manual: GIS, GPS and Remote Sensing Section A: Introduction Chapter 1: GIS, GPS, Remote Sensing and Fieldwork 1 GIS, GPS, Remote Sensing and Fieldwork The widespread use of computers
JACIE Science Applications of High Resolution Imagery at the USGS EROS Data Center
 JACIE Science Applications of High Resolution Imagery at the USGS EROS Data Center November 8-10, 2004 U.S. Department of the Interior U.S. Geological Survey Michael Coan, SAIC USGS EROS Data Center coan@usgs.gov
Sentinel-1 Mission Overview
 Sentinel-1 Mission Overview Pierre Potin Sentinel-1 Mission Manager, ESA Advanced Course on Radar Polarimetry ESRIN, Frascati, 19 January 2011 Global Monitoring for Environment and Security GMES is established
The RapidEye optical satellite family for high resolution imagery
 'Photogrammetric Week 01' D. Fritsch & R. Spiller, Eds. Wichmann Verlag, Heidelberg 2001. Scherer, Krischke 139 The RapidEye optical satellite family for high resolution imagery STEFAN SCHERER and MANFRED
16 th IOCCG Committee annual meeting. Plymouth, UK 15 17 February 2011. mission: Present status and near future
 16 th IOCCG Committee annual meeting Plymouth, UK 15 17 February 2011 The Meteor 3M Mt satellite mission: Present status and near future plans MISSION AIMS Satellites of the series METEOR M M are purposed
How To Understand The Geology Of An Australian Soil
 Modelación y Cartografía Digital de Suelos en Australia Elisabeth Bui CSIRO Land and Water Australia tiene una larga historia en los inventarios de los recursos de la tierra y en los métodos de evaluación
Generation of Cloud-free Imagery Using Landsat-8
 Generation of Cloud-free Imagery Using Landsat-8 Byeonghee Kim 1, Youkyung Han 2, Yonghyun Kim 3, Yongil Kim 4 Department of Civil and Environmental Engineering, Seoul National University (SNU), Seoul,
Erling John Johnson Gavilán
 Erling John Johnson Gavilán Personal Data Birthdate: 24-junio-1979 Civil state: Single Education High School Studies, Miguel de Cervantes College, Punta Arenas Chile - March 1993 Graduate, December 1996
A GIS helps you answer questions and solve problems by looking at your data in a way that is quickly understood and easily shared.
 A Geographic Information System (GIS) integrates hardware, software, and data for capturing, managing, analyzing, and displaying all forms of geographically referenced information. GIS allows us to view,
Texas Prairie Wetlands Project (TPWP) Performance Monitoring
 Performance Monitoring") Texas Prairie Wetlands Project (TPWP) Performance Monitoring Relationship to Gulf Coast Joint Venture (GCJV) Habitat Conservation: Priority Species: Wintering waterfowl species in the Texas portion of
Texas Prairie Wetlands Project (TPWP) Performance Monitoring Relationship to Gulf Coast Joint Venture (GCJV) Habitat Conservation: Priority Species: Wintering waterfowl species in the Texas portion of
Günter Seeber. Satellite Geodesy 2nd completely revised and extended edition
 Günter Seeber Satellite Geodesy 2nd completely revised and extended edition Walter de Gruyter Berlin New York 2003 Contents Preface Abbreviations vii xvii 1 Introduction 1 1.1 Subject of Satellite Geodesy...
Operational Space- Based Crop Mapping Protocols at AAFC A. Davidson, H. McNairn and T. Fisette.
 Operational Space- Based Crop Mapping Protocols at AAFC A. Davidson, H. McNairn and T. Fisette. Science & Technology Branch. Agriculture and Agri-Food Canada. 1. Introduction Space-Based Crop Mapping at
Guidelines for Designing Web Maps - An Academic Experience
 Guidelines for Designing Web Maps - An Academic Experience Luz Angela ROCHA SALAMANCA, Colombia Key words: web map, map production, GIS on line, visualization, web cartography SUMMARY Nowadays Internet
Adaptation of High Resolution Ikonos Images to Googleearth for Zonguldak Test Field
 Adaptation of High Resolution Ikonos Images to Googleearth for Zonguldak Test Field Umut G. SEFERCIK, Murat ORUC and Mehmet ALKAN, Turkey Key words: Image Processing, Information Content, Image Understanding,
Comparison of Satellite Imagery and Conventional Aerial Photography in Evaluating a Large Forest Fire
 Purdue University Purdue e-pubs LARS Symposia Laboratory for Applications of Remote Sensing --98 Comparison of Satellite Imagery and Conventional Aerial Photography in Evaluating a Large Forest Fire G.
LANDSAT 7 - GROUND SEGMENT ACTIVITIES AT THE GERMAN REMOTE SENSING DATA CENTER. Deutsches Fernerkundungsdatenzentrum (DFD) DLR (*)
 DLR (*)") LANDSAT 7 - GROUND SEGMENT ACTIVITIES AT THE GERMAN REMOTE SENSING DATA CENTER Günter Strunz (*), Hans-Dietrich Bettac (**), Jörg Gredel (*), Klaus-Dieter Reiniger (*) & Gunter Schreier (*) Deutsches Fernerkundungsdatenzentrum
LANDSAT 7 - GROUND SEGMENT ACTIVITIES AT THE GERMAN REMOTE SENSING DATA CENTER Günter Strunz (*), Hans-Dietrich Bettac (**), Jörg Gredel (*), Klaus-Dieter Reiniger (*) & Gunter Schreier (*) Deutsches Fernerkundungsdatenzentrum
PHOTOGRAMMETRIC MAPPING OF SPOT IMAGES BINGO IN THE PHOCUS SYSTEM ABSTRACT 1. INTRODUCTION. by E. Kruck, Oberkochen
 PHOTOGRAMMETRIC MAPPING OF SPOT IMAGES BINGO IN THE PHOCUS SYSTEM by E. Kruck, Oberkochen ABSTRACT Stereo images taken by the SPOT satellite can be used for the production and revision of topographic maps
Digital image processing
 746A27 Remote Sensing and GIS Lecture 4 Digital image processing Chandan Roy Guest Lecturer Department of Computer and Information Science Linköping University Digital Image Processing Most of the common
Active and Passive Microwave Remote Sensing
 Active and Passive Microwave Remote Sensing Passive remote sensing system record EMR that was reflected (e.g., blue, green, red, and near IR) or emitted (e.g., thermal IR) from the surface of the Earth.
GLACIERS OF THE CONTERMINOUS UNITED STATES
 Glaciers of North America GLACIERS OF THE CONTERMINOUS UNITED STATES GLACIERS OF THE WESTERN UNITED STATES By ROBERT M. KRIMMEL With a section on GLACIER RETREAT IN GLACIER NATIONAL PARK, MONTANA By CARL
Exploitation of historical satellite SAR archives for mapping and monitoring landslides at regional and local scale
 Exploitation of historical satellite SAR archives for mapping and monitoring landslides at regional and local scale (A. Ferretti (TRE), A. Tamburini (TRE), M. Bianchi (TRE), M. Broccolato (Regione Valle
CADASTRAL APPLICATION OF SATELLITE IMAGES WITH HIGH SPATIAL RESOLUTION IN EASTER ISLAND (CHILE)
") CADASTRAL APPLICATION OF SATELLITE IMAGES WITH HIGH SPATIAL RESOLUTION IN EASTER ISLAND (CHILE) V. Herrera 1, J. Borcosque 1 1 Geomatic Area, Geographic Engineering Department, University of Santiago of
CADASTRAL APPLICATION OF SATELLITE IMAGES WITH HIGH SPATIAL RESOLUTION IN EASTER ISLAND (CHILE) V. Herrera 1, J. Borcosque 1 1 Geomatic Area, Geographic Engineering Department, University of Santiago of
Impact of water harvesting dam on the Wadi s morphology using digital elevation model Study case: Wadi Al-kanger, Sudan
 Impact of water harvesting dam on the Wadi s morphology using digital elevation model Study case: Wadi Al-kanger, Sudan H. S. M. Hilmi 1, M.Y. Mohamed 2, E. S. Ganawa 3 1 Faculty of agriculture, Alzaiem
PHOTOGRAMMETRIC DATA SET, 1957-2000, AND BATHYMETRIC MEASUREMENTS FOR COLUMBIA GLACIER, ALASKA
 PHOTOGRAMMETRIC DATA SET, 1957-2000, AND BATHYMETRIC MEASUREMENTS FOR COLUMBIA GLACIER, ALASKA U.S. GEOLOGICAL SURVEY Water-Resources Investigations Report 01-4089 science for a changing world CONTENTS