Murdoch University. School of Engineering and Information Technology PEC624. Master of Science in Renewable Energy. Dissertation
|
|
|
- Archibald Miles
- 8 years ago
- Views:
Transcription
1 Murdoch University School of Engineering and Information Technology PEC624 Master of Science in Renewable Energy Dissertation 2013 Grid Connected PV for Buildings - Potential yield, feasibility and key enablers to make PV viable in Bergen, Norway. By: B.Sc. Student No: Submitted: November 2013

2 Declaration This paper is based on the writer s own assessment of the feasibility, potential yield and key enablers, of solar electricity for the Bergen area in Norway. Work by others is appropriately acknowledged when used. i

3 Abstract In this dissertation the key enablers, feasibility and potential yield for a photovoltaic system installed on an office building situated in Bergen is reviewed. The dissertation covers a broad area and seeks to discover potential benefits of such an initiative to a building owner. The paper focuses on the available incentives for the installation of a photovoltaic system on a commercial building. The motivation has been to discover if the use of solar energy could be an attractive alternative to building owners seeking to reduce their energy usage. It is found that a photovoltaic system installed on the roof could result in a better Energy Label and BREEAM NOR grade in the Norwegian context. The cost of such a system is competitive with conventional building methods. Such as extra insulation in the walls, three layer glasses with low U-values, lower Specific Fan Power (SFP) in air handling units and a more sealed building frame. There are however no governmental subsidies for the installation of photovoltaic systems in Norway. PVsyst, software to calculate and design complete photovoltaic systems, was used to reveal the potential contribution of the proposed system. The available weather data and the results from PVsyst were considered as conservative. The cost of electricity from such a system was found to be almost twice as high as the retail price for electricity in Norway. When seen together with the alternative cost and the added revenue from rent increase, combined with a better Energy Label and BREEAM NOR grade, the use of photovoltaics is shown to be cost competitive. ii

4 Acknowledgements This master thesis is prepared as a final part of the Master of Science in Renewable Energy, master coursework at Murdoch University, School of Engineering and Information Technology. It has been made in cooperation with Multiconsult in both Oslo and Bergen, and the Backer Group in Bergen. The task was initiated by the author and made possible through Helge Davidsen, and Bjørn Thorud, both from Multiconsult. I would like to thank my supervisor and academic tutor Dr. Trevor Pryor, Energy Studies Program at Murdoch University, Perth, Western Australia. I would also like to thank my examiners Dr. Sinisa Djordjevic and Dr. David Parlevliet. In addition, I would like to thank for the help I have received from Stanislas Merlet and Øystein B. Holm at Multiconsult, Morten Gaustad and Knut Erik Nilsen at GETEK, Jan Asle Olseth at UiB, Thor Christian Tuv at FUSEN, Kjell Sylvarnes at BACKER and Bernhard Haukland at BKK. Special thanks to my co-supervisor Bjørn Thorud, Ph.D. at Multiconsult, for his patience and support when writing this thesis. iii

5 Table of Contents Declaration... i Abstract... ii Acknowledgements... iii 1. Introduction Background Research Focus Document Outline Limitations Method Key Enablers and Regulations Regulations Energy regulations Building Regulations Energy Label (Energimerke) Energy Character Heating Grade Preliminary Energy Label Results for Multiconsult Nesttunbrekka BREEAM NOR Discussion iv

6 3.5 Other Enablers Surplus Seller Grants from ENOVA ENERGIX Components of a Grid-tie Solar Electric System Solar Panels and their Characteristics Solar Radiation Temperature Shading Inverter/MPPT Mounting Systems The Solar Resource in Bergen Solar Radiation and Meteorology Resource in Bergen PVsyst Project design Preferences: Site, Meteo and Albedo Settings Orientation Horizon Detailed Losses Near Shadings v

7 6.6 System Yield, Costs and Economic Evaluation Discussion Conclusions References Appendices Appendix A Reference Model Appendix B Energy Label TEK10 with Heat Pump, PV Covers 18% Specific Electricity: Energy Label TEK10 with Heat Pump, PV Covers 20 % Specific Electricity Energy Label TEK10 with Heat Pump and PV Covers 20 % Room Heating, 20 % Tap Water Heating and 9 % Specific Electricity Appendix C Weather Data PVGIS Meteonorm NASA-SSE RETScreen UiB Appendix D PV Panel and Inverter Specifications Appendix E PVsyst Reports Minimum production Module Strings vi

8 Maximum Production Linear Shade Appendix F Economics vii

9 List of Figures Figure 3-1 Energy character and heating character [11] Figure 3-2 Snapshot of 3-D model with Nestunbrekka 95/97/ Figure 3-3 Energy Label for Nesttunbrekka 99, basis simulation Figure 4-1 Difference between cell and module [31] Figure 4-2 Effects of connecting modules in series and parallel Figure 4-3 Difference between string and array [32] Figure 4-4 I-V-curve Figure 4-5 Effect of varying irradiance on I-V curve with constant temperature Figure 4-6 Effect of different temperature on I-V curve, constant irradiance Figure 4-7 Effect of power output with different temperature, constant irradiance Figure 4-8 Example of bypass and blocking diode Figure % shading on one cell within one bypass diode group for one module, I-V curve Figure % shading on one cell within one bypass diode group for one module, P-V curve Figure % shading on one cell within one bypass diode group for one module, P-V curve Figure % shading on one cell in 2 bypass diode groups for one module, P-V curve Figure 4-13 Typical inverter total efficiency curve [39] Figure 4-14 Common waveforms produced by inverters [29] Figure 4-15 Micro inverter layout Figure 4-16 String inverter layout Figure 4-17 Central inverter layout viii
![.. 40 Figure 4-3 Difference between string and array [32]... 40 Figure 4-4 I-V-curve... 41 Figure 4-5 Effect of varying irradiance on I-V curve with constant temperature.](/docs-images/55/9204488/images/page_9.jpg ".. 43 Figure 4-6 Effect of different temperature on I-V curve, constant irradiance... 44 Figure 4-7 Effect of power output with different temperature, constant irradiance.")
10 ix Figure 5-1 Solar radiation in the atmosphere [30, 46] Figure 5-2 Solar radiation on horizontal surface respectively in January and July for Norway [47] Figure 5-3 Areas of observation in Bergen County Figure 5-4 Solar resource comparison at different sites Figure 5-5 Precipitation for Florida and Flesland Figure 6-1 PVsyst - Main menu Figure 6-2 PVsyst - Project design Grid connected Figure 6-3 Sun path diagram for Nesttunbrekka 99, solar time Figure 6-4 Altitude, azimuth and solar path window Figure 6-5 Albedo settings for Nesttunbrekka Figure 6-6 Design conditions Figure 6-7 Optimum orientation fixed tilted plane Figure 6-8 Far horizon profile for NB Figure 6-9 The Nesttunbrekka site Figure 6-10 Near shading definition Figure 6-11 Scene created for NB Figure 6-12 Shading of collectors [61] Figure 6-13 Unlimited sheds Figure 6-14 Unlimited sheds, optimisation Figure 6-15 Unlimited sheds, shading graph Figure 6-16 System overview Figure 6-17 System sizing Figure 6-18 View of proposed system from above... 85

11 List of Pictures Picture 4-1 KNUBIX mounting system East/West [42] Picture 4-2 KNUBIX sheds south [43] Picture 4-3 KNUBIX green roof [44] Picture 4-4 Renusol flat roof system[45] List of Tables Table 3-1 TEK 10 energy measures Table 3-2 Minimum transmission heat loss requirements TEK Table 3-3 Energy Label requirements [11] Table 3-4 Limits to heating colour [11] Table 3-5 Heating source coverage [11] Table 3-6 Buildings cost to reduce Energy Label with conventional methods Table 3-7 Values used in the SIMIEN software Table 3-8 Results from SIMIEN software Table 3-9 BREEAM NOR categories Table 3-10 BREEAM NOR rating Table 3-11 Innovation credits Table 3-12 NOx credits Table 3-13 Potential BREEAM NOR score Table 3-14 BREEAM NOR score for case building Table 3-15 BKK tariff scheme for surplus customers Table 5-1 Solar resource comparison Table 6-1 Approximately cost values x
![.. 13 Table 3-4 Limits to heating colour [11]... 14 Table 3-5 Heating source coverage [11]... 15 Table 3-6 Buildings cost to reduce Energy Label with conventional methods.](/docs-images/55/9204488/images/page_11.jpg ".. 20 Table 3-7 Values used in the SIMIEN software... 21 Table 3-8 Results from SIMIEN software... 21 Table 3-9 BREEAM NOR categories... 22 Table 3-10 BREEAM NOR rating.")
12 Table 6-2 Results from present value Disregarding increased revenue from rent prices Table 6-3 Maximum and minimum revenue from generated electricity Table 6-4 Net present value xi

13 1. Introduction Energy is today considered as an essential need for humanity. Electricity is the most important energy commodity in Norway, except for the transportation sector. Norway relies heavily on hydroelectric power plants and the abundance of this resource. In households and the service industries, the share of electricity is about 77 per cent of total energy consumption. Norway is actually the highest user of electricity per household in the world, with a yearly average of kwh [1]. Energy legislation that entered into force in 1991 liberalised the Norwegian electricity market. In the period following the liberalisation, Norway has had a net export of electricity in 13 years and a net import in 8 years. Before the new energy legislation from 1991 came into effect, the power suppliers were obligated to cover the demand, importing power from abroad was limited and the prices did not fluctuate in line with precipitation and temperature. In this new deregulated market, supply and demand dictates the price of electricity. In addition there are several projects on the way that will increase our capacity to sell hydroelectric power abroad [1]. From July 2010, all residences and non-residential buildings that are leased or sold have to have energy certificates. The amount of energy radiated from the sun to Earth is several thousand times greater than the amount of energy the Earth's population demand and many times greater than Earth's energy reserves [2]. The use of solar energy in Norway has had an increased interest in recent years. With continuing stricter energy usage regulations within the building sector the potential to use solar energy could provide an alternative to conventional building methods that reduces energy consumption. 1

14 1.1 Background My interest in renewable energy, and the growing market in Norway for the use of photovoltaic panels on houses, spurred the growth of wanting to learn more on the practical side of such an installation. I singled out to look at the planning process for a photovoltaic (PV) system, from resource assessment through to the physical placement of components and all the necessary parts that make up a PV system. I also wanted to see what other incentives existed in Norway, apart from price, that could benefit a potential building owner to implement such systems. 1.2 Research Focus The research focus in this thesis is focused on which enablers exist in Norway for the use of photovoltaic power generation on commercial buildings. The potential impact the use of a PV system would have on the Energy Label and BREEAM NOR might influence the decision for a building owner to implement such a system. In addition, the solar potential for Bergen is evaluated and the software package, PVsyst, is used to look at the potential output for a PV system for a particular case study. The research focus has culminated in a better understanding of the process in a design study for PV systems coupled with a better understanding of the potential enablers that could help the implementation of such systems in Norway. 1.3 Document Outline The thesis starts with exploring the potential key enablers for utilizing a PV system on a building and calculating the Energy Label for a commercial building in Norway. The paper then explores BREEAM NOR and potential subsidies that could serve as key enablers for the 2

15 implementation of a PV system on a commercial building. Before evaluating the solar resource for Bergen, a brief explanation of the most important components of a PV system is made. The case study is simulated with the PVsyst software and then some economic benefit of the expected yield is discussed. 1.4 Limitations This thesis evaluates a broad range of areas in order to evaluate if grid connected PV for buildings have the necessary yield, feasibility and key enablers to be viable in Bergen. Since the theme is extensive, it is not possible to make an in depth look in all the areas. The thesis will not critically assess if the framework is adequate. The framework has been approved and therefore it is what we have to accommodate. The critique of this system is therefore something that should be elaborated as an assignment in its own. The key enablers that exist in the Norwegian market are explained and calculated when applicable. The solar resource is evaluated but the entire Bergen region has not been taken into consideration, only three areas have been picked out to find irregularities. A brief introduction to components in a PV system is made, but should not be taken as an in depth orientation. This thesis evaluates the potential for PV power production on an office building in Bergen; the economic evaluation is coupled with other potential benefits that such a systems could generate for a building owner. It is therefore not plausible to dwell into other areas where PV systems could be used. 3

16 The limits to this thesis do not warrant a complete design of a PV system, but works as a preliminary study. Thus, the thesis cannot be seen as a finished design of the PV system on Nesttunbrekka 97. There are still elements to the design that needs to be evaluated and estimated before installing such a system. The software is evaluated with respect to how it is operated. To evaluate it properly several installed systems would have to be simulated in order to find out how exact the software is. This is not the goal of this thesis. Economic evaluations are made but they serve as insight. Several other variations should be considered, but was left out since the thesis covers a broad subject. 4

17 2. Method Background information was collected from literature spanning from: Articles and journals General web pages about solar cells Solar cells manufacture information web pages Literature of solar energy both components and complete systems The Murdoch Library and Google Scholar have been widely employed when searching for literature in addition several books on the subject have been acquired. To achieve the results of this project a site study was made for the case site. The information gathering included: Project document studies from the project team that are planning the new headquarter for Multiconsult in Bergen and receiving plans of the building and technical specifications Solar data collection from Meteonorm, and other related sources Conversations with companies in Norway that specialize or are related to the PV production systems Discussions with my co-supervisor, Bjørn Thorud, or one of his colleagues I have used PVsyst for all my calculations. PVsyst is a tool that allows to analyse accurately different configurations and to evaluate its results in order to identify the best solution. Some necessary steps in order to design a successful solar electric installation are [3]: Scope the project Calculate the amount of energy you need Calculate the amount of solar energy available 5

18 Survey your site Size up the solar electric system Select the right components and work out full costs Produce the detailed design Some will be elaborated and some will be left out, depending on how important they are for a preliminary study. Google Earth has been employed for the following reasons: Identifying the project site and measuring distance from site to existing ground weather monitoring station Florida. Evaluating potential structures that could potentially shade the site This thesis looks at a grid connected PV for buildings that are trying to achieve a better Energy Label or BREEAM NOR testimonial. Therefore, some parts of project scope and amount of energy the building needs are described in chapter Key Enablers and Regulations. Following the evaluation of enablers, a brief explanation of the most essential components of a PV system is shown. The remaining steps are integrated into the use of the software PVsyst. 6

19 3. Key Enablers and Regulations Solar energy competes with other energy carriers and energy technologies for providing cheap energy and improving the environmental impact for buildings. It`s competitive edge is closely related with costs compared to the alternatives. Increased use of solar energy will most likely happen over a long time span therefore it is natural to rely on long-term development in energy prices, including tax on greenhouse gases. Foremost the price of oil and electricity influences the energy market. In addition to this, there are several projects on the horizon to connect the Norwegian power grid to the European; this could lead to balancing out the prices in the Norwegian market with the European market. There are several rules and regulations, which a power producer has to uphold, that can serve as a barrier for the use of renewable energy sources. Due to the increased focus on climate politics, energy security and industrial politics changes have been made to ease the development of alternative power production. The most pronounced key enablers will be elaborated in this chapter. 7

20 3.1 Regulations Energy regulations A power producer must enter a balance deal with Statnett, Norway s national main grid owner and operator, to be able to trade in the wholesale electricity market. This applies in principle for all power producers independent of the size of the production [4]. Power producers are also regulated through chapter 4 in the Energy Regulations [5] and in Regulation on the control of network operations [6]. Energy regulations ensure that the production, conversion, transmission, trading, distribution and use of energy take place in a socially efficient manner. Regulation on the control of network operations provides the basis for an efficient energy market and control of network operations as a natural monopoly. The regulation ensures that power is transferred at the appropriate quality and price, and that the grid is expanded in a safe and socially efficient manner. Both regulations take into account public and private interests that are affected. In cases where the license requirement is deemed unnecessary one is exempt from the licensing requirement. From March 2010 an exemption from regulation 302, regarding economical and technical report from NVE, was approved [4, 7]. This simplifies the process for an end user to become a power producer under certain conditions, called surplus customer. The definition of a surplus customer will be elaborated under Surplus Seller Building Regulations All buildings must meet the requirements of the building code that is applicable for that period of time when the building was erected (currently TEK 10) [8]. There are two ways to uphold the energy requirement to a building [9]. 8
![Power producers are also regulated through chapter 4 in the Energy Regulations [5] and in Regulation on the control of network operations [6].](/docs-images/55/9204488/images/page_20.jpg "Energy regulations ensure that the production, conversion, transmission, trading, distribution and use of energy take place in a socially efficient manner.")
21 The Measures model is, in principle, to fulfil a series of individual measures. If all measures are fulfilled this requirement is deemed to be satisfied. Redistribution between some of the measures is accepted. For buildings, except residential, it is allowed to redistributed between U-values and thermal bridge. U-Value is the coefficient of transmission, i.e., the transmission of heat through the materials, which compose the building's "envelope," or outer shell. An important feature of the measure model is that the fulfilment of this regulation is independent of the building's shape. This model does not consider the building's surface area as long as the individual energy measures satisfy their own requirements. This is in contrast to the framework requirements model, where the building's shape affects the assessment. It is also important to note that the use of local cooling is excluded in the measure model. This means that if during a project one discovers that local cooling is required, it needs to satisfy the frame requirements model instead, although the measure model has been applied earlier in the project. The Frame requirements model assumes that an energy calculation built according to NS is performed. The calculation must document the building's expected net energy consumption is lower than the frame requirement for that building type, as specified in the building regulation. Frame requirements are somewhat stricter in TEK10 compared to previous versions. This is mainly a consequence of stricter requirements for heat recovery ratio for ventilation. It is important to note that the individual frame requirements are determined through calculation of sample buildings within that frame, and that these sample buildings generally have a single main form without complicated geometry. The frame requirement calculation takes into account the proposed building's shape and uses 9
22 exterior wall, roof, windows and other areas in the calculation. The more complicated the projected shape is, the more difficult it becomes to fulfil the frame requirement. The following energy measures are depicted in TEK 10 for a office building [8]: Transmission heat loss Component Energy Measure Requirement in TEK 10, U value (W/m 2 K) Exterior Walls 0,18 Roof 0,13 Floor against the ground 0,15 Glass, window, door including framework Normalised thermal bridge value (W/m 2 K) (m 2 of 1,2 ( 20% of available heated area) 0,06 available heated area) Infiltration and ventilation heat loss Leakage rate at 50 Pa pressure difference Annual average temperature efficiency of heat 1,5 air changes per hour 80 % for office buildings recovery in ventilation systems Other measures Specific fan power of ventilation systems (SFP) 2,0 kw/(m3 /s) Possibility of lowering the inside temperature during night and weekend. Measures to eliminate the need for local cooling in the building. Table 3-1 TEK 10 energy measures Transmissions heat loss measure could be deviated from as long as the buildings heat loss figures do not increase. Total net power requirement cannot exceed the limit given for office building at 150 kwh/m 2 of available heated area. 10
23 In addition must the following minimum requirement be met [8]: U-value external wall (W/m 2 K) U-value roof (W/m 2 K) U-value floor against the ground and to the open (W/m 2 K) U-value windows and doors including framework (W/m 2 K) Leakage rate at 50 Pa pressure difference (air changes per hour) 0,22 0,18 0,18 1,6 3,0 Table 3-2 Minimum transmission heat loss requirements TEK 10 There are also some requirements regarding energy supply, those applicable to this building type are [8]: It is not allowed to install oil fired boiler for fossil fuels as a base load Building above 500 m 2 of available heated area shall be designed and constructed so that at least 60% of net heat demand can be covered with a different energy source than direct-acting electricity or fossil fuels by the end user. Building below 500 m 2 of available heated area shall be designed and constructed so that at least 40% of net heat demand can be covered with a different energy source than direct-acting electricity or fossil fuels by the end user. The demand for energy supply in the second and third paragraph shall not apply if it is documented that natural conditions make it practically impossible to satisfy the requirement. The above has been a brief introduction to the requirements of an office building in Norway. These requirements are implemented in softwares that an energy advisor can utilise to check the requirements and generate an Energy Label for a building. One of the most widely used softwares for this in Norway is SIMIEN. This software will be used in order to see the benefits that a PV array can contribute with for the Energy label. The results are shown in 3.3 Preliminary Energy Label Results for Multiconsult. 11
24 3.2 Energy Label (Energimerke) Energy Label is a mandatory system to evaluate different buildings energy quality. The system is sanctioned by law in the Energy law (Energiloven) [5] and govern by the Energy Label regulation (Energimerkeforskriften) [10]. The regulation came into effect January the 1 st 2010, and is mandatory from July the 1 st It is compulsory for a building to have an Energy Label: At completion date for new buildings For non-residential buildings with over 1000 m 2 of floor space When selling or renting out the building The certificate is current for 10 years from the date of issue. There are some exceptions but these will not be defined here since they are not applicable for our case study. The energy Label is determined from a standardized calculation method depicted in NS-3031 [10]. The calculation uses normalised values for climate and usage patterns. This ensures that buildings within the same category can be rated against each other and that it is the buildings qualities and technical installations that matter [11]. 12
![Energy efficient High share Heating Character Energy Character (Share of electricity and fossil) Less energy efficient Low share Figure 3-1 Energy character and heating character [11] 3.2.](/docs-images/26/9204488/images/25-0.png "1 Energy Character The Energy Label consists of an energy character and a heating character.")
25 Energy efficient High share Heating Character Energy Character (Share of electricity and fossil) Less energy efficient Low share Figure 3-1 Energy character and heating character [11] Energy Character The Energy Label consists of an energy character and a heating character. An energy rating is rated from A to G, where A is the best and G is the lowest, and is based on estimated energy requirements. A building that is constructed after the newest building regulations receives a C. Buildings that meet more stringent requirements than those specified in the design requirements (TEK10), or have efficient heating systems, can achieve a B or A. Lower energy character than C is given to buildings constructed under older regulatory requirements and which have not had upgrades done. The following shows the requirements for each energy character for office building type [11]: Building Category Delivered energy per m 2 available heated area (kwh/m 2 ) A B C D E F G Lower than or equal to Lower than or equal to Lower than or equal to 13 Lower than or equal to Lower than or equal to Lower than or equal to No limit Office Building > F Table 3-3 Energy Label requirements [11] The upper limit for the character C is based on TEK10 level; this version is revised and is current from Each increase in Energy Label from C is achieved by a 30 kwh/m 2 reduction in estimated energy consumption.
26 3.2.2 Heating Grade Heating grade is given a five-level colour rank from red to green, where green is the best and red the lowest, and ranks the building on the type of heating system installed. There is no relationships between energy character and warming character, so a building with high estimated energy use and associated poor energy rating, can get a good heating character with for example the use of a bio-based heating system [11]. Heating grade is determined by the proportion of the total heating requirements covered by electricity and / or fossil fuel. The proportion of electricity and fossil must be below the following values for the different colour grades: Limit Colour Example of heating system < 30,0 % Dark Green water-based heating with Biofuel boiler and electricity as peak load < 47,5 % Light Green District Heating < 65,0 % Yellow water-based heating with heat pump using water/ground or bedrock, solar Water heating based heating and electricity with as heat peak pump load from water/ground or bedrock and electricity as peak load < 82,5 % Orange Direct electric heating and closed wood-burning stove Solar heating combined with direct electric heating < 100 % Red Air to air heat pump combined with direct electric heating Only direct electric heating Water-based heating with oil boiler and electricity as peak load Table 3-4 Limits to heating colour [11] Conversely, a low energy building can get a good energy rating, while the heating grade will be poor if the building only has electric heating, as seen in Figure 3-1. Energy grade is the 14
27 result of the calculated energy supplied to the building during normal use and deviation between calculated and actual energy used can occur. The proportion of electricity and fossil fuels must be below the values, depicted in Table 3-4, to obtain the different colour gradations. Heating grade depends on heating combination, efficiencies, net energy demand for space heating and for hot water heating. Based on the selected heating system combination the system decides, using standardised library values for the different combinations, the proportion of the energy needed for building heating and hot water heating covered by each of the selected options. The different heating sources are believed to be able to cover a percentage of the need, for heating and hot water heating systems, as specified in the table below [11]: Heating System Building Heating Hot Water Heating Solar collector 15 % 20 % PV 5 % 0 % Air to air heat pump 40 % 0% Heat pump using water/soil/ground/bedrock 75 % 75 % Biofuel boiler 80 % 80 % District Heating 100 % 100 % Oil Boiler 80 % 80 % Gas Boiler 80 % 80 % Electric Boiler 100 % 100 % Table 3-5 Heating source coverage [11] The amount of building heating and hot water heating that solar collector and PV could amount to is debatably. The figures listed from NVE, regarding Energy label and the heating grade, are estimates designed for use all over the country [11]. The proportion of heating requirements covered by the individual systems will affect heating character greatly. 15
28 Professional users, who know that the distribution of a particular house is different from the typical values can change this in the calculation data, this can be done in SIMIEN. SIMIEN is a Norwegian software developed by a company called ProgramByggerne [12]. SIMIEN perform simulations on the state of a building. The recommended use is evaluation against building codes: energy labelling, calculation of energy requirements, validation of indoor air quality and sizing of heating systems, ventilation and space cooling. The software is widely known and used by professionals in Norway, the software is only available in Norwegian so all data has been verified by advisers in Multiconsult. According to validation procedure depicted in NS-EN 15265:2007 and requirements in NS 3031:2007 simulation software must have accuracy with less than 15 % deviation. Validation of SIMIEN, performed by the software developer, shows that the software is within the range of 10 % deviation [13]. 16
29 3.3 Preliminary Energy Label Results for Multiconsult Figure 3-2 Snapshot of 3-D model with Nestunbrekka 95/97/99 The site that will be evaluated in this dissertation consists of multiple buildings, all owned by Backer. Backer is a company that rents out business premises and is the owner of Multiconsult new headquarter building in Bergen, which is tailored to the needs of its tenant. The old main office to Multiconsult was situated in Nesttunbrekka 95 together with the local police station, also owned by Backer. Some of the staff has moved into the first building, Nesttunbrekka 99, and the rest will move into Nesttunbrekka 97 upon completion. Since Nesttunbrekka 95 is an older building, which Backer does not have any plans to upgrade the energy label for, it will not be evaluated in this thesis. Since Nesttunbrekka 97 has not been completed, I have focused on building 99. There have been several improvements on the building specifications regarding energy usage through this year and the project have moved forward from complying with the TEK 10 energy measures to trying to achieve A as Energy Label and looking into the possibility to 17
30 achieve status as low energy or Passive House. These two last mentioned types of buildings are beyond the scope of this thesis and will not be elaborated. In order to evaluate the amount that a PV array would have to deliver, to better the energy label, I have adjusted the model in SIMIEN back to TEK 10 level. I have adjusted the U-values and standard power consumption of lighting, power appliances, tap water and heating contribution from people according to TEK 10 and NS I have only kept values, which will not demand substantial investments and are already implemented in the project, that are regarded as off the shelf within the building sector in Norway. The simulation has been verified by Multiconsult as relevant and concise enough for this paper. All input data can be found in Appendix A and Appendix B. 18
31 3.3.1 Nesttunbrekka 99 The base simulation shows that the building itself receives a yellow B, this is with TEK 10 measures that are somewhat adjusted from the real situation. The report on this simulation can be found in Appendix A. Figure 3-3 Energy Label for Nesttunbrekka 99, basis simulation These numbers are per square meter of heated area and for this building the heated area is m 2. The delivered energy to the building is kwh per year which gives approximately kwh/m 2. As we can see the building receives a yellow B with TEK 10 and NS3031 values, with some slight adjustments that can be viewed in Appendix A Reference Model. To be able to change the energy character, as mentioned under Energy Character, there is in general a 30 kwh/m 2 decrease in the Energy Character from C to B and from B to A. For this building this would mean a reduction of kwh per year to achieve such a reduction. In order to achieve an A, from the current B, the energy usage must be lowered by approximately 12.6 kwh/m 2 which amounts to kwh per year. 19
32 This amounts to a reduction in energy need by 12.9 %. To be safe that the Energy Label will be below this it is advisable to set the list at 84 kwh/m 2, which would mean a reduction of 13.6 kwh/m 2 and a reduction of at least kwh a year. Now this could be achieved by alleviating specific electric usage, although this would not change the heating grade. The threshold to achieve an A is at approximately 18 % solar electric contribution on specific electric usage. With a safety margin of 13.6 kwh/m 2, this amounts to approximately 20% solar electric contribution for previous mentioned post. If we readjust the amount of electricity for heating and let PV supply the power for the heating we would need to cover a minimum of 20 % of the Room heating, 20 % of Tap water heating and in addition approximately 9 % of specific electric usage. This would give us a light green A. Using PV to cover energy usage for cooling will not affect the Energy Label in any way. The guideline does not prohibit the energy specialist from choosing what part of the energy that PV system should replace. The values used and the result are shown in the tables below and the reports are present in Appendix B. From these result we now know the amount of Energy that the PV system needs to deliver in order to achieve a better Energy Label. From discussion with project leader at BACKER, they have estimated the following costs to improve the Energy Label with conventional construction methods, such as lower U- values, reduce infiltration and other: Cost of Constructing NB million NOK (Previous version of TEK) C to B (160 ->125 kwh/m 2 ) 1-2 % added cost NOK B to A (125 ->85 kwh/m 2 ) 3-4 % added cost NOK Table 3-6 Buildings cost to reduce Energy Label with conventional methods It is important to recognize that the last few reduced kwh/m 2 costs more than the first. 20
33 Transmission heat loss Component Energy Measure Requirement in TEK 10, U value (W/m 2 K) Exterior walls 0,18 Roof 0,13 Floor against the ground 0,15 Glass, window, door including framework 1,2 Normalised thermal bridge value (W/m 2 K) (m 2 of 0,06 available heated area) Infiltration and ventilation heat loss Leakage rate at 50 Pa pressure difference Annual average temperature efficiency of heat recovery 1,5 air changes per hour 88 % for office buildings in ventilation systems Other measures Specific fan power of ventilation systems (SFP) 1,51 kw/(m3 /s) Lowered the inside temperature from 21 C to 19 C during night and weekend. 80 % Heat pump coverage for Building Heating and Hot Water Heating Table 3-7 Values used in the SIMIEN software Simulation Energy Delivered Energy kwh/m 2 % Label [kwh] Change Basis calculation B % Specific electricity by PV A % Specific electricity by PV A % Room heating, 20% tap water heating, A % specific electricity by PV Table 3-8 Results from SIMIEN software 21
34 3.4 BREEAM NOR BREEAM NOR was launched in October 2011 and is a Norwegian adaptation of BREEAM, which is the world's most widely used environmental assessment method for buildings [14]. It sets the standard for best practice in sustainable design and describes a building's environmental performance. BREEAM is voluntary and can be used in the design and planning phase and after completion of the building. The points are awarded in ten categories. Weighting (%) BREEAM Section New builds, extensions & major refurbishments Building fit-out only Management Health & Wellbeing Energy Transport Water Materials Waste Land Use & Ecology 10.0 N/A Pollution Innovation Table 3-9 BREEAM NOR categories 22
35 These points are then added together resulting in a place on a scale: Pass, Good, Very Good, Excellent and Outstanding. BREEAM Rating % Score UNCLASSIFIED <30 PASS GOOD VERY GOOD EXCELLENT OUTSTANDING Table 3-10 BREEAM NOR rating The category that is weighted most heavily is energy. To achieve excellent or outstanding one must respectively achieve more than 70 or 85% of the maximum possible score. In addition, the minimum performance standards must be met. One of the minimum standards for energy is energy with low greenhouse gas emissions. To achieve this standard, there has to be conducted a feasibility study by an energy specialist to arrive at the best local low / zero carbon solution for the building. In line with the recommendations of the analysis, a local low / zero carbon technology should be specified for the building. Solar energy (both solar thermal and photovoltaic systems) is one of several reputable low / zero carbon technologies[4, 14]. Since I am neither an Accredited Professional nor an assessor, I can only gather the information available in the manual. Anyone that wants to use the information presented in this paper must seek an Accredited Professional to evaluate if the solution is applicable for his or her situation. The possible resulting score that is achievable with a PV system will be subject to certain restraints and evidence according to the BREEAM NOR Handbook, these 23
36 must therefore be supervised and documented by an assessor. The results are therefore theoretical. A building can achieve an Innovation credit, by meeting criteria given for exemplary performance for an existing BREEAM issue, in the categories presented below: Man 3 Hea 1 Hea 9 Hea 14 Ene 5 Tra 3 Wat 2 Mat 5 Wst 1 Pol 4 Construction Site Impacts Day lighting Volatile Organic Compounds Office Space (BREEAM Retail & Industrial Schemes only) Low or Zero Carbon Technologies Alternative modes of transport Water Meter Responsible Sourcing of Materials Construction Site Waste Management NOx emissions of heating source Table 3-11 Innovation credits For our case an exemplary credit can be awarded, in Pol 4, where manufacturer s details demonstrate that the plant installed to meet the building s space heating demand has zero dry NOx emission levels at 0% excess O2. In addition one innovation credit can be awarded, regarding Ene 5, where evidence provided showing that a local LZC energy technology has been installed in line with the recommendations of the above feasibility study and this method of supply results in a 50% reduction in the building s GHG emission. Two innovation credit can be awarded, also regarding Ene 5, where evidence provided shows a 100% reduction in the building s GHG emissions. These calculations, of the percentage carbon reduction provided by LZC technology, must be based on the output from a recognised energy modelling software [14]. In the following, we will target those sections where solar electricity could contribute. 24
37 Ene 1 Energy Efficiency 13 Credits Possible The number of points obtained is based upon the percentage improvement in the building s calculated delivered energy, E (kwh/m 2 yr) in relation to the level required to achieve an energy mark of C (145 kwh/m 2 yr) in the Norwegian energy labelling scheme [14]. Calculate the percentage improvement of the actual Building Energy Performance Index (BEPI) over the Current Standards Building Energy Performance Index (CSBEPI): With an office that results in an A for the Energy label, we get a % improvement that awards 8 credits. If we want to achieve the GHG emission reduction, thus also affecting the total points awarded under Ene 1, we can incorporate the energy reduction that the PV system must meet under Ene 5: At 15 % GHG emission reduction, we have a 42.8 % improvement that awards 8 credits. At 35 % GHG emission reduction, we have a % improvement that awards 10 credits. 25
38 If we are looking to get the exemplary points in the Ene 5, we need to offset the entire GHG emission to the building that would mean that the building would have to offset its entire energy usage with clean energy: At 50 % GHG emission reduction, we have a % improvement that awards 10 credits. At 100 % GHG emission reduction, we have a 100 % improvement that awards 13 credits. This would also award us the exemplary point awarded under Pol 4. Ene 5 - Energy supply with low greenhouse gas emissions 3 Credits Possible 1 Credit Feasibility Study A feasibility study must be carried out by an energy specialist to establish the most appropriate local (on-site or near-site) LZC energy source for the building/development [14]. This study covers as a minimum: a. Energy generated from LZC energy source per year b. Payback c. Land use d. Local planning criteria e. Noise f. Feasibility of exporting heat/electricity from the system 26
39 g. Life cycle cost/lifecycle impact of the potential specification in terms of carbon emissions h. Any available grants i. All technologies appropriate to the site and energy demand of the development. j. Reasons for excluding other technologies 1 Credit 15 % reduction in GHG emissions We then need an energy production from PV to the building in the magnitude of: 1 Credit 35 % reduction in GHG emissions We then need an energy production from PV to the building in the magnitude of: By accomplishing all three assessments, we receive 3 credits. To be awarded the exemplary credit we need to cover either 50 % (1 credit) or 100 % (2 credits) of the energy usage to the building in order to remove the GHG emission. This would result in the following numbers: 27
40 50 % reduction in GHG emission we need kwh of PV electricity production 100 % reduction in GHG emission we need kwh of PV electricity production Mat 1 - Materials Specification 7 Credits Possible This criterion evaluates construction materials with a low environmental impact over the full cycle of the building. This is limited to material used to construct the building, such as a part of the roof. Since this thesis look into fitting a PV system onto existing roof there will not be performed a complete undertaking into this point, this would be beyond the scope of this thesis and would have to include all the building material. Findings show that there are large differences between impact that an PV system could have on the environment [15]. The region where the system is places makes a great impact. As an example one review found that, for regions with low solar irradiation, the EPT is less than 5 years [15]. The Global Warming Potential of PV-electricity is about 10 times lower than that of electricity from a coal-fired plant, but 4 times higher when compared to a nuclear power plant or a wind farm. These numbers are subject to the collected sites that are evaluated and there are other reports that conclude that these numbers can vary considerable, for example the EPT for a PV system in England was found to be 8 years[16]. As a conclusion, it could be stated that a PV system would have a positive impact of possible credits awarded in this criterion. The amount is not possible to estimate within the boundaries of this thesis. 28
41 Pol 4 - NOx emissions from heating source 3 Credits Possible Credits Nominal heat input < 70kW Nominal heat input > 70kW Dry NOx level Boiler class (EN Dry NOx level Boiler class (EN (mg/kwh) 297:1994) (mg/kwh) 676:2003) Table 3-12 NOx credits The aim is to encourage the supply of heat from a system that minimizes NOx emissions, and therefore reduces pollution of the local environment. Where electricity used by the heating system is sourced from a zero emission renewable source such as PVs, wind etc, there are no resulting emissions. This source of heating can therefore be counted as having zero NOx emission. Although since the results so far does not suggest that the PV systems needs to cover the entire electricity usage to the building one would be able to buy certificates that the rest of the electricity needed for the building originates from renewable energy. Unfortunately commitments to use a green tariff to supply electricity to heat the building or power heat pumps is not recognized in BREEAM NOR due to the uncertainty that this electricity will be zero emission. The average NOx emission for Norwegian grid electricity is estimated in BREEAM NOR to 10 mg/kwh. Therefore, with the use of pure electricity, imported from the local grid, we would still receive 3 credits. If we wanted to achieve the exemplary credit in this section, we would have to cover the energy consumption of the building. The results from PVsyst, that are depicted in chapter 6.7 Yield, Costs and Economic Evaluation, shows that this is not possible with the use of 29
42 the roof area. This result in 3 credits awarded by default and will therefore not be taken into consideration Discussion The following table shows the possible impact the use of PV on a building will achieve: BREEAM Section Credits Credits Credits Achieved Section Section score Achieved Available Low/High (%) Weighting Low/High (%) Low/High Management Health & Wellbeing Energy 8+2/ / / Transport Water Materials Waste Land Use & Ecology Pollution Innovation 0/ / / 3 Potential BREEAM score from the use of PV system 7.92 / Table 3-13 Potential BREEAM NOR score As we can see there is a significant impact on the end result for the BREEAM NOR assessment by implementing a PV system to a building. The system could provide almost 16 % increase in the overall result. This is without the NOx emission points, which any building in Norway, that uses electricity to drive the heating source, would have got without the use 30
43 of a PV system. BREEAM is the only building certification that demands zero carbon emission and a 100% reduction in energy usage to achieve highest possible score [17]. It is difficult to see how a building could achieve this without the use of an onsite renewable energy technology, which makes the use of a PV system ideal. It should also be noted that some of these reduction could prove to be complicated to fulfil, with reference to 6.7 Yield, Costs and Economic Evaluation, and one would have to use extensive land area to fulfil the largest reductions. For our case building the potential points achieved are: BREEAM Section Credits Credits Credits Achieved Section Section score Achieved Available Low/High (%) Weighting Low/High (%) Low/High Management Health & Wellbeing Energy , Transport Water Materials Waste Land Use & Ecology Pollution Innovation Potential BREEAM score from the use of PV system 8.71 Table 3-14 BREEAM NOR score for case building 31
44 BACKER assumes that the cost for certifying the building is 1 % of building costs, which would be between NOK. 3.5 Other Enablers Surplus Seller A surplus customer is defined as: End user of electrical energy which has an annual production that normally do not exceed their own consumption, but in some operating hours have excess power that can be fed into the grid. The scheme, plus customers, does not cover production units that require a trading license or end users with the production, which also supplies electric energy to other endusers. Norwegian Water Resources and Energy Directorate (NVE) [4] As a limit all energy systems with a component above 1000 volts are licensable under the Energy Act [18].To become surplus customer one must apply to the local distribution company (territorial concession). The scheme is currently voluntary for both parties. If an agreement is reached between the parties, the network company buy surplus power from the customer. The surplus customers cannot themselves resell power to other consumers or participate in the wholesale market[7]. A surplus customer must maintain normal rights and duties such as supply and voltage quality, construction contribution and mandatory delivery and connection agreements. The local power company may on this basis, set the necessary requirements for the association to ensure their facilities and ensure that laws and regulations are upheld. A surplus customer will be charged the cost of the necessary measuring equipment that records the amount of electricity supplied to the grid. The price 32
45 for this surplus power will be set out in a separate agreement between the surplus seller and the network company. NVE suggest that the price should reflect the market price of electricity in the area, but there is no direct guidance on how the price is calculated [19]. Regardless of the customer surplus scheme, end customers that establish a form of production must have a meter with time resolution measuring both input and output. If agreement is not reached between the operator (area licensee) and end-users that the customer should be treated as surplus customer, the surplus customer must install measuring equipment that detects excess power measurement of gross output. The cost for both gauges should be included in the construction contribution, borne by the customer. Surplus scheme does not currently cover customers who produce more than they consume in a year. Such players will have to enter into a balance agreement with Statnett or some other who is responsible for balance. If there were doubt whether the facility has a license obligation, it would have to be determined by NVE. Surplus scheme is under consideration to be changed from a voluntary system to a mandatory scheme for area licensee's side as long as the facility meets these requirements. BKK, the local power company in Bergen, implemented a tariff for surplus customers on January BKK acknowledge that surplus customers can contribute to reduced losses in the grid [20]. As a condition BKK installs a meter that registers the energy flow both ways, and the demand that the inverter must have a sensor that detects zero voltage from outside the building. The information has been gathered from BKK webpage and correspondence with marketing director Bernhard Haukland at BKK Grid [20, 21]. 33
46 BKK tariff for Surplus Customers Consumption Production Supply Charge Fixed Element NOK per year - Supply Charge NOK/kWh Marginal loss Winter, day: 7 % Winter, night/weekend: 6 % Summer: 4 % Of Nord Pool s area prices Taxes Included in supply charge - Electricity Charge According to agreement with individually chosen energy supplier Nord Pool s Area prices Energy measurer NOK for equipment and installation. Table 3-15 BKK tariff scheme for surplus customers Grants from ENOVA Enova SF was established in 2001 in order to drive forward the changeover to more environmentally friendly consumption and generation of energy in Norway [22]. They promote more efficient energy consumption and increased production of new renewable energy. They do this via targeted programmes and support schemes in the areas in which the greatest effect in the form of saved, converted, or generated clean energy can be documented. Enova has previously provided support for the production of electricity via solar cells using their new technology program, but today's program does not support the power output of solar cells unless it contains a significant degree of innovation [23]. ZERO the Zero Emissions Resource Organisation - is an independent non -profit foundation 34
47 working for zero emission solutions to the global climate challenge [24]. Norwegian Solar Energy Society, a non-commercial organization, contributes with voluntary work to increase awareness and usage of solar energy in Norway [25]. Both organizations are trying to push Enova to establish grants for PV systems, a 40 % investment support for the first 1000 buildings that install a PV system [26]. Up until today, they have not succeeded. Therefore there are currently no other potential grants from Enova for the installation of commercial PV systems on buildings ENERGIX The Research Council of Norway has a program called ENERGIX that provides funding for research on renewable energy, efficient use of energy, energy systems and energy policy. The ENERGIX programme is designed to provide support for the long-term, sustainable restructuring of the energy system in order to accommodate a greater supply of new renewable energy, improve efficiency and flexibility, and facilitate closer energy integration with Europe, with due consideration given to environmental perspectives [27]. The program will help to generate new knowledge and cutting-edge solutions aimed at achieving the following targets: To achieve sustainable utilization and consumption of renewable energy resources; To reduce Norwegian and global emissions of climate gases; To ensure Norway s security of supply; To strengthen innovation in Norwegian trade and industry; To further develop Norwegian research communities. After discussion with Trond Moengen, a representative for the program, the suggested project at Nesttunbrekka was found to have insufficient level of innovation and new 35
48 technology in order to qualify to apply this program. To be able to apply the project would have to utilize new technology in collaboration with a research department, which this thesis does not seek to accomplish. 36
49 4. Components of a Grid-tie Solar Electric System PV systems can be divided into several sub areas depending on the specific need of the building owner, these are[3]: Stand-alone/off-grid o An autonomous system in which energy is stored, for example in batteries, to compensate for those times when there is little or no power production from the PV array. Often used in Norway at recreational facilities such as remote cottages. Grid-tie (Grid-connected) o A PV system that produce energy that is either used in the building or sold when there is a surplus. In times when the system does not produce electricity, the conventional grid supplies necessary energy. Grid-tie with power backup o Same as grid-tie but with a bank of batteries. The battery bank provides contingency for power cuts so that important internal systems, such as lighting, is still active. Grid fallback o A less known system that works similar to stand-alone. The battery bank is mainly used and the grid serves as a backup for when the batteries need to be recharged from the PV array. Used in areas where there are no feed-in tariff, or there are incentives for both grid-tie and off-grid, usually small systems. The two main are grid-connected and stand-alone systems, the method to dimension these two systems are different. In this thesis, we will only look at the dimensioning of a gridconnected system. 37
50 There are several components besides the PV modules that a grid-connected PV system comprise of, often referred to as Balance of System (BoS). BoS ensures electricity is properly applied to the load. Common BoS components comprise of [28, 29]: Mounting systems Direct current (DC) Array cabling Junction box DC cables to inverter Inverter Switches for disconnection and protection Lightning protection Alternating current (AC) cabling from inverter Metering System monitoring The main components to a PV system are the modules and the inverter, which will be presented before simulation in PVsyst are done. This is not an in depth look at these two components but will serve as an introduction to better understand some of the variation that are considered when designing a PV system. 38
![4.1 Solar Panels and their Characteristics Solar cells are reliable and low on maintenance [28, 30].](/docs-images/26/9204488/images/51-0.png "Some vendors indicate a 30- year life span and in some cases, they can have limited performance guaranties for 10 to 26 years. This is closely related to the price of the modules.")
51 4.1 Solar Panels and their Characteristics Solar cells are reliable and low on maintenance [28, 30]. Some vendors indicate a 30- year life span and in some cases, they can have limited performance guaranties for 10 to 26 years. This is closely related to the price of the modules. There are several cell technologies available on the market, the three most common types are monocrystalline silicon, polycrystalline silicon and amorphous silicon. These three types are the most common in use in the market today. The mono- and polycrystalline silicon cells have a commercially high efficiency, which is of importance when there is limited amount of space for a PV system. I will not go into the principle of how the cell works but will explain important factors that affect the efficiency of a PV module. Figure 4-1 Difference between cell and module [31]. Modules produce electricity from the sun`s irradiation, they comprise of several cells that produce energy which are connected in series/parallel in order to reach the desired voltage for the module [31]. Modules coupled in series are called strings, while strings coupled in parallel are called an array. For each module connected in parallel, the current increases; for each module connected in series, the voltage increases [32]. 39

52 Figure 4-2 Effects of connecting modules in series and parallel Figure 4-3 Difference between string and array [32]. 40
53 The total electrical power output of a module is equal to the operating voltage multiplied with the operating current,. A module produce current over a wide range of voltages, this gives a performance curve, called an I-V curve [28-30]. Figure 4-4 I-V-curve The curve shows the relation between voltage (V) on the horizontal axis and current (I) on the vertical axis. The curve is similar when having multiple modules connected in a combination of string and array, thus extending the curve relative to the configuration. Most I-V-curves are given for the Standard Test Condition (STC) of: 1000 W/m 2 of irradiance - often referred to 1 peak hour sunshine 25 C cell temperature 1.5 Air Mass (AM) - Sunlight spectrum when it has been 1.5 times through the atmospheric thickness. This represents an optimal condition and is often far from real conditions. STC rating is measured at an instantaneous moment in time taken with a flash tester. In addition, we gain some additional useful information: 41
54 The maximum power point (MPP) is the point on the I-V curve at which the PV module works with maximum power output. From this point, we can determine I MP and V MP. Fill Factor (FF) is defined as the ratio of the maximum power from the solar cell to the product of Voc and Isc. This is the area within the dotted lines. FF is defined as. The fill factor (FF) is the parameter for evaluating the performance of a cell. It is a ratio of a cell's actual obtainable power to its theoretical power. The short-circuit current (I SC ) is the maximum current output of a module. The open-circuit voltage (V OC ) is the maximum output voltage of a module. The three most important electrical characteristics of a module are the I SC, V OC and MPP. These values, together with max power under STC, are normally attached to the modules as specification label and can be found on datasheets from companies that sell PV modules. In PV systems, the PV array represents large portion of the total cost of the system, so it is very desirable to operate the PV panel at the maximum power point (MPP). The output characteristics of the solar array are nonlinear and vitally affected by solar radiation, soiling, temperature, panel degradation, array configuration and mismatch, cell material, load resistance and shading. The most important factors are described below. 42
55 4.1.1 Solar Radiation Figure 4-5 Effect of varying irradiance on I-V curve with constant temperature The output of a module is proportional to the solar radiation intensity on the module. A greater output is achieved with sunlight that is more concentrated. When the solar radiation is reduced the curve is shifted downwards while maintain the I-V curve shape. The current and power output is lower while voltage is not changed significantly. The attached figure above and the figures below was generated through the PVsyst software from a preselected module Temperature A module operates less efficiently if the temperature rises above the standard operating cell temperature of 25 C, but it will also increase in efficiency if the temperature is lower [29, 30, 33]. This is shown below where both the I-V curve and the power curve are shown for the same preselected module used before. The shape of the I-V curve remain the same but shifts to the left at higher temperatures, this indicate lower voltage and lower power outputs also seen in Figure 4-7. The heat increases electrical resistance to flow of electron. Effective 43
56 current output might also decrease if the maximum power point of a module or array drops below the operating voltage of the connected grid. It is therefore important to maintain airflow around all sides of the module, thus removing possible heat build up that can cause high cell temperatures. Some modules offset high temperature problems by having a better temperature coefficient, other use greater number of cells in series to compensate the lower voltage. Figure 4-6 Effect of different temperature on I-V curve, constant irradiance Figure 4-7 Effect of power output with different temperature, constant irradiance 44
57 When considering impact of temperature on the performance it is worth mentioning that there are other measuring systems available, such as Nominal Operating Cell Temperature (NOCT) and PV USA Test Condition PTC. Both of these systems replace cell temperature with ambient temperature, which is a more realistic value for temperature. Maximum power is about % less inn NOTC than compared with STC and PTC is approximately 88% of the rated STC [29, 33]. Below are the test conditions: NOCT [30]: 800 W/m 2 of irradiance 20 C ambient temperature 1.5 AM 1 m/s wind speed, open back side when mounted PTC [34]: 1000 W/m 2 of irradiance 20 C ambient temperature 1 m/s wind speed Shading Shading affects the potential output significantly; even partial shading of PV modules will result in a dramatic output reduction. When a cell, or a module, is shaded it becomes a load which absorbs energy from the circuit. The amount of currents driven through the cell is transformed into heat which could lead to "hot spots" [28, 30]. The effect varies between manufacturer and module models. One of the ways to reduce this effect is by having bypass diodes integrated into the modules, which most of the manufactures use. The bypass diode reduces the effect of shading by preventing current from flowing back into shaded areas. The use of bypass diodes can also be extended by using them between modules to gain the 45
58 same effect. In addition, one often uses blocking diodes to prevent electricity to flow back into the PV modules. Figure 4-8 Example of bypass and blocking diode The resulting effect of shading on a module is depicted below. We are using the same module as previously; this has three bypass diodes each protecting 20 cells to a total of 60 cells per module. When one cell is shaded 80 %, the module experiences a 36% loss in power output. If the same cell is shaded 20 %, the module loses 7.7 % power output. Since 20 cells are protected by one bypass diode, one will have the similar loss if one or all cells within the same group are shaded equally. Now if there is shade on two bypass diode groups the loss is much higher, 91.7 %. 46
59 Figure % shading on one cell within one bypass diode group for one module, I-V curve Figure % shading on one cell within one bypass diode group for one module, P-V curve 47
60 Figure % shading on one cell within one bypass diode group for one module, P-V curve Figure % shading on one cell in 2 bypass diode groups for one module, P-V curve 48
61 4.2 Inverter/MPPT Solar cells create direct current (DC) which must be converted to alternating current (AC) before it can be transferred to the grid or used in a building. For this purpose, we use an inverter. Inverters, which are connected to the power grid, "read" the grid and adjust the frequency and voltage so that it harmonizes with the desired grid conditions. Moreover, the inverter ensures optimum operation of the solar system. Conversion of DC to AC leads to power loss, but most inverters on the market have a high efficiency. Most inverters in the present market convert more than 90 % of DC input to AC output. It is important to acknowledge that an inverter is only as efficient, as described by suppliers, when operated at or near certain outputs, which is often not the case. Therefore, it is usually wise to choose a unit rated at high efficiency over a broad range of loads. Photon Group supplies a ranking list over tested inverters [35]. An excellent inverter can achieve peak efficiencies in the range of 95 97%. In order to achieve such a high efficiency one must evaluate the part load and full load characteristics of an inverter in relation to the characteristics of the PV modules and location [36-38]. This could lead to as much as 30% under/oversized PV array compared to rated inverter capacity. 49
62 Figure 4-13 Typical inverter total efficiency curve (solid line) and DC operating voltage (dashed line) as a function of loading (percentage of nominal DC power), including power limitation losses for input power levels above the inverter nominal power. The inverters maximum efficiency lies at 30% of its nominal power [39]. The energy lost in the conversion process generates heat, and therefore it is important that the inverter be placed in a location with good ventilation. Many inverters can be placed outdoors but preferably in the shade and sheltered from the rain. Inverters also have some built-in security mechanisms to ensure protection of the inverter against faulty power grid, or to avoid power supply into a network, which the network owner has disconnected due to maintenance work. The latter is often referred to as islanding, and it is important for the safety of those performing maintenance on the grid that this is avoided. Security mechanisms operate normally after preset threshold values that vary between different networks. These settings must be defined by the local grid operator and passed on to the supplier of inverter. In Norway, most grid owners accept an inverter that meets German standards, possibly with some adjustments [4]. Some of these elements that should be evaluated are but not limited to [28, 40, 41]: Phase balancing Frequency-based power reduction Reactive power control 50
63 Inverter reconnection conditions Output power control Total Harmonic Distortion (THD) Voltage and frequency ratings compatible with the Norwegian Grid Power factor Total Harmonic Distortion (THD) Limits on the amount of voltage fluctuation and flicker that can be output Withstand a standard lightning impulse Disconnection of the inverter from the electricity distribution network should not result in transient over-voltages beyond specified limits. The DC output current at the inverter output terminals should be very low The German standard, VDE-AR-N 4105: , was provided to me in a translated version by Bernhard Haukland at BKK. There are also work being done by REN [41] for a national standard for Norway, this one is currently on hearing and have not yet been implemented. There are three main inverter types producing AC signals: Square wave o Limited voltage control on output o Limited surge capability o Considerable harmonic distortion (around 44%) o Not applicable to residential systems Modified square wave o Can handle large surges o Much less harmonic distortion (around 30 %) o Certain devices will not operate satisfactory 51
64 True sine wave o High quality waveform o Produces very low harmonic distortion (>10 %) o High surge capabilities o Only alternative for grid tied applications Figure 4-14 Common waveforms produced by inverters [29] From these three versions, the only applicable for residential grid connected use is the true sine wave. In addition, an inverter that is connected to the grid is called Line-commutated fixed-frequency inverters. This means that the frequency of operation is determined by another power source in parallel, such as the local grid, and if this grid frequency disappears (i.e. a power cut), the inverter ceases operation. Shade can result in different operating conditions between modules in the array; this can be the result from different cleanness or shades that affect certain parts of the array, which can severely affect the potential power outputs. Solar cells have an optimal relationship between current and voltage. With modules, this will vary constantly according to light levels, shading, temperature and the characteristics of the solar PV panel, as described under 4.1, and therefore most inverters are equipped with an MPPT (Maximum Power Point Tracker). MPPT is effectively a control algorithm that constantly searches for the optimal operating condition of the array so that efficiency is maintained at a high level [4]. 52
65 Inverters exist with or without transformers integrated. Those without have the highest efficiencies, due to not having losses that occur in the transformer, but will not provide the same protection against DC leakage out to the grid. Since the operating conditions may vary it is important to decide which type of inverter is favourable to the specific arrangement at the site. There are three main categories: Micro Inverter o Dimensioned for one module o Mounted under or integrated into the module o Optimized production from each module o Slightly lower efficiency than string inverters o Beneficial due to less effort in design and system optimization o Possible to disconnect modules from each other, so that the systems are rendered safe for fire-fighters, if a potential fired would break out. Figure 4-15 Micro inverter layout 53
66 String Inverter o Dimensioned for several modules o Several strings can be connected o Higher DC voltage, maximum allowed in Europe is 1000 V [4]. o Configuration of modules in parallel and series to meet the design voltage for the inverter o Often between 1-3 MPPT that enables connecting strings with different orientation or other working conditions to same inverter o Placed in one centralize place for ease of maintenance and optimal operating conditions o Lower cost compared to micro inverter o Possible to get inverter that deliver single phase or three-phase AC current Figure 4-16 String inverter layout 54
67 Central Inverter o Foremost used in large solar parks o Used in systems from 50 kw and up o Largest today are 2 MW often delivered as complete power station with transformer. o Similar connection as string inverter but can have several hundred strings o High efficiency and lower cost compared to string inverter o Often all strings on one MPPT, which means layout of the strings are of outmost importance o Finding errors could be difficult, use of string monitors can alleviate this. String monitor is fitted with fuses for each string and measuring devices for each string. Production is gathered in large cables forwarded to the inverter while monitoring each string is made possible Figure 4-17 Central inverter layout 55
68 4.3 Mounting Systems There are numerous systems available for the mounting of PV panels on a building or to the ground. Below are some of these solutions presented. Picture 4-1 KNUBIX mounting system East/West [42] Picture 4-2 KNUBIX sheds south [43] Picture 4-3 KNUBIX green roof [44] Picture 4-4 Renusol flat roof system[45] Most of these have a fixed angle, usually between 10 to 30. It is also possible to get lower or higher angles, but the two most common are 10 and 20. The most important factor is wind load; a smaller angle gives smaller wind load in the modules and the opposite for higher angles. There are numerous systems; some of the most common for flat roof systems have been shown since that is the case for the proposed building and is a common roof type for commercial buildings. Another important factor is the possibility to attach the mounting systems to the roof or use ballast if one has to avoid penetrating the roof membrane. In addition, an open mounting system receives more ventilation and reduces the module temperature. This thesis does not calculate wind load for proposed system but acknowledge that it is a necessary step in the detailed engineering phase. It is assumed that an angle of 20 will cause negligent effects on the wind load. It is also assumed that the structure can 56
69 handle the weight since it consists of concrete connected panels that already support large ventilation units. 57
70 5. The Solar Resource in Bergen 5.1 Solar Radiation and Meteorology Solar Radiation that enters Earth atmosphere loses some of its energy through absorption or scattering. The remaining radiation that reaches the surface in a direct line is called beam radiation. Scattered radiation that reaches the ground or bounce of the atmosphere is called diffuse radiation. The radiation that bounces off the ground is called albedo. Beam, diffuse and albedo combined is called global radiation [30]. The amount that reaches the surface varies from year to year and from season to season as well as from hour to hour. The variations are caused by motions of the sun as well as climatic conditions and general composition of the atmosphere. Due to this reason, it is important to have accurate solar data from the specific site for a planned PV system. Figure 5-1 Solar radiation in the atmosphere [30, 46] Resource in Bergen The meteorological data is the starting point of an assessment of a project, nevertheless it is also the main source of uncertainty. In Norway, the annual solar radiation on a horizontal 58
71 surface is between kwh/m 2 [47]. There is a large difference between the regions, and between summer and winter. The figure below shows the radiated energy on a horizontal surface, respectively, in January and July. Figure 5-2 Solar radiation on horizontal surface respectively in January and July for Norway [47] From this, we can see that the solar irradiation decreases as the latitude increases The figure does not present an entirely correct picture of the amount of energy that can be used. By placing a solar panel tilted towards the sun, it is possible to reduce the difference shown in the figure. In order to assess the potential of solar energy, it is important to have correct measurement of solar radiation and weather parameters. Solar radiation is measured by means of a pyrheliometer or pyranometer. Accurate measurement of solar radiation can be paired with 59
72 a number of problems, especially in cold northern areas. The measurements are affected by both temperature and solar angle on the sky, and it may give erroneous results. In addition, snowy solar radiation sensors are not particularly accurate. In Norway, the Norwegian Meteorological Institute (MET) is responsible for weather monitoring stations. However none of the stations measure radiated power from the sun (in W/m2) [48]. Solar radiation is also measured by Bioforsk, a national network of monitoring stations within the agricultural sector. However, this is not directly connected to MET and they have no stations close to Bergen. Fortunately the Geophysical Institute at the University of Bergen (UiB) provide irradiation data for Bergen from on their webpage, and they have provided me with their data that is the basis for their graphical presentation on their webpage, they have one station situated at Florida [49]. There are several providers of solar resource estimations depicted as maps. These can be useful when planning at a higher level, to review potential regions within an area that could use solar energy. Unfortunately, most of these do not have readily available information regarding Norway. Some of these are, but not limited to PVGIS, SolarGIS, Meteonorm, RETScreen and NASA. SolarGIS claims to have the lowest uncertainty compared to Meteonorm (2-7% vs. 2-22%) [50], unfortunately it is fairly expensive to buy irradiation maps from SolarGIS and Meteonorm. I have compared weather data from NASA, PVGIS, Meteonorm 7 and UiB. The first two are publicly funded and have data readily available this also applies for UiB, Meteonorm data have been provided by Multiconsult. 60
73 In order to evaluate the quality of data from Meteonorm data is gathered from all of the mentioned sources for Florida. This is where the measurement from UiB is situated, which is within the city centre of Bergen. Figure 5-3 Areas of observation in Bergen County Site: Florida ( N, E) Source PVGIS Meteonorm 7 NASA-SSE RETScreen UiB Solar radiation, horizontal surface (kwh/m2) 790,8 764,2 938,6 775,4 778,1 Ambient temperature ( C) 7,1 8,5 4,7 8,1 7,6 Difference in Solar radiation from Meteonorm 7 1,63 % -1,78 % 20,63 % -0,34 % 0,00 % Table 5-1 Solar resource comparison 61
74 Solar radiation, horizontal surface (kwh/m2) PEC624 Master of Science in Renewable Energy Dissertation As shown in the above table the data from all sources, except NASA-SSE, are within a ±2 % variation. The Meteonorm 7 data have the most conservative values both regarding temperature and solar radiation which correlates well with a similar result from research done by PVsyst [51]. I will therefore use Meteonorm 7 data in the further evaluations. In addition, I have gathered data for two additional areas, Nesttunbrekka 99 and Flesland. Flesland is in the western part of Bergen County and is an area, which is more flat and has fewer mountains that obscure the solar path. Nesttunbrekka 99 is our proposed site, and has less favourable conditions with some mountains covering parts of the view towards south. 160,00 140,00 120,00 100,00 80,00 60,00 40,00 20,00 0,00 Florida Nesttunbrekka 99 Flesland Month Figure 5-4 Solar resource comparison at different sites The resource is very similar for two of the sites. There is only a 0.8 kwh/m 2 per year increase from Florida to Flesland. For NB99 there is a higher difference, 15.8 kwh/m2 per year lower, compared to Florida. It is possible to question the validity of this result since there is only one ground measuring station in Bergen. There are several recognized limits to satellite based measurements of solar radiation[52, 53]. The sensors generally cannot differentiate between clouds and snow cover. The measurements are less precise near mountains, oceans or other large bodies of water, all of which Bergen is surrounded by. All measurements are 62
75 essentially made at the top of the atmosphere and require atmospheric models to estimate the solar radiation on the ground. When Bergen only has one ground station with radiation data, and no other station even has cloud cover estimation, it is difficult to rely on such data. In addition, the Florida station data has already taken into account the blocked solar radiation due to the mountains that surround the site. This means that the values for Bergen are somewhat conservative as a reference compared to areas further west with more open landscape, such as Flesland. As a comparison I have attained precipitation data from MET, this shows that there is less precipitation at Flesland than at Florida (1815 mm compared to 2250 mm at Florida). This could lean towards the notion that the weather situation is slightly better further west than at Florida Month normals for Precipitation [mm] FLESLAND BERGEN - FLORIDA 0 Jan Feb Mar Apr May Jun Jul Aug Sep Oct Nov Dec Figure 5-5 Precipitation for Florida and Flesland Concerning the data, Meteonorm is conservative and from local knowledge, the data for Flesland and Nestunbrekka should at least be at the level depicted in Meteonorm or better. According to Meteonorm the quality of the data shows that for the radiation and temperature data the root mean square error in interpolated monthly radiation values was found to be 7%, and for temperature 1.2 C [54]. The Meteonorm 7 data have irradiation data from and temperature data from
76 6. PVsyst PVsyst are one of several simulation programs available today [55, 56]. There are both PV performance models and hybrid system models; some of these are shown below: PV Performance Models o PV Design Pro o PVsyst o PV*Sol o RETScreen Photovoltaic Project Model o Polysun Hybrid System Models o HOMER o Hybrid2 o RETSCreen o RAPSIM PV performance models estimate the potential power output from a PV system including the BoS components. The performance model incorporates weather data from the specific geographical location. Some of these systems make assumptions to the components while others take into account the manufacturer parameters. Hybrid system models include several sources of energy and storage technology and evaluate which combination serves the specific purpose best. They can also look at grid tied systems and tries to analyse interactions at the utility scale. For more detailed information, regarding the different software, I would recommend to read the Models Used to Assess the Performance of Photovoltaic Systems [55] as a gateway to more knowledge within the different software that are available. 64
77 PVsyst is a photovoltaic system analysis software program developed by the Energy Group at the University of Geneva in Switzerland, by André Mermoud, and can be used at any location that has meteorological and solar insolation data [55, 57]. It is widely used due to the many parameters available for the user to adjust. The complexity of the input parameters makes it suitable for expert users. For plane-of-array (POA) radiation, the default is the Hay (1979) model, though the user can also specify the Perez et al. (1987, 1988) model. In the previous versions (up to V 5), PVsyst favoured the Hay transposition model as default as it was judged more "robust" than the Perez model. In a recent study, Pierre Ineichen found that the Perez model is giving slightly better results (in terms of RMSD of hourly values) in any case. Therefore the Perez model is proposed as default in the version 6 [58], and what will be used in this thesis. PVsyst uses the one-diode equivalent circuit model for calculating performance in crystalline-silicon (csi) and mono thin crystalline silicon wafer surrounded by ultra-thin amorphous silicon layers (HIT) modules. The program allows input from many different weather and solar insolation datasets, including Meteonorm, Satellight, TMY2/3, ISM-EMPA, Helioclim-1 and -3, NASA- SSE, WRDC, PVGIS-ESRA and RETScreen. In addition, a custom input selection allows for importing the essential data from a comma-separated value (csv) file format. PVsyst can utilize many different currencies available in the world, and can model system lifecycle costs, financing, and feed-in tariffs. It also has a 3-D shading tool that allows a user to draw a structure with PV arrays and see potential shading impacts from simulated obstructions. The shading impacts can have a considerable impact on expected yield, thus making it a sensitive area for the simulation [59]. There is also an option to analyse array mismatch to determine more specific I sc and V oc 65

78 parameters, as well as look at cell/module shading and other voltage losses due to wiring, and soiling. Other useful features includes the ability for the user to input known parameters and coefficients if measured data is available for both PV modules and inverters [55]. In the next sub chapters, we will follow the steps in PVsyst software for Project design and add essential information when applicable. Figure 6-1 PVsyst - Main menu Figure 6-2 PVsyst - Project design Grid connected 66

79 6.1 Project design Preferences: Site, Meteo and Albedo Settings One of the important inputs to PVsyst is the weather data for the project site. The geographic location and weather data affect the optimal tilt of the PV modules thus making it important for the overall potential energy production. The site we are evaluating is situated at latitude of 60 N. There is numerous weather files that can be utilized as previously mentioned, here we will look at the conservative number from Meteonorm 7. I have received a Meteonorm 7 file, by Stanislas Merlet from Multiconsult, for our site. This file has been imported into PVsyst with the help of the existing tools in the software. In the file the important values are the monthly horizontal global irradiation and the ambient temperature, in addition we have the optional horizontal diffuse irradiation and wind velocity. When it is not explicitly measured, the diffuse irradiation should be estimated from horizontal global by a model. PVsyst uses the Liu and Jordan s correlation [57]. From the geographic location, we generate the sun path diagram. Figure 6-3 Sun path diagram for Nesttunbrekka 99, solar time 67
80 The sun path diagram shows the user the location of the sun over the course of a year, in legal time. It is important to know that there is a difference between legal time and solar time. The sun moves along the ecliptic rather than along the equator and distance between the sun and the Earth is not constant, thus creating an irregular component between the two. It is possible to observe both in PVsyst. As a further presentation, the following picture illustrates the sun s path through the year. Figure 6-4 Altitude, azimuth and solar path window Solar altitude describes the elevation of the sun above the horizontal plane, always between Azimuth describes the angle from south, positive for western values and negative for eastern values. At true south, called solar noon, the sun will be at its highest altitude for that day. A location s latitude determines how high the sun appears above the horizon, which alters throughout the year as the earth orbit the sun with a tilted axis. The tilt adjusts from at summer solstice, 0 at the equinoxes to at winter solstice in the northern region. The opposite applies to the southern region. The sun s different paths during Summer/Winter solstice and the equinoxes give a solar window as a target to aim PV panels. 68
81 The main thought is to harvest as much energy in the timeframe between hours, solar time[28, 29]. After choosing the imported Meteonorm 7 file as Site and Meteo, we adjust the albedo settings. This is a number for the estimated reflectance of the surroundings. Albedo settings are subject to personal preferences and are an area that could lead to error in the results. The values used have been set in collaboration with Multiconsult from their user experience in Norway for urban area. The albedo values can be adjusted each month in order to take any possible special consideration like snow-cover. The value normally used in the urban localities is in the order of 0.14 to 0.22, and can go up until 0.8 for a snow-cover. The default value in PVsyst is 0.2. Ideally, the best value for a given situation may be obtained by a direct measurement on the site, which it is the ratio of the irradiances measured by a pyranometer turned toward ground, and another one measuring the global horizontal. In practice, except for vertical planes, this value does not take on any great importance, as the albedo component is relatively weak in the incident global irradiation. Moreover for shed systems only the first row is affected by the albedo [57]. 69

82 Figure 6-5 Albedo settings for Nesttunbrekka 99 Regarding design conditions, I have not altered any of the values. These conditions involve design temperatures, which are part of the project and might be altered according to site climate. These parameters are used for design only. They are not involved in the simulation in any way. They represent the following: Lower temperature for Absolute Voltage Limit: o Represents the absolute lower cell temperature, equal to the ambient temperature. As a worst case when the sun suddenly appears on the field and the sun has not had time to heat the modules. This value corresponds well to temperatures seen in Bergen. o Used when determining the maximum possible voltage of the array. The absolute maximum voltage, the open circuit voltage at the lowest temperature, must stay lower than the absolute maximum inverter input voltage and PV module max system voltage. Winter operating temperature for VmppMax design: o Winter minimum cell temperature in operating conditions 70

83 o The maximum array operating voltage has to stay below the maximum inverter voltage Usual operating temperature under 1000 W/m 2 : o Normal operating conditions during summer, not used for sizing constraints Summer operating temperature for VmppMin design: o Maximum cell temperature in operating conditions o Used to determine the array minimum inverter operating range With regard to Summer VmmpMin and winter VmmpMax they are debatable and one should consider evaluate them against site dependent highest and lowest temperature [p.88, 30]. I will not use those numbers, as the default numbers are sufficient for this preliminary study. Figure 6-6 Design conditions Array max. voltage: o Is a maximum permissible array voltage (Voc at minimum temperature), specified on the PV modules. The IEC standard requires 1000 V (European standard), the UL standard for use in the US is limited to 600 V. 71
84 muvoc value: o The Voc (Tmin) is normally calculated by the one-diode model. This option allows the use of a derate factor muvoc specified by the manufacturer. Limit overload loss for design: o The inverter sizing is based on an acceptable loss during the year, fixed at maximum 3% by default. This parameter allows increasing the limit in order to define vastly oversized PV array by respect to the inverter. Under the Other limitations the constraints concerning limits in the 3D construction can be modified, none of these has been altered. 6.2 Orientation Numerous technologies can be explored in this part of the software. Alternatives are from fixed tilted plane, season tilt adjustment, tracking axis of different sort, double orientation to unlimited sheds. I will in this assignment focus on the simplest system that uses fixed tilted sheds. In PVsyst near shadings simulation, the mutual shading of sheds can be computed in two different ways. Orientation only takes into consideration the tilt and direction of the PV modules. PVsyst has a wide variety of settings and illustrate optimum relations between the two. This tool makes use of the Monthly Meteo calculations, which perform quick transpositions from the Monthly Meteo values. The whole calculation for the curves is performed for several situations, in both directions from the point you have chosen. This tool therefore only gives a quick estimation, which may be different from the real values in the detailed simulation [58]. The basic computation is assumed linear (without electrical 72

85 cells effects) and for unlimited length (that is, neglecting edge effects on both edges of the sheds). As an example, PVsyst recommends to adjust the PV module, one with fixed plane, facing direct south with an inclination of 40 for optimum all year setting in Bergen. This would be favourable if we had an inclined roof with these specifications that could be covered. Figure 6-7 Optimum orientation fixed tilted plane. For the proposed building, the roof is flat with technical rooms for ventilation that are placed in the middle (see Figure 3-2Figure 3-2). In order to maximize available area we need to install multiple rows of solar panels. By explicitly defining a PV plane as sheds in the "Near shading" scene, the computation accounts for shed edges and a module partition can be defined. I have evaluated several conditions that will be presented further out in the paper. 6.3 Horizon Within horizon in PVsyst, the user is able to incorporate shading effect of object, such as houses or mountains that are sufficiently far away. They act on the PV field in a global way. 73

86 At a given instant, the sun is or is not visible on the field. Typically, the distance of these shading objects should be higher than ten times the PV field size. For our case, the typical length of the area that could be utilised for PV modules is approximately 50 meters, which gives us a distance of up to 500 meters where object should be accounted for. Objects that are nearer and higher than the set horizon are set in Near Shadings. Horizon measurements, that list heights and azimuth of some significant points, can be obtained onsite with a compass and a sun path diagram, a detailed map, panoramic, fish-eye photography or other suitable instruments. In Meteonorm it is possible to create a horizon file to import into PVsyst [60]. It uses detailed maps produced from NASA s SRTM radar to produce 90x90 m resolution of the existing topography. For this preliminary study, this is found to be sufficient, as the only taller object in the mentioned vicinity is a hill ridge that is accounted for into the horizon file. Figure 6-8 Far horizon profile for NB Detailed Losses Detailed losses comprise of several subfield that take into consideration thermal losses, ohmic losses in wiring, module quality mismatch, soiling losses, Incident Angle modifier 74
87 (IAM) and unavailability. Most of these are subject to personal preferences and they could lead to substantial source of error in the calculations. Most of these have been kept at their default value since the default values are experiences that the team behind PVsyst have gathered for Europe. I will present the values that have been changed in collaboration with Multiconsult Oslo. Field Thermal Loss Factor is set to Free mounted modules with air circulation. This since we have specified an open arrangement in chapter 6.5. The values are debatable which PVsyst team also acknowledges [58]. Module efficiency is set to 0 % loss, this is due to the chosen PV module is documented from the manufacturer to at least have the specified efficiency with potentially +3 %. Specific monthly values for soiling loss have been defined in accordance with Multiconsult. They take into consideration periods when snow could cover the modules. We have not specified any other losses due to dust or fouling the rest of the year as this would most likely be negligent and could be alleviated by scheduling periodically cleaning of the surfaces by the local caretaker. The values are: o 70 % loss in January and February o 40 % in March o 50 % in December 75
88 6.5 Near Shadings Figure 6-9 The Nesttunbrekka site Near shadings is where the site s buildings and potential shade from nearby objects are taken into consideration. Since we want to maximise potential PV generated energy this is where we can establish how much of the available area is usable. I have chosen to focus on one of the more simple technologies, multiple sheds. I have not considered other alternatives within this thesis. One might get somewhat higher results with double orientated sheds, seasonal tilt or tracking planes. Unfortunately, the team behind PVsyst have not yet managed to estimate shading calculations accurately for these types and I have therefore chosen to not evaluate these solutions [58]. In the main menu, it is possible to construct the site in 3D, implement shading obstacles, and arrange the proposed layout of the modules themself. In addition, one can simulate shading in three ways: Linear: Represents lower limit to shading According to module strings: Represents the upper limit to shading 76

89 Detailed, according to module layout: Calculates the electrical effect of the partial shading between modules in the array. Does not affect the calculations at the present day, will be implemented in a later version and serves only as a pedagogical tool. Figure 6-10 Near shading definition Within the Construction/Perspective window, the building and the PV panels can be constructed. It is not possible to import drawings from other software and there are only a few types of building blocks defined. To construct the building I had to use different types of blocks and connect them. Measurements have been taken from AutoCAD drawings, and all lengths and sizes, except for the curved parts, are exactly as in the drawings. 77
90 Figure 6-11 Scene created for NB99 Sides of the building to the North East side have not been populated with PV modules since they will be shaded by the technical rooms on the roof most part of the day. In the preliminary studies, it became evident that the roof structure of NB 99 was not sufficient to cover the lowest criteria for the Energy Label and it was necessary to utilise all the available roof area of the three buildings. By doing so we increase the total installed capacity and would lead to reduced costs per Wp, which will be explained under Yield, Costs and Economic Evaluation. When designing the layout of the module one cannot only consider optimum tilt. As explained, under Mounting Systems, one also has to consider available mounting systems. Due to the design of the roof, wind load and optimum distance between rows to the chosen system, tilted sheds, I have been advised by Multiconsult to use an angle of 20. This is the most common system readily available. It will also reduce the necessary distance between module rows. The figure below illustrates the correlation between sizes, pitch and distance between rows. With a quick calculation within orientation 78
91 a 10 angle will reduce the potential yield by approximately 10 % and 20 will have a reduction of 4.3 % compared to optimum tilt of 40. Figure 6-12 Shading of collectors [61] PVsyst takes into account the effect of shading on the next row. The effect can be studied by going back to orientation and choosing unlimited sheds. After studying the effect, it is important to change back to previous setting (fixed tilted plane with chosen tilt and azimuth) or else there will be a conflict between orientation and near shading and the shading effect could be calculated twice. 79

92 Figure 6-13 Unlimited sheds Figure 6-14 Unlimited sheds, optimisation 80

93 Figure 6-15 Unlimited sheds, shading graph From the figures depicted above we see that sheds tilted at 20, towards south, with a distance of 2.5 meters between rows gives a good balance between maximizing area, received energy and losses from shading. When compared to the horizon which is approximately 10 in the solar window we are not losing too much of the available solar irradiation throughout the year. 6.6 System Since this thesis has a broad topic, I am unable to present several module systems with specific prices. After numerous discussions with both Multiconsult and Norwegian solar companies, it is best suited to operate with estimated costs for the installation. I have therefore based my reference panel and inverter on recommendations from Multiconsult. 81

94 The reference panel is ITS EcoPlus-PolyUp 250 W and SMA Sunny Mini Central 7000 TL both attached in Appendix D. Figure 6-16 System overview 82

95 Figure 6-17 System sizing With the available 600 m 2 we can fit 360 modules divided over 12 inverters with 15 panels in series and 24 strings. This would give us an installed nominal power of 90 kwp. The area in use is slightly less than 600 but is seen as irrelevant in respect to the shading analysis in the software [58]. The inverter power is slightly lower than the rated power of the combined modules, this is also seen as regular as inverters can tolerate peak power outputs for several seconds. From the system sizing we can see that the Vmpp is within the conditions of the array at all times. 83
96 6.7 Yield, Costs and Economic Evaluation As mentioned in previous section, it is difficult to attain a specific price for the costs of a PV system. The unit cost for PV equipment varies significantly and one will never know final cost until the system is installed. There are a limited number of projects, in Norway, that cost data for grid-connected systems could be based on. As budget estimate, it is common to use from NOK per Wp, lowest for larger systems and higher for small systems. I have gathered approximately costs for a system close to 100 kwp: Component NOK/Wp PV Panels 4-8 Inverter 2-3 Mounting system 2-3 BoS components, labour and premium on the products from suppliers 5-6 Total Table 6-1 Approximately cost values In agreement with Multiconsult I will assume that the base cost would be at 15 NOK/Wp. For a residential house below 10 kwp the price would be between to NOK/Wp. 84
. This is a system with an installed nominal power of 90 kwp. At a price of 15 NOK/Wp the system would cost 1 350 000 NOK, excluding taxes.")
97 Figure 6-18 View of proposed system from above PVsyst have calculated that for the proposed building it is possible, when utilizing all area available on all three buildings, that the system could produce kwh/year (Appendix E). This is a system with an installed nominal power of 90 kwp. At a price of 15 NOK/Wp the system would cost NOK, excluding taxes. The lifetime of the solar panels can be expected to be substantially longer than 20 years, although the production will be reduced as the panels degrade. Inverter will most likely have to be replaced after ten years but could last as long as 20 years but then with repairs during the 20 years time period. Except from replacing the inverters the maintenance is assumed to be low or manageable to the buildings caretaker as part of his routine, and set to 1% of initial cost of the system together with insurance. Most companies expect a return on investments between 5-10 % per year, 85
98 and the government inflation rate in Norway is set to 2.5 %. PVsyst computes the annual financial cost, supposing a loan pay back as constant annuities. This procedure is justified by the fact that, as a contrary to a usual energetic installation, when purchasing a solar equipment the customer buys at a time the value of the whole energy consumed during the projected time period. The running costs depend on the system type. For a grid-connected system these are usually very reliable, they are limited to an annual inspection, eventually some cleaning of the collectors and the insurance fees. Some inverter suppliers provide a long-term payable warranty, including replacement, which are similar to insurance [58]. The resulting report from PVsyst warrants a price of the proposed system at 2.15 NOK/kWh with an interest rate of 5 % over 20 years. I have been unable to get information, in time, regarding the electricity prices currently paid today for the case building. The building has also not completed a full year of use, so the numbers would be incomplete. In addition the tariff includes a power variable calculated by using the maximum load power peak within the building during one month. To estimate if the PV system could reduce this peak tariff the system would have to produce power at exactly the same time, which would be impossible to predict. I have attached some economic calculations in Appendix F Economics, which looks into variations in costs, estimated electricity price for the building and takes into account inflation. The main results are shown below: 86
99 Period 20 years Discount Rate 5,00 % Inflation 2,50 % Investment NOK SUM Investment Maintenance and Repair Power production Averaged NOK/kWh 1,84 Cost per kwh over 20 years with 5 % Discount Rate, 2,5 % Inflation and 0,75 % panel degradation - Base Case Period 20 years Discount Rate 10,00 % Inflation 2,50 % Investment Maintenance SUM Investment Maintenance and Repair Power production Averaged NOK/kWh 2,62 Cost per kwh over 20 years with 10 % Discount Rate, 2,5 % Inflation and 0,75 % panel degradation - Increased Discount rate Table 6-2 Results from present value Disregarding increased revenue from rent prices Estimated production from PV Revenue if all is sold Revenue if used inhouse January 26 kwh 6 NOK 26 NOK February 237 kwh 53 NOK 239 NOK March kwh 614 NOK NOK April kwh NOK NOK May kwh NOK NOK June kwh NOK NOK July kwh NOK NOK August kwh NOK NOK September kwh NOK NOK October kwh 505 NOK NOK November 343 kwh 77 NOK 346 NOK December 48 kwh 11 NOK 48 NOK Year kwh NOK NOK Table 6-3 Maximum and minimum revenue from generated electricity 87
100 Period 20 years Discount Rate 5,00 % Inflation 2,50 % Investment Maintenance Rent ,00 SUM Investment (Annual payment) Maintenance and Repair Sum Investment, Maintenance and Repair Increased Rent NPV Power production Averaged NOK/kWh 0,88 Table 6-4 Net present value per kwh over 20 years with 5 % discount Rate, 2,5 % inflation, 0,75 % panel degradation and increased revenue from rent prices 88
101 7. Discussion As depicted in chapter 3, the incentives to establish a PV plant on a commercial building in Norway are few. The two most promising areas are Energy Label and BREEAM NOR. Thus, such a system is only potentially beneficial to a building owner that seeks to rent out to companies that have an environmental profile. The building owner could possibly increase the rent if the tenant sees the benefit as a value towards their public reputation. A better Energy Label or BREEAM NOR grade could make it easier to rent out the office areas or sell the building quicker for a building owner, according to BACKER they estimate that the increased rent when offering a building with a Energy Label A and BREEAM NOR certified is NOK/m 2. This does however not say anything about the grade achieved in BREEAM NOR or show the specific cost for each measure. BREEAM NOR is not as widely used, since it is not a mandatory system in Norway, and would not affect a building owners decision in the same way as Energy Label. It is difficult to set a price on these benefits and is only possible for a building owner with a good market understanding. The alternative cost for the case building is estimated between Million NOK to go from a B to an A for the Energy Label. This enables a reduction of 40 kwh/m 2, while our PV system could reduce the usage by kwh/m 2. Assumed linear, although not correct, the cost per m 2 would be NOK/m 2 with previously explained conventional methods. With the installation of a PV system, the cost would be 452 NOK/m 2. This means that already today a PV system can compete with conventional methods to achieve a better Energy Label. By implementing a PV system to shave of the last kwh/m 2 to reach an A in Energy Label, the cost reduction would certainly be lower compared to conventional methods since 89
102 the conventional cost would increase the closer one gets to an A. This could be true for BREEAM NOR as well, unfortunately have I not found any supporting evidence for this. With regard to economic feasibility, it is evident that one must evaluate the alternative cost mentioned earlier. With a PV system, there will be cyclic variation in generated energy from year to year depending on the weather, while with conventional building methods one would be surer that the reduction would be permanent. I have not found any evidence, since there are few projects that have utilised the use of a solar system to achieve a better Energy Label, that there is a demand to log actual production each year in order to see that the solar equipment produces as specified. In Chapter, 5.1.1, the solar resource for the Bergen area was established. The findings showed that the proposed site received less solar radiation than the other sites. Since Bergen only have one ground station that measures solar radiation and the area is covered with elements that reduce the accuracy of satellite based radiation measurements the actual validity of these values are questionable. Especially since the ground station takes into account local topography that reduces the solar radiation and values found elsewhere are either similar or reduced. This could lead to the thought that losses due to horizon is effectively accounted for twice. This would at least mean that solar radiation values for Bergen are at least the values listed from UiB and Meteonorm 7 or possibly better. The use of PVsyst to estimate the potential energy generated on the case building showed that the use of such a program is best left to expert users. There are numerous areas where the person using the software could potentially corrupt the results. Since the use of the software was for a building that did not have a PV system installed, it is not possible to 90
103 evaluate if the software deliver precise calculations or if the results are erroneous compared to an installed PV system. The results are based on the use of preferences evolved from experience at Multiconsult in Oslo. Based on this I would assume that the real results should be approximately the results estimated by PVsyst. This is a preliminary study with the goal of learning the software and using it to estimate the potential, based on studies evaluating software toward actual systems it was found that PVsyst was within an accuracy of 5 %[57, 62]. Generally, PVsyst provides conservative estimates. A Photon review states that PVsyst overestimates by 6 % but this was refuted by the team behind PVsyst claiming errors in measured irradiation data [63]. I have not been able to get a hold of this report and have only seen the report where PVsyst refutes this claim. According to a paper from CATPROJECTS: There are a large number of uncertainties that influence the energy yield resulting from PV modelling software tools. As such, the modelling tools are not able to provide a very precise prediction of future output. However, if the models are created by experienced users with available high quality input data, and uncertainties can be minimised, energy yield projections can be obtained that are comparable to actual yield. [62] This sums up the experience with PVsyst as a powerful tool with good accuracy as long as the user is experienced in the software and with good knowledge of how a PV system behaves. 91
104 8. Conclusions The use of a PV system to achieve a better Energy Label, and BREEAM NOR grade, is possible in the Bergen region. It is highly important to have a building that is suited for this. For the case building it was not enough to only use the building s roof, the surrounding roofs had to be used as well. This means that each building has to be evaluated independently and it is not possible to make a general assumption. The thesis shows that for the case building it is possible, with base parameters to: Go from a B to an A for the Energy Label, with a potential reduction of kwh/m 2 when using all available roof area from the three buildings. Achieve a 6 % increase in BREEAM NOR grade. Compete with conventional building methods, in costs, to achieve a better Energy Label. The weather data for Bergen is with the use of Meteonorm 7 data assumed conservative. The solar radiation could potentially be higher in Bergen than projected with the used software. There are limited sources for ground stations measuring solar radiation in Bergen, which limits the possibility to evaluate the potential adequate. PVsyst is found to be a good tool to simulate a PV system with projected yield, most likely will the results be conservative. The software is only good as long as the person using it is an expert within the solar engineering field and the software. 92
105 The economic evaluation must be seen together with the alternative cost to achieve the same result concerning Energy Label and BREEAM NOR. To calculate this is difficult since alternative cost to reduce energy usage in the building is not linear. 93
106 9. References 1. Fakta om energi - SSB. 2013/06/02/18:24:51; Available from: Ressursgrunnlag - Fornybar.no. 2013/12/08/17:22:41; Available from: 3. Boxwell, M., Solar Electricity Handbook: A Simple, Practical Guide to Solar Energy-- designing and Installing Photovoltaic Solar Electric Systems. Sixth ed. 2012: Greenstream Publishing. 4. Solstrøm i Norge Enova. 2013/08/28/19:29:02; Available from: 5. LOV nr 50: Lov om produksjon, omforming, overføring, omsetning, fordeling og bruk av energi m.m. (energiloven). 2013/08/23/12:57:57; Available from: 6. /d: FOR :d/ Forskrift om kontroll av nettvirksomhet. Økonomisk og teknisk rapportering, inntektsramme for nettvirksomheten og tariffer Nettvirksomhetskontroll Forskrift om økonomisk og teknisk rapportering, inntektsramme for nettvirksomheten og tariffer. 2013/08/28/19:49:12; Available from: 7. Plusskundeordningen - Fornybar.no. 2013/08/28/20:07:54; Available from: 8. FOR nr 489: Forskrift om tekniske krav til byggverk (Byggteknisk forskrift). 2013/08/24/13:21:30; Available from: 9. Energikrav i TEK /08/26/15:20:49; Available from: FOR nr 1665: Forskrift om energimerking av bygninger og energivurdering av tekniske anlegg (energimerkeforskriften). 2013/08/23/13:06:10; Available from: Energimerking.no. 2013/08/23/15:01:55; Available from: ProgramByggerne ANS. 2013/09/17/18:13:50; Available from: validering [SIMIEN Wiki]. 2013/09/17/18:17:47; Available from: English Norwegian Green Building Council. 2013/09/09/18:35:06; Available from: Laleman, R., J. Albrecht, and J. Dewulf, Life Cycle Analysis to estimate the environmental impact of residential photovoltaic systems in regions with a low solar irradiation. Renewable and Sustainable Energy Reviews, (1): p Prakash, R. and I.K. Bhat, Energy, economics and environmental impacts of renewable energy systems. Renewable and Sustainable Energy Reviews, (9): p
107 17. Lee, W. and J. Burnett, Benchmarking energy use assessment of HK-BEAM, BREEAM and LEED. Building and Environment, (11): p Norges vassdrags- og energidirektorat. 2013/09/15/16:03:37; Available from: Norges vassdrags- og energidirektorat - Plusskundeordning. 2013/09/15/16:12:32; Available from: bkk.no: Egen nettleie for plusskunder. 2013/09/15/16:44:53; Available from: bkk.no: Tariff for plusskunder. 2013/09/15/16:42:08; Available from: Our history and our mission - Enova. 2013/09/18/13:05:24; Available from: Enova, Støtte til Solcelleanlegg på næringsbygg, A. Svanbring, Editor About ZERO ZERO. 2013/09/18/13:06:44; Available from: Om oss. 2013/09/18/13:07:50; Available from: Solcellenotat - ZERO ZERO. 2013/09/18/13:24:56; Available from: Up to NOK 130 million for Innovation Projects for the Industrial Sector - The Research Council of Norway. 2013/09/18/13:32:25; Available from: 108?progId= &visAktive=true. 28. Häberlin, H., Photovoltaics System Design and Practice. 2012: Wiley. 29. International, S.E., Photovoltaics: Design and Installation Manual : Renewable Energy Education for a Sustainable Future. 2004: New Society Publishers. 30. Markvart, T., Solar Electricity. 2000: Wiley. 31. Module Circuit Design PVEducation. 2013/09/23/13:33:27; Available from: Harness the Sun, PV modules in a string. 2013/09/23/13:54:06; Available from: /learn_about/08_solar_page_010.htm. 33. Solanki, C.S., Solar photovoltaics: fundamentals, technologies and applications. 2011: PHI Learning Pvt. Ltd. 34. Marion, B., et al. Performance parameters for grid-connected PV systems. in Photovoltaic Specialists Conference, Conference Record of the Thirty-first IEEE IEEE. 35. PHOTON Info. 2013/10/22/14:45:24; Available from: Notton, G., V. Lazarov, and L. Stoyanov, Optimal sizing of a grid-connected PV system for various PV module technologies and inclinations, inverter efficiency characteristics and locations. Renewable Energy, (2): p Burger, B. and R. Ruther. Site-dependent system performance and optimal inverter sizing of grid-connected PV systems. in Photovoltaic Specialists Conference, Conference Record of the Thirty-first IEEE IEEE. 95
108 38. Khatib, T., A. Mohamed, and K. Sopian, A review of photovoltaic systems size optimization techniques. Renewable and Sustainable Energy Reviews, : p Burger, B. and R. Rüther, Inverter sizing of grid-connected photovoltaic systems in the light of local solar resource distribution characteristics and temperature. Solar Energy, (1): p /d: FOR :d/ Forskrift om leveringskvalitet i kraftsystemet. 2013/10/17/20:34:02; Available from: html. 41. Forside - Rasjonell Elektrisk Nettvirksomhet AS. 2013/10/17/20:30:29; Available from: Mountingsystem East-West. 2013/11/24/14:04:01; Available from: Mountingsystem South. 2013/11/24/14:34:11; Available from: Galery. 2013/11/24/14:46:22; Available from: ntext817%5d%5bgalleryuid%5d=2&tx_yag_pi1%5baction%5d=submitfilter&tx_yag_ pi1%5bcontroller%5d=itemlist&chash=5cebbaf739269b0d1f6ff PV Mounting flat roof and ground mounting. 2013/11/24/16:26:02; Available from: Duffie, J.A. and W.A. Beckman, Solar Engineering of Thermal Processes. 1991: Wiley. 47. Solenergiressursen i Norge - Fornybar.no. 2013/10/31/11:23:42; Available from: Publikasjoner /11/05/15:17:11; Available from: Geofysisk institutt -Været i Bergen. 2013/11/05/15:22:35; Available from: Comparisons: SolraGIS Versus Other Solar Databases. 2013/10/31/11:22:18; Available from: Meteo data comparisons. 2013/11/19/16:25:32; Available from: Solar Data Warehouse. 2013/11/15/20:38:29; Available from: Indira Karakoti, A.D.a.S.K.S. Validating satellite-based solar radiation data with ground measurements. 2013/11/15/20:32:34 [cited 2013; Available from: Meteonorm: Version /11/17/14:13:07; Available from: Klise, G.T. and J.S. Stein. Models Used to Assess the Performance of Photovoltaic Systems. Available from: Solar photovoltaic software - Appropedia: The sustainability wiki. 2013/09/21/16:00:12; Available from: PVsyst Main webpage. Available from: 96
109 58. PVsyst 6 Help. 2013/11/19/17:15:42; Available from: Deutsche Gesellschaft für Sonnenenergie, Planning and Installing Photovoltaic Systems: A Guide for Installers, Architects, and Engineers. 2005: James & James/Earthscan. 60. Meteonorm: Horizon. 2013/11/19/18:07:02; Available from: Bany, J. and J. Appelbaum, The effect of shading on the design of a field of solar collectors. Solar cells, (3): p Lee, G.R., L. Frearson, and P. Rodden, AN ASSESSMENT OF PHOTOVOLTAIC MODELLING SOFTWARE USING REAL WORLD PERFORMANCE DATA. 63. Mermoud, A. Note about the PHOTON simulation software survey (English). University of Geneva 2011; Available from: 97
110 10. Appendices 98
111 10.1 Appendix A Reference Model 99

112 100

113 101
114 102
115 10.2 Appendix B Energy Label TEK10 with Heat Pump, PV Covers 18% Specific Electricity: 103
116 104
117 105
118 106
119 Energy Label TEK10 with Heat Pump, PV Covers 20 % Specific Electricity 107
120 108
121 109
122 Energy Label TEK10 with Heat Pump and PV Covers 20 % Room Heating, 20 % Tap Water Heating and 9 % Specific Electricity 110
123 111
124 112
125 113
126 Solar radiation, horizontal surface (kwh/m2year) PEC624 Master of Science in Renewable Energy Dissertation 10.3 Appendix C Weather Data Site: Florida ( N, E) Source PVGIS Meteonorm 7 NASA- SSE RETScreen UiB Solar radiation, horizontal surface (kwh/m2) 790,8 764,2 938,6 775,4 778,1 Ambient temperature ( C) 7,1 8,5 4,7 8,1 7,6 1,63 0,00 Difference in Solar radiation from Meteonorm 7 % -1,78 % 20,63 % -0,34 % % 1000,0 Solar Resource Comparison 900,0 800,0 700,0 600,0 500,0 400,0 300,0 200,0 100,0 0,0 PVGIS Meteonorm 7 NASA-SSE RETScreen UiB 114
127 Solar radiation, horizontal surface (kwh/m2) PEC624 Master of Science in Renewable Energy Dissertation Solar radiation, horizontal surface (kwh/m2) JanuaryFebruary March April May June July August SeptemberOctoberNovember December Year Florida 5,80 19,30 48,50 89,70 135,20 136,50 128,60 100,20 59,40 27,70 9,30 3,90 764,20 Nesttunbrekka 99 4,50 14,40 50,10 105,10 131,10 141,50 126,10 81,90 56,90 26,80 7,20 3,00 748,40 Flesland 5,80 19,30 48,80 90,50 135,20 136,70 128,50 99,70 59,40 27,80 9,40 3,90 765,00 160,00 140,00 120,00 100,00 80,00 60,00 40,00 Florida Nesttunbrekka 99 Flesland 20,00 0,00 Month Month normals for RR, Precipitation [mm] St.no Jan Feb Mar Apr May Jun Jul Aug Sep Oct Nov Dec Year FLESL AND BERGE N - FLORI DA Month normals for Precipitation [mm] FLESLAND BERGEN - FLORIDA 50 0 Jan Feb Mar Apr May Jun Jul Aug Sep Oct Nov Dec 115
128 PVGIS PVGIS Month Hh Hopt H(20) Iopt D/G TD T24h No days in the month Mean Monthly Solar Radiation Horizontal [kwh/m2] Jan ,00 6,45 Feb ,25 18,56 Mar ,00 51,15 Apr ,00 94,20 May ,00 132,68 Jun ,00 152,70 Jul ,00 137,64 Aug ,00 99,51 Sep ,00 59,40 Oct ,00 25,64 Nov ,00 8,82 Dec ,00 4,03 Year ,78 Hh: Irradiation on horizontal plane (Wh/m2/day) Hopt: Irradiation on optimally inclined plane (Wh/m2/day) H(20): Irradiation on plane at angle: 20deg. (Wh/m2/day) Iopt: Optimal inclination (deg.) D/G: Ratio of diffuse to global irradiation (-) TD: Average daytime temperature ( C) T24h: 24 hour average of temperature ( C) 116
129 Meteonorm 7 117
130 118

131 119
132 NASA-SSE Month No days in the month Daily solar radiation - horizontal Mean Monthly Solar Radiation Horizont al kwh/m2/d kwh/m2 January 31,00 0,28 8,68 February 28,25 0,94 26,56 March 31,00 1,97 61,07 April 30,00 3,62 108,60 May 31,00 5,25 162,75 June 30,00 5,49 164,70 July 31,00 4,93 152,83 August 31,00 3,95 122,45 September 30,00 2,49 74,70 October 31,00 1,19 36,89 November 30,00 0,46 13,80 December 31,00 0,17 5,27 Annual 2,56 938,30 120
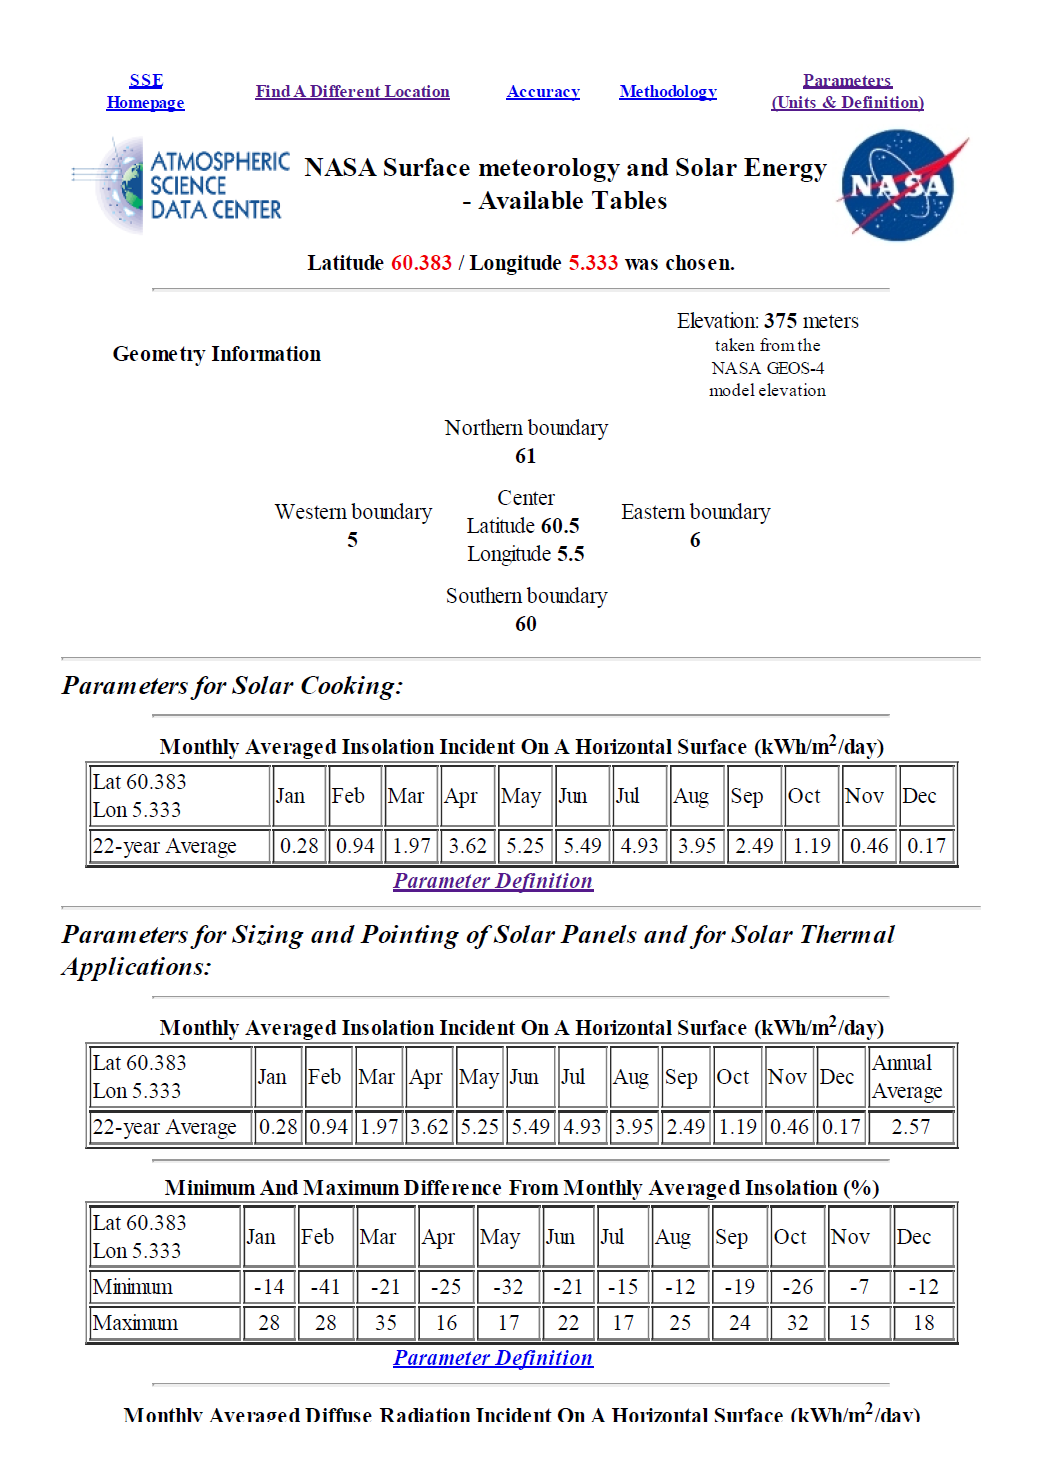
133 121
134 RETScreen Month Air temperatur e Relative humidit y Daily solar radiation - horizonta l Atmospheri c pressure Win d spee d Earth temperatur e Heatin g degreedays Coolin g degree -days C % kwh/m2/ d kpa m/s C C-d C-d January 2,30 81,1 0,21 96,2 4,0-3, February 2,10 77,4 0,73 96,4 3,8-3, March 3,40 74,3 1,66 96,5 3,8-1, April 6,60 70,6 3,07 96,7 3,6 3, May 10,50 71,0 4,29 97,0 3,4 8, June 13,10 74,7 4,69 96,8 3,2 12, July 15,10 77,6 4,21 96,9 3,0 14, August 15,10 79,3 3,31 96,9 2,9 13, Septembe r 12,00 80,0 1,90 96,7 3,0 8, October 8,60 80,6 0,90 96,4 3,3 4, Novembe r 5,00 80,6 0,31 96,5 3,6 0, Decembe r 3,00 82,9 0,12 96,4 3,7-2, Annual 8,1 77,5 2,12 96,6 3,4 4,
135 Month No days in the month Mean Daily Monthly solar Solar radiation - Radiation horizontal Horizontal kwh/m2/d kwh/m2 January 31,00 0,21 6,51 February 28,25 0,73 20,62 March 31,00 1,66 51,46 April 30,00 3,07 92,10 May 31,00 4,29 132,99 June 30,00 4,69 140,70 July 31,00 4,21 130,51 August 31,00 3,31 102,61 September 30,00 1,90 57,00 October 31,00 0,90 27,90 November 30,00 0,31 9,30 December 31,00 0,12 3,72 Annual 2,12 775,42 123
136 UiB Sum of kwh/m2month Column Labels Row LabelsJanuary February March April May June July August September October November December Grand Total ,20 144,41 111,92 164,48 98,44 59,14 28,49 11,60 4,63 707, ,06 14,53 48,71 113,80 115,02 140,30 137,74 107,20 49,25 27,87 10,15 4,67 777, ,86 14,28 35,13 79,47 106,74 132,88 107,96 85,59 62,85 22,68 7,58 4,01 665, ,72 23,38 41,19 105,95 136,44 138,88 150,30 141,84 67,33 32,42 11,16 3,87 859, ,44 27,73 73,57 91,90 140,21 155,39 92,13 139,92 49,90 22,00 8,89 4,44 811, ,76 22,72 60,60 97,93 135,11 178,89 108,27 94,85 56,01 26,68 9,66 4,03 802, ,92 18,33 42,09 87,10 116,19 148,74 130,46 105,13 64,79 25,39 7,56 2,95 754, ,62 21,99 52,70 85,97 140,40 108,87 150,92 105,58 68,00 26,67 8,91 2,85 779, ,37 21,69 37,77 101,62 105,79 135,46 135,16 91,47 53,46 34,05 9,06 3,65 734, ,92 14,93 69,35 124,61 167,79 176,70 118,70 97,45 43,58 43,15 8,93 2,78 871, ,04 20,47 65,92 90,03 117,98 151,49 147,65 115,75 41,94 30,05 8,71 3,28 798, ,83 17,40 67,68 94,58 115,93 125,74 139,35 134,16 72,39 27,84 9,80 5,19 817, ,31 26,48 49,02 85,87 153,87 141,77 154,88 102,21 57,50 23,10 8,44 3,09 813, ,16 22,54 44,70 107,41 139,51 139,59 119,36 106,30 58,15 22,84 6,02 4,59 777, ,45 26,19 47,48 79,41 100,86 116,63 113,33 94,74 47,33 33,82 9,61 4,23 682, ,04 20,00 60,46 95,32 159,81 133,53 155,19 91,97 39,90 28,87 10,51 3,45 807, ,67 26,30 50,28 105,84 133,94 112,31 112,87 97,77 47,76 26,99 9,05 5,42 735, ,43 20,05 42,63 74,26 121,79 202,75 151,40 100,19 43,53 34,49 8,34 3,71 809, ,38 22,16 48,39 86,62 91,16 144,68 127,75 95,87 50,12 22,08 8,14 3,70 706, ,64 18,01 65,98 107,15 137,38 155,62 133,83 107,33 67,95 22,45 7,48 2,82 834, ,37 19,31 54,18 84,16 148,24 145,66 120,45 73,32 60,42 20,06 11,31 3,47 747, ,58 28,03 41,83 103,28 78,07 195,45 126,76 96,44 54,89 19,86 6,72 3,10 762, ,50 19,74 53,63 83,39 144,72 122,26 149,02 100,92 61,22 21,40 9,04 3,50 776, ,89 20,08 61,99 90,93 130,38 167,13 107,58 93,44 43,45 23,86 9,89 2,99 756, ,92 13,81 37,16 100,00 112,79 149,58 150,32 69,15 55,83 26,07 8,61 3,80 730, ,97 10,41 27,35 60,71 165,66 139,20 140,20 87,76 54,39 27,47 11,32 2,96 731, ,48 23,95 41,21 93,56 150,98 122,04 156,26 83,67 53,07 29,09 7,54 2,92 769, ,88 14,56 43,04 82,91 140,52 161,07 124,33 75,76 49,08 36,92 7,32 2,56 742, ,55 15,77 50,20 101,12 149,52 177,07 94,43 92,37 76,07 26,06 9,99 3,49 801, ,15 28,44 38,41 61,15 158,29 84,90 144,17 104,16 63,49 26,95 6,93 3,37 726, ,97 15,96 42,58 92,78 130,77 157,00 126,25 122,77 62,62 20,51 11,23 5,63 794, ,67 21,69 78,96 91,44 112,26 139,59 104,47 110,95 85,86 24,22 11,19 4,44 793, ,39 13,15 43,27 96,82 143,62 164,05 148,93 125,28 48,50 26,98 10,40 3,98 831, ,67 12,37 39,36 94,00 165,63 114,34 96,10 90,98 58,23 32,49 11,45 3,80 725, ,89 18,20 38,81 87,73 141,34 110,83 131,30 134,58 52,76 29,20 6,99 4,07 761, ,75 18,31 46,84 82,52 146,54 127,01 129,24 83,71 70,16 22,35 10,37 3,43 746, ,76 25,07 66,25 93,31 141,53 141,83 120,85 85,67 75,10 23,97 9,30 4,20 794, ,22 16,79 55,42 79,67 134,18 137,62 108,53 123,19 70,64 38,63 11,76 4,67 786, ,02 25,34 44,93 115,23 106,20 126,42 149,74 117,24 50,13 34,80 10,21 3,46 789, ,07 22,33 61,31 75,21 137,06 141,97 138,02 111,96 52,42 31,74 8,93 2,99 791, ,25 27,29 60,84 100,44 115,26 109,97 128,39 92,56 50,61 31,03 7,87 4,62 735, ,60 24,98 73,74 91,24 138,95 157,82 152,86 115,58 59,26 28,86 7,87 2,78 860, ,99 18,33 57,16 91,64 135,38 177,19 100,93 94,68 54,65 32,04 10,57 4,28 782, ,46 12,67 53,90 101,62 180,26 136,57 158,54 116,05 68,46 28,82 11,71 4,88 878, ,96 19,26 46,38 100,17 127,54 186,28 115,87 82,93 46,31 36,23 10,05 4,98 782, ,02 29,12 39,86 86,58 171,54 159,40 124,77 93,84 79,25 33,90 13,21 5,39 846, ,20 21,89 47,93 91,64 109,61 109,48 126,83 101,06 45,87 26,26 9,92 3,75 700, ,75 16,13 44,66 94,34 154,26 153,72 117,68 98,12 49,59 33,69 9,20 4,71 783, ,10 27,51 84,40 88,04 114,68 130,04 453,76 Grand Total 311,67 979, , , , , , , , ,37 450,50 185, ,19 Average Solar Radiation per year 778,07 124
137 125
138 10.4 Appendix D PV Panel and Inverter Specifications 126
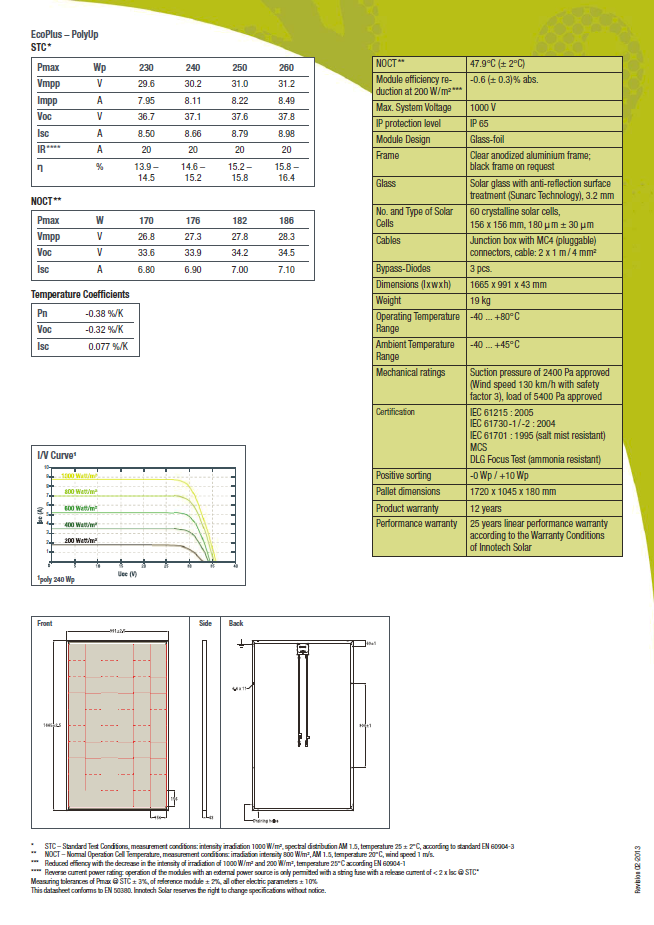
139 127
140 128

141 129
142 10.5 Appendix E PVsyst Reports 130
143 Minimum production Module Strings 131
144 132

145 133
146 134
147 135
148 136
149 Maximum Production Linear Shade 137

150 138
151 139

152 140
SAP 2012 IN A NUTSHELL
 SAP 2012 IN A NUTSHELL The consultation version of the SAP 2012 methodology was published by the Department of Energy and Climate Change (DECC) on January 4th 2012. This article from Dyfrig Hughes of National
Solar and Wind Energy for Greenhouses. A.J. Both 1 and Tom Manning 2
 Solar and Wind Energy for Greenhouses A.J. Both 1 and Tom Manning 2 1 Associate Extension Specialist 2 Project Engineer NJ Agricultural Experiment Station Rutgers University 20 Ag Extension Way New Brunswick,
BREEAM Refurbishment and Fit-out 2014 Briefings. Part of the BRE Trust
 BREEAM Refurbishment and Fit-out 2014 Briefings Part of the BRE Trust BREEAM for Refurbishment and Fit-out Follows 2 years of development Draft scheme published and consultation from 19 th July 2014 Launched
Using the sun to generate electricity
 Using the sun to generate electricity Image source: http://www.globalsolarcenter.com/files/2009/04/commercial-solar.jpg Solar panels information sheet What are the benefits? How does it work? What is the
Solar Power Frequently Asked Questions
 General information about solar power 1. How do I get solar power? Solar Power Frequently Asked Questions Many companies install solar power systems including some electricity retailers. It is worth comparing
PV THERMAL SYSTEMS - CAPTURING THE UNTAPPED ENERGY
 PV THERMAL SYSTEMS - CAPTURING THE UNTAPPED ENERGY John Hollick Conserval Engineering Inc. 200 Wildcat Road Toronto Ontario jhollick@solarwall.com ABSTRACT PV modules generate electricity, but the electrical
BREEAM Europe. This presentation aims to give the reader a general overview of the operational and technical aspects of BREEAM Europe.
 BREEAM Europe BREEAM Europe This presentation aims to give the reader a general overview of the operational and technical aspects of BREEAM Europe. Key objectives Provide consistency and comparability
CNMEC REC PROGRAM. The REC meter will be read monthly by CNMEC. Payment for RECs will be calculated using the monthly readings from the REC meter.
 CNMEC REC PROGRAM Renewable Energy Certificates (RECs) are tradable, non-tangible energy commodities that represent proof that 1 megawatt-hour (1000 kilowatt-hours) of electricity were generated from an
Climate and Energy Responsive Housing in Continental Climates. The Suitability of Passive Houses for Iran's Dry and Cold Climate. Farshad Nasrollahi
 Climate and Energy Responsive Housing in Continental Climates The Suitability of Passive Houses for Iran's Dry and Cold Climate Farshad Nasrollahi Table of Contents Abstract German Abstract Introduction
Consumer guide. be brighter. actewagl.com.au/solar solar@actewagl.com.au 13 14 93
 be brighter. Consumer guide. Your guide on how solar works, how much you can save on your electricity bills and how to choose the right provider and system for you. actewagl.com.au/solar solar@actewagl.com.au
Norwegian Tax Authority - Oslo Norway
 1. INTRODUCTION Norwegian Tax Authority - Oslo Norway PROJECT SUMMARY Year of construction - 1980 No previous energy renovations SPECIAL FEATURES Main topics in the renovation are: High insulated pre fabricated
PROTOCOL FOR BUILDING ENERGY ANALYSIS SOFTWARE For Class 3, 5, 6, 7, 8 and 9 buildings
 PROTOCOL FOR BUILDING ENERGY ANALYSIS SOFTWARE For Class 3, 5, 6, 7, 8 and 9 buildings Version 2006.1 AUSTRALIAN BUILDING CODES BOARD JANUARY 2006 TABLE OF CONTENTS Foreword 1. Scope 2. Purpose and context
FINANCIAL SUPPORT PROGRAMS
 9 FINANCIAL SUPPORT PROGRAMS 108 9 FINANCIAL SUPPORT PROGRAMS 9 FINANCIAL SUPPORT PROGRAMS There are a number of Government support mechanisms to help reduce the barriers to undertaking action on energy
Electricity from PV systems how does it work?
 Electricity from photovoltaic systems Bosch Solar Energy 2 Electricity from PV systems Electricity from PV systems how does it work? Photovoltaics: This is the name given to direct conversion of radiant
Lead architect: Ron Arad Architects - Executive architect: Jaspers & Eyers
 SOLUTIONS FOR SUSTAINABLE BUILDINGS THE GUIDE TO BREEAM Lead architect: Ron Arad Architects - Executive architect: Jaspers & Eyers Reynaers develops innovative and sustainable aluminium solutions, for
How to Earn the LEED Green Power Credit
 3D EG REES WH ITE PAPER How to Earn the LEED Green Power Credit Using on-site and off-site renewable energy to mitigate the impact of greenhouse gas emissions associated with a LEED project s energy use
Energy audit in Finland
 Energy audit in Finland NorTech Oulu Lauri Mikkonen Energy Audit in Finland An energy audit tells about the energy efficiency and total energy consumption in a building, including all consumed heating,
Photo Kirklees IS SOLAR ENERGY FOR ME? A guide to going solar
 Photo Kirklees IS SOLAR ENERGY FOR ME? A guide to going solar WHY SOLAR? Economics Solar energy can reduce bills, earn you money and protect you from rising energy prices. Solar is a free source of energy
Land East of Clitheroe Road Renewable Energy Statement
 Land East of Clitheroe Road Renewable Energy Statement Commercial Estates Group 6th December 2010 WSP Document Reference Renewable Energy Assessment QM Issue/revision Issue 1 Revision 1 Revision 2 Revision
Irradiance. Solar Fundamentals Solar power investment decision making
 Solar Fundamentals Solar power investment decision making Chilean Solar Resource Assessment Antofagasta and Santiago December 2010 Edward C. Kern, Jr., Ph.D., Inc. Global Solar Radiation Solar Power is
Response to the Energy White Paper Issues Paper PREPARED BY EMC ENGINEERING FOR THE AUSTRALIAN GOVERNMENT DEPARTMENT OF INDUSTRY
 Response to the Energy White Paper Issues Paper PREPARED BY EMC ENGINEERING FOR THE AUSTRALIAN GOVERNMENT DEPARTMENT OF INDUSTRY i P a g e www.energym adeclean.com CONTENTS
Gross/Active PV Surface Area: 13.094,40 / 13.086,29 m². Energy Produced by PV Array (AC):
:") 1x17 1x17 1x 8 x Trina Solar Trina TSM-PC5A 6 6 W 5 ; x Danfoss Solar Inverters TLX 1,5k 1,5kW Location: Arrondissement d'issoire Climate Data Record: Arrondissement d'issoire PV Output:.8, kwp Gross/Active
1x17 1x17 1x 8 x Trina Solar Trina TSM-PC5A 6 6 W 5 ; x Danfoss Solar Inverters TLX 1,5k 1,5kW Location: Arrondissement d'issoire Climate Data Record: Arrondissement d'issoire PV Output:.8, kwp Gross/Active
Technology Fact Sheet for Mitigation
 Technology Fact Sheet for Mitigation Solar PV systems (>1MW) i Technology: Solar PV systems (>1MW) Sector : Energy Subsector : Technology characteristics Introduction Solar photovoltaic, or simply photovoltaic
Application Note - How to Design a SolarEdge System Using PVsyst
 March 2015 Application Note - How to Design a SolarEdge System Using PVsyst As of version 5.20, PVsyst - the PV system design software - supports the design of SolarEdge systems. This application note
Solar technology. A guide to solar power at utility scale. in Africa
 Solar technology A guide to solar power at utility scale in Africa About solar power Solar electricity is generated using a free and abundant energy source the sun. In a single hour, the sun transmits
Energy'Saving,'Thermal'Comfort'and'Solar'Power'Information'Sheet'
 Energy'Saving,'Thermal'Comfort'and'Solar'Power'Information'Sheet' We ve prepared this information sheet to help you to minimise energy consumption and energy costs while maximising thermal comfort at home.
Towards low energy buildings the development of building regulations in Norway. Clara Good, Norut Narvik Oulu, 27 May 2011
 Towards low energy buildings the development of building regulations in Norway Clara Good, Norut Narvik Oulu, 27 May 2011 Presentation layout Norut Narvik Research Institute Background: buildings and energy
Solar Power HourSM. Solar educa on for your community.
 Solar Power HourSM Solar educa on for your community. 1 Contents About. 1 Commonly Asked Questions.. 2-3 The Solar Site Assessment.. 3-4 Selecting a Solar Installer. 5-7 Certified Installers by State.
Assessment Methods. 15 th November 2010 Huw Jenkins Simon Lannon
 Assessment Methods 15 th November 2010 Huw Jenkins Simon Lannon Assessment Methods Program Country Year Program Country Year 1 R-2000 Canada 1982 12 LEED US 2000 2 P-mark Sweden 1989 13 ECO-Quantum Netherlands
SA Power Networks Planning for Solar PV? Customer information guide to network connected solar PV inverter systems
 SA Power Networks Planning for Solar PV? Customer information guide to network connected solar PV inverter systems Contents Introduction 3 How solar PV power systems work 4 Solar modules 5 Is solar power
SOLAR PV SYSTEM INFORMATION PACK
 SOLAR PV SYSTEM INFORMATION PACK Apollo Solar the solar pv professionals If you are considering going green and earning money from solar energy, look no further than Apollo Solar we are fully qualified
ANALYSIS 2: Photovoltaic Glass Replacement
 ANALYSIS 2: Photovoltaic Glass Replacement Problem Identification Bridgeside II is designed to accommodate 80 percent lab space and 20 percent office space. Laboratory equipment can consume a considerable
Generating Current Electricity: Complete the following summary table for each way that electrical energy is generated. Pros:
 P a g e 1 Generating Current Electricity: Complete the following summary table for each way that electrical energy is generated. Generating Electrical Energy Using Moving Water: Hydro-Electric Generation
T E A C H E R S N O T E S
 T E A C H E R S N O T E S Focus: Students explore energy: its sources, forms, and transformations. Students also consider the benefits of energy-efficient technologies and energy conservation. Learning
DANISH DISTRICT ENERGY PLANNING EXPERIENCE
 MOWAT ENERGY, A RESEARCH HUB AT THE MOWAT CENTRE, AT THE REQUEST OF THE ONTARIO MINISTRY OF ENERGY FUTURE INNOVATION IN ENERGY PLANNING: A SPECIAL SESSION TO ADVISE ON ONTARIO S LONG-TERM ENERGY FUTURE
Solar systems provide a range of flexible heating
 f a c t s h e e t 7 Solar Power Production photo by Alex Nikada Why solar? Solar systems provide a range of flexible heating and electricity options and are particularly wellsuited to remote or off-grid
Energy Analysis for Internal and External Window Film Applications for Existing Homes in Florida
 Energy & Environmental Solutions Energy Analysis for Internal and External Window Film Applications for Existing Homes in Florida PREPARED FOR: INTERNATIONAL WINDOW FILM ASSOCIATION P.O. BOX 3871 MARTINSVILLE,
ENERGY PRODUCING SYSTEMS
 ENERGY PRODUCING SYSTEMS SOLAR POWER INTRODUCTION Energy from the sun falls on our planet on a daily basis. The warmth of the sun creates conditions on earth conducive to life. The weather patterns that
Solar urban planning. The National state of the art in Sweden
 Solar urban planning The National state of the art in Sweden Entity Lund University Developers Elisabeth Kjellsson Date 2009-11-15 1 INDICE Solar urban planning...1 1. Political, Legal and economic framework...3
Solar Energy Systems. Matt Aldeman Senior Energy Analyst Center for Renewable Energy Illinois State University
 Solar Energy Solar Energy Systems Matt Aldeman Senior Energy Analyst Center for Renewable Energy Illinois State University 1 SOLAR ENERGY OVERVIEW 1) Types of Solar Power Plants 2) Describing the Solar
Free electricity for your home, offices or factory with solar PV panels
 Free electricity for your home, offices or factory with solar PV panels Who we are Easy Being Green helps customers reduce their household s energy consumption by using energy saving products. Easy Easy
BAM CONSTRUCT. Dunsbury Hill Farm. BREEAM Pre-assessment Summary. BAM Sustainability department 2015
 BAM CONSTRUCT Dunsbury Hill Farm BREEAM Pre-assessment Summary BAM Sustainability department 2015 1.0 Introduction This report is intended as a summary of the pre-assessment for the following BREEAM assessment:
HARNESS. Utilising solar energy to save money
 HARNESS Utilising solar energy to save money Why consider solar? No control over ever rising electricity prices Electricity costs have doubled over the last 10 years* What will your electricity bill be
Achieving Net Zero. Bradley Berneche, President Alouette Homes. National Marketing Committee Canadian Home Builders Association Ottawa, June 6, 2008
 Achieving Net Zero Bradley Berneche, President Alouette Homes National Marketing Committee Canadian Home Builders Association Ottawa, June 6, 2008 Overview Who Is Alouette Homes? The EQuilibrium Initiative
Hybrid heat pumps. saving energy and reducing carbon emissions
 Hybrid heat pumps saving energy and reducing carbon emissions Bart Aspeslagh Product planning and new technology manager, Daikin Europe NV. aspeslagh.b@daikineurope.com Stefanie Debaets Design engineer,
Energy efficiency building standards in Japan
 www.asiabusinesscouncil.org Energy efficiency building standards in Japan Japan s regulation of building energy efficiency falls under the Energy Conservation Law that was first adopted in 1979. Subsequently
ENERGY STATEMENT for a proposed new residential care home at Great North Road, Doncaster, South Yorkshire, DN6 7EJ
 ENERGY STATEMENT for a proposed new residential care home at Great North Road, Doncaster, South Yorkshire, DN6 7EJ Ref. No: 12/02870/FULM Contents 1. General... 2 2. Planning Condition... 2 3. Development...
Activity 1: 2 butter cartons, scissors, cling film, thermometer, water, a sunny spot and a shady spot.
 Equipment: Activity 1: 2 butter cartons, scissors, cling film, thermometer, water, a sunny spot and a shady spot. Activity 2: 3 thermometers, black paper, white paper Suggested Class Level: 3rd 6th Preparation:
Dienstleistung. Certification as "Quality Approved Passive House" Criteria for Residential-Use Passive Houses
 Passiv Haus Institut Passivhaus Dienstleistung GmbH Dr. Wolfgang Feist Rheinstr. 44/46 Rheinstr. 44/46 D-64283 Darmstadt D-64283 Darmstadt www.passiv.de www.passivhaus-info.de Certification as "Quality
Impacts of large-scale solar and wind power production on the balance of the Swedish power system
 Impacts of large-scale solar and wind power production on the balance of the Swedish power system Joakim Widén 1,*, Magnus Åberg 1, Dag Henning 2 1 Department of Engineering Sciences, Uppsala University,
CLEAN ENERGY PROJECT ANALYSIS WITH RETSCREEN SOFTWARE
 Training Module SPEAKER S NOTES CLEAN ENERGY PROJECT ANALYSIS WITH RETSCREEN SOFTWARE CLEAN ENERGY PROJECT ANALYSIS COURSE This document provides a transcription of the oral presentation (Voice & Slides)
HHHHH Outstanding 85%
 Provinciehuis_Assessment_2040204_74,32%Final Score and Rating BREEAM Scheme: Europe 2009: Offices H Pass 30% Building Name: Provinciehuis Antwerpen HH Good 45% BREEAM Registration No.: BREEAM-0048-4626
Exemplary Retrofitting of an Old School in Stuttgart - EROS -
 Exemplary Retrofitting of an Old School in Stuttgart - EROS - City of Stuttgart, Summary The objective of the project was to demonstrate the potentials of a retrofitting process for a typical school in
RENEWABLE ENERGY INVESTMENTS
 RENEWABLE ENERGY INVESTMENTS FREQUENTLY ASKED QUESTIONS SOLAR PV What are photovoltaics (PV)? First used in about 1890, the word photovoltaic has two parts; photo derived from the Greek for light, and
Solar for Homeowners. Bear Valley Solar Initiative (BVSI) Laura Williams, Project Manager. February, 11 2015
 Laura Williams, Project Manager. February, 11 2015") Solar for Homeowners Bear Valley Solar Initiative (BVSI) February, 11 2015 Laura Williams, Project Manager Our Mission: Accelerate the transition to a sustainable world powered by clean energy CSE Disclaimer
Solar for Homeowners Bear Valley Solar Initiative (BVSI) February, 11 2015 Laura Williams, Project Manager Our Mission: Accelerate the transition to a sustainable world powered by clean energy CSE Disclaimer
SHELL HAUSWÄRME-STUDIE. Nachhaltige Wärmeerzeugung für Wohngebäude Fakten, Trends und Perspektiven
 1 Summary Shell Home Heating Study Shell has for decades now been using scenario techniques for research into the future. As a global energy company, Shell regularly publishes global longterm energy scenarios
GREEN EFFICIENT FRIENDLY SUSTAINABLE ENERGY: CERTIFICATED TRAINING
 GREEN EFFICIENT FRIENDLY SUSTAINABLE ENERGY: CERTIFICATED TRAINING Petroc is putting its energy into renewables and sustainable technologies. Are you? Petroc has developed Environmental Technologies CoVE
Directorate for the Built Environment Building Standards Division
 Directorate for the Built Environment Building Standards Division Energy Management Solutions Ltd Investigation of measures to improve the energy performance of a existing building: Retail JUNE 2009 Report
MICRO HYDRO FOR THE FARM AND HOME
 MICRO HYDRO FOR THE FARM AND HOME How much can I expect to save? This depends entirely on the available flow, available head (fall) and the duration that the flow is available. Some farms struggle to maintain
Value of Distributed Generation
 Value of Distributed Generation Solar PV in Rhode Island July 2015 Overview Distributed energy resources (DERs) like solar photovoltaic (solar PV) systems provide unique value to the electric grid by reducing
Running the Electric Meter Backwards: Real-Life Experience with a Residential Solar Power System
 Running the Electric Meter Backwards: Real-Life Experience with a Residential Solar Power System Brooks Martner Lafayette, Colorado University of Toledo Spring 2015 PHYS 4400 - Principles and Varieties
Executive Order amending the Executive Order on the Publication of the Danish Building Regulations 2010 (BR10) 1)
 1)") Full text Executive Order amending the Executive Order on the Publication of the Danish Building Regulations 2010 (BR10) 1) 1. The following amendments shall be made to Executive Order no. 810 of 28 June
Full text Executive Order amending the Executive Order on the Publication of the Danish Building Regulations 2010 (BR10) 1) 1. The following amendments shall be made to Executive Order no. 810 of 28 June
Integrated Low Carbon Heating Systems to Exceed Part L Efficiency Levels. Steve Cooper ESTA Energy Event 09
 Integrated Low Carbon Heating Systems to Exceed Part L Efficiency Levels Steve Cooper ESTA Energy Event 09 Integrated Heating Systems to Exceed Part L Efficiency Levels Why we don t always exploit the
GAS HEATING IN COMMERCIAL PREMISES
 ENERGY EFFICIENCY OFFICES GAS HEATING IN COMMERCIAL PREMISES www.energia.ie www.energia.ie Typically, energy reductions of 10% or more can be made easily through maintenance and low cost improvements.
Integrated Solar Radiant Systems
 Integrated Solar Radiant Systems William Shady PE President Topics Radiant heating Indoor air quality Radiant Cooling Project Photos Questions and answers The goal for our clients Healthy Comfort Why Radiant
Methodology for the production of Display Energy Certificates (DEC)
") Methodology for the production of Display Energy Certificates (DEC) February 2013 2 Contents Summary 3 Section 1 Introduction 4 Section 2 Scope 6 Section 3 Applicable Conventions 8 3.1 Basis for the DEC
Methodology for the production of Display Energy Certificates (DEC) February 2013 2 Contents Summary 3 Section 1 Introduction 4 Section 2 Scope 6 Section 3 Applicable Conventions 8 3.1 Basis for the DEC
Enough Solar Energy falls on New York in ONE DAY to power the state for ONE YEAR
 Enough Solar Energy falls on New York in ONE DAY to power the state for ONE YEAR Dr., physicist 1/19/2006 Solar Power to the People 1 3% of the State of New York s land area is covered with buildings and
SOLAR TECHNOLOGY CHRIS PRICE TECHNICAL SERVICES OFFICER BIMOSE TRIBAL COUNCIL
 SOLAR TECHNOLOGY CHRIS PRICE TECHNICAL SERVICES OFFICER BIMOSE TRIBAL COUNCIL SOLAR TECHNOLOGY Photovoltaics Funding Options Solar Thermal Photovoltaics 1. What are they and how do they work? 2. The Solar
Introduction to Energy Codes & Green Building Programs
 Introduction to Energy Codes & Green Building Programs David Neiger B.S. Arch, LEED AP Homes, Certified HERS Rater Principal Populus Sustainable Design Consulting Why green homes? The Building Sector:
CHP & ENVIRONMENTAL COMMODITIES: MARKET & POLICY UPDATE FOR MONETIZING RENEWABLE ENERGY CREDITS FROM CHP PROJECTS. Thomas Jacobsen October 2012
 CHP & ENVIRONMENTAL COMMODITIES: MARKET & POLICY UPDATE FOR MONETIZING RENEWABLE ENERGY CREDITS FROM CHP PROJECTS Thomas Jacobsen October 2012 ELEMENT MARKETS US Emissions House of the Year Launched in
Yield Reduction due to Shading:
 1x4 1x16 10 x CBC Energy A/S x Danfoss Solar Inverters CBC-40W Poly 40 W TLX 1,5k 5 ; 1x11 3x4 0 1,5kW 1536 x CBC Energy A/S 1 x Power-One CBC-40W Poly 40 W TRIO-7,6-TL-OUTD 30 ; 4x14 0 7,6kW Location:
Photovoltaic System Technology
 Photovoltaic System Technology Photovoltaic Cells What Does Photovoltaic Mean? Solar electricity is created using photovoltaic cells (or PV cells). The word photovoltaic is made up of two words: photo
Replacing Fuel With Solar Energy
 Replacing Fuel With Solar Energy Analysis by Michael Hauke, RSA Engineering January 22, 2009 The Right Place for Solar Energy Harvesting solar energy at South Pole can reduce the fuel consumption needed
DISTRIBUTED GENERATION AND ENERGY EFFICIENCY FOR ACHIEVING ENERGY SELF-SUSTAINING INDUSTRIAL AREAS
 DISTRIBUTED GENERATION AND ENERGY EFFICIENCY FOR ACHIEVING ENERGY SELF-SUSTAINING INDUSTRIAL AREAS Ing. Maria-Anna Segreto LAERTE Laboratory - 1 EUROPEAN DIRECTIVE 2010/31/UE It 's well known that higher
Value of Distributed Generation
 Value of Distributed Generation Solar PV in Massachusetts April 2015 Overview Distributed energy resources (DERs) like solar photovoltaic (solar PV) systems provide unique value to the electric grid by
Rainwater Harvesting
 Rainwater Harvesting With climate change now a reality rather than a speculated possibility, the demand on water resources has gone up, whilst the amount of water available for supply has gone down. Forth
RESEARCH HIGHLIGHT. Solar Energy Potential for the Northern Sustainable Houses
 RESEARCH HIGHLIGHT March 2015 Technical Series Solar Energy Potential for the orthern Sustainable Houses ITRODUCTIO Renewable energy technologies, such as solar photovoltaic (PV) or solar thermal systems,
Metering and Monitoring Service Packages Technical Supplement
 Metering and Monitoring Service Packages Technical Supplement Outline of Metering and Monitoring Service Package requirements for the domestic Renewable Heat Incentive 12 th July 2013 Department of Energy
Improving comfort and energy efficiency in a nursery school design process S. Ferrari, G. Masera, D. Dell Oro
 Improving comfort and energy efficiency in a nursery school design process S. Ferrari, G. Masera, D. Dell Oro Dept. Building Environment Science &Technologies Politecnico di Milano Italy Research funded
Clean State Energy Actions 2011 Update. connecticut
 Energy Efficiency Appliance/Equipment Efficiency Standards Building Energy Codes Utility Demand-Side-Management Utility Rate Realignment Energy Savings Targets/Energy Efficiency Resource Standards Public
Greenhouse Gas Implications of HVAC Upgrades in Multi-Unit Residential Buildings
 Greenhouse Gas Implications of HVAC Upgrades in Multi-Unit Residential Buildings J A NUARY 2015 INTRODUCTION This Research Report explores best practices and approaches for reducing greenhouse gas (GHG)
Top Technology for Industry, Agriculture, Business and Communities
 Top Technology for Industry, Agriculture, Business and Communities CHP The Technology with a Potential for Saving Energy Combined Heat and Power (CHP) is a highly efficient technology for the conversion
Today s Topic. Plano Solar Advocates. www.planosolar.org Non-profit grassroots volunteer group. North Texas Renewable Energy Group
 Today s Topic Rooftop Solar in Texas Right Place, Right Time! Plano Solar Advocates www.planosolar.org Non-profit grassroots volunteer group North Texas Renewable Energy Group www.ntreg.org Non-profit
3. Buying non-accredited green power from electricity retailer
 ATTACHMENT 1 Understanding Australia s Renewable Energy Market In Australia electricity customers have four options for neutralising the greenhouse emissions associated with their electricity use. These
Yukon Government Solar Energy Pilot: Performance Monitoring Yukon Government s Energy Solutions Centre. February 2014
 Yukon Government Solar Energy Pilot: Performance Monitoring Yukon Government s Energy Solutions Centre February 2014 Contents 1. Project Overview... 3 2. System Specifications... 3 2.1. Yukon Government
HOW TO CONDUCT ENERGY SAVINGS ANALYSIS IN A FACILITY VALUE ENGINEERING STUDY
 HOW TO CONDUCT ENERGY SAVINGS ANALYSIS IN A FACILITY VALUE ENGINEERING STUDY Benson Kwong, CVS, PE, CEM, LEED AP, CCE envergie consulting, LLC Biography Benson Kwong is an independent consultant providing
PERFORMANCE EVALUATION OF WATER-FLOW WINDOW GLAZING
 PERFORMANCE EVALUATION OF WATER-FLOW WINDOW GLAZING LI CHUNYING DOCTOR OF PHILOSOPHY CITY UNIVERSITY OF HONG KONG FEBRUARY 2012 CITY UNIVERSITY OF HONG KONG 香 港 城 市 大 學 Performance Evaluation of Water-flow
Code for Sustainable Homes Guidelines
 Canoldir Penrhos Anglesey LL65 2TS Phone: 01407 860666 Email: saps@easonline.co.uk www.easonline.co.uk Code for Sustainable Homes Guidelines A CSH rating is the responsibility of the Developer/ Architect
Wind and Solar Renewable Energy Applications
 Energy Tax Credits Wind and Solar Renewable Energy Applications AN ARRAY OF FEDERAL AND STATE TAX CREDITS have been structured to spur development of both established and emerging renewable energy sources.
Residential Solar Service Agreement (RSSA) Customer Sited Solar Photovoltaic Systems
 Customer Sited Solar Photovoltaic Systems") Residential Solar Service Agreement (RSSA) Customer Sited Solar Photovoltaic Systems This Agreement is made and entered into this day of, 20, ( Effective Date ) by and between the Orlando Utilities Commission
Residential Solar Service Agreement (RSSA) Customer Sited Solar Photovoltaic Systems This Agreement is made and entered into this day of, 20, ( Effective Date ) by and between the Orlando Utilities Commission
ENERGY EFFICIENT WINDOWS & DOORS A GUIDE TO THERMAL PERFORMANCE. www.rehau.co.uk. Building Solutions Automotive Industry
 ENERGY EFFICIENT WINDOWS & DOORS A GUIDE TO THERMAL PERFORMANCE www.rehau.co.uk Building Solutions Automotive Industry INTRODUCTION IMPROVING THE ENERGY EFFICIENCY OF WINDOWS AND DOORS Background Environmental
Domestic energy consumption in Barnet has reduced but remains higher than the British average:
 HOME ENERGY EFFICIENCY ACT (HECA) RETURN LB BARNET 31ST MARCH 2013 The following report sets out the energy conservation actions being or proposed to be taken by London Borough of Barnet that it considers
EFFICIENT EAST-WEST ORIENTATED PV SYSTEMS WITH ONE MPP TRACKER
 EFFICIENT EAST-WEST ORIENTATED PV SYSTEMS WITH ONE MPP TRACKER A willingness to install east-west orientated photovoltaic (PV) systems has lacked in the past. Nowadays, however, interest in installing
Distributed Energy Systems
 VTT TECHNICAL RESEARCH CENTRE OF FINLAND LTD Distributed Energy Systems Kari Sipilä, Principal Scientist VTT, Smart Energy Systems What is DESY DESY is R&D program for local energy systems covering the
Introduction to DEAP for Professionals DWELLING ENERGY ASSESSMENT PROCEDURE (DEAP)
") Introduction to DEAP for Professionals Introduction to DEAP for Professionals 1 DWELLING ENERGY ASSESSMENT PROCEDURE (DEAP) 2 Introduction to DEAP for Professionals Introduction to DEAP for Professionals
Introduction to DEAP for Professionals Introduction to DEAP for Professionals 1 DWELLING ENERGY ASSESSMENT PROCEDURE (DEAP) 2 Introduction to DEAP for Professionals Introduction to DEAP for Professionals
Energy Efficient HVAC-system and Building Design
 Energy Efficient HVAC-system and Building Design Maija Virta 1, Harri Itkonen 1, Panu Mustakallio 1, Risto Kosonen 1 1 Halton Oy, Finland Corresponding email: maija.virta@halton.com SUMMARY This paper
Report Date: 04/03/2014. Assessor: John Doyle Address: BLOCK K APT 108 SANDYFORD VIEW DUBLIN 18 BER: 106178106 MPRN: 10301589669
 Report Date: 04/03/2014 Assessor: John Doyle Address: BLOCK K APT 108 SANDYFORD VIEW DUBLIN 18 BER: 106178106 MPRN: 10301589669 About this Advisory Report Energy use in our homes is responsible for almost
Optimum Solar Orientation: Miami, Florida
 Optimum Solar Orientation: Miami, Florida The orientation of architecture in relation to the sun is likely the most significant connection that we can make to place in regards to energy efficiency. In
PHOTOVOLTAIC SYSTEM DESIGN AND INSTALLATION From the pre-feasibility study to the commissioning
 FEBRUARY, 2011 PHOTOVOLTAIC SYSTEM DESIGN AND INSTALLATION From the pre-feasibility study to the commissioning project@a-sunenergy.com www.a-sunenergy.com FEBRUARY, 2011 TABLE OF CONTENT PROJECT OVERVIEW
Islington Solar Panel Programme
 Islington Solar Panel Programme Frequently Ask Questions When will it take place? It will take place during the November and December 2011 and the first stage will be completed during December 2011. Why