Using HP ArcSight API for data visualization
|
|
|
- Gyles Anthony
- 8 years ago
- Views:
Transcription
1 Using HP ArcSight API for data visualization Eugene Afonin, Senior Sales Engineer #HPProtect

2 Some SIEMs have Google maps integrations could we do better? Do you have an app for that? Visualize data on your portal Plugging in open source tools for analytics

3 Some SIEMs have Google maps integrations could we do better? Do you have an app for that? Visualize data on your portal Plugging in open source tools for analytics

4 Features - layout Google Map Events radar Events details 5

5 Features - Google map Shows events distribution by priority on marker click Tooltip tells exact numbers Populated by events details from the clicked marker 6

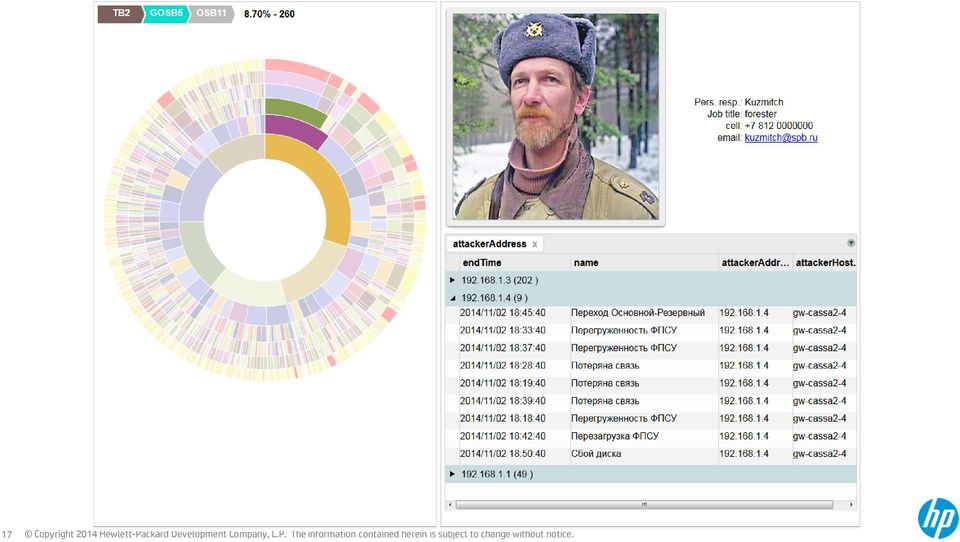
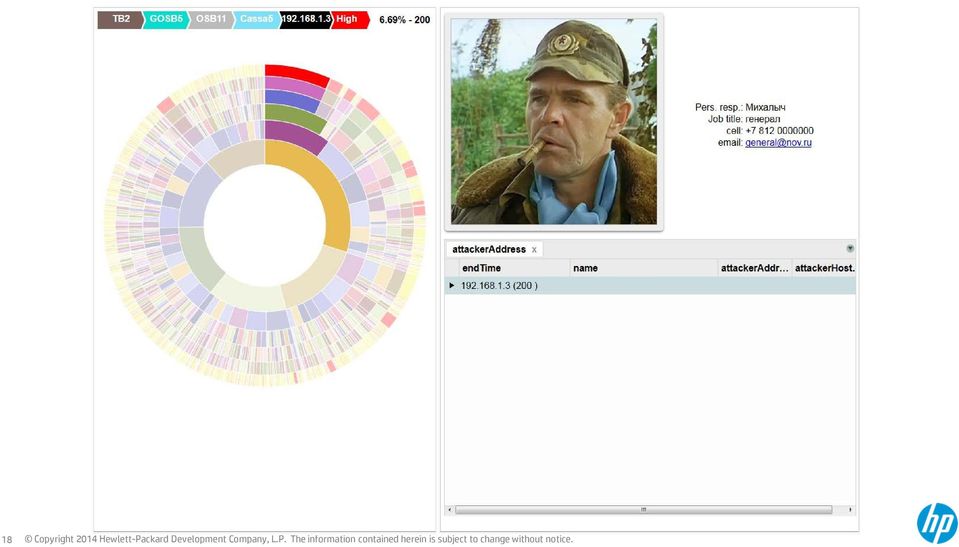
6 Features - radar Each bar represent one minute in the event flow Hover mouse to show tooltip Red high priority events, yellow medium and blue are low Click here to populate table with corresponding events 7

7 Features - table To group events just drag here any column header Multiple grouping is supported Events count is calculated automatically for each group level 8

8 Features - table (cont.) Click any column header to sort (asc/desc) Click to open/close search filter Type here or click any cell to filter on cells values 9

9 Features - clusters Markers combine or split up according to the map zoom level Zoom level 2 Zoom level 4 10

10 How it works 4 Logger search API call Logger Google API, Geo images Jscript code, Jscript & chart libraries 3 Search result in JSON * ArcSight ESM / Express High priority events Visualization web app ** Incoming events 11

11 APIs used HP ArcSight 12

12 Could be enhanced Add filter input field so the Logger search query could be customized, not hardcoded Add status window show applied filter, app events etc. Allow user to set data refresh interval Make regular background JSON calls to silently upload data from logger no need to page reload, hide search time lag from user Access rights Draw markers according to network model and show regional team details ( , phone, shift timetable etc.) Ability to cluster events by customized map regions Calculate statistics by region Show different regions on different map zoom levels according to BUs or SOC team 13 structure Copyright 2014 Hewlett-Packard Development Company, L.P. The information contained herein is subject to change without notice.
 Ability to cluster events by customized map regions Calculate statistics by region Show different regions on different map zoom levels according to BUs or SOC team 13 structure")
13 Some SIEMs have Google maps integrations could we do better? Do you have an app for that? Visualize data on your portal Plugging in open source tools for analytics

14 15

15 16

16 17
17 18
18 Some SIEMs have Google maps integrations could we do better? Do you have an app for that? Visualize data on your portal Plugging in open source tools for analytics

19 Gephi open graph viz platform Interactive visualization and exploration platform for all kinds of networks and complex systems, dynamic and hierarchical graphs. Runs on Windows, Linux and Mac OS X. Gephi is open-source and free. 20

20 HP ArcSight Interactive Discovery 21

21 HP ArcSight ESM / Express Bad: AV can t handle Good: one shot one kill 22
22 Gephi virus outbreak Bad: AV can t handle Bad: Region creep Good: one shot one kill 23
23 VIDEO STUB 24
24 For more information Attend these sessions TB3273, Practical Examples of Big Data, Security Analytics and Visualization TT3139, An introduction to HP ArcSight ESM web services APIs PN3578, Security analytics panel: Hunting bad guys After the event Download sources at: docs/doc Your feedback is important to us. Please take a few minutes to complete the session survey. 25
25 Please give me your feedback Session TT3161 Speaker Eugene Afonin Please fill out a survey. Hand it to the door monitor on your way out. Thank you for providing your feedback, which helps us enhance content for future events. 26
26 Thank you
27
Introduction to HP ArcSight ESM Web Services APIs
 Introduction to HP ArcSight ESM Web Services APIs Shivdev Kalambi Software Development Manager (Correlation Team) #HPProtect Agenda Overview Some applications of APIs ESM Web Services APIs Login Service
GETTING STARTED WITH COVALENT BROWSER
 GETTING STARTED WITH COVALENT BROWSER Contents Getting Started with Covalent Browser... 1 What is the Browser Version?... 4 Logging in... 5 The URL address... 5 Home page... 5 Menu bar... 5 Go To button...
Medicare Data Portal. Quick Start Guide
 Medicare Data Portal Quick Start Guide 1 P age Background HealthLandscape (a division of the American Academy of Family Physicians [AAFP]) and the Robert Graham Center for Policy Studies in Family Medicine
A Tutorial on dynamic networks. By Clement Levallois, Erasmus University Rotterdam
 A Tutorial on dynamic networks By, Erasmus University Rotterdam V 1.0-2013 Bio notes Education in economics, management, history of science (Ph.D.) Since 2008, turned to digital methods for research. data
DIGIMobile V2 User Manual
 DIGIMobile V2 User Manual Information in this document is subject to change without notice. 2014 Copyright, DIGIEVER Corporation. All rights reserve 1 Table of Contents CHAPTER1. OVERVIEW... 1 CHAPTER2.
VMware vcenter Operations Manager Administration Guide
 VMware vcenter Operations Manager Administration Guide Custom User Interface vcenter Operations Manager 5.6 This document supports the version of each product listed and supports all subsequent versions
SnapTrends v2.6. User Guide. www.snaptrends.com
 SnapTrends v2.6 User Guide www.snaptrends.com ABSTRACT The purpose of this document is to share best practices & describe the process for using the SnapTrends Location Based Social Listening Service STV042013
User s manual 1. Introduction 2. Installation & Requirements 3. Your Tom s Planner account & login 4. Open & Save 5. Grid 6. Blue timeline 7.
 User s manual 1. Introduction 3 2. Installation & Requirements 3 3. Your Tom s Planner account & login 4 4. Open & Save 4 5. Grid 6 Rows and groups 6 Columns 7 Time blocks 10 Icons 10 Comments 11 Dependencies
Information Literacy Program
 Information Literacy Program Excel (2013) Advanced Charts 2015 ANU Library anulib.anu.edu.au/training ilp@anu.edu.au Table of Contents Excel (2013) Advanced Charts Overview of charts... 1 Create a chart...
Creating a Network Graph with Gephi
 Creating a Network Graph with Gephi Gephi is a powerful tool for network analysis, but it can be intimidating. It has a lot of tools for statistical analysis of network data most of which you won't be
MicroStrategy Desktop
 MicroStrategy Desktop Quick Start Guide MicroStrategy Desktop is designed to enable business professionals like you to explore data, simply and without needing direct support from IT. 1 Import data from
A) What Web Browser do I need? B) Why I cannot view the most updated content? C) What can we find on the school website? Index Page Layout:
 What Web Browser do I need? B) Why I cannot view the most updated content? C) What can we find on the school website? Index Page Layout:") A) What Web Browser do I need? - Window 7 / Window 8.1 => Internet Explorer Version 9 or above (Best in Version 11+) Download Link: http://windows.microsoft.com/zh-hk/internet-explorer/download-ie - Window
A) What Web Browser do I need? - Window 7 / Window 8.1 => Internet Explorer Version 9 or above (Best in Version 11+) Download Link: http://windows.microsoft.com/zh-hk/internet-explorer/download-ie - Window
Accountable Care Organization Quality Explorer. Quick Start Guide
 Accountable Care Organization Quality Explorer Quick Start Guide 1 P age Background HealthLandscape (a division of the American Academy of Family Physicians [AAFP]) and the Robert Graham Center for Policy
TIBCO Spotfire Business Author Essentials Quick Reference Guide. Table of contents:
 Table of contents: Access Data for Analysis Data file types Format assumptions Data from Excel Information links Add multiple data tables Create & Interpret Visualizations Table Pie Chart Cross Table Treemap
Performance Monitor. Intellicus Web-based Reporting Suite Version 4.5. Enterprise Professional Smart Developer Smart Viewer
 Performance Monitor Intellicus Web-based Reporting Suite Version 4.5 Enterprise Professional Smart Developer Smart Viewer Intellicus Technologies info@intellicus.com www.intellicus.com Copyright 2009 Intellicus
Introduction... 1 Welcome Screen... 2 Map View... 3. Generating a map... 3. Map View... 4. Basic Map Features... 4
 Quick Start Guide Contents Introduction... 1 Welcome Screen... 2 Map View... 3 Generating a map... 3 Map View... 4 Basic Map Features... 4 Adding a Secondary Indicator... 5 Adding a Secondary Indicator...
City of St. Petersburg, Florida Fiscal & Budget Transparency Tool User Guide. Last Updated: March 2015
 City of St. Petersburg, Florida Fiscal & Budget Transparency Tool User Guide Last Updated: March 2015 St. Petersburg s Fiscal and Budget Transparency Tool allows you to explore budget and historical finances
Creating Pivot Tables
 Creating Pivot Tables Example Using CIA Inspection Information This is a step by step guide of how to create pivot tables using Microsoft Excel. You can create a pivot tables from any database you have
ATLAS.ti for Mac OS X Getting Started
 ATLAS.ti for Mac OS X Getting Started 2 ATLAS.ti for Mac OS X Getting Started Copyright 2014 by ATLAS.ti Scientific Software Development GmbH, Berlin. All rights reserved. Manual Version: 5.20140918. Updated
DROOMS DATA ROOM USER GUIDE. www.drooms.com
 USER GUIDE www.drooms.com USER GUIDE Dear User, Whether simply reviewing documentation, sending queries during the due diligence process or administering a data room yourself, Drooms is the software solution
VMware vcenter Operations Manager Enterprise Administration Guide
 VMware vcenter Operations Manager Enterprise Administration Guide vcenter Operations Manager Enterprise 5.0 This document supports the version of each product listed and supports all subsequent versions
HP ArcSight SIEM and data privacy best practices
 HP ArcSight SIEM and data privacy best practices Jeff Northrop, CTO International Association of Privacy Professionals jeff@jnorthrop.me Frank Lange, Dipl.-Winf., CISSP, CEH ArcSight Security Architect
Getting started with OneDrive
 Getting started with OneDrive What is OneDrive? OneDrive is an online storage area intended for business purposes. Your OneDrive library is managed by the University. You can use it to share documents
BusinessObjects Enterprise InfoView User's Guide
 BusinessObjects Enterprise InfoView User's Guide BusinessObjects Enterprise XI 3.1 Copyright 2009 SAP BusinessObjects. All rights reserved. SAP BusinessObjects and its logos, BusinessObjects, Crystal Reports,
How To Use Textbuster On Android (For Free) On A Cell Phone
 On A Cell Phone") www.textbuster.com 1 Applications and Account Manager Dashboard User Guide For Android phones www.textbuster.com 2 Downloading the TextBuster applications After the TextBuster device is installed into
www.textbuster.com 1 Applications and Account Manager Dashboard User Guide For Android phones www.textbuster.com 2 Downloading the TextBuster applications After the TextBuster device is installed into
Association of Public Data Users Annual Conference September 21, 2011
 Data Visualization in the NEW American FactFinder Association of Public Data Users Annual Conference September 21, 2011 After viewing this presentation, you will be able to: 1. Create a Reference Map 2.
SAS BI Dashboard 4.4. User's Guide Second Edition. SAS Documentation
 SAS BI Dashboard 4.4 User's Guide Second Edition SAS Documentation The correct bibliographic citation for this manual is as follows: SAS Institute Inc. 2013. SAS BI Dashboard 4.4: User's Guide, Second
5.7. Quick Guide to Fusion Pro Schedule
 5.7 Quick Guide to Fusion Pro Schedule Quick Guide to Fusion Pro Schedule Fusion 5.7 This publication may not be reproduced, in whole or in part, in any form or by any electronic, manual, or other method
TIBCO Spotfire Web Player Release Notes
 Software Release 7.0 February 2015 Two-Second Advantage 2 Important Information SOME TIBCO SOFTWARE EMBEDS OR BUNDLES OTHER TIBCO SOFTWARE. USE OF SUCH EMBEDDED OR BUNDLED TIBCO SOFTWARE IS SOLELY TO ENABLE
Blackboard Collaborate Classroom in Desire2Learn. Presenters
 Blackboard Collaborate Classroom in Desire2Learn Presenters Copyright 2014 Information Technology Services Kennesaw State University This document may be downloaded, printed, or copied, for educational
ZOINED RETAIL ANALYTICS. User Guide
 ZOINED RETAIL ANALYTICS User Guide Contents Using the portal New user Profile Email reports Portal use Dashboard Drilling down into the data Filter options Analytics Managing analysis Saving the analysis
Pure1 Manage User Guide
 User Guide 11/2015 Contents Overview... 2 Pure1 Manage Navigation... 3 Pure1 Manage - Arrays Page... 5 Card View... 5 Expanded Card View... 7 List View... 10 Pure1 Manage Replication Page... 11 Pure1
Excel Intermediate Session 2: Charts and Tables
 Excel Intermediate Session 2: Charts and Tables Agenda 1. Introduction (10 minutes) 2. Tables and Ranges (5 minutes) 3. The Report Part 1: Creating and Manipulating Tables (45 min) 4. Charts and other
Microsoft Access 2010 handout
 Microsoft Access 2010 handout Access 2010 is a relational database program you can use to create and manage large quantities of data. You can use Access to manage anything from a home inventory to a giant
Bulk Upload Tool (Beta) - Quick Start Guide 1. Facebook Ads. Bulk Upload Quick Start Guide
 - Quick Start Guide 1. Facebook Ads. Bulk Upload Quick Start Guide") Bulk Upload Tool (Beta) - Quick Start Guide 1 Facebook Ads Bulk Upload Quick Start Guide Last updated: February 19, 2010 Bulk Upload Tool (Beta) - Quick Start Guide 2 Introduction The Facebook Ads Bulk
Bulk Upload Tool (Beta) - Quick Start Guide 1 Facebook Ads Bulk Upload Quick Start Guide Last updated: February 19, 2010 Bulk Upload Tool (Beta) - Quick Start Guide 2 Introduction The Facebook Ads Bulk
InfoView User s Guide. BusinessObjects Enterprise XI Release 2
 BusinessObjects Enterprise XI Release 2 InfoView User s Guide BusinessObjects Enterprise XI Release 2 Patents Trademarks Copyright Third-party contributors Business Objects owns the following U.S. patents,
NaviCell Data Visualization Python API
 NaviCell Data Visualization Python API Tutorial - Version 1.0 The NaviCell Data Visualization Python API is a Python module that let computational biologists write programs to interact with the molecular
OECD.Stat Web Browser User Guide
 OECD.Stat Web Browser User Guide May 2013 May 2013 1 p.10 Search by keyword across themes and datasets p.31 View and save combined queries p.11 Customise dimensions: select variables, change table layout;
Gephi Tutorial Quick Start
 Gephi Tutorial Welcome to this introduction tutorial. It will guide you to the basic steps of network visualization and manipulation in Gephi. Gephi version 0.7alpha2 was used to do this tutorial. Get
Enterprise Data Visualization and BI Dashboard
 Strengths Key Features and Benefits Ad-hoc Visualization and Data Discovery Prototyping Mockups Dashboards The application is web based and can be installed on any windows or linux server. There is no
Virto SharePoint Gantt Chart App for Office 365 Release 1.0.3. User and Installation Guide
 Virto SharePoint Gantt Chart App for Office 365 Release 1.0.3 User and Installation Guide 2 Table of Contents OVERVIEW... 3 FEATURES LIST... 3 SYSTEM/DEVELOPER REQUIREMENTS... 3 OPERATING SYSTEM... 3 SERVER...
Lightworks v12. Quick Start Guide
 Lightworks v12 Quick Start Guide Lightworks v12 Copyright and Disclaimer Copyright 2014 by EditShare This document, as well as any software described in it, is furnished under either a license or a confidentiality
This document describes the capabilities of NEXT Analytics v5.1 to retrieve data from Google Analytics directly into your spreadsheet file.
 NEXT Google Analytics User Guide This document describes the capabilities of NEXT Analytics v5.1 to retrieve data from Google Analytics directly into your spreadsheet file. Table of Contents Adding a Google
Teacher Activities Page Directions
 Teacher Activities Page Directions The Teacher Activities Page provides teachers with access to student data that is protected by the federal Family Educational Rights and Privacy Act (FERPA). Teachers
Create Cool Lumira Visualization Extensions with SAP Web IDE Dong Pan SAP PM and RIG Analytics Henry Kam Senior Product Manager, Developer Ecosystem
 Create Cool Lumira Visualization Extensions with SAP Web IDE Dong Pan SAP PM and RIG Analytics Henry Kam Senior Product Manager, Developer Ecosystem 2015 SAP SE or an SAP affiliate company. All rights
Getting Started Guide. January 19, 2014
 Getting Started Guide January 19, 2014 User Guide Chapters 1. Scheduling Meetings Configuring Meeting Details Advanced Options Invitation Email, received by the Participants Invitation Email, sent to the
Spotfire v6 New Features. TIBCO Spotfire Delta Training Jumpstart
 Spotfire v6 New Features TIBCO Spotfire Delta Training Jumpstart Map charts New map chart Layers control Navigation control Interaction mode control Scale Web map Creating a map chart Layers are added
What s New in JReport 13.1
 Highlights JReport 13.1 focuses on new geographical tools for data visualization, enhanced data analysis and presentation in dashboards and reports, as well as greater performance and scalability when
United States Department of Agriculture (USDA) Agricultural Marketing Service (AMS) Livestock and Grain Market News (LGMN)
 Agricultural Marketing Service (AMS) Livestock and Grain Market News (LGMN)") United States Department of Agriculture (USDA) Agricultural Marketing Service (AMS) Livestock and Grain Market News (LGMN) Livestock Mandatory Reporting (LMR) Dashboard Users Guide Version 3.0 / 11 May
United States Department of Agriculture (USDA) Agricultural Marketing Service (AMS) Livestock and Grain Market News (LGMN) Livestock Mandatory Reporting (LMR) Dashboard Users Guide Version 3.0 / 11 May
Getting Started Guide
 Getting Started Guide User Guide Chapters 1. Scheduling Meetings Configuring Meeting Details Advanced Options Invitation Email, received by the Participants Invitation Email, sent to the Moderator (scheduler)
SolarEdge Monitoring Portal. User Guide 1.1. Table of Contents
 Table of Contents Table of Contents... 2 About This Guide... 3 Support and Contact Information... 4 Chapter 1 - Introducing the SolarEdge Monitoring Portal... 5 Chapter 2 - Using the SolarEdge Monitoring
應 用 SIEM 偵 測 與 預 防 APT 緩 攻 擊
 應 用 SIEM 偵 測 與 預 防 APT 緩 攻 擊 HP Enterprise Security 林 傳 凱 (C. K. Lin) Senior Channel PreSales, North Asia HP ArcSight, Enterprise Security 1 Rise Of The Cyber Threat Enterprises and Governments are experiencing
Sign in. Select Search Committee View
 Applicant Tracking for Search Committees Thank you for agreeing to serve on a search committee at Youngstown State University. The following information will enable you to utilize our online applicant
Create an Excel BI report and share on SharePoint 2013
 2013 Create an Excel BI report and share on SharePoint 2013 Hands-On Lab Lab Manual This document is provided as-is. Information and views expressed in this document, including URL and other Internet Web
INNOVOLT MANAGEMENT CLOUD USER GUIDE
 INNOVOLT MANAGEMENT CLOUD USER GUIDE CONTENTS Introduction... 3 Overview of Innovolt Solution... 3 Getting Started... 4 Create an Account... 4 Sign in... 4 Retrieve Password... 4 Home Page Overview...
Scientific Graphing in Excel 2010
 Scientific Graphing in Excel 2010 When you start Excel, you will see the screen below. Various parts of the display are labelled in red, with arrows, to define the terms used in the remainder of this overview.
Table of Contents. Table of Contents
 Table of Contents Table of Contents Table of Contents... 2 About This Guide... 3 Support and Contact Information... 4 Chapter 1 - Introducing the SolarEdge Monitoring Portal... 5 Chapter 2 - Using the
The Portal. Quick Start Guide
 The Portal Quick Start Guide Quick Start Guide The Portal Confidential to CoreLogic The recipient of this document agrees that at all times and notwithstanding any other agreement or understanding, it
ClickView Digital Signage User Manual
 ClickView Digital Signage User Manual Table of Contents 1. What is ClickView Digital Signage?... 3 2. Where do I find ClickView Digital Signage?... 3 2.1. To find ClickView Digital Signage... 3 3. How
Ofgem Carbon Savings Community Obligation (CSCO) Eligibility System
 Eligibility System") Ofgem Carbon Savings Community Obligation (CSCO) Eligibility System User Guide 2015 Page 1 Table of Contents Carbon Savings Community Obligation... 3 Carbon Savings Community Obligation (CSCO) System...
Ofgem Carbon Savings Community Obligation (CSCO) Eligibility System User Guide 2015 Page 1 Table of Contents Carbon Savings Community Obligation... 3 Carbon Savings Community Obligation (CSCO) System...
Heat Map Explorer Getting Started Guide
 You have made a smart decision in choosing Lab Escape s Heat Map Explorer. Over the next 30 minutes this guide will show you how to analyze your data visually. Your investment in learning to leverage heat
Visualization with Excel Tools and Microsoft Azure
 Visualization with Excel Tools and Microsoft Azure Introduction Power Query and Power Map are add-ins that are available as free downloads from Microsoft to enhance the data access and data visualization
Property Portfolio Reporting. Property Portfolio Reporting. User Guide. User Guide. Property Portfolio Reporting
 Property Portfolio Reporting User Guide User Guide Property Portfolio Reporting 1 Contents Introduction... 3 Navigation... 3 Login... 3 Accessing Home Page... 4 Dashboard Filters... 5 Portfolio Performance
NYC Common Online Charter School Application
 NYC Common Online Charter School Application Admin Guide In this guide, you will find information about the following features: How to log in How to view or export basic data 1. Application index How to
User Guide. Analytics Desktop Document Number: 09619414
 User Guide Analytics Desktop Document Number: 09619414 CONTENTS Guide Overview Description of this guide... ix What s new in this guide...x 1. Getting Started with Analytics Desktop Introduction... 1
Communicator for Mac Help
 Communicator for Mac Help About the ShoreTel Communicator Introduction to the ShoreTel Communicator for Mac ShoreTel Communicator elements Learn about the window layout, panels, icons, buttons and notifications
What is OneDrive for Business at University of Greenwich? Accessing OneDrive from Office 365
 This guide explains how to access and use the OneDrive for Business cloud based storage system and Microsoft Office Online suite of products via a web browser. What is OneDrive for Business at University
Exploratory Spatial Data Analysis
 Exploratory Spatial Data Analysis Part II Dynamically Linked Views 1 Contents Introduction: why to use non-cartographic data displays Display linking by object highlighting Dynamic Query Object classification
Sharperlight Web Interface
 Sharperlight Web Interface www.sharperlight.com info@sharperlight.com Sharperlight Web Interface Published by philight Software International Pty Ltd All other copyrights and trademarks are the property
Navigate to the web address: https://www.hertsdirect.org/ faultreporting/ You should be presented with the page shown here.
 Navigate to the web address: https://www.hertsdirect.org/ faultreporting/ You should be presented with the page shown here. In the large green area to the middle of the page, type in the road name you
Abstract. For notes detailing the changes in each release, see the MySQL for Excel Release Notes. For legal information, see the Legal Notices.
 MySQL for Excel Abstract This is the MySQL for Excel Reference Manual. It documents MySQL for Excel 1.3 through 1.3.6. Much of the documentation also applies to the previous 1.2 series. For notes detailing
Using BlueHornet Statistics Sent Message Reporting Message Summary Section Advanced Reporting Basics Delivery Tab
 Using BlueHornet Statistics BlueHornet provides a feature that allows message senders to gage the effectiveness of their messages by reporting message statistics that are tracked by the system. For quick
Call Logging Quick Reference User Guide
 Call Logging provides companywide call records, comparison and analytical tools for tracking and improving the efficiency and effectiveness of business communications. An intuitive, feature rich interface
WEBTrader. User Guide
 WEBTrader User Guide Table of Contents Creating a Demo account How to log in Main Areas of the WebTrader Market Watch Favorites Adding Favorites Spot Panes Charts Adding New Chart Using Charts Chart Options
Verizon Cloud Desktop Application Help Guide Version 4.1 72
 Verizon Cloud Desktop Application Help Guide Version 4.1 72 CONTENTS I. Getting started... 4 A. Verizon Cloud... 4 B. Main navigation... 5 C. System requirements... 5 D. Installing the application... 6
WhatsVirtual for WhatsUp Gold v16.0 User Guide
 WhatsVirtual for WhatsUp Gold v16.0 User Guide Contents Welcome Welcome to WhatsVirtual... 1 Using WhatsVirtual Discovering virtual devices... 2 Viewing discovery output... 4 Manage and monitor virtual
GreenLight Web Quick Guide - Host
 This guide provides the basic information necessary to create, start, and host a GreenLight Web conference. Call (800) 839-9976 if we can be of any assistance. Thank you for using GreenLight Collaboration!
Web Dashboard User Guide
 Web Dashboard User Guide Version 10.2 The software supplied with this document is the property of RadView Software and is furnished under a licensing agreement. Neither the software nor this document may
USING THE UPSTREAM-CONNECT WEBSITE
 USING THE UPSTREAM-CONNECT WEBSITE The UpstreamConnect website is your primary means for viewing imaging device data and reports. This manual covers all aspects of using the UpstreamConnect website. HELPDESK
Frog VLE Update. Latest Features and Enhancements. September 2014
 1 Frog VLE Update Latest Features and Enhancements September 2014 2 Frog VLE Update: September 2014 Contents New Features Overview... 1 Enhancements Overview... 2 New Features... 3 Site Backgrounds...
GETTING STARTED ON BLOOMBERG LAUNCHPAD
 USER GUIDE A Bloomberg Professional Service Offering GETTING STARTED ON BLOOMBERG LAUNCHPAD Start your day with the most powerful and flexible desktop workspace available for financial professionals. CONTENTS
Stock Rover is a powerful platform for finding, comparing, and tracking stocks, ETFs, and funds.
 Stock Rover is a powerful platform for finding, comparing, and tracking stocks, ETFs, and funds. It streamlines the stock research process in a highly interactive and customizable user interface (UI).
Google Drive: Access and organize your files
 Google Drive: Access and organize your files Use Google Drive to store and access your files, folders, and Google Docs, Sheets, and Slides anywhere. Change a file on the web, your computer, tablet, or
HP Storage Essentials Storage Resource Management Report Optimizer Software 6.0. Building Reports Using the Web Intelligence Java Report Panel
 HP Storage Essentials Storage Resource Management Report Optimizer Software 6.0 Building Reports Using the Web Intelligence Java Report Panel First edition: July 2008 Legal and notice information Copyright
How to access some of the frameworki reports to help manage workload
 How to access some of the frameworki reports to help manage workload To access the standard reports within frameworki: Click on Reports >> Reports Library This will open the Report Treeview. The path to
BI 4.1 Quick Start Java User s Guide
 BI 4.1 Quick Start Java User s Guide BI 4.1 Quick Start Guide... 1 Introduction... 4 Logging in... 4 Home Screen... 5 Documents... 6 Preferences... 8 Web Intelligence... 12 Create a New Web Intelligence
LoadRunner and Performance Center v11.52 Technical Awareness Webinar Training
 LoadRunner and Performance Center v11.52 Technical Awareness Webinar Training Tony Wong 1 Copyright Copyright 2012 2012 Hewlett-Packard Development Development Company, Company, L.P. The L.P. information
IRA Pivot Table Review and Using Analyze to Modify Reports. For help, email Financial.Reports@dartmouth.edu
 IRA Pivot Table Review and Using Analyze to Modify Reports 1 What is a Pivot Table? A pivot table takes rows of detailed data (such as the lines in a downloadable table) and summarizes them at a higher
Importing TSM Data into Microsoft Excel using Microsoft Query
 Importing TSM Data into Microsoft Excel using Microsoft Query An alternate way to report on TSM information is to use Microsoft Excel s import facilities using Microsoft Query to selectively import the
OpenText Information Hub (ihub) 3.1 and 3.1.1
 3.1 and 3.1.1") OpenText Information Hub (ihub) 3.1 and 3.1.1 OpenText Information Hub (ihub) 3.1.1 meets the growing demand for analytics-powered applications that deliver data and empower employees and customers to
OpenText Information Hub (ihub) 3.1 and 3.1.1 OpenText Information Hub (ihub) 3.1.1 meets the growing demand for analytics-powered applications that deliver data and empower employees and customers to
JustClust User Manual
 JustClust User Manual Contents 1. Installing JustClust 2. Running JustClust 3. Basic Usage of JustClust 3.1. Creating a Network 3.2. Clustering a Network 3.3. Applying a Layout 3.4. Saving and Loading
Teradata SQL Assistant Version 13.0 (.Net) Enhancements and Differences. Mike Dempsey
 Enhancements and Differences. Mike Dempsey") Teradata SQL Assistant Version 13.0 (.Net) Enhancements and Differences by Mike Dempsey Overview SQL Assistant 13.0 is an entirely new application that has been re-designed from the ground up. It has been
Teradata SQL Assistant Version 13.0 (.Net) Enhancements and Differences by Mike Dempsey Overview SQL Assistant 13.0 is an entirely new application that has been re-designed from the ground up. It has been
SAP Business Intelligence (BI) Reporting Training for MM. General Navigation. Rick Heckman PASSHE 1/31/2012
 Reporting Training for MM. General Navigation. Rick Heckman PASSHE 1/31/2012") 2012 SAP Business Intelligence (BI) Reporting Training for MM General Navigation Rick Heckman PASSHE 1/31/2012 Page 1 Contents Types of MM BI Reports... 4 Portal Access... 5 Variable Entry Screen... 5
2012 SAP Business Intelligence (BI) Reporting Training for MM General Navigation Rick Heckman PASSHE 1/31/2012 Page 1 Contents Types of MM BI Reports... 4 Portal Access... 5 Variable Entry Screen... 5
BI 4.1 Quick Start Guide
 BI 4.1 Quick Start Guide BI 4.1 Quick Start Guide... 1 Introduction... 4 Logging in... 4 Home Screen... 5 Documents... 6 Preferences... 8 Setting Up Preferences to Display Public Folders... 10 Web Intelligence...
Transaction Monitoring Version 8.1.3 for AIX, Linux, and Windows. Reference IBM
 Transaction Monitoring Version 8.1.3 for AIX, Linux, and Windows Reference IBM Note Before using this information and the product it supports, read the information in Notices. This edition applies to V8.1.3
Visualization Quick Guide
 Visualization Quick Guide A best practice guide to help you find the right visualization for your data WHAT IS DOMO? Domo is a new form of business intelligence (BI) unlike anything before an executive
Google Docs Basics Website: http://etc.usf.edu/te/
 Website: http://etc.usf.edu/te/ Google Docs is a free web-based office suite that allows you to store documents online so you can access them from any computer with an internet connection. With Google
Visualizing the Top 400 Universities
 Int'l Conf. e-learning, e-bus., EIS, and e-gov. EEE'15 81 Visualizing the Top 400 Universities Salwa Aljehane 1, Reem Alshahrani 1, and Maha Thafar 1 saljehan@kent.edu, ralshahr@kent.edu, mthafar@kent.edu
Table Of Contents: I. MapifyPro: Installation. II. General Overview & License Activation. III. Map Settings. IV. Map Location Settings. V.
 Table Of Contents: I. MapifyPro: Installation II. General Overview & License Activation III. Map Settings IV. Map Location Settings V. Map Tags VI. Batch Upload VII. MapifyPro Settings VIII. Adding a Blog
Aeries.net Teacher Portal User Documentation July 31, 2015. 1. Access Teacher Portal. 2. Utilizing the Navigation Tree
 Aeries.net Teacher Portal User Documentation July 31, 2015 1. Access Teacher Portal 2. Utilizing the Navigation Tree 3. Attendance Attendance Add/Dropped Students ** SSA (Safe Schools Act) Attendance Notes